Climate Science Glossary

Term Lookup

Enter a term in the search box to find its definition.

Settings

Use the controls in the far right panel to increase or decrease the number of terms automatically displayed (or to completely turn that feature off).

Term Lookup

Settings


All IPCC definitions taken from Climate Change 2007: The Physical Science Basis. Working Group I Contribution to the Fourth Assessment Report of the Intergovernmental Panel on Climate Change, Annex I, Glossary, pp. 941-954. Cambridge University Press.

Home Arguments Software Resources Comments The Consensus Project Translations About Support

Bluesky Facebook LinkedIn Mastodon MeWe

Twitter YouTube RSS Posts RSS Comments Email Subscribe


Climate's changed before
It's the sun
It's not bad
There is no consensus
It's cooling
Models are unreliable
Temp record is unreliable
Animals and plants can adapt
It hasn't warmed since 1998
Antarctica is gaining ice
View All Arguments...


Username
Password
New? Register here
Forgot your password?

Latest Posts

Archives

How reliable are climate models?

What the science says...

Select a level... Basic Intermediate

Models successfully reproduce temperatures since 1900 globally, by land, in the air and the ocean.

Climate Myth...

Models are unreliable

"[Models] are full of fudge factors that are fitted to the existing climate, so the models more or less agree with the observed data. But there is no reason to believe that the same fudge factors would give the right behaviour in a world with different chemistry, for example in a world with increased CO2 in the atmosphere."  (Freeman Dyson)

At a glance

So, what are computer models? Computer modelling is the simulation and study of complex physical systems using mathematics and computer science. Models can be used to explore the effects of changes to any or all of the system components. Such techniques have a wide range of applications. For example, engineering makes a lot of use of computer models, from aircraft design to dam construction and everything in between. Many aspects of our modern lives depend, one way and another, on computer modelling. If you don't trust computer models but like flying, you might want to think about that.

Computer models can be as simple or as complicated as required. It depends on what part of a system you're looking at and its complexity. A simple model might consist of a few equations on a spreadsheet. Complex models, on the other hand, can run to millions of lines of code. Designing them involves intensive collaboration between multiple specialist scientists, mathematicians and top-end coders working as a team.

Modelling of the planet's climate system dates back to the late 1960s. Climate modelling involves incorporating all the equations that describe the interactions between all the components of our climate system. Climate modelling is especially maths-heavy, requiring phenomenal computer power to run vast numbers of equations at the same time.

Climate models are designed to estimate trends rather than events. For example, a fairly simple climate model can readily tell you it will be colder in winter. However, it can’t tell you what the temperature will be on a specific day – that’s weather forecasting. Weather forecast-models rarely extend to even a fortnight ahead. Big difference. Climate trends deal with things such as temperature or sea-level changes, over multiple decades. Trends are important because they eliminate or 'smooth out' single events that may be extreme but uncommon. In other words, trends tell you which way the system's heading.

All climate models must be tested to find out if they work before they are deployed. That can be done by using the past. We know what happened back then either because we made observations or since evidence is preserved in the geological record. If a model can correctly simulate trends from a starting point somewhere in the past through to the present day, it has passed that test. We can therefore expect it to simulate what might happen in the future. And that's exactly what has happened. From early on, climate models predicted future global warming. Multiple lines of hard physical evidence now confirm the prediction was correct.

Finally, all models, weather or climate, have uncertainties associated with them. This doesn't mean scientists don't know anything - far from it. If you work in science, uncertainty is an everyday word and is to be expected. Sources of uncertainty can be identified, isolated and worked upon. As a consequence, a model's performance improves. In this way, science is a self-correcting process over time. This is quite different from climate science denial, whose practitioners speak confidently and with certainty about something they do not work on day in and day out. They don't need to fully understand the topic, since spreading confusion and doubt is their task.

Climate models are not perfect. Nothing is. But they are phenomenally useful.

Please use this form to provide feedback about this new "At a glance" section. Read a more technical version below or dig deeper via the tabs above!


Further details

Climate models are mathematical representations of the interactions between the atmosphere, oceans, land surface, ice – and the sun. This is clearly a very complex task, so models are built to estimate trends rather than events. For example, a climate model can tell you it will be cold in winter, but it can’t tell you what the temperature will be on a specific day – that’s weather forecasting. Climate trends are weather, averaged out over time - usually 30 years. Trends are important because they eliminate - or "smooth out" - single events that may be extreme, but quite rare.

Climate models have to be tested to find out if they work. We can’t wait for 30 years to see if a model is any good or not; models are tested against the past, against what we know happened. If a model can correctly predict trends from a starting point somewhere in the past, we could expect it to predict with reasonable certainty what might happen in the future.

So all models are first tested in a process called Hindcasting. The models used to predict future global warming can accurately map past climate changes. If they get the past right, there is no reason to think their predictions would be wrong. Testing models against the existing instrumental record suggested CO2 must cause global warming, because the models could not simulate what had already happened unless the extra CO2 was added to the model. All other known forcings are adequate in explaining temperature variations prior to the rise in temperature over the last thirty years, while none of them are capable of explaining the rise in the past thirty years.  CO2 does explain that rise, and explains it completely without any need for additional, as yet unknown forcings.

Where models have been running for sufficient time, they have also been shown to make accurate predictions. For example, the eruption of Mt. Pinatubo allowed modellers to test the accuracy of models by feeding in the data about the eruption. The models successfully predicted the climatic response after the eruption. Models also correctly predicted other effects subsequently confirmed by observation, including greater warming in the Arctic and over land, greater warming at night, and stratospheric cooling.

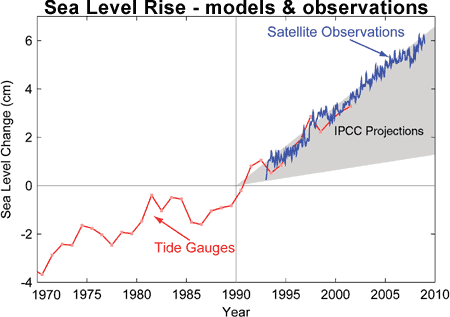
The climate models, far from being melodramatic, may be conservative in the predictions they produce. Sea level rise is a good example (fig. 1).

Fig. 1: Observed sea level rise since 1970 from tide gauge data (red) and satellite measurements (blue) compared to model projections for 1990-2010 from the IPCC Third Assessment Report (grey band).  (Source: The Copenhagen Diagnosis, 2009)

Here, the models have understated the problem. In reality, observed sea level is tracking at the upper range of the model projections. There are other examples of models being too conservative, rather than alarmist as some portray them. All models have limits - uncertainties - for they are modelling complex systems. However, all models improve over time, and with increasing sources of real-world information such as satellites, the output of climate models can be constantly refined to increase their power and usefulness.

Climate models have already predicted many of the phenomena for which we now have empirical evidence. A 2019 study led by Zeke Hausfather (Hausfather et al. 2019) evaluated 17 global surface temperature projections from climate models in studies published between 1970 and 2007.  The authors found "14 out of the 17 model projections indistinguishable from what actually occurred."

Talking of empirical evidence, you may be surprised to know that huge fossil fuels corporation Exxon's own scientists knew all about climate change, all along. A recent study of their own modelling (Supran et al. 2023 - open access) found it to be just as skillful as that developed within academia (fig. 2). We had a blog-post about this important study around the time of its publication. However, the way the corporate world's PR machine subsequently handled this information left a great deal to be desired, to put it mildly. The paper's damning final paragraph is worthy of part-quotation:

"Here, it has enabled us to conclude with precision that, decades ago, ExxonMobil understood as much about climate change as did academic and government scientists. Our analysis shows that, in private and academic circles since the late 1970s and early 1980s, ExxonMobil scientists:

(i) accurately projected and skillfully modelled global warming due to fossil fuel burning;

(ii) correctly dismissed the possibility of a coming ice age;

(iii) accurately predicted when human-caused global warming would first be detected;

(iv) reasonably estimated how much CO2 would lead to dangerous warming.

Yet, whereas academic and government scientists worked to communicate what they knew to the public, ExxonMobil worked to deny it."
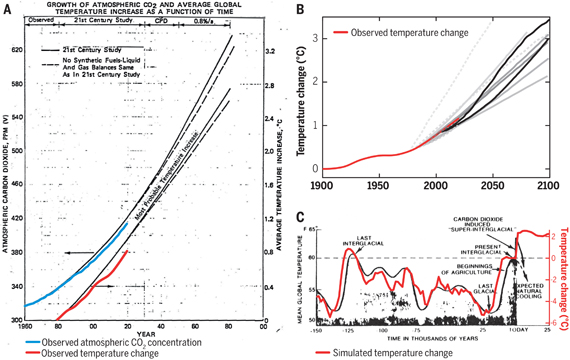

Exxon climate graphics from Supran et al 2023

Fig. 2: Historically observed temperature change (red) and atmospheric carbon dioxide concentration (blue) over time, compared against global warming projections reported by ExxonMobil scientists. (A) “Proprietary” 1982 Exxon-modeled projections. (B) Summary of projections in seven internal company memos and five peer-reviewed publications between 1977 and 2003 (gray lines). (C) A 1977 internally reported graph of the global warming “effect of CO2 on an interglacial scale.” (A) and (B) display averaged historical temperature observations, whereas the historical temperature record in (C) is a smoothed Earth system model simulation of the last 150,000 years. From Supran et al. 2023.

 Updated 30th May 2024 to include Supran et al extract.

Various global temperature projections by mainstream climate scientists and models, and by climate contrarians, compared to observations by NASA GISS. Created by Dana Nuccitelli.

Last updated on 30 May 2024 by John Mason. View Archives

Printable Version  |  Offline PDF Version  |  Link to this page

Argument Feedback

Please use this form to let us know about suggested updates to this rebuttal.

Further reading

Carbon Brief on Models

In January 2018, CarbonBrief published a series about climate models which includes the following articles:

Q&A: How do climate models work?
This indepth article explains in detail how scientists use computers to understand our changing climate.

Timeline: The history of climate modelling
Scroll through 50 key moments in the development of climate models over the last almost 100 years.

In-depth: Scientists discuss how to improve climate models
Carbon Brief asked a range of climate scientists what they think the main priorities are for improving climate models over the coming decade.

Guest post: Why clouds hold the key to better climate models
The never-ending and continuous changing nature of clouds has given rise to beautiful poetry, hours of cloud-spotting fun and decades of challenges to climate modellers as Prof Ellie Highwood explains in this article.

Explainer: What climate models tell us about future rainfall
Much of the public discussion around climate change has focused on how much the Earth will warm over the coming century. But climate change is not limited just to temperature; how precipitation – both rain and snow – changes will also have an impact on the global population.

Update

On 21 January 2012, 'the skeptic argument' was revised to correct for some small formatting errors.

Denial101x videos

Here are related lecture-videos from Denial101x - Making Sense of Climate Science Denial

Additional video from the MOOC

Dana Nuccitelli: Principles that models are built on.

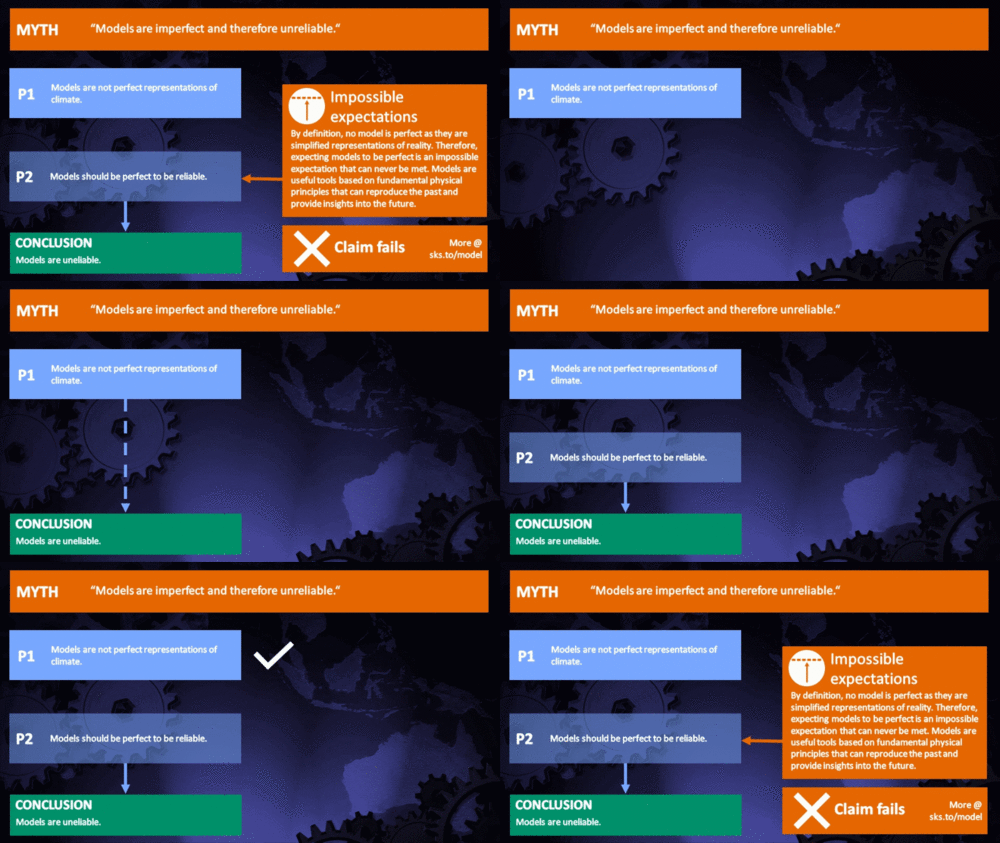
Myth Deconstruction

Related resource: Myth Deconstruction as animated GIF

MD Model

Please check the related blog post for background information about this graphics resource.

Fact brief

Click the thumbnail for the concise fact brief version created in collaboration with Gigafact:

fact brief

Comments

Prev  1  2  3  4  5  6  7  8  9  10  11  12  13  14  15  16  17  18  19  20  Next

Comments 26 to 50 out of 574:

  1. http://www.realclimate.org/index.php/archives/2008/05/what-the-ipcc-models-really-say/#comment-87205 on the Skeptic article, by the other author on the same issue. Koutsoyiannis mentioned here: "Cohn and Koutsoyiannis, one of them the author of the very paper that I had criticized, sat down next to me. We nevertheless had a very civilized and friendly chat, deciding to disagree on the matter of natural trends. But Dr. Koutsoyiannis commended us for being respectful in our reply to his comments. I think this is a very important issue – we have to be respectful, sincere, and show courtesy in our criticism, even when we argue why we think that a paper has flaws. ..." http://www.realclimate.org/index.php/archives/2008/04/egu-2008/ Use the Search box at the top of the RC page, paste in: Koutsoyiannis Dr. Koutsoyiannis posts there in two of the discussions.
  2. "on the Skeptic article, by the other author on the same issue." I didn't think Koutsoyiannis was writing up a "skeptic article", but rather an assessment of climate models. "'Cohn and Koutsoyiannis, one of them the author of the very paper that I had criticized, sat down next to me. We nevertheless had a very civilized and friendly chat, deciding to disagree on the matter of natural trends. But Dr. Koutsoyiannis commended us for being respectful in our reply to his comments. I think this is a very important issue – we have to be respectful, sincere, and show courtesy in our criticism, even when we argue why we think that a paper has flaws. ...'" I don't see how this is relevant-- the paper that Rasmus criticized was a paper titled "Nature's style: Naturally trendy" by Timothy Cohn and Harry Lins. The "But Dr. Koutsoyiannis commended us for being respectful in our reply to his comments" part of it involved comments made by Koutsoyiannis on a 2006 realclimate thread. So hank, I am not exactly sure where you are getting at with your comment here. Just a little background information on Koutsoyiannis?
  3. Just saw this article referenced on another climate blog: http://www.atypon-link.com/IAHS/doi/abs/10.1623/hysj.53.4.671 It studies the accuracy of climate models. Basically compares the model's predictions vs what happened. The conclusion was that climate models don't predict forward very well. I don't have the background to judge whether this article is credible but it did go through a peer reveiw process.
  4. Oh - and in my research on this subject I found the chart you had above 'Average Mean Global Temperature Change' had been updated over on ClimateAudit: http://www.climateaudit.org/?p=3354#more-3354 Can I trust the updated charts posted there? They seem to show actual temperature date significantly diverging from Hansen C (ie: lower). Again - I'm not the expert so I'm here asking questions of those who are :-). Thanks.
  5. To put the Global Warming issue in context, consider: 1. That average global temperature has decreased since 1998. The anomalies from NOAA data are: 1998 0.5763 1999 0.3947 2000 0.3629 2001 0.4934 2002 0.5573 2003 0.5565 2004 0.5336 2005 0.6044 2006 0.5428 2007 0.5458 Jan to June 2008 average 0.44 2. That GCMs (Global Climate Models) do not yet adequately account for the absorbed infrared radiation energy that is transported up by atmospheric convection currents. 3. That GCMs are not yet capable of dealing objectively with clouds so they are accounted for with subjective parameterization. 4. That currently used GCMs invoke water vapor positive feedback that climate history shows to be not valid. 5. That the GCM users/creators won’t divulge to competent evaluators some of the details of their computer programs. 6. That the only indicators that human activity causes global warming are these GCMs. 7. That the multi-billion dollar government grants for ‘climate research’ depend on ominous prediction of looming catastrophe. 8. That over 30,000 qualified scientists and engineers have signed a document stating that human activity has had no significant influence on climate.
  6. 1. probability and possibility are two different things. You may show statistically that something is probable and therefore, sooner or later will happen. This is only true mathematically and not necessarily works in the real world. Any computer model that includes assumptions, 'tweaked' data, or excludes any factors relevent to the model will give a rubbish result. 2. Remember the Chaos Effect. Small things through iterative action can have BIG consequencies, so the apparently small and irrelevent must be accounted for. Worse yet, we don't even know if we know ALL the factors influencing the climate....so any model will be suspect.
  7. Poptech Re: comment 29 Please correct me if I am wrong but was not Fortran 66 (1966) not machine dependent as well as structure dependent? I am not familiar with Fortran 95 as I stopped using Fortran 77 around 1983 and switched to Pascal so my code would be transportable.
  8. Just read an interesting abstract on the effect of the moon on the monthly GMT. "Over the past fifty years, the Diurnal Temp Range has decreased by about half a degree.Conventional wisdom blames this on the greenhouse effect. But this decrease is just a trend observed in data that vary over shorter timescales. Cerveny and Balling show that for the period between 1950 and 1995, the DTR fluctuates with the phases of the Moon. It tends to increase towards Full Moon, and tends to be lowest at New Moon. Simple monthly differences in DTR between New Moon and Full Moon may be as much as 0.309 ºC -- in other words, 60% of the entire 50-year decrease. The message should be clear: all possible sources of variation should be investigated before blaming human activity alone for observed changes in climatic parameters." There is a correlation between full moon and monthly DTR variations most of which is ascribed to the changing earth/moon barycentre. This has prompted a look at the effects of a shifting sun/earth/moon barycentre on earth climate. Another piece in the puzzle?
  9. Mizimi I would imagine that the difference between full and new is reflected sunlight and whatever radiation it may contain. This would have an effect on GHGs (I am thinking water vapor and methane which a recent article at LiveScience talks about. Re: "This has prompted a look at the effects of a shifting sun/earth/moon barycentre on earth climate." Have you ever read The Solar Jerk by Dr. Rhodes Fairbridge?
  10. QM: Yes, just recently, which prompted me to look for further info on how a shifting barycentre could affect climate. One thought which I am currently pursuing is adiabatic cooling of the upper atmoshere caused by the tidal effect of sun/moon. As the barycentre moves it causes the shape of the atmospheric envelope to alter, effectively expanding the volume, which should cause a cooling effect.
  11. The models did a pretty good job stating where hurricane Gustav would end up. Should the people of New Orleans have ignored them as well - because they couldn't be 100% certain of their accuracy?
  12. Sandy Winder: Gustav was weather, not climate. Gustav was the end product of the climate process. Weather can be predicted over VERY short periods with a reasonable level of accuracy; at present, climate cannot. This is a good chunk of what the argument is all about. The uncertainty with Gustav was not that it would hit, but exactly where and at what level ( eventually I think downgraded to Cat2) so it would have been foolish to ignore it. A side benefit of the dispute is that we are learning a lot more about climate,history,the biosphere etc.
  13. QM: The earth-moon barycentre is around 1700km BENEATH our crust..so the tidal effect of the moon/sun would 'stir up' the lower mantle...presumably a very low frequency effect....and increase surface volcanic activity??
  14. Apparently climatologists do not have much grounding in how feedback works. Unaware of their ignorance, they invoke net positive feedback in their GCMs. This mistake causes the GCMs to predict significant ‘enhanced global warming’. Anyone who has the ability and interest to look at the NOAA data from Vostok Ice Cores for the last glaciation (and prior glaciations) will discover that, repeatedly, a temperature increasing trend changed to a decreasing trend with the carbon dioxide level higher than it had been when the temperature was increasing. Graphs of NOAA and other credible data, all fully sourced so they can be verified, can be seen at http://www.middlebury.net/op-ed/pangburn.html. (The web site is controlled by Middlebury, not me.) Those who understand how feedback works will know that this temperature trend reversal is not possible with significant net positive feedback. Thus, as far as global climate is concerned and contrary to the assumption in the GCMs, significant net positive feedback does not exist. Other assessments from entirely different perspectives also determine that there is no significant net positive feedback. They can be seen at http://www.climate-skeptic.com/2008/01/index.html and http://www.weatherquestions.com/Roy-Spencer-on-global-warming.htm
  15. "In addition phytoplankton emit Dimethyl Sulphide (DMS), which reacts with oxygen in the atmosphere to produce sulphur dioxide. This acidic gas forms tiny droplets which help to seed clouds over the ocean, and these reflect sunlight thus cooling the planet. Measurements of methane sulphonic acid (MSA, which is derived from DMS) in ice core bubbles indicate that there were more phytoplankton in the polar oceans during the ice ages, as expected from the theory above. Therefore as the climate gets warmer there will be less seeding of clouds over the ocean - clearly a positive feedback." http://www.chooseclimate.org/climatetrain/scipolcc.html
  16. Atmospheric water vapor is also clearly a positive feedback. There are also negative feedbacks. Dr. Richard Lindzen has identified one, his iris effect. Response of the climate system depends on the combined effect of all feedbacks, known or not. When all are combined, the NET feedback can not be significantly positive. This is mandated by the temperature trend reversals of the last and previous glaciations.
  17. Dan: Depends what you take as significant. The time span is important,as well as the net feedback quantity. A very small change over a very long period ( like glacial periods) can eventually have a profound effect, This is the basis of Chaos Theory. One of our major problems is that we do not have enough hard data to quantify these matters to sufficient degree to allow a reasonable model to be constructed. We have a lot of information, knowledge and some data, but mostly we have guesstimates derived by various means ( some quite dubious), and that isn't good enough for a system of this complexity.
  18. There is only one complete and exact computer of global climate and that is the planet itself. By definition it complies with all laws of nature including physics and quantum mechanics. Einstein said “no number of tests can prove I’m right but only one is needed to prove I’m wrong”. That one test that proves to be wrong the theory that added atmospheric carbon dioxide causes global warming was run on the planet computer and the results are archived in the Vostok ice cores. They show that, repeatedly, a temperature increasing trend changed to a decreasing trend with the carbon dioxide level higher than it had been when the temperature was increasing. Those who understand how feedback works will know that this temperature trend reversal is not possible with significant net positive feedback. Thus, as far as global climate is concerned and contrary to the assumption in the GCMs, significant net positive feedback does not exist.
  19. Re #41 & etc. Dan Pangburn Dan, you certainly do talk a lot of nonsense, and you seem to have gone to extraordinary lengths on your webpage to put together a deliciously incorrect view of the science! Let's look at just a couple of things: (1) ["The planet plunged in to the Andean-Saharan ice age 440 million years ago10 when the carbon dioxide level was over ten times higher than now."] No.....there certainly does seem to have been significant glaciation dated to around 445.6 mya - 443.7 mya, but the atmospheric CO2 levels for this period are simply not known. You seem to have fallen for the trick of some dubious character who has drawn straight lines across vast ranges (10’s to 100's of millions of years) of geological time based on some unspecified temperature estimates (your posts on this thread are displaying that odd habit of denigrating pukka science by misrepresentation while at the same time embracing stuff that is very obviously ludicrous rubbish!). I would expect everyone can understand the problem that if there are one or two paleo proxies (temp or CO2, for example) known for some periods in the past, that one can only say that that's what the temperatures/CO2 levels were AT THOSE PARTICULAR TIMES. One can't draw a line between the points and consider that the temperature/CO2 levels over vast intervening periods is thus established. Imagine an equally dumb geologist from the far future dating atmospheric CO2 level estimates from 430,000 years ago and 1000 years ago. "Goodness", he might say, extrapolating massively between limited data points in gay Scotese style, "highish CO2 levels right through this period. And yet there is evidence for multiple ice cap incursions right down to the South of England and deep into North America. Clearly there can't be any relationship between atmospheric CO2 and temperature" Doh! You need to go back and look at the relevant science, rather than trawling for dodgy “information” on websites[***]! The science has been compiled, for example, in a recent review by Royer: D.L. Royer (2006) "CO2-forced climate thresholds during the Phanerozoic" Geochim. Cosmochim. Acta 70, 5665-5675. Or see: R.E. Carne, J.M. Eiler, J. Veizer et al (2007) "Coupling of surface temperatures and atmospheric CO2 concentrations during the Palaeozoic era" Nature 449, 198-202 Or: W. M. Kurschner et al (2008) “The impact of Miocene atmospheric carbon dioxide fluctuations on climate and the evolution of the terrestrial ecosystem” Proc. Natl. Acad. Sci. USA 105, 499-453. And so on…. Sadly there isn't a proxy CO2 measure for the late Ordovician glacial period. So we don't know if there is a mismatch between atmospheric CO2 levels and evidence for a cold spell then. It's rather clear (see Royer review, for example, and the masses of cited data therein, or the other articles cited just above) that where paleoproxies for atmospheric greenhouse gas levels and cold/warm spells are dated contemporaneously, that there is a rather good match (high CO2 associated with warm periods/low atmospheric CO2 with cold periods). (ii) Surely by now everyone can understand the rather simple contributions to ice age cycles and the fundamental differences between solar driven effects (with CO2/water vapour/albedo feedbacks) and greenhouse gas driven effects of the sort that we are now seeing. I find it hard to believe that you consider that you’ve found something worth making such a fuss over, as if there’s something about the lag between temperature and CO2 levels in the Vostock core that is not obvious, rather well-understood and pretty consistent with what we know about greenhouse gases and their effects. Let’s look at what happens during the ice age cycles driven by the small, painfully slow variations in the Earth’s orbital properties (Milankovitch cycles). As the pattern of insolation changes through these cycles the Earth warms (in a glacial to interglacial transition), ice sheets recede, albedo effects amplify the warming, the warming oceans release CO2 into the atmosphere resulting in further warming, atmospheric water vapour levels rise, and so on. Obviously, since the primary inducer of the warming is increased solar radiation, and the atmospheric CO2 rise is a result largely of the release of CO2 from the oceans, the temperature rises in advance of the atmospheric CO2 levels. That’s pretty obvious and uncontroversial (part of the lag is apparently also due to interhemispherical effects). Going the other way (your example of events 112,000 years ago), it’s not surprising that decreased polar insolation resulted in cooling in advance of the lowering of atmospheric CO2 levels. It takes rather a long time for atmospheric CO2 to be absorbed from the atmosphere, and there’s nothing surprising about the fact that as one “lowers the heater” that the Earth cools while CO2 levels remain relatively high, as CO2 is very slowly reabsorbed by the oceans and terrestrial environment.. And of course the CO2 level changes are small and the rates of change are tiny compared to present day, where the warming we are seeing is the result of enhanced greenhouse effects with a relatively constant solar insolation. So whereas during the last glacial to interglacial period, for example, atmospheric CO2 rose by around 80 ppm over 5000 years (1.6 ppm per 100 years averaged over the transition), now atmospheric CO2 levels are rising at well over 100 times faster (2-2.5 ppm per year). Everyone that takes the smallest effort to inform themselves is aware of the essential differences between ice age transitions (Milankovitch cycles drive extremely slow variations in atmospheric CO2 with very slow feedbacks) and present day warming (extremely rapid increases in atmospheric greenhouse gas concentrations resulting in rapid temperature increases). During ice age transitions the processes were sufficiently slow that the Earth’s temperature likely was near-equilibrium with the forcings (varying insolation, greenhouse gas levels and associated feedbacks). Now atmospheric greenhouse gas levels are rising far more quickly than the Earth’s temperature is able to keep pace with (the inertia from the massive ocean) and so we still have rather a lot of warming “in the pipeline” from current levels of atmospheric CO2, not to mention the amount of warming yet to be unmasked, as a result of man-made aerosolic countering of enhanced greenhouse-induced warming: e.g. V. Ramanathan and Y. Feng (2008) “On avoiding dangerous anthropogenic interference with the climate system: Formidable challenges ahead.” Proc. Natl. Acad. Sci. USA in press. http://www.pnas.org/content/early/2008/09/16/0803838105.abstract (iii) Your data on temperature/CO2 relationships are laughable. Just to choose one jaw-dropping example, there is one single data point in the Vostock core (1999 data set) that shows an anomalous temperature, and from this you conclude that “the average global temperature 400 years ago was significantly higher than now”! One data point from one location does not an “average global temperature” give. The pukka science carefully collects a range of proxy data from multiple sources using many different methodologies, taken from as many places on Earth as possible to assess careful paleoproxy temperature data that is truly globally (or at least hemispherically) averaged. You (having other fish to fry one suspects than assessing the best possible understanding from the available data) base your entire analysis on one data point, from one data set from one location on Earth. Oh dear! And so on. Happily the individuals and organizations that address these issues maturely and seriously don't fall for that sort of nonsense.... [***] In fairness to Christopher Scotese, his site is quite good. He does need to update his paleotemperature graph though!
  20. Chris: Your assertion “…talk a lot of nonsense…” may reveal that you simply do not understand how feedback works. The graphs in the Middlebury link are plots of data from NOAA and other credible sources. They speak for themselves and are as correct as the data sources. Apparently you accept Scotese’s temperatures. The carbon dioxide level at that time is from GEOCARB III as published in the American Journal of Science. The graph at http://www.globalwarmingart.com/wiki/Image:Phanerozoic_Carbon_Dioxide_png shows a lot of illogical scatter in Royer’s compilation but fair agreement between 30Myr filtered Royer, Copse and GEOCARB III. I have found no rational argument as to why the atmospheric carbon dioxide level should dramatically change prior to the temperature dropping into that ice age. The assertion remains that the temperature dropped while the carbon dioxide level was several times higher than now. The graph of CO2 and average global temperature during the Phanerozoic (all of the time that there have been complex life forms, the last 550 million or so years) at http://mysite.verizon.net/mhieb/WVFossils/Carboniferous_climate.html is as good as any. A lot of imagination is needed to see any correlation there between atmospheric carbon dioxide and average global temperature. You say “the warming oceans release CO2 into the atmosphere resulting in further warming”. That would be a ramp up in temperature. But then the ramp up changed direction and became a ramp down. And this direction change in temperature trend happened repeatedly during the last and previous glaciations. That could not happen if there was significant net positive feedback. For those who understand how feedback works, this temperature trend direction change proves that there is no significant net positive feedback. All that is needed to determine if there is net positive feedback is a temperature trace for a long enough time to average out cyclic variation from random noise and other factors. The temperature trace does not even need to be correct in absolute terms just reasonably accurate in relative terms time-wise. Without significant net positive feedback added atmospheric carbon dioxide does not produce significant increase in average global temperature. Even the flawed GCMs give that result. Those who think they “…know about greenhouse gases and their effects…” apparently do not recognize the significance of this observation. While determination of the magnitude and even the sign of net feedback in climate may be difficult using climatology (Spencer at a link in 41 above and also Monckton at http://www.aps.org/units/fps/newsletters/200807/monckton.cfm have done it), it is trivial, as described above, for someone who understands feedback, to deduce from the temperature record that net positive feedback does not exist. Many climatologists apparently don't know how feedback works so they don't realize this. Unaware of their ignorance, they impose significant net positive feedback in their GCMs which causes them to predict substantial warming from carbon dioxide increase. Without significant net positive feedback, the GCMs do not predict significant Global Warming. From Monckton’s paper “The IPCC overstates temperature feedbacks to such an extent that the sum of the high-end values that it has now, for the first time, quantified would cross the instability threshold in the Bode feedback equation and induce a runaway greenhouse effect that has not occurred even in geological times despite CO2 concentrations almost 20 times today’s, and temperatures up to 7 ºC higher than today’s.” Do you realize how many times you said in 46 that the sun started it? These were extracted from your text: “…insolation changes…”, “…primary inducer of the warming is increased solar radiation…”, “…decreased [s]olar insolation resulted in cooling…”, “…one “lowers the heater” that the Earth cools…” Solar variation is certainly a major part of it. Of the list of other possible contributors to climate change, some ignored, some subjectively parameterized; solar wind, clouds, vertical convection, cosmic rays, Milankovitch cycles, etc. and factors not yet discovered, only significant net positive feedback is readily ruled out. Influencing any of the others doesn’t look promising. Humanity needs to adapt to climate change. Warming is not a problem. If it gets too hot or wet or dry where you are at, move. There are currently places that lack permanent occupancy because they are too hot, too cold, too wet or too dry. Half of humanity may starve in the coming glaciation, however, because rice does not grow on ice. The high rate of change of the level of atmospheric carbon dioxide today is not relevant to climate change since the level of atmospheric carbon dioxide has no significant influence on climate. Eventually, excess atmospheric carbon dioxide will dissolve in the ocean which already holds over 50 times as much as the atmosphere. Interestingly, I have read that the rate of increase of carbon dioxide in the atmosphere is about half of what is calculated based on the amount added by humanity. In your lawyer-like advocacy and nitpicking of the scarcity of paleo data you appear to have completely missed the point of temperature trend reversals ruling out net positive feedback. I suggest that you break out of the box that you are in, adopt engineer/scientist-like objectivity and learn about feedback. There are legitimate reasons to constrain the use of fossil fuels. As the level of atmospheric carbon dioxide continues to increase, and it will, humans may find enclosed places becoming ‘stuffy’ sooner than previously. The consumer price rise of liquid fuels as a result of ‘peak oil’ will curtail their use and stimulate alternate fuels such as algae produced biodiesel. I have been antagonistic to coal for decades and am suspicious of claims that mercury, soot and acid can be effectively removed from the exhaust. When humanity gets past their unjustified paranoia regarding nuclear power and start building breeder reactors they will have all of the energy needed for millions of years. Enough to recharge their hybrids and even synthesize liquid fuel to go beyond battery range.
  21. Re #47 No Scotese's temperatures are horribly incorrect (that's obvious surely). It's not clear where they came from (can you enlighten us?), and they clearly bear little relation to reality or to the paleotemperature data that is compiled extensively in the recent scientific literature (see citations at bottom of post for example). Try using Google Scholar or visit .edu sites (or your local University library - there are a number of relevant papers at the bottom of this post). In addressing scientific issues, one should address the science. ["The graph of CO2 and average global temperature during the Phanerozoic (all of the time that there have been complex life forms, the last 550 million or so years) at http://mysite.verizon.net/mhieb/WVFossils/Carboniferous_climate.html is as good as any."] No it isn't. Sadly it's a laughable parody of the data that has been complied in a large number of studies, and it's surprising that someone with an apparent interest in this subject would consider it to be so in the light of the abundant scientific data on this subject (see citations at bottom of this post). Obviously if one puts together a completely false representation of the scientific data on paleoCO2 and paleotemperature one shouldn't be surprised if one is led to fallacious interpretations. And suggesting that pointing out gross misrepresentation of the science based on ludicrously inadequate graphs using unspecified data on dubious websites with contrived misinterpretation, is "Lawyerlike advocacy and nit-picking", is a delightful lu-lu! As for feedbacks, I suspect you've managed to be misinformed through poor analysis or the perusal of dodgy sources (Christopher Monckton? isn't this supposed to be about science?). There's no question that raising atmospheric CO2 levels results in a re-equilbration of the Earth's temperature such that internal variations fluctuate around a higher equilibrium temperature (assuming volcanic/solar contributions are flattish), and that this involves feedbacks (e.g. a warmer atmosphere caused by enhanced atmospheric CO2 results in a higher concentration of water vapour.....enhanced warming results in enhanced ice melt and reduced albedo and so on)... The science indicates that the Earth responds to raised CO2 with a raised equilibrium surface temperature near 3 oC (+/- a bit). I'm not sure why you have a problem with this and feedbacks in general. Clearly during ice age cycles the dominant driver is cyclic variations in insolation due to slow variations in the Earth's orbital properties. It only requires that the insolation cycles dominate over the effects of CO2 (feedbacks included) to observe the relationships between temperature and CO2 levels in the Vostock core that you are so exercised over. If CO2 levels rise from 180-280 ppm over thousands of years(due to very slow solar induced warming) resulting in enhanced direct CO2 (greenhouse) warming with fast positive water vapour feedbacks and slower albedo feedbacks, and then the solar contribution diminishes, much of the atmospheric CO2 will still be there (for hundreds of years) as the temperature cools in the early stages of the next Milankovitch cooling cycle. And as the temperature cools due to decreased insolation, so the water vapour levels drop, even as CO2 levels remain high. That's not difficult to understand at all.. You make some other very odd comments. Yes, high levels of atmospheric CO2 will eventually be drawn out of the atmosphere. This is a very slow process (your own Vostock data show this). And of course "the rate of increase of carbon dioxide in the atmosphere is about half of what is calculated based on the amount added by humanity." Half of the CO2 we've released into the atmosphere has been absorbed by the oceans with a very measurable drop in pH (increased acidity).....already the absorption of our emissions by the oceans is decreasing due to the saturation of the upper oceanic waters. Each of these is problematic. All in all, you've chosen to use ludicrous data from some website to pursue the unsupported notion that there isn't a relationship between atmospheric CO2 lelvels and the earth's global temperature. And yet the science clearly shows otherwise (e.g. papers cited below). No one disputes the fact that CO2 is a greenhouse gas, and greenhouse gases cause the Earth to warm above its black body temperature (by around 30 oC worth of warming on Earth). Or do you consider that CO2 stops being a greenhouse gas above some concentration or other? Anyway, here's some of the science that one would hope you might access in place of dodgy websites: D.L. Royer (2006) "CO2-forced climate thresholds during the Phanerozoic" Geochim. Cosmochim. Acta 70, 5665-5675. (this is a review compiles much of the published data) Even more recent studies supplement the information in Royers compilation and cover additional periods with new data sets right through the past several hundreds of millions of years: R.E. Carne, J.M. Eiler, J. Veizer et al (2007) "Coupling of surface temperatures and atmospheric CO2 concentrations during the Palaeozoic era" Nature 449, 198-202 W. M. Kurschner et al (2008) “The impact of Miocene atmospheric carbon dioxide fluctuations on climate and the evolution of the terrestrial ecosystem” Proc. Natl. Acad. Sci. USA 105, 499-453. D. L. Royer (2008) “Linkages between CO2, climate, and evolution in deep time” Proc. Natl Acad. Sci. USA 105, 407-408 Zachos JC (2008) “An early Cenozoic perspective on greenhouse warming and carbon-cycle dynamics” Nature 451, 279-283. Doney SC et al (2007) “Carbon and climate system coupling on timescales from the Precambrian to the Anthropocene” Ann. Rev. Environ. Resources 32, 31-66. Horton DE et al (2007) “Orbital and CO2 forcing of late Paleozoic continental ice sheets” Geophys. Res. Lett. L19708 (Oct. 11 2007). B. J. Fletcher et al. (2008) “Atmospheric carbon dioxide linked with Mesozoic and early Cenozoic climate change” Nature Geoscience 1, 43-48.
  22. The Andean-Saharan issue is simple. The ice age happened and the carbon dioxide level was much higher than now when it started. The chart uses data compiled by Christopher R. Scotese, Ph.D., University of Chicago, 1985, currently an Associate Professor geologist at the University of Texas at Arlington. Research interests include plate tectonics, paleogeography, and paleoclimatology and R. A. Berner, Department of Geology and Geophysics, Yale University. Contrary to your implication, they are university scientists. My understanding of feedback in a complex system comes from having an advanced degree in Mechanical Engineering and many years of engineering practice including rocketry, nuclear power, and meteorological satellites. Many engineers understand and successfully apply feedback in complex systems and have for many decades. Although climatologists use a somewhat different formulation, the end result is the same. Your discussion of feedback verifies that you don’t understand feedback very well. That explains why you don’t recognize that the temperature trend reversals during the previous glaciation (not talking about 100,000 year ice age cycles here) prove that significant net positive feedback does not exist in climate. If you use the same argument regarding the temperature trend reversals as you use for changes from glacial to interglacial then all temperature trends would be reversed by unpredictable solar changes which would make GCMs useless as climate predictors. I am puzzled as to why you call some of my comments “very odd” and then proceed to agree with them. The data that you disparagingly refer to as ludicrous is well referenced and came from NOAA as you could have easily discovered. I say that there is no significant net positive feedback and you claim that I said “there isn't a relationship between atmospheric CO2 lelvels and the earth's global temperature”. Some scientists express their interpretations and you say “science says”. More scientists and engineers are on record declaring that atmospheric carbon dioxide level has no significant influence on climate than there are saying that it does (Not that it matters).
  23. Oh dear... You don't seem to get it: (1) There is unfortuantely no paleoCO2 proxy that coincides in time with the late Ordovician paleoevidence for glaciation. Therefore we don't know the relationship between paleoCO2 and paleotemperature for that particular event. There's no point in pretending otherwise. (ii) Pretty much every case where we do have contemporaneous paleoCO2 and paleotemperature temperature proxies, the relationship between atmospheric CO2 and temperature is rather clear. See the list of scientific papers in my post #48. (iii) If one want's to assess scientific issues, one goes to the published science, not to dodgy outdated, and unattributed pictures on websites. (iv) Christopher Scotese seems a perfectly excellent chap. However his website was last updated around 2002, and his site is principally to illustrate tectonic effects on continental movement. Sadly his site happens to contain a completely incorrect graph of paleotemperature data. It's more of a child-like crude sketch. I've no idea where it comes from...(can you enlighten us?) (v) I've shown you a long list of papers, including a recent review that compiles all of the data up to around 2005/6. Unfortunately, rather than taking the effort to explore the science on this subject, you prefer to argue over a crude unattributed graph that is clearly incorrect....go figure! (vi) You have an advanced degree on Mechanical Engineering and so on...and yet you have spent an apparently significant eforrt in putting together a web page full of the most blatant misrepresentations. While real scientists assess multipile paleotemperature data sets obtained with many different methods from as many places on the earth as possible to obtain truly global (or at least hemispheric) paleotemperature estimates, you choose ONE data point, in ONE data set, from ONE place on Earth and presume to aseet that 400 years ago the globally averaged temperature was higher than now... (vii) Even though that's a dismal piece of misrepresentation, and Scotese's temperature data is clearly incorrect, and your arguments about feedbacks have no basis in science...... ..you are still asserting that you are right on these matters whereas all the climate, meterological, ocean, paleoenvironmental scientisits and so on are all incorrect.... I don't think so Dan.....why not make an effort to access the science on these issues. I've given you a wealth of sources that bear exactly on the subjuect of issue that containis the most up to date data.
  24. Oh dear is right . . . Graphs of source referenced NOAA data are presented and you see “blatant misrepresentation”. The proof that significant net positive feedback and therefore AGW does not exist does not use Holocene data but you persist in worrying about a specific data point. You point out that other scientist’s have different interpretations of the Andean-Saharan ice age and you have decided which ones you agree with. Perhaps you do not realize that A/S is also not a necessary consideration to prove that significant net positive feedback does not exist in climate. The Scotese-Berner assessment of A/S defrays concern for planet-wide runaway temperature rise but the logarithmic decline in infrared radiation intensity with distance from the radiating surface with what is called the ‘saturation’ effect of atmospheric carbon dioxide refutes the ‘tipping point’ nonsense without any other consideration. Apparently you still don’t understand how feedback works. Perhaps we are not communicating. Let’s try a specific example. Look at the temperature trend from 55,000 ybp to 50,000 ybp. (This is from NOAA Vostok data as graphed in the second graph on the Middlebury website but the EPICA core shows about the same only shifted slightly in time.) See that this uptrend changes to a down trend at 50,000 ybp. This downtrend continues until about 45,000 ybp. This direction change from an up trend to a down trend could not take place if there were significant net positive feedback. Now look at the rest of the graph and see that there are many similar examples. Only the few who still believe that the rising atmospheric carbon dioxide level will have a significant effect on average global temperature are incorrect. Learn about feedback and then read 45 again.
  25. Don't be silly Dan, It's you that is "worrying about a specific data point" or actually two specific data points. NUMBER ONE: I am basing my understanding of the strong relationship between paleoCO2 measures and paleotemperature measures right back through the last 500 million years, BASED ON HUNDREDS OF CONTEMPORANEOUS CO2 and TEMP MEASURES (see data in my references cited in the posts above) You are taking one specific part of the paleodat where there is evidence for glaciation (i.e a coolish/cold Earth) and assuming that there is no relationship with atmospheric CO2. However THERE IS NO CONTEMPORANEOUS PALEO-CO2 MEASURE THAT OVERLAPS THIS PERIOD...and therefore your focus on a specific data point is spurious. NUMBER 2: I am basing my understanding of the paleotemperature data of the last 2000 years which indicates that late 20th century and contemporary warming is well above anything experienced during this time period. THIS DATA IS BAED ON NUMEROUS DATA SETS USING NUMEROUS METHODS OBTAINED FROM MANY DIFERENT PLACES ON EARTH. You are making a blatant misrepresentation of the data by basing your interpretation on ONE data point, from, ONE location, using ONE method. For some reason you're trying to construct a whole edifice of misrepresentation based on single data points. And for some reason, despite your assertions of scientific credentials you can't seem to grasp that primary effects (raised CO2 levels) supplemented with feedbacks can be overpowered by other effects (reduced insolation during waning Milankovitch cycles)... ..your blatant fallacious misinterpretations of paleodata don't actually give us very much confidence in your misassertions aboutfeedbacks...

Prev  1  2  3  4  5  6  7  8  9  10  11  12  13  14  15  16  17  18  19  20  Next

Post a Comment

Political, off-topic or ad hominem comments will be deleted. Comments Policy...

You need to be logged in to post a comment. Login via the left margin or if you're new, register here.

Link to this page


The Consensus Project Website

THE ESCALATOR

(free to republish)


© Copyright 2024 John Cook
Home | Translations | About Us | Privacy | Contact Us