Climate Science Glossary

Term Lookup

Enter a term in the search box to find its definition.

Settings

Use the controls in the far right panel to increase or decrease the number of terms automatically displayed (or to completely turn that feature off).

Term Lookup

Settings


All IPCC definitions taken from Climate Change 2007: The Physical Science Basis. Working Group I Contribution to the Fourth Assessment Report of the Intergovernmental Panel on Climate Change, Annex I, Glossary, pp. 941-954. Cambridge University Press.

Home Arguments Software Resources Comments The Consensus Project Translations About Support

Bluesky Facebook LinkedIn Mastodon MeWe

Twitter YouTube RSS Posts RSS Comments Email Subscribe


Climate's changed before
It's the sun
It's not bad
There is no consensus
It's cooling
Models are unreliable
Temp record is unreliable
Animals and plants can adapt
It hasn't warmed since 1998
Antarctica is gaining ice
View All Arguments...


Username
Password
New? Register here
Forgot your password?

Latest Posts

Archives

How do human CO2 emissions compare to natural CO2 emissions?

What the science says...

Select a level... Basic Intermediate

The natural cycle adds and removes CO2 to keep a balance; humans add extra CO2 without removing any.

Climate Myth...

Human CO2 is a tiny % of CO2 emissions

“The oceans contain 37,400 billion tons (GT) of suspended carbon, land biomass has 2000-3000 GT. The atpmosphere contains 720 billion tons of CO2 and humans contribute only 6 GT additional load on this balance. The oceans, land and atpmosphere exchange CO2 continuously so the additional load by humans is incredibly small. A small shift in the balance between oceans and air would cause a CO2 much more severe rise than anything we could produce.” (Jeff Id)

At a glance

Have you heard of Earth's carbon cycle? Not everyone has, but it's one of the most important features of our planet. It involves the movement of carbon through life, the air, the oceans, soils and rocks. The carbon cycle is constant, eternal and everywhere. It's also a vital temperature control-mechanism.

There are two key components to the carbon cycle, a fast part and a slow part. The fast carbon cycle involves the seasonal movement of carbon through the air, life and shallow waters. A significant amount of carbon dioxide is exchanged between the atmosphere and oceans every year, but the fast carbon cycle's most important participants are plants. Many plants take in carbon dioxide for photosynthesis in the growing season then return the CO2 back to the atmosphere during the winter, when foliage dies and decays.

As a consequence of the role of plants, a very noticeable feature of the fast carbon cycle is that it causes carbon dioxide levels to fluctuate in a regular, seasonal pattern. It's like a heartbeat, the pulse of the Northern Hemisphere's growing season. That's where more of Earth's land surface is situated. In the Northern Hemisphere winter, many plants are either dead or dormant and carbon dioxide levels rise. The reverse happens in the spring and early summer when the growing season is at its height.

In this way, despite the vast amounts of carbon involved, a kind of seasonal balance is preserved. Those seasonal plant-based peaks and troughs and air-water exchanges cancel each other out. Well, that used to be the case. Due to that seasonal balance, annual changes in carbon dioxide levels form regular, symmetric wobbles on an upward slope. The upward slope represents our addition of carbon dioxide to the atmosphere through fossil fuel burning.

Fossil fuels are geological carbon reservoirs. As such, they are part of the slow carbon cycle. The slow carbon cycle takes place over geological time-scales so normally it's not noticeable on a day to day basis. In the slow carbon cycle, carbon is released by geological processes such as volcanism. It is also locked up long-term in reservoirs like the oceans, limestone, coal, oil or gas. For example, the "37,400 billion tons of 'suspended' carbon" referred to in the myth at the top of this page is in fact dissolved inorganic carbon in the deep oceans.

Globally, the mixing of the deep ocean waters and those nearer the surface is a slow business. It takes place over many thousands of years. As a consequence, 75% of all carbon attributable to the emissions of the industrial age remains in the upper 1,000 m of the oceans. It has not had time to mix yet.

Fluctuations in Earth's slow carbon cycle are the regulating mechanism of the greenhouse effect. The slow carbon cycle therefore acts as a planetary thermostat, a control-knob that regulates global temperatures over millions of years.

Now, imagine the following scenario. You come across an unfamiliar item of machinery that performs a vital role, for example life support in a hospital. It has a complicated control panel of knobs and dials. Do you think it is a good idea to start randomly turning the knobs this way and that, to see what happens? No. Yet that is precisely what we are doing by burning Earth's fossil fuel reserves. We are tinkering with the controls of Earth's slow carbon cycle, mostly without knowing what the knobs do - and that is despite over a century of science informing us precisely what will happen.

Please use this form to provide feedback about this new "At a glance" section. Read a more technical version below or dig deeper via the tabs above!


Further details

Before the industrial revolution, the CO2 content in the air remained quite steady for thousands of years. Natural CO2 is not static, however. It is generated by a range of natural processes, and absorbed by others. The carbon cycle is the cover-all term for these processes. It has both fast and slow components.

In the fast carbon cycle, natural land and ocean carbon remains roughly in balance and has done so for a long time. We know this because we can measure historic levels of CO2 in the atmosphere both directly, in ice cores and indirectly, through proxies. It's a seasonal response to things like plant growth and decay.

In stark contrast to the fast carbon cycle, the slow version operates over geological time-scales. It has affected carbon dioxide levels and therefore temperatures throughout Earth's history. The reason why the slow carbon cycle is so important is because many of the processes that lead to long-term changes in carbon dioxide levels are geological in nature. They take place over very long periods and do so on an erratic basis. The evolution of a species that has deliberately disturbed the slow carbon cycle is another such erratic event.

Annually, up to a few hundred million tonnes of carbon pass through the slow carbon cycle, due to natural processes such as volcanicity. That's small compared to the fast carbon cycle, through which some 600 billion tonnes of CO2 pass to-and-fro annually (fig. 1). However, remember that the fast carbon cycle is a give-and-take seasonal process. The slow carbon cycle instead runs in one direction or another over periods typically measured in millions of years.
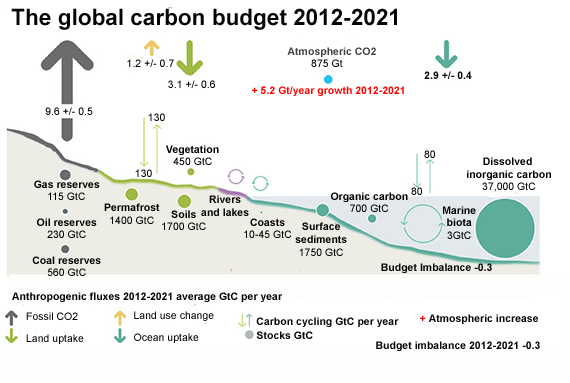
Global carbon budget

Fig. 1: Schematic representation of the overall perturbation of the global carbon cycle caused by anthropogenic activities averaged globally for the decade 2012–2021. See legends for the corresponding arrows and units. The uncertainty in the atmospheric CO2 growth rate is very small (±0.02 GtC yr−1) and is neglected for the figure. The anthropogenic perturbation occurs on top of an active carbon cycle, with fluxes and stocks represented in the background. Adapted from Friedlingstein et al. 2022.

Through a series of chemical and geological processes, carbon typically takes millions of years to move between rocks, soil, ocean, and atmosphere in the slow carbon cycle. Because of these geological time-scales, however, the overall amount of carbon involved is colossal. Now consider what happens when more CO2 is released from the slow carbon cycle – by digging up, extracting and burning carbon from one of its long-term reservoirs, the fossil fuels. Although our emissions of 44.25 billion tons of CO2 (in 2019 - source: IPCC AR6 Working Group 3 Technical Summary 2022) is less than the 600 billion tons moving through the fast carbon cycle each year, it adds up because the land and ocean cannot absorb all of the extra emitted CO2: about 40% of it remains free.

Human CO2 emissions therefore upset the natural balance of the carbon cycle. Man-made CO2 in the atmosphere has increased by 50% since the pre-industrial era, creating an artificial forcing of global temperatures which is warming the planet. While fossil-fuel derived CO2 is a small component of the global carbon cycle, the extra CO2 is cumulative because natural carbon exchange cannot absorb all the additional CO2. As a consequence of those emissions, atmospheric CO2 has accumulated to its highest level in as much as 15 to 20 million years (Tripati et al. 2009). This is what happens when the slow carbon cycle gets disturbed.

This look at the slow carbon cycle is by necessity brief, but the key take-home is that we have deeply disturbed it through breaking into one of its important carbon reservoirs. We've additionally clobbered limestones for cement production, too. In doing these things, we have awoken a sleeping giant. What must be done to persuade us that it needs to be put back to sleep? 

Cartoon summary to counter the myth
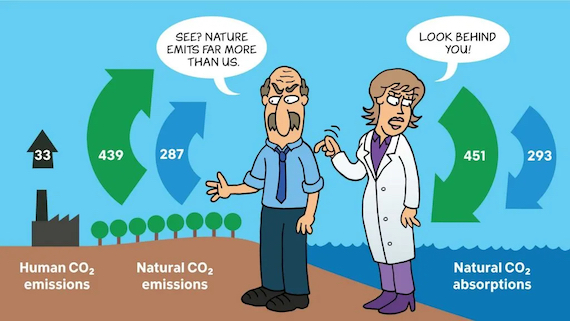
Cherry picking

This Cranky Uncle cartoon depicts the "Cherry picking” fallacy for which the climate myth "Human CO2 emissions are small" is a prime example. It involves carefully selecting data that appear to confirm one position while ignoring other data that contradicts that position. Source: Cranky Uncle vs. Climate Change by John Cook. Please note that this cartoon is illustrative in nature and that the numbers shown are a few years old.

Last updated on 17 September 2023 by John Mason. View Archives

Printable Version  |  Offline PDF Version  |  Link to this page

Argument Feedback

Please use this form to let us know about suggested updates to this rebuttal.

Further reading

Real Climate goes in-depth into the science and history of C13/C12 measurements.

The World Resources Institute have posted a useful resource: the World GHG Emissions Flow Chart, a visual summary of what's contributing to manmade CO2 (eg - electricity, cars, planes, deforestation, etc).

UPDATE: Human CO2 emissions in 2008, from fossil fuel burning and cement production, was around 32 gigatoones of CO2 (UEA).

Denial101x video

Here is the relevant lecture-video from Denial101x - Making Sense of Climate Science Denial

Fact brief

Click the thumbnail for the concise fact brief version created in collaboration with Gigafact:

fact brief

Comments

Prev  1  2  3  4  5  6  Next

Comments 76 to 100 out of 136:

  1. Ned - Richard is a NZ skeptic. You can imagine the conversations. Lately to accuse NIWA of fraud about NZ warming. Richard, without a reference to contradict the established carbon accounting, what is your point here? Ned provides the evidence for acceleration by the way though I think that pretty irrelevant - 1960s rates are scary enough.
  2. #71: "For there are other sources, too, such as outgassing from warming oceans and variable (unknown) outputs from various sources, such as wetlands." There's little or no empirical evidence that ocean outgassing makes a measurable contribution to atmospheric CO2 increase. Compare the monthly MLO record to landlocked stations along the same latitudes -- all the way around the globe -- and you see no differences. But 'unknown outputs'? No doubt those will be hard for you to document. "Land use change wasn't mentioned." And a good thing too, as land use change is now removing terrestrial carbon sinks. As far as increasing rates of change in atmospheric CO2, all the graphs of the annual data I've seen are concave up. That means the slope is increasing.
  3. Also Richard " they ought to be deducted from the anthro emissions budget. ". Human contribution to GHG gas rise is determined by isotope ratio not budgets (natural CO2 cycle is tricky).
  4. If the atmospheric water vapour is equal to 10m spread around the world and co2 is equal to 6mm how does the temperature in a greenhouse alter when 10m of glass is increased by 6mm?
  5. Re: kdfv (79) Greenhouses warm by preventing convection (glass barrier). CO2 and the other non-condensable GHG's work by slowing the loss of radiated energy at the top of the atmosphere (TOA) through back-radiation which warms the lower layers of the atmosphere nearer to the ground and cools the mid-to upper layers of the atmosphere, like the stratosphere and the mesosphere. Hope that helps. The Yooper
  6. Yeah, most people here know the glass greenhouse analogy isn't great. But it actually works in this case. To answer your question, kdfv, if you insist on the 10m-thick slabs of glass analogy, think of CO2 as the thin line of caulk that seals up the cracks between those slabs. :-)
  7. Questions about Fig 7.3 IPCC AR4. I find it necessary , in order to think about climate relevant properties or quantities, to know the time span and area to which they relate. As regards the 338 GT down arrow and the 333 GT up arrow on Fig.7.3: 1. What is the relevant surface area? If it is a whole earth average, it seems to me, the only meaningful arrow is a net downward 5 GT arrow. Furthermore if the time is for one year, how do I reconcile several hundred GT changes in the atmosphere with the ca. 5 GT annual change of the Keeling curve? In short, what is the meaning of the up and down arrowa and how were the quantities determined? If this is simply a way of saying that the CO2 in the ocean goes into and out of the aqueous phase then it is misleading because that is true for any solution-vapor coexistence and is irrelevant to the net changes in the quantity of significane in climate change, namely the amount of CO2 in the vapor. Fritz
  8. hfranzen writes: Furthermore if the time is for one year, how do I reconcile several hundred GT changes in the atmosphere with the ca. 5 GT annual change of the Keeling curve? Re: the ocean/atmosphere CO2 exchange, the sign of this flux is spatially and temporally heterogeneous. In one area and one season, the ocean will be a CO2 sink, while at some other place and time it will be a source. Integrating over the globe and the seasons gives a total upward flux of 332 Gt, and a downward flux of 338 Gt. This doesn't show up as a huge swing in the Keeling curve because the two processes are occurring simultaneously and thus mostly but not entirely cancel each other out. At least that's my understanding.
  9. Thanks for the answer (and rest assured I am definitly on the side of the IPCC. But,how far does the CO2 have to travel from source to sink to be inclded? Clearly CO2 is entering and leaving the ocean everywhere at all times, but to get a number to put on the quantity one has to define the transport as being between two points. How does one decide upon the two points? It seems to me that that decsision would be totally arbitrary i.e. one could get any number up to some meaningless maximum for which the CO2 travels only a millimeter or a micron. What am I missing here?
  10. #83: "the sign of this flux is spatially and temporally heterogeneous." Is it ever. We're trying to decipher some of this at Ocean acidification.
  11. #82: "how do I reconcile several hundred GT changes in the atmosphere with the ca. 5 GT annual change of the Keeling curve?" I may be oversimplifying it a bit, but I visualize the '~330 Gt up/down' as being an equilibrium cycle. Even if we released zero anthropogenic CO2, that cycle would still be there. Add in the CO2 we release from fossil fuel consumption -- on the order of 30 Gtons annually in recent years -- and you get the annual change in average atmospheric CO2 concentration (+1.5-2.5 ppm by volume). It is not difficult to work out how this excess mass of CO2 in Gtons converts to +2ppm by volume in the atmosphere, as long as approximately 50% of this mass is taken from the atmosphere by land/ocean sinks. You can actually trace the increasing rate of atmospheric CO2 concentration from increasing annual CO2 emissions; data are available here.
  12. Many thanks,I am fully aware of the point of your second paragraph -I have developed a power point discusing the CO2 atmospheric balance and detailiong the physical chemistry of its effect upon the earth. Does anyone want a copy? As regards your first paragraph, that may be the way they are thinking, but in what way is a dynamic exchange of CO2 a cycle? If I take a bottle of soda water in and out of the refrigerator and think about doing it a rediculously huge number of times am I then justied in calling what I envision a carbon cycle and putting 300+ GT arrows in my drawing of the soda bottle? I.e. a dynamic exchange of that charater may justifiably be considered a microcycle but it has no relavance to the type of macrocycle one thinks of when one considers, for example, the water cycle during which water is moved thousands of kilomters in periods of weeks. My major point is that a cycle means movement and to discuss movement in terms of quantity alone is, in this case for sure, meaningless. What is needed is quantity a distance and a time and the figure gives only a quantity. It is very poor communication at best and very poor science at worst.
  13. Hfranzen Most of that annual cycle has to do with seasonal cycles in carbon stored in terrestrial organic matter as biomass that builds up in spring and is later decomposed. For this reaons the annual cycle gets progressively less obvious as one moves from northern latitudes (with large proportion of surface area as land mass), to southern latitudes (where most of the surface area is covered by ocean). Biomass can accumulate on land because plants are more complex and there is a lag between formation and decomposition of organic matter (those processes also show lagged seasonal cycles). Plants in the ocean are largely single cells and get quickly eaten or decomposed. So even though there is almost as much photosynthesis in the ocean as on land, it is impossible to store much carbon in biomass in the ocean. Therefore, net CO2 flux into the ocean on the short time scale tends to be driven by abiotic factors (pCO2 in water and air, water temp, wind, currents, upwelling/downwelling). As for how these numbers are measured, I think that is covered in the IPCC AR4. In both terrestrial and oceanic systems there are areas than act as sinks and sources. We know the ocean is a net sink because it is acidifying as CO2 invades (in fact, becasue of that you can say that we actually know the net flux there better than the gross fluxes back and forth!) We also have calculated maps of CO2 flux based on physical/ biological controls that are consistent with a net influx under current conditions. Those are pretty good, but are improving all the time. Land use and biomass inventories suggest that overall the land is a net source due to deforestation - but regional reforestation has meant that some areas have been CO2 sinks over the last century. Uncertainty on the inventories is large but getting better - an active area of research. There are also biophysical models of primary production and decomposition that are driven by satellite data and physiological constraints. These are groundtruthed against long term plots used in the inventory studies. One can cross check both land and oceanic net flux estimates against changes in pCO2 as air masses pass over water bodies and land as constrained by known physical constrains on exchange. That can be done on the small scale (eddy diffusivity measurements in forest or grassland plots) or the very large scale (over Amazonia or the Southern Ocean) using so called inversion techniques which infer exchange rates -- essentially a complex regression whose fit is constrained by physical considerations. So basically on the budget side the focus has been on measuring net exchange in many ways rather than following individual molecules or plumes of CO2 (although that is interesting in and of itself). You can infer how far a typical molecule of CO2 travels in the atmosphere, but that turns out to be a consequence of the measurements and does not affect them. Hope that helps...
  14. #87: "in what way is a dynamic exchange of CO2 a cycle?" To use a familiar illustration, here is a 'dynamic exchange' of CO2 in/out of the biosphere. The result is a regular 6-7 ppm peak to trough cycle each year. It is superimposed on the long-term increase of ~2ppm per year due to anthropogenic CO2. The annual peak is in April, at the start of the growing season in the northern hemisphere; the annual trough is in September-October, aka 'fall'.
  15. Hfranzen "but in what way is a dynamic exchange of CO2 a cycle?" As noted, there is a lot more spatial variability implicit in that image than can be presented effectively. Also a cycle as used in earth science also implies transitions between different states (inorganic/organic, aqueous/gaseous) that can occur in a single space. That's just the usage.
  16. Here is link to an image of the CO2 flying carpet showing spatial and temporal variability combined.
  17. I think I understand the basic science quite well and am familiar with the details of the Keeloing curve. I am certain without knowing the details that I can visualize what is hapeening at the ocean-atmosphere interface. One of my current interests is to try to bridge the severe communication problem between scientists and nonscientists. I have at every opportunity made myself available to speak or write about the aspects of this probelm that I think I understand well. As part of this effort I turned to the Skeptical Scientist for guidance and the first thing I came upon was this thread and the figure (7.3) from the IPCC that seems to me to undercut the effort. In this figure a cycle involving 300+ GT of CO2 to and from the ocean is "given" - nothing to indicate the time span (although one could surmise a year) but more importantly nothing to indicate distance. The arrows in the figure suggest vary large distances but in what sense does one know (or feel qualified to suggest) that 300+ GT of CO2 move from point A to point B on the earth? My point is that the quoted 300+ GT of carbon (or CO2 - not even that is clear)are meaningless and these numbers only serve to confuse an already confused situation. If you are inclined to respond please know that I know how much CO2 humans are producing, how much of it is going into the atmosphere, how much CO2 (and bicarbonate and cardonate) are dissoled in the ocean, I understand heterogeous equilibria, and etc. I just want to know why figure 7.3 was the first response of many possible to the original query, and would like to have people acknowledg or refute my assertion that the figure is bad science and therefore bad communication.
  18. hfranzen I spoke about the seasonal variation and terrestrial carbon storage because you were trying to understand seasonal variation in CO2 as a function of ocean CO2 uptake, which is the wrong path to take. The reason there are large positive and negative fluxes of CO2 into the ocean is because some regions are net sources and some regions are net sinks of CO2. Those arrows indicate the sum release for the net source areas (like the equatorial Pacific), and the sum of uptake in the net uptake areas (like the subantarctic regions north of the Southern Ocean). As you can tell these areas are large. The minimal scale is essentially set by the minimum cell or pixel size of dynamic models of ocean physics and satellite observations (usually >kms) -- the in and out numbers do not refer to both gross flux terms of the net flux at one point...that would be pointless for the reasons you point out. Scientists study the spatial variability in PCO2 flux because efflux and influx can be decoupled by things like ENSO (on the short term) and ventillation (on the long term). It allows you to explicitly address the ability of the ocean to store CO2 in the future under different climate/oceanographic conditions and different time scales of exposure to increased CO2. We are discussing some of this on the acidicfication page as pointed out my muoncounter above. I think it's good science. You also have to include those arrows because they are in every global C cycle produced over the last few decades. As a consequence, you can't ignore them because cynics will say your hiding something when you're not. Ackowledging those arrows and explaining why they don't negate the importance of athropogenic CO2 is important. As for the time and mass units they are years and Gt CO2 (not C). If you go back to the original IPCC figure you can figure that out. In fact, the IPCC report covers all of what I said above pretty well. I'd read it.
  19. #92: "more importantly nothing to indicate distance. The arrows in the figure suggest vary large distances " These are schematics of the flow of materials in a dynamic system. There is no distance scale involved. This type of figure is the standard, in use for decades; for example, see figure 10 in Post et al 1990. "would like to have people acknowledg or refute my assertion that the figure is bad science" An assertion that this is 'bad science' needs some substantiation. There are far more egregious example of bad science to be found on a routine basis in the denialist sources.
  20. The fact that I believe it to be bad science is simply that the figure provided none of the information which is given above concerning the distances and times involved. To simply cite a quantity like 332 GT and call it a flux is counterproductive. If it had been said that the arrows correspond to so many GT traveling so many kms during the course of a year I would have had no problem with the figure. As you say, the deniers want to use these numbers to obfuscate the role of human production and the fact that they do not negate the conclusion that human production is the primary cause of GW, it seems to me, depends fundamentally on the fact that the fluxes travel back and forth i.e. the temperature changes that drive them reverse with the seasons so that "what goes around comes around". In other words, I would say that the forces driving CO2 from point A to point B because of a temperature increase at A are reversed when point B warms and the oppositely directed flux is driven by the by the (almost) exacty oppposing forces to return the system to (nearly)its original state. In fact i would liken the situation to streching a spring - it is an essential physcal requirment that when the perturbation (i,e the the seasonal remperaure chage) is removed the system returns ti its original state. At any rate this works for me. But a vague arrow going off into heaven knows where destroys the coherence of the picture. With the imagery of Fig. 7.3 it looks as though the CO2 leaves the ocean randomly (that's the way the deniers really like to think of it) and goes off to any old place. It seems to me that the figure, when used, would benefit enormously from some elements of Stephen Baines comments given above. To calibrate where i am coming from, I taught and did research in Physical Chemistry for nearly forty years and decided when I retired in 2000 to see if I could bring P. Chem. to bear on my understanding of GW. I have developed a ppt that generalizes Beer's Law to the case of braodband, diffuse transmittance and then, using spectroscopic data determined nearly 50 years ago I calculate the forced (no feedbacks) temperature change. I get 1.4 K degrees in the next 100 years.
  21. P.S. I just read my submission above and noticed all the typos. I am afraid I am not much of a typist (or proofreader for that matter).
  22. #95: "the forces driving CO2 from point A to point B because of a temperature increase at A are reversed when point B warms" CO2 is not driven from one point to another by temperature; rather it is driven by atmospheric circulation. Fisher 2010 presents several good examples; the diagrams in that paper have both physical scale and a time context. "... when the perturbation (i,e the the seasonal remperaure chage) is removed the system returns ti its original state." Unless the system oscillates, as your spring/mass example (and some parts of the climate system) would. "I calculate the forced (no feedbacks) temperature change. I get 1.4 K degrees in the next 100 years. " I don't know how to evaluate that statement without further information: such as what do you assume for climate sensitivity (often expressed as degC/CO2 doubling), what emissions scenario do you use and why no feedbacks? If you would care to share those key assumptions, certainly some of the folks around here more knowledgeable than I would have some helpful input.
  23. Regarding what drives the CO2: the temperature at point A rises seasonally. As a result the solubiity of CO2 in the ocean decreases at A and therefore some CO2 comes out of solution increasing the partial pressure (proceeding in the direction of the new equilibrium at the higher temperature). This increased partial pressure is swept by moving air masses to point B where the temperature does not increase as much, remains the same, or even decreases. At point B the CO2 spontaneously dissolves because the partial pressure exceeds the equilirium value for that temperature and concentration. Thus a transport of the CO2 is "driven" by the seaonal temperature changes. The process is reversed when the seanon changes back to the starting point. I have another, I think more important, question: Why is the condition of elecrical neutralty not brought into the discussion. All solutions, including the ocean, are to a very, vary close approximation electrically neutral. By my calculation of the total carbon dioxide 93.3% is present as bicaronate and carbonate. If 300 plus GT of carbon dioxide moves from A to B that amounts to about 7 times 10 to the 14th moles. The concentration of the major CO2 containing species in the ocean (bicarbonate) is about 0.0025 molal but that is not free to exchange without some negative charge increase or positive charge decrease. It seems to me possible that raises a serious problem for the 300 GT of supposed transport. I can do the following calculations: 1. assume equilibrium at point A (all CO2 bearing aqueous species, hydrogen and hydroxide ions, water and CO2 gas)at 288K, 2. assume a similar equilibrium at point B at 298K, 3 find the difference beyween the equilibrium CO2 partial pressures at A and B,3. find the mass of air required to move 300 GT of excess (at 288K) CO2. Does anyone want me to do that? I am now going to start a new thread to answer the questions about my ppt. So the two topics don't become confused.
  24. My power point does not include the feedbacks because it involves only Physical Chamistry and no Climatology. I am not trying to provide a counter to the Climatologists -in fact my ppt is built on their ideas. However it seems to me that many have got caught up in debating the feedbacks - a highly important debate in my opiniom - but have lost sight of the fact that there is a simple (at least to a P. Chemist)fact based, no iffy assumptions, no dependence on statistics argument that says in quantitative terms that there is a forcing and that we should therefore be taking the climatologists thoughts about the feedbacks very seriosly. The power point depends upon an understanding at the undergraduate level of the Keeling curve of the rotationl-vibration levels of CO2, of how these relate to the spectral observations, an awareness of Planck's law, a familiarty with undergraduate calculus, and an ability to understand the concept of a flux. In my ppt all of these are combined to show in a no nonsens, no wiggle room fashion that global warming at a forcing level of 1,4 K per century is a scientific reality. We do not need the earth's temperature record, observations of melting glaciers and ice caps, unusual frequencies of weather phenomens,(all of which are important and must be discussed in the proper context!) to conclude that we humans are the major cause of a serious problem having to do with the energy balance here on earth. Unless there are deniers reading this I am sure you all know this. What I am saying is in my power point there is a logical, if-then proof as sound as science can make it that global warming is real. I am not sure how to proceed, If someone says yes I want it I will post my e-mail address (unless someone warns me that this is not safe) and folks can e-mail requesting a copy. I could also give my snail mail address and, if people trust me. they could send their e-mail addresses and I will would the power point as an attachment.I have a web site with an early version of the power point (hfranzen.org if I remember correctly) and it gives the gist of the argument, which may be enough to see whether you want the latest version in which i have corrected many erros and improved the notationl I think I should also look into getting the web site updated, but I need to consult my web guru to get that done and that may not be so easy because he lives 1000 miles from my home. On the other hand a simple e-mail to him might suffice. Please let mo know what I should do.
  25. hpfranzen "Thus a transport of the CO2 is "driven" by the seaonal temperature changes. The process is reversed when the seanon changes back to the starting point." That model doesn't work so well for a number of reasons. First, lower warmer less seasonal latitudes would have to "see" that CO2 that was evaded in warming high latitude oceans. In other words, the evasion of CO2 would have to have significant effects on the ppm of CO2 above less seasonal waters for the mechanism you suggest to occur. But CO2 is a fairly well mixed gas, so mixing through the atmosphere greatly dilutes any effect of seasonal evasion on atmopsheric CO2 above tropical waters (you can see in that flying carpet diagram that seasonal variations in CO2 are relatively small as one approaches the tropics). Second, you are treating this as a solely physicochemical phenomenon when biology plays a huge role by altering the aquoeus pCO2 concentration (and thus the saturation displayed by CO2) through photosynthetic uptake of CO2 and subsequent export of organic matter to depth. This is particularly important in the spring when nutrients are abundant, light is increasing and waters are warming. The depression in pCO2 associated with photosynthesis offsets the seasonal evasion effect you are describing. Third, the process you describe should cancel out over a year (as long as one ignores phytoplankton)...which may be the point you are trying to make. For that reason and the ones I gave above, it is not considered that important from the point of view of understanding the carbon cycle. It's a bit of a red herring. Focusing on it misrepresents what modelers are doing. Oceanographic processes are more important. Deep water has high CO2 because it is 1) cold and 2) has been accumulating CO2 released by respiration over a long period of time (as in the Equatorial Pacific. If it comes to the surface and warms (and phytoplankton don't take up the CO2), large amounts of CO2 can evade. Also important is the downwelling of water that was warm, but has subsequently cooled (as in the north Atlantic). CO2 is not only a function of the solubility pump. Organic matter produced by phytoplankton represents trapped atmospheric CO2. The downwelling of water that has experienced massive phytoplankton blooms, as occurs in high latitudes and above south of thesubantarctic front, traps CO2 in organic form. Phytoplankton growth also drives aqueous pCO2 lower, which drives invasion of CO2. "Why is the condition of elecrical neutralty not brought into the discussion. " Charge balance is absolutely required to solve chemical equilibrium problems in the ocean - although the presence of organic matter can pose problems for analytical solutions. This statement tells me that you need desperately need to absorb quite a bit more marine chemistry before proceding.

Prev  1  2  3  4  5  6  Next

Post a Comment

Political, off-topic or ad hominem comments will be deleted. Comments Policy...

You need to be logged in to post a comment. Login via the left margin or if you're new, register here.

Link to this page


The Consensus Project Website

THE ESCALATOR

(free to republish)


© Copyright 2024 John Cook
Home | Translations | About Us | Privacy | Contact Us