Climate Science Glossary

Term Lookup

Enter a term in the search box to find its definition.

Settings

Use the controls in the far right panel to increase or decrease the number of terms automatically displayed (or to completely turn that feature off).

Term Lookup

Settings


All IPCC definitions taken from Climate Change 2007: The Physical Science Basis. Working Group I Contribution to the Fourth Assessment Report of the Intergovernmental Panel on Climate Change, Annex I, Glossary, pp. 941-954. Cambridge University Press.

Home Arguments Software Resources Comments The Consensus Project Translations About Support

Bluesky Facebook LinkedIn Mastodon MeWe

Twitter YouTube RSS Posts RSS Comments Email Subscribe


Climate's changed before
It's the sun
It's not bad
There is no consensus
It's cooling
Models are unreliable
Temp record is unreliable
Animals and plants can adapt
It hasn't warmed since 1998
Antarctica is gaining ice
View All Arguments...


Username
Password
New? Register here
Forgot your password?

Latest Posts

Archives

How do human CO2 emissions compare to natural CO2 emissions?

What the science says...

Select a level... Basic Intermediate

The natural cycle adds and removes CO2 to keep a balance; humans add extra CO2 without removing any.

Climate Myth...

Human CO2 is a tiny % of CO2 emissions

“The oceans contain 37,400 billion tons (GT) of suspended carbon, land biomass has 2000-3000 GT. The atpmosphere contains 720 billion tons of CO2 and humans contribute only 6 GT additional load on this balance. The oceans, land and atpmosphere exchange CO2 continuously so the additional load by humans is incredibly small. A small shift in the balance between oceans and air would cause a CO2 much more severe rise than anything we could produce.” (Jeff Id)

At a glance

Have you heard of Earth's carbon cycle? Not everyone has, but it's one of the most important features of our planet. It involves the movement of carbon through life, the air, the oceans, soils and rocks. The carbon cycle is constant, eternal and everywhere. It's also a vital temperature control-mechanism.

There are two key components to the carbon cycle, a fast part and a slow part. The fast carbon cycle involves the seasonal movement of carbon through the air, life and shallow waters. A significant amount of carbon dioxide is exchanged between the atmosphere and oceans every year, but the fast carbon cycle's most important participants are plants. Many plants take in carbon dioxide for photosynthesis in the growing season then return the CO2 back to the atmosphere during the winter, when foliage dies and decays.

As a consequence of the role of plants, a very noticeable feature of the fast carbon cycle is that it causes carbon dioxide levels to fluctuate in a regular, seasonal pattern. It's like a heartbeat, the pulse of the Northern Hemisphere's growing season. That's where more of Earth's land surface is situated. In the Northern Hemisphere winter, many plants are either dead or dormant and carbon dioxide levels rise. The reverse happens in the spring and early summer when the growing season is at its height.

In this way, despite the vast amounts of carbon involved, a kind of seasonal balance is preserved. Those seasonal plant-based peaks and troughs and air-water exchanges cancel each other out. Well, that used to be the case. Due to that seasonal balance, annual changes in carbon dioxide levels form regular, symmetric wobbles on an upward slope. The upward slope represents our addition of carbon dioxide to the atmosphere through fossil fuel burning.

Fossil fuels are geological carbon reservoirs. As such, they are part of the slow carbon cycle. The slow carbon cycle takes place over geological time-scales so normally it's not noticeable on a day to day basis. In the slow carbon cycle, carbon is released by geological processes such as volcanism. It is also locked up long-term in reservoirs like the oceans, limestone, coal, oil or gas. For example, the "37,400 billion tons of 'suspended' carbon" referred to in the myth at the top of this page is in fact dissolved inorganic carbon in the deep oceans.

Globally, the mixing of the deep ocean waters and those nearer the surface is a slow business. It takes place over many thousands of years. As a consequence, 75% of all carbon attributable to the emissions of the industrial age remains in the upper 1,000 m of the oceans. It has not had time to mix yet.

Fluctuations in Earth's slow carbon cycle are the regulating mechanism of the greenhouse effect. The slow carbon cycle therefore acts as a planetary thermostat, a control-knob that regulates global temperatures over millions of years.

Now, imagine the following scenario. You come across an unfamiliar item of machinery that performs a vital role, for example life support in a hospital. It has a complicated control panel of knobs and dials. Do you think it is a good idea to start randomly turning the knobs this way and that, to see what happens? No. Yet that is precisely what we are doing by burning Earth's fossil fuel reserves. We are tinkering with the controls of Earth's slow carbon cycle, mostly without knowing what the knobs do - and that is despite over a century of science informing us precisely what will happen.

Please use this form to provide feedback about this new "At a glance" section. Read a more technical version below or dig deeper via the tabs above!


Further details

Before the industrial revolution, the CO2 content in the air remained quite steady for thousands of years. Natural CO2 is not static, however. It is generated by a range of natural processes, and absorbed by others. The carbon cycle is the cover-all term for these processes. It has both fast and slow components.

In the fast carbon cycle, natural land and ocean carbon remains roughly in balance and has done so for a long time. We know this because we can measure historic levels of CO2 in the atmosphere both directly, in ice cores and indirectly, through proxies. It's a seasonal response to things like plant growth and decay.

In stark contrast to the fast carbon cycle, the slow version operates over geological time-scales. It has affected carbon dioxide levels and therefore temperatures throughout Earth's history. The reason why the slow carbon cycle is so important is because many of the processes that lead to long-term changes in carbon dioxide levels are geological in nature. They take place over very long periods and do so on an erratic basis. The evolution of a species that has deliberately disturbed the slow carbon cycle is another such erratic event.

Annually, up to a few hundred million tonnes of carbon pass through the slow carbon cycle, due to natural processes such as volcanicity. That's small compared to the fast carbon cycle, through which some 600 billion tonnes of CO2 pass to-and-fro annually (fig. 1). However, remember that the fast carbon cycle is a give-and-take seasonal process. The slow carbon cycle instead runs in one direction or another over periods typically measured in millions of years.
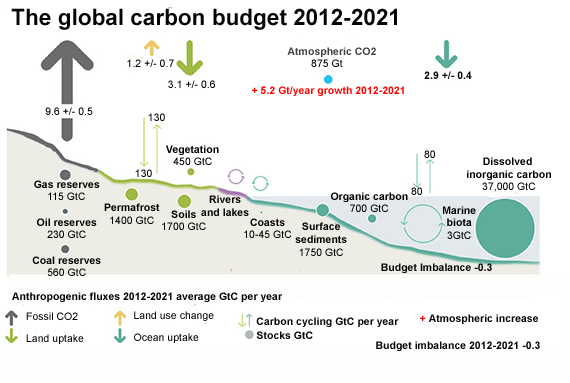
Global carbon budget

Fig. 1: Schematic representation of the overall perturbation of the global carbon cycle caused by anthropogenic activities averaged globally for the decade 2012–2021. See legends for the corresponding arrows and units. The uncertainty in the atmospheric CO2 growth rate is very small (±0.02 GtC yr−1) and is neglected for the figure. The anthropogenic perturbation occurs on top of an active carbon cycle, with fluxes and stocks represented in the background. Adapted from Friedlingstein et al. 2022.

Through a series of chemical and geological processes, carbon typically takes millions of years to move between rocks, soil, ocean, and atmosphere in the slow carbon cycle. Because of these geological time-scales, however, the overall amount of carbon involved is colossal. Now consider what happens when more CO2 is released from the slow carbon cycle – by digging up, extracting and burning carbon from one of its long-term reservoirs, the fossil fuels. Although our emissions of 44.25 billion tons of CO2 (in 2019 - source: IPCC AR6 Working Group 3 Technical Summary 2022) is less than the 600 billion tons moving through the fast carbon cycle each year, it adds up because the land and ocean cannot absorb all of the extra emitted CO2: about 40% of it remains free.

Human CO2 emissions therefore upset the natural balance of the carbon cycle. Man-made CO2 in the atmosphere has increased by 50% since the pre-industrial era, creating an artificial forcing of global temperatures which is warming the planet. While fossil-fuel derived CO2 is a small component of the global carbon cycle, the extra CO2 is cumulative because natural carbon exchange cannot absorb all the additional CO2. As a consequence of those emissions, atmospheric CO2 has accumulated to its highest level in as much as 15 to 20 million years (Tripati et al. 2009). This is what happens when the slow carbon cycle gets disturbed.

This look at the slow carbon cycle is by necessity brief, but the key take-home is that we have deeply disturbed it through breaking into one of its important carbon reservoirs. We've additionally clobbered limestones for cement production, too. In doing these things, we have awoken a sleeping giant. What must be done to persuade us that it needs to be put back to sleep? 

Cartoon summary to counter the myth
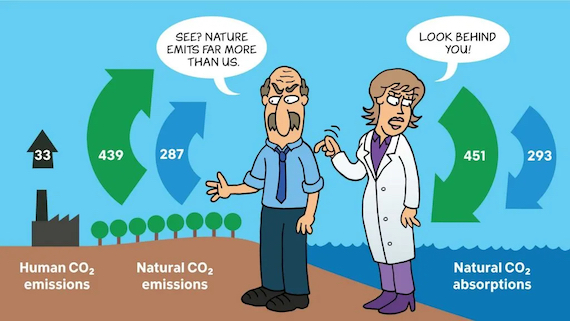
Cherry picking

This Cranky Uncle cartoon depicts the "Cherry picking” fallacy for which the climate myth "Human CO2 emissions are small" is a prime example. It involves carefully selecting data that appear to confirm one position while ignoring other data that contradicts that position. Source: Cranky Uncle vs. Climate Change by John Cook. Please note that this cartoon is illustrative in nature and that the numbers shown are a few years old.

Last updated on 17 September 2023 by John Mason. View Archives

Printable Version  |  Offline PDF Version  |  Link to this page

Argument Feedback

Please use this form to let us know about suggested updates to this rebuttal.

Further reading

Real Climate goes in-depth into the science and history of C13/C12 measurements.

The World Resources Institute have posted a useful resource: the World GHG Emissions Flow Chart, a visual summary of what's contributing to manmade CO2 (eg - electricity, cars, planes, deforestation, etc).

UPDATE: Human CO2 emissions in 2008, from fossil fuel burning and cement production, was around 32 gigatoones of CO2 (UEA).

Denial101x video

Here is the relevant lecture-video from Denial101x - Making Sense of Climate Science Denial

Fact brief

Click the thumbnail for the concise fact brief version created in collaboration with Gigafact:

fact brief

Comments

Prev  1  2  3  4  5  6  7  8  9  10  11  12  13  14  Next

Comments 176 to 200 out of 342:

  1. To John: Sounds like a good research!
  2. 174, John Hartz, I can't find a free copy of the paper to download. Can you summarize the "environmental and biological controls" they reference?
  3. bugai#138: "rate of increase in global atmospheric CO2 has dropped noticeably in years immediately following global recessions" USEIA provides emissions data; this report highlights emissions decrease in 2008 due to the recession. MLO reports annual increases in atmospheric CO2 in ppm: 2002-2005 all above +2ppm/yr; 2008 - +1.62, 2009 - +1.88. See also the 1991 drop in annual increase rate - the port Gulf War recession; 1981-1982 drop in rate following the Arab oil embargo. If we are not emitting this CO2, why does the atmospheric concentration follow economic activity? "diurnal changes are (i) local and (ii) too fast to equilibrate with anything. " So what? Atmospheric CO2 concentration, local or otherwise, increases with traffic density. Transportation is a significant percentage of all anthropogenic CO2 emissions. Where do you think that CO2 goes?
  4. I'm not sure where Bugai's assertion that terrestrial biomass is CO2 neutral comes from (it's not substantiated). Pretty much everything I have read indicates otherwise. The DOE is researching ways to enhance sequestration by terrestrial biomass. The very fact that trees add mass from year to year demonstrates the non neutral aspect. If terrestrial biomass production truly is carbon neutral how could such tremendous quantities of carbon been stored in the ground during the carboniferous period?
  5. @Sphaerica #177 The best I can do is to provide a link to a news release about the study posted on Oct 5, 2011 by the University of Zurich.
  6. To muoncounter: There is no doubt that short time signal can be observed in CO2 concentration. The CO2 relaxation time is 5 years. Fluctuations shorter than this period are not smoothed out. You cannot see "diurnal" osciillations there, but certainly the seasonal ones. Prooves nothing.
  7. bugai, it has already been pointed out to you that the "relaxation time" is not 5 years, and a specific reference given to back it up glossary of the IPCC report. Residence time is 5 years, not relaxation/adjustment time, which is 50-200 years (according to the IPCC).
  8. I rather wish bugai had continued to cooperate with Dikran; speaking as science laity, I was finding his step-by-step run-through enlightening.
  9. @Composer99: I did cooperate with Dikran and I am ready to continue, but he has to put all his steps in one posting. Then, we discuss. That's the condition.
  10. bugai: Given you are disputing a finding which has ample empirically-derived support in the peer-reviewed literature as outlined in the OP and on this website generally with no references to speak of (save for Wikipedia), I do not see how you are in a position to expect conditions from those who are arguing with the evidence on their side.
  11. bugai - Given that you are claiming that anthropogenic CO2 emissions do not drive the observed CO2 increases, in contradiction to the vast majority of data and analysis on scientific record, it might well be said that the onus is on you to prove your point. "Extraordinary claims require extraordinary proof." - Marcello Truzzi Dikran is attempting to discern where you disagree with the general body of science. In the past I have noted that his technique (of covering all steps in the analysis) has been quite successful in identifying points of disagreement for further and quite useful discussion. You are more than welcome not to participate in this. However, I will note that leaving a discussion because you don't like how it is progressing, rather than proving your point, may well be taken by most readers as evidence that your hypothesis will not stand the light of day.
  12. @KR and Composer99: see my posting #128. Concerning Dikran. I asked him to explain his position. He refused. It is not my fault. Yet, he is still welcome to put his arguments. But in one posting.
  13. bugai@187 "Yet, he is still welcome to put his arguments. But in one posting." You are not in a position to set the rules for the discussion. He is free to post them in any way he sees fit and you are free to ignore them. The difference is that Dikran's method looks like he is trying to move a discussion forward and you look like you are trying to stall it.
  14. Dikran - It may well be useful to list the steps in a consolidated post: if the steps are numbered and labeled. A nice tabular reference (perhaps the contents of a new post?) would be useful in this and other discussions - particularly as a drop-in for those in denial. If bugai or others disagree, they would naturally have to support which step(s) they disagreed with, and why. And if they wander off in obfuscation, that's easy enough to point out. --- That said: bugai - You have made a number of unsupported statements. - "The humans emit just 5% of the total CO2 influx. This is nothing and could increase the CO2 percentage in the air by the same 5%, no more." Incorrect - a 5% input sustained over centuries, with an observed atmospheric annual increase equal to roughly half of the anthropogenic contribution, certainly shows the anthropogenic input driving atmospheric CO2 rise. See the IPCC CO2 attribution section for any number of references. - "...where tau is the relaxation time. We know that tau is somewhere between 5 and 10 Years." Absolutely incorrect. Single molecular residence time is on the order of 5 years - you are conflating that with adjustment time, which is ~70 years halflife as a short term adjustment, with a several thousand year tail, due to the rates of rebalancing the CO2 input to the atmosphere and the multiple pathways. See the IPCC carbon cycle drawdown section. - "These (plankton die-off, ocean warming) are the two main reasons for CO2 rise, not the tiny emission by the fuel combustion" Sorry, unsupportable statement contradicted by all the science. We know the rates for those, and for anthropogenic emissions, and the math just doesn't support this claim. I hate to say this, bugai, but none of your statements on this topic have been supportable (yet - I have hopes). They all sound good, but the data shows otherwise. Skepticism starts with ones own closely held ideas...
  15. @KR: You say "Incorrect - a 5% input sustained over centuries..." Certainly incorrect. Antropogenic CO2 source: In year 2005: 30 billion tons. In year 1945: 5 billion tons. In year 1850: 0.1 billion tons. "Centuries" of 5% emission? Assuming a constant natural CO2 source, the antropogenic CO2-source was just miniscule 0.9% at 1945. And - (-Snip-) - the striking 0.01% antropogenic emissions there leading to the end of LIA! 2. - "These (plankton die-off, ocean warming) are the two main reasons for CO2 rise, not the tiny emission by the fuel combustion" Sorry, unsupportable statement contradicted by all the science. We know the rates for those, and for anthropogenic emissions, and the math just doesn't support this claim. ///////// You know the exact rates? Put them forward.
    Response:

    [DB] Inappropriate tone snipped.

  16. bugai - One thing at a time, for the moment. Current anthropogenic CO2 contribution: ~29GT/year. Current yearly atmospheric CO2 accumulation: 2ppm/yr or ~14GT/year. delta CO2 (D) = Sources (S) - Sinks (K) D = (anthro S + natural S) - (anthro K + natural K) D = (aS + nS) - (aK + nK) = 14GT/yr [ for convenience ] Anthropogenic sinks (aK) are essentially zero. If we subtract anthropogenic sources (aS) from both sides of the equation: -15GT/year = nS - nK Natural sinks > Natural sources by ~15GT/year at present. So without our contribution to atmospheric CO2, CO2 levels would be declining by >2ppm/year right now. Hence we are indeed responsible for increasing atmospheric CO2. Early in the industrial revolution, anthropogenic contributions were much lower, but the imbalance in CO2 was much smaller, hence the natural sink of CO2 driven by that imbalance was smaller as well. See the history of emissions and CO2 levels for that relationship. Nature is acting as a net sink - anthropogenic contributions are responsible for rising CO2 levels. That's "1st class school math" - any disagreements?
  17. KR sure, as it happens we were almost there: step #1 The carbon cycle obeys conservtion of mass, so the annual rise in atmospheric CO2 is equal to total emissions minus total uptake step #2 We can write this as ΔC = E_a + E_n - U_n where ΔC is the annual increase in CO2 E_a is annual anthropogenic emissions E_n is annual emissions from natural sources U_n is annual uptake by natural sinks all of these quantities are of course positive. Step #3 rearranging ΔC - E_a = E_n - U_n Step #4 if the left hand side is negative, then the right hand side is negative, so if E_a > ΔC then we know that U_n > E_n also I'm assuming that bugai agrees with this as (i) it is elementary mathematics, and (ii) he had plenty of opportunity to say it was wrong but didn't. Step #5 - look at the data. The blue line is E_a, the red line is ΔC, and the green line is E_n - U_n estimated by ΔC - E_a. The data are all freely available from the Carbon Dioxide Information and Analysis Center (here, here and here). This clearly shows that E_a > ΔC and so we know that U_n > E_n. In other words we know that environmental uptake has exceeded environmental emissions every year for the last fifty years at least, and hence has been opposing, rather than causing the observed atmospheric increases. Bugai only had one step left to go, pity he preferred to be obstinate. So bugai, you have three options: (i) demonstrate that step 5 is incorrect (ii) demonstrate that the natural environment can be the cause of the observed rise even though it is a net carbon sink (iii) agree that the observed rise is not a natural phenomenon.
  18. bugai#181: "You cannot see "diurnal" osciillations there, but certainly the seasonal ones." Perhaps you should study the literature on CO2 monitoring a bit more, rather than make quite so many assumptions. Chmura 2005 et al is a good starter, showing that an industrial city is a CO2 source: The CO2 mixing ratios measured in the urban atmosphere revealed quasi-permanent excess concentration of this gas when compared with near-by background atmosphere. The annual mean CO2 concentration recorded in Krakow in 2004 was almost 10% higher than that recorded at high-altitude mountain site (Kasprowy Wierch). Such effect is occuring probably in all urban centers. There is indeed a diurnal signal: In the urban environment, the lowest CO2 mixing ratios are recorded generally during mid-day, when the convective activity of the lower atmosphere and resulting vertical mixing is at its maximum. In contrast, at the mountain site high CO2 mixing ratios are generally recorded during mid-day and early afternoon. This stems from sun-driven convection within the planetary bounday layer over Kasprowy Wierch “sucking” the CO2-laden air from the valleys towards the top of the mountain. In addition, there is an isotopic signature to anthropogenic emissions: Seasonal fluctuations of delta13C visible at both discussed sites are shifted in phase. The Krakow record reveals lowest delta13C values during winter season, when local CO2 emissions due to burning of fossil fuels in the city (heating plus car traffic) are most intense. So the record of CO2 emissions appearing in the atmosphere is unmistakeable. You seem to rest your case on 'it can't be us.' Can you provide anything more substantial than that?
  19. @KR: 1. >>>> Current anthropogenic CO2 contribution: ~29GT/year. Current yearly atmospheric CO2 accumulation: 2ppm/yr or ~14GT/year. delta CO2 (D) = Sources (S) - Sinks (K) D = (anthro S + natural S) - (anthro K + natural K) D = (aS + nS) - (aK + nK) = 14GT/yr [ for convenience ] Anthropogenic sinks (aK) are essentially zero. If we subtract anthropogenic sources (aS) from both sides of the equation: -15GT/year = nS - nK Natural sinks > Natural sources by ~15GT/year at present. <<<<<<< Correct. I agree with these numbers completely. 2. >>>>>> So without our contribution to atmospheric CO2, CO2 levels would be declining by >2ppm/year right now. Hence we are indeed responsible for increasing atmospheric CO2. Early in the industrial revolution, anthropogenic contributions were much lower, but the imbalance in CO2 was much smaller, hence the natural sink of CO2 driven by that imbalance was smaller as well. See the history of emissions and CO2 levels for that relationship. Nature is acting as a net sink - anthropogenic contributions are responsible for rising CO2 levels. That's "1st class school math" - any disagreements? <<<<<<< Disagree. If we switch out antropogenic CO2 source abruptly, the CO2 levels would be declining by >2ppm/year just for the relaxation time: the 5 years. Then CO2 level change due to antropogenic source will relax completely and the CO2 level will be moving - in whatever direction! - by the disbalance of the natural sources and sinks. Because we destroy the CO2 sink by pollution of the oceans, after 5 years have passed, the CO2 level will continue to rise at the same rate as it does now.
  20. @Dikran Marsupial: This is a point we disagree. >>>> (i) demonstrate that step 5 is incorrect The formula is perfectly correct. >>>> (ii) demonstrate that the natural environment can be the cause of the observed rise even though it is a net carbon sink Yes, it is. I know, you do not like differential equations, but we do need them to understand the problem. We write: dC/dt = E_a + E_n - U_n Certainly, U_n > E_a, and still it is the nature that is responsible for the CO2 rise. Not far from equilibrium we can write for the natural sink: U_n = C/T where T is the relaxation time, in our case somewhere 5-10 years. It is not constant, but depends on the state of the sink (ocean pollution). So, we write T(t). If we monitor CO2 on time scales larger than the relaxation time, dC/dt << C/T, the quasistatic (but time-dependent!) CO2 level is C(t) = (E_n(t) + E_a(t))/T(t) It is the change in T(t) that drives the CO2-level in the atmosphere, not E_a. here Sn is the natural source, Sa (iii) agree that the observed rise is not a natural phenomenon. 1. >>>> Current anthropogenic CO2 contribution: ~29GT/year. Current yearly atmospheric CO2 accumulation: 2ppm/yr or ~14GT/year. delta CO2 (D) = Sources (S) - Sinks (K) D = (anthro S + natural S) - (anthro K + natural K) D = (aS + nS) - (aK + nK) = 14GT/yr [ for convenience ] Anthropogenic sinks (aK) are essentially zero. If we subtract anthropogenic sources (aS) from both sides of the equation: -15GT/year = nS - nK Natural sinks > Natural sources by ~15GT/year at present. <<<<<<< Correct. I agree with these numbers completely. 2. >>>>>> So without our contribution to atmospheric CO2, CO2 levels would be declining by >2ppm/year right now. Hence we are indeed responsible for increasing atmospheric CO2. Early in the industrial revolution, anthropogenic contributions were much lower, but the imbalance in CO2 was much smaller, hence the natural sink of CO2 driven by that imbalance was smaller as well. See the history of emissions and CO2 levels for that relationship. Nature is acting as a net sink - anthropogenic contributions are responsible for rising CO2 levels. That's "1st class school math" - any disagreements? <<<<<<< Disagree. If we switch out antropogenic CO2 source abruptly, the CO2 levels would be declining by >2ppm/year just for the relaxation time: the 5 years. Then CO2 level change due to antropogenic source will relax completely and the CO2 level will be moving - in whatever direction! - by the disbalance of the natural sources and sinks. Because we destroy the CO2 sink by pollution of the oceans, after 5 years have passed, the CO2 level will continue to rise at the same rate as it does now.
  21. bugai wrote "If we switch out antropogenic CO2 source abruptly, the CO2 levels would be declining by >2ppm/year just for the relaxation time: the 5 years." It has been pointed out to you repeatedly that the relaxation time is not five years, the residence time is five years. They are not the same thing. Perhaps you would like to look up lieftime in the glossary of the IPCC WG1 report and tell us what it says there.
  22. bugai - "If we switch out antropogenic CO2 source abruptly, the CO2 levels would be declining by >2ppm/year just for the relaxation time: the 5 years." And now we're on step 2, your conflation of molecular residence time with atmospheric concentration adjustment time. I'll now refer you (again) to the IPCC 7.3.4.2 Carbon Cycle Feedbacks to Changes in Atmospheric Carbon Dioxide, which actually examines these rates for various sequestration pathways. Short term adjustments to CO2 imbalance have about a 37-40 year half-life, with a very long tail once pH buffering tapers off and biological sequestration and geologic impoundment take over. [ Source ] See also the IPCC glossary for "Lifetime", as Dikran mentions, here, on page 948. Again - residence time for individual molecules is quite short. But in the presence of bi-directional exchanges, it is not the concentration adjustment rate. That's a common mistake - but it's a mistake.
  23. bugai So you think that the natural environment has caused the rise in atmospheric CO2 even though it has taken more carbon dioxide out of the atmosphere every year than it has put in? You are essentially saying that the natural environment has caused the rise in atmospheric CO2 by taking CO2 out of the atmosphere. Do you realise how absurd that sounds? You assume "Not far from equilibrium we can write for the natural sink: U_n = C/T" however, the carbon cycle is no where near equilibrium, we are currently 100ppmv over the pre-industrial equilibrium that had held for several thousand years at least. You are basing your argument yet again on the asumption that the relaxation time is 5 years. This is incorrect, the residence time is 5 years, the relaxation time (as you call it) is much longer. I have done the differential equations, and they give a figure of 74 years.
  24. Dikran - What level of decay are you looking at for adjustment time? 20%? Reason why I'm asking: Given 2ppm/year decay scaled to imbalance, and an imbalance of ~100ppm, I get a half-life of 34 years (38 years for 2ppm and 110ppm imbalance), decaying to 20% at ~79 years, assuming a single exponential decay model. Granted, that's wrong, as only the initial decay is primarily the ocean pH adjustment, and longer term exponentials for shell sequestration and deposition are going on at the same time... so the actual decay will take 100's to thousands of years. But I've found showing the fastest possible exponential decay to be useful in these discussions.
  25. From previous post: half-life of 34.66 years. Half life = ln(2)/rate = ln(2)/0.02% = ~34.66

Prev  1  2  3  4  5  6  7  8  9  10  11  12  13  14  Next

Post a Comment

Political, off-topic or ad hominem comments will be deleted. Comments Policy...

You need to be logged in to post a comment. Login via the left margin or if you're new, register here.

Link to this page


The Consensus Project Website

THE ESCALATOR

(free to republish)


© Copyright 2024 John Cook
Home | Translations | About Us | Privacy | Contact Us