Climate Science Glossary

Term Lookup

Enter a term in the search box to find its definition.

Settings

Use the controls in the far right panel to increase or decrease the number of terms automatically displayed (or to completely turn that feature off).

Term Lookup

Settings


All IPCC definitions taken from Climate Change 2007: The Physical Science Basis. Working Group I Contribution to the Fourth Assessment Report of the Intergovernmental Panel on Climate Change, Annex I, Glossary, pp. 941-954. Cambridge University Press.

Home Arguments Software Resources Comments The Consensus Project Translations About Support

Bluesky Facebook LinkedIn Mastodon MeWe

Twitter YouTube RSS Posts RSS Comments Email Subscribe


Climate's changed before
It's the sun
It's not bad
There is no consensus
It's cooling
Models are unreliable
Temp record is unreliable
Animals and plants can adapt
It hasn't warmed since 1998
Antarctica is gaining ice
View All Arguments...


Username
Password
New? Register here
Forgot your password?

Latest Posts

Archives

Sun & climate: moving in opposite directions

What the science says...

Select a level... Basic Intermediate Advanced

The sun's energy has decreased since the 1980s but the Earth keeps warming faster than before.

Climate Myth...

It's the sun

"Over the past few hundred years, there has been a steady increase in the numbers of sunspots, at the time when the Earth has been getting warmer. The data suggests solar activity is influencing the global climate causing the world to get warmer." (BBC)

At a glance

Thankfully for us, our Sun is a very average kind of star. That means it behaves stably over billions of years, steadily consuming its hydrogen fuel in the nuclear reaction that produces sunshine.

Solar stability, along with the Greenhouse Effect, combine to give our planet a habitable range of surface temperatures. In contrast, less stable stars can vary a lot in their radiation output. That lack of stability can prevent life, as we know it, from evolving on any planets that might orbit such stars.

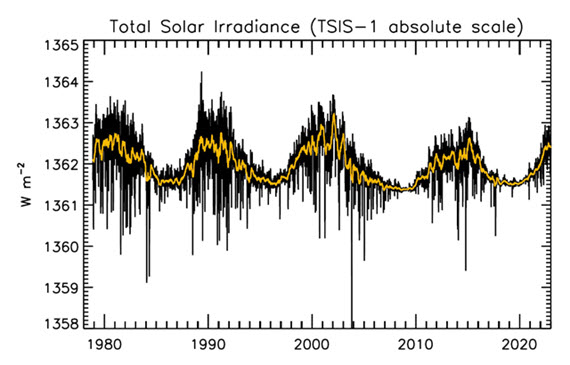
That the Sun is a stable type of star is clearly demonstrated by the amount of Solar energy reaching Earth's average orbital position: it varies very little at all. This quantity, called the Total Solar Irradiance, has been measured for around forty years with high accuracy by sensitive instruments aboard satellites. Its average value is 1,362 watts per square metre. Irradiance fluctuates by about a watt either way, depending on where we are within the 11-year long sunspot cycle. That's a variation of no more than 0.15%.

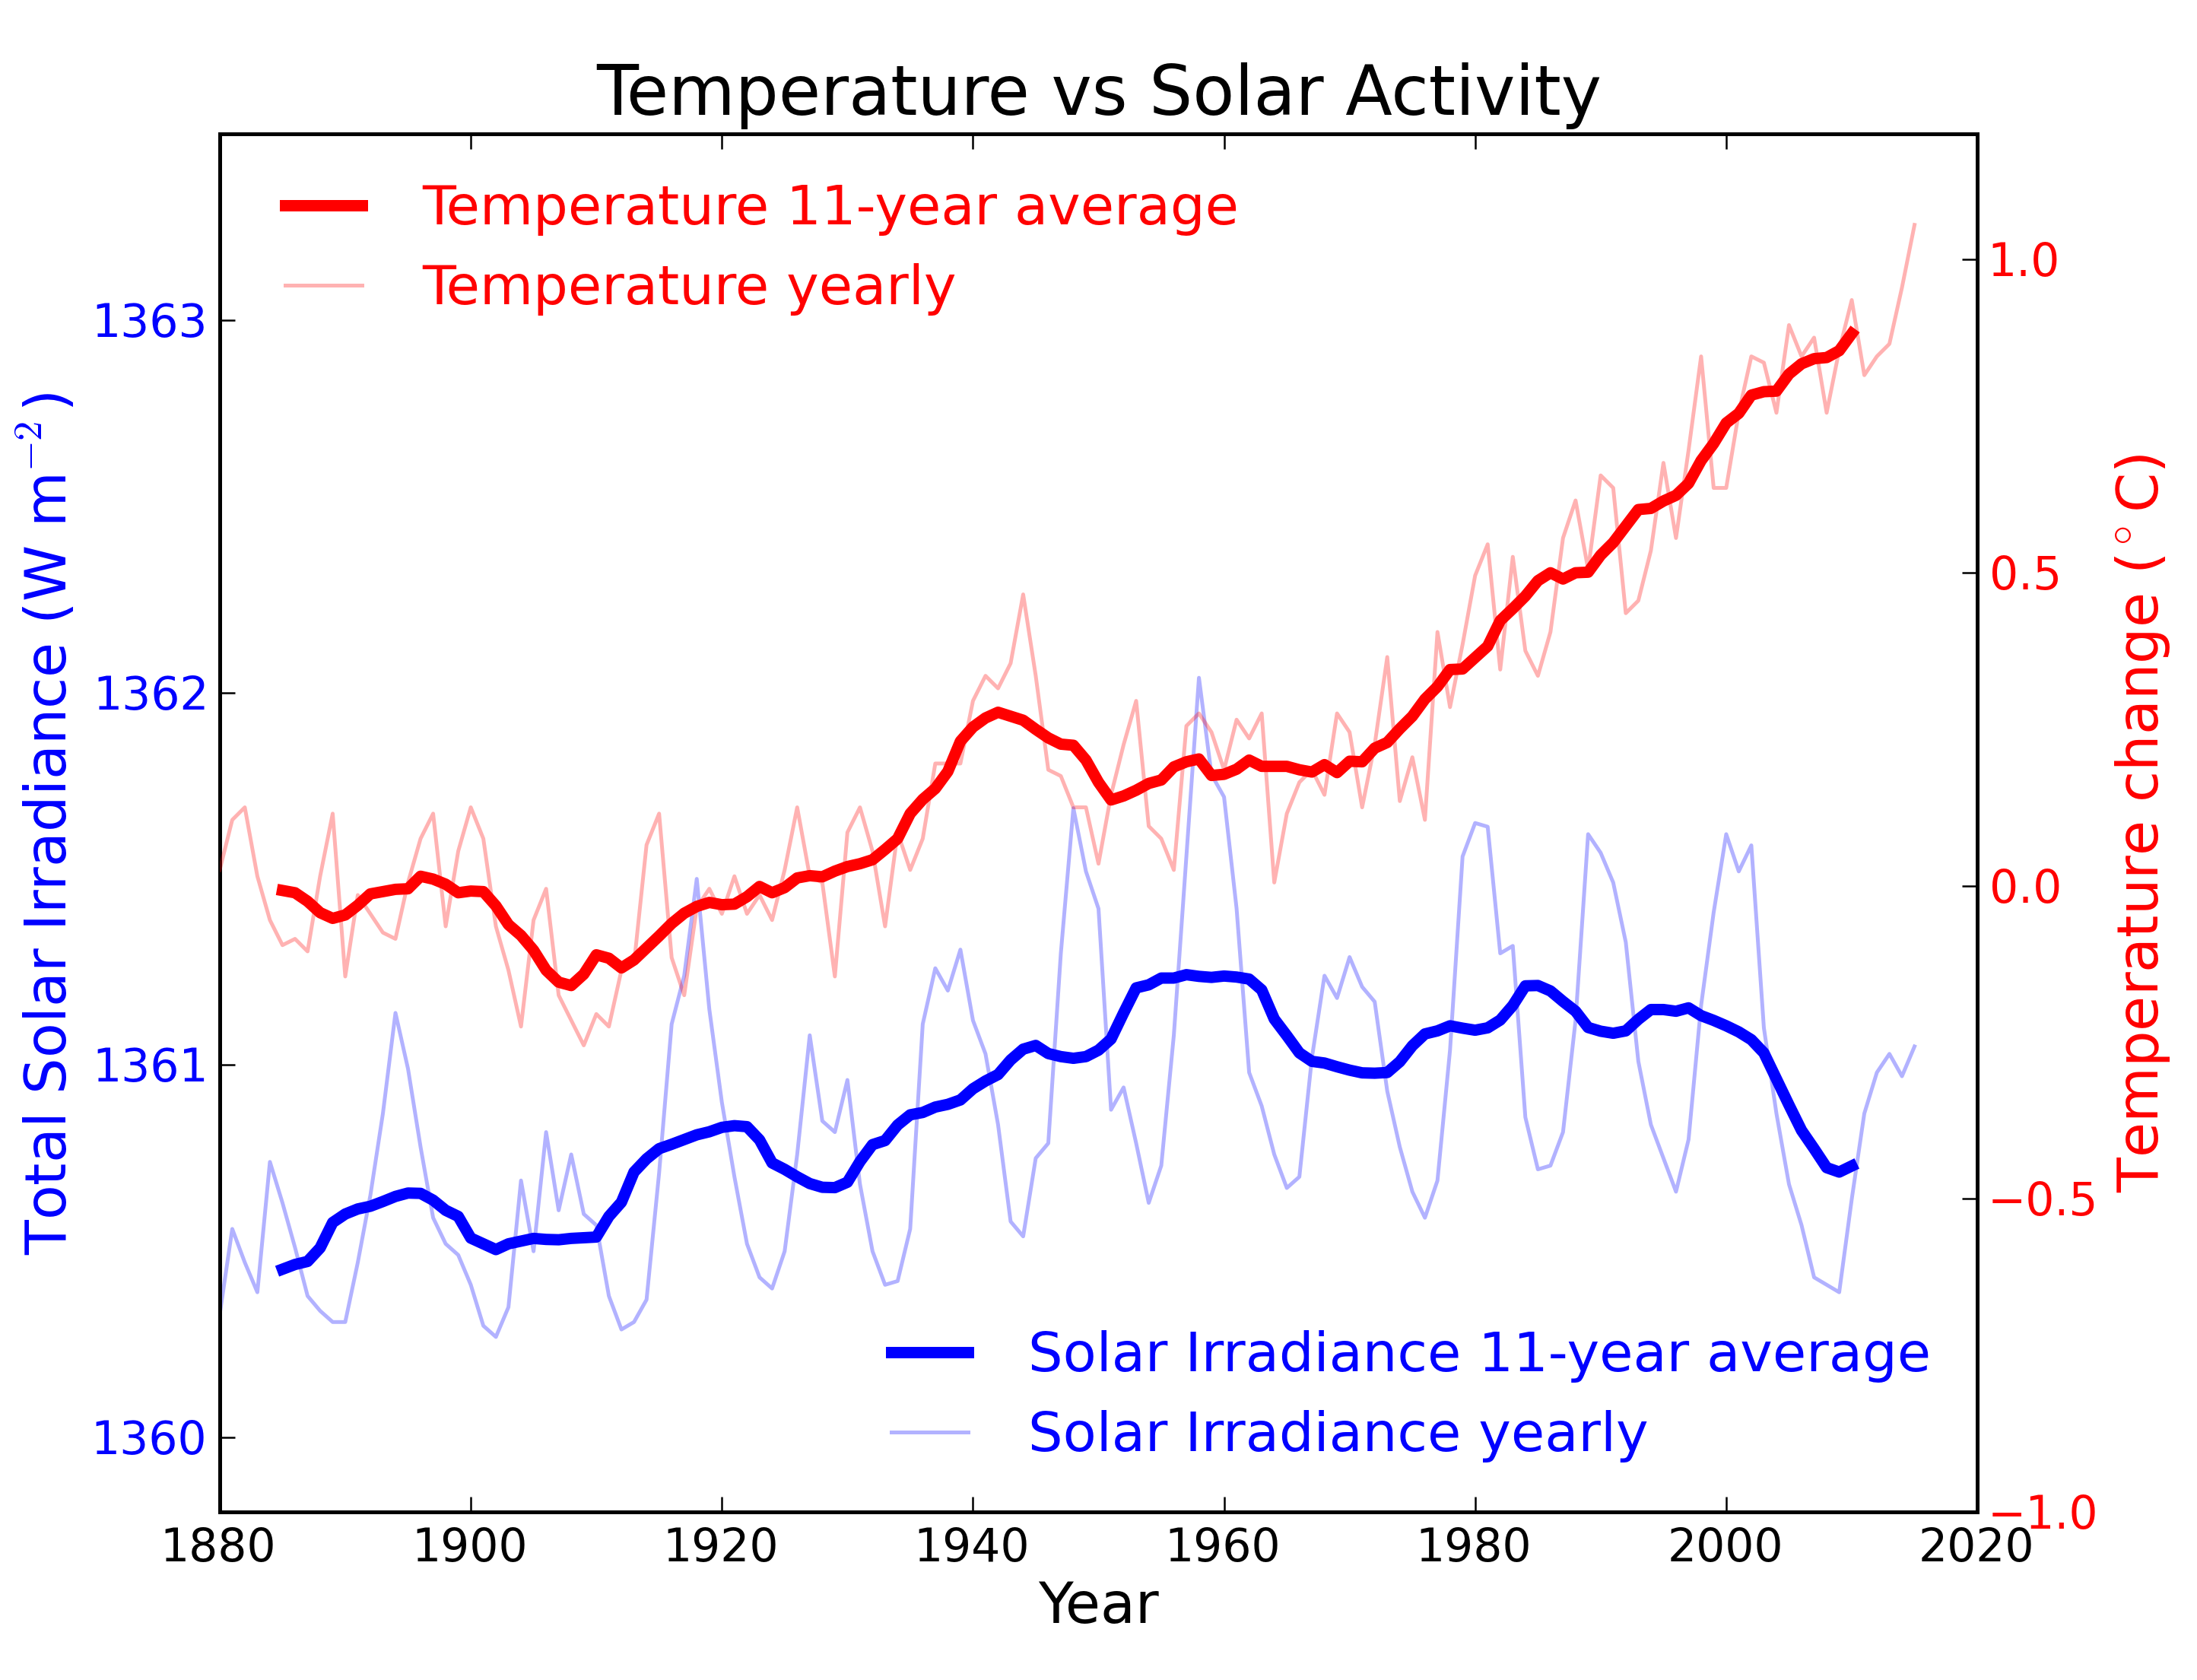
From the early 1970s until today, the Solar radiation reaching the top of Earth's atmosphere has in fact shown a very slight decline. Through that same period, global temperatures have continued to increase. The two data records, incoming Solar energy and global temperature, have diverged. That means they have gone in opposite directions. If incoming Solar energy has decreased while the Earth continues to warm up, the Sun cannot be the control-knob of that warming.

Attempts to blame the sun for the rise in global temperatures have had to involve taking the data but selecting only the time periods that support such an argument. The remaining parts of the information - showing that divergence - have had to be ditched. Proper science study requires that all the available data be considered, not just a part of it. This particular sin is known as “cherry-picking”.

Please use this form to provide feedback about this new "At a glance" section, which was updated on May 27, 2023 to improve its readability. Read a more technical version below or dig deeper via the tabs above!


Further details

Our Sun is an average-sized main sequence star that is steadily using its hydrogen fuel, situated some 150 million kilometres away from Earth. That distance was first determined (with a small error) by a time consuming and complex set of measurements in the late 1700s. It led to the first systemic considerations of Earth's climate by Joseph Fourier in the 1820s. Fourier's number-crunching led him to realise a planet of Earth's size situated that far from the Sun ought to be significantly colder than it was. He was thereby laying the foundation stone for the line of enquiry that led after a few decades to the discovery of what we now call the Greenhouse Effect – and the way that effect changes in intensity as a response to rising or falling levels of the various greenhouse gases.
TSI Solar cycles

Figure 1: Plot of the observational record (1979-2022) on the scale of the TSIS-1 instrument currently flying on the space station. In this plot, the different records are all cross calibrated to the TSIS-1 absolute scale (e.g., the TSIS1-absolute scale is 0.858 W/m^2 higher than the SORCE absolute scale) so the variability of TSI in this plot is considered to be its “true variability” (within cross calibration uncertainties). Image: Judith Lean.

The Sun has a strong magnetic field, but one that is constantly on the move, to the extent that around every 11 years or so, Solar polarity flips: north becomes south, until another 11 years has passed when it flips back again. These Solar Cycles affect what happens at the surface of the Sun, such as the sunspots caused by those magnetic fields. Each cycle starts at Solar Minimum with very few or no sunspots, then rises mid-cycle towards Solar Maximum, where sunspots are numerous, before falling back towards the end. The total radiation emitted by the Sun – total solar irradiance (TSI) is the technical term – essentially defined as the solar flux at the Earth's orbital radius, fluctuates through this 11-year cycle by up to 0.15% between maximum and minimum.

Such short term and small fluctuations in TSI do not have a strong long term influence on Earth's climate: they are not large enough and as it's a cycle, they essentially cancel one another out. Over the longer term, more sustained changes in TSI over centuries are more important. This is why such information is included, along with other natural and human-driven influences, when running climate models, to ask them, “what if?"

An examination of the past 1150 years found temperatures to have closely matched solar activity for much of that time (Usoskin et al. 2005). But also for much of that time, greenhouse gas concentrations hardly varied at all. This led the study to conclude, "...so that at least this most recent warming episode must have another source."
TSI vs. T
Figure 2: Annual global temperature change (thin light red) with 11 year moving average of temperature (thick dark red). Temperature from NASA GISS. Annual Total Solar Irradiance (thin light blue) with 11 year moving average of TSI (thick dark blue). TSI from 1880 to 1978 from Krivova et al. 2007. TSI from 1979 to 2015 from the World Radiation Center (see their PMOD index page for data updates). Plots of the most recent solar irradiance can be found at the Laboratory for Atmospheric and Space Physics LISIRD site.

The slight decline in Solar activity after 1975 was picked up through a number of independent measurements, so is definitely real. Over the last 45 years of global warming, Solar activity and global temperature have therefore been steadily diverging. In fact, an analysis of solar trends concluded that the sun has actually contributed a slight cooling influence into the mix that has driven global temperature through recent decades (Lockwood, 2008), but the massive increase in carbon-based greenhouse gases is the main forcing agent at present.

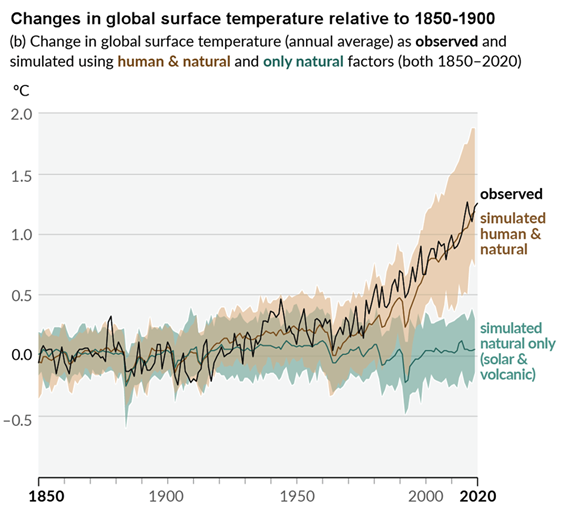
Other studies tend to agree. Foster & Rahmstorf (2011) used multiple linear regression to quantify and remove the effects of the El Niño Southern Oscillation (ENSO) and solar and volcanic activity from the surface and lower troposphere temperature data.  They found that from 1979 to 2010, solar activity had a very slight cooling effect of between -0.014 and -0.023°C per decade, depending on the data set. A more recent graphic, from the IPCC AR6, shows these trends to have continued.

AR6 WGI SPM Figure 1 Panel p

Figure 3: Figure SPM.1 (IPCC AR6 WGI SPM) - History of global temperature change and causes of recent warming panel (b). Changes in global surface temperature over the past 170 years (black line) relative to 1850–1900 and annually averaged, compared to Coupled Model Intercomparison Project Phase 6 (CMIP6) climate model simulations (see Box SPM.1) of the temperature response to both human and natural drivers (brown) and to only natural drivers (solar and volcanic activity, green). For the full image and caption please click here or on the image.

Like Foster & Rahmstorf, Lean & Rind (2008) performed a multiple linear regression on the temperature data, and found that while solar activity can account for about 11% of the global warming from 1889 to 2006, it can only account for 1.6% of the warming from 1955 to 2005, and had a slight cooling effect (-0.004°C per decade) from 1979 to 2005.

Finally, physics does not support the claim that changes in TSI drive current climate change. If that claim had any credence, we would not expect to see the current situation, in which Earth's lower atmosphere is warming strongly whereas the upper atmosphere is cooling. That is exactly the pattern predicted by physics, in our situation where we have overloaded Earth's atmosphere with greenhouse gases. If warming was solely down to the Sun, we would expect the opposite pattern. In fact, the only way to propagate this myth nowadays involves cherry-picking everything prior to 1975 and completely disregarding all the more recent data. That's simply not science.

Longer-term variations in TSI received by Earth

It's also important to mention variations in TSI driven not by Solar energy output but by variations in Earth's orbit, that are of course independent of Solar activity. Such variations, however, take place over very long periods, described by the Milankovitch orbital cycles operating over tens of thousands of years. Those cycles determine the distance between Earth and the Sun at perihelion and aphelion and in addition the tilt the planet's axis of rotation: both affect how much heat-radiation the planet receives at the top of its atmosphere through time. But such fluctuations are nothing like the rapid changes we see in the weather, such as the difference between a sunny day and a cloudy one. The long time-factor ensures that.

Another even more obscure approach used to claim, "it's the sun" was (and probably still is in some quarters) to talk about, "indirect effects". To wit, when studies can't find a sufficiently large direct effect, bring even lesser factors to the fore, such as cosmic rays. Fail.

In conclusion, the recent, post 1975 steep rise in global temperatures are not reflected in TSI changes that have in fact exerted a slight cooling influence. Milankovitch cycles that operate over vastly bigger time-scales simply don't work quickly enough to change climate drastically over a few decades. Instead, the enormous rise in greenhouse gas concentrations over the same period is the primary forcing-agent. The physics predicted what is now being observed.

Last updated on 27 May 2023 by John Mason. View Archives

Printable Version  |  Offline PDF Version  |  Link to this page

Argument Feedback

Please use this form to let us know about suggested updates to this rebuttal.

Related Arguments

Further viewing

Related video from Peter Sinclair's "Climate Denial Crock of the Week" series:

Further viewing

This video created by Andy Redwood in May 2020 is an interesting and creative interpretation of this rebuttal:

Myth Deconstruction

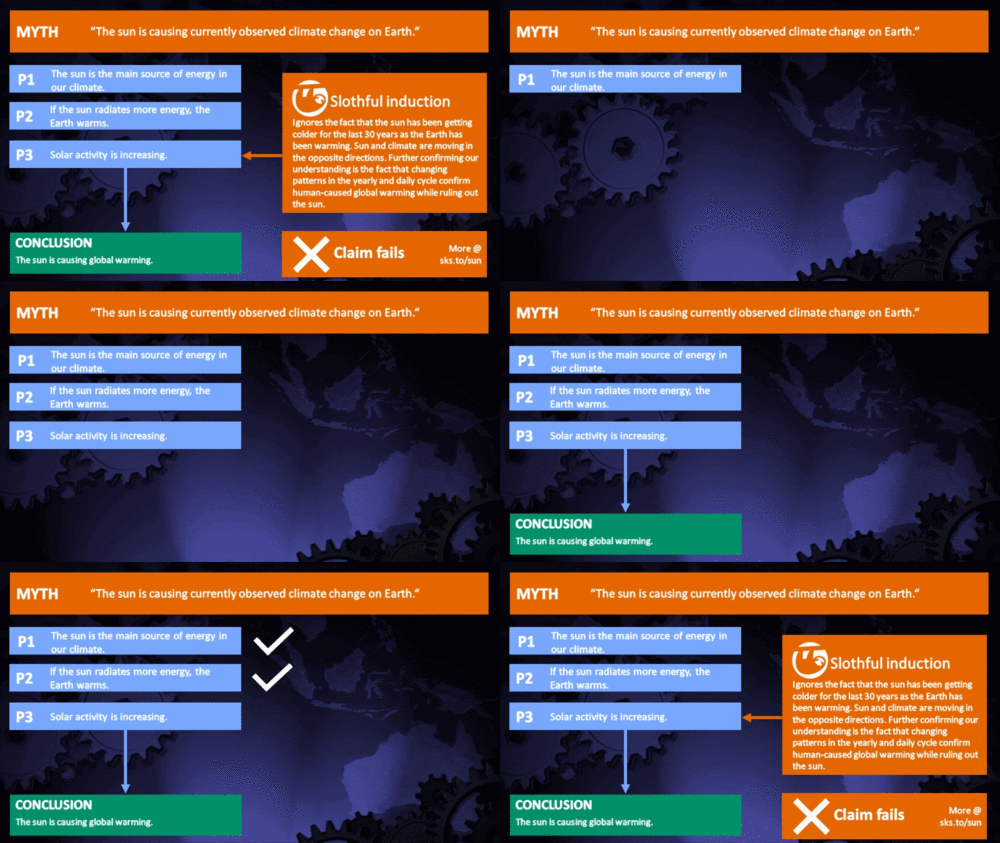
Related resource: Myth Deconstruction as animated GIF

MD Sun

Please check the related blog post for background information about this graphics resource.

Denial101x videos

Related lecture-videos from Denial101x - Making Sense of Climate Science Denial

and

Additional video from the MOOC

Expert interview with Mike Lockwood

Comments

Prev  22  23  24  25  26  27  28  29  30  31  32  33  34  35  36  37  38  39  40  41  Next

Comments 776 to 800 out of 1035:

  1. #775 I did read the "What the Science Says." The article is is not factually correct. Do you disagree with the NASA study? Do you disagree that average solar activity levels 1950-2000 are higher compared to those for 1900-1950?
    Response: [Daniel Bailey] Then you should read the Advanced version. Seems obvious to me (graphic from NASA/Solanki/PMOD data):
  2. Please explain how a decreasing solar irradiance yields an increasing global temperature.
  3. Read the article, not just the one-liner summary.
  4. #776: "disagree that average solar activity levels 1950-2000 are higher" Yep. See Deep solar minimum (from 2009) which reports: A 50-year low in solar wind pressure A 12-year low in solar "irradiance" A 55-year low in solar radio emissions
  5. #779: Please see Historical Total Solar Irradiance and type in 1900.5 to 2009.5. The historical TSI reconstruction shows five 11-year solar cycles between 1900-1950 and five between 1955-2005. Clearly, the five cycles after 1950 were more active than the five pre-1950 cycles. I agree that cycle 24 is unusually quiet and supports my thesis that the Sun does influence global surface temperatures. In this case, if cycle 24 is longer and weaker than previous (21-23), then we may see subsequent global cooling in response. It's interesting to note that the solar max in 1970 (cycle 20) was relatively weak. I remember the "Big Freeze" in 1977 when the Chesapeake Bay froze over.
  6. thepoodlebites - Certainly, if the sun goes into a less active phase there will be an influence on climate. However, given the low amount of such solar variation, the effects of such variation are going to be tiny compared to CO2. See What would happen if the sun fell to Maunder Minimum levels, and also the comparative values of forcings here - I find Figure 2a very clear. I believe you've been pointed to these items previously. Global cooling? No. Warming perhaps a little slower if solar variation reaches a low? Yes.
  7. Nobody is arguing that variations in solar irradiance have no effect on the global temperature, rather that the effect from the enhanced greenhouse effect is larger.
  8. #781: When you get a chance, please fix the link to the original paper Feulner and Rahmstorf. Let's see, assume a minimal response to reduced solar irradiance (0.025 C), an enhanced response to CO2 doubling (3.4 C), plug these assumptions into the CLIMBER-3a model, and the model results support the assumptions. This result is a faulty form of reasoning that assumes the conclusions in the premises, i.e., circulus in probando. Thank you for such a wonderful example of circular reasoning in climate science. Not to mention that irradiance variations in the UV are not represented. And what is the uncertainty in the temperature predictions? Let's be reasonable, the atmospheric response to CO2 doubling may be (0.5 C), See Lindzen and Choi. Even the lower range of the IPCC CO2 doubling (2 C) is too high. Talk about over-forecasting. What do they say in meteorology? I think that your forecast is a bust.
  9. #783: "a wonderful example" How is this circular? Assumptions for model inputs are required to run the models. The question tested is one aspect of the model -- the change in solar activity (On the effect of a new grand min is part of the title) in the presence of other forcings. Lindzen and Choi have been dealt with elsewhere ad nauseum. Here's a bit of free advice: Don't cite a source without checking to see if its been rebutted. I learned that one the hard way, back in the days of oral exams.
  10. thepoodlebites - You might want to take a look at a discussion of Lindzen and Choi, as well as How sensitive is our climate, where this comment belongs (minus the circular reasoning accusation). Multiple lines of reasoning, including both model runs that accurately reproduce past climate behavior, as well as empirical evidence such as seasonal swings and historic data, all point to a sensitivity of 2 to 4.5°C, most likely 3°C. So - going with a dis-proven outlier whose results agree with "business as usual"? Or considering that a lot of very smart people agree on a particular range? Personally, I consider the former to be wishful thinking... your mileage may vary.
  11. #785: Thank you for the link to the Lindzen and Choi 2009 paper. Sorry, my bad. I have found a pre-print of the 2010 update submitted to the Journal of Geophysical Research, On the observational determination of climate sensitivity and its implications. I think that the revised estimate is 1 C. I prefer an observational based determination rather than model driven predictions. Do you have a cite for your empirical evidence for climate sensitivity to CO2? As to circular reasoning, finding problems with Lindzen's 2009 approach does not address the problems with Feulner and Rahmstorf, assuming the conclusions in the premises. How about the uncertainty in the 2100 temperature predictions? How about the NASA study, the Sun does contribute to global warming, 25%. I still think that your predictions are a bust based on the surface record to date. And "business as usual" is a very important point, but it is off-topic here and best left unsaid.
  12. thepoodlebites - I've replied over on Is climate sensitivity low, the appropriate thread for that discussion.
  13. #787: Please, not the shotgun approach. Pick one or two papers, give me your favorite, an observationally based estimate of climate sensitivity to a doubling of CO2. The Feulner and Rahmstorf paper used 3.4 C, from A. Levermann, private communication, 2010.
  14. I am sure most here may not check the Astronomy sites unless they have a specific interest, but I thought you might all like to read this article. Improved measurements of Sun to advance understanding of climate change The article details the launch of a new satellite to more accurately measure total solar irradience so that better calculations can be made as to how much the Sun either does or does not contribute to the changing climate. From a selfish point of view, it should help astronomers better understand the Standard Solar Model which has some faults to it and thus enable us to get a better and more accurate model of the Sun, which would also help climate forecasting.
  15. LandyJim, We are well aware of ongoing efforts to better understand solar astronomy. Did you have point beyond asserting we just aren't as up-to-speed as you?
  16. #790 For starters, Mr. Cook should update Figure 1, replace the PMOD data with the new LASP data. The TIM instrument has measured a lower and more accurate TSI (1360.8) for solar min than PMOD. And the LASP historical TSI reconstructions show no decrease in TSI over the last three solar cycles (21-23).
  17. Hi all, I have a friend who constantly bangs on about Piers Corbyn and his site ‘Climate Action’. Sadly I have very little time to research Corbyn’s claims. I was wondering if anyone has analysed Corbyn’s weather predictions comparing them to the main weather predictions of places like the met office and also his claims about making money by placing bets on future weather. I know this is about weather but Piers definitely believes AGW is a myth. Could someone look into his claims and perhaps do an article on him. There seems to be very little objective research done on his claims... that I can find anyway. We have Monckton Myths how about Corbyn’s Crocks? I posted here because I know Corbyn thinks its all about the sun.
  18. Johngee, it seems to me that Mr Corbyn is always predicting freezing, Arctic-like conditions and so, like a broken clock telling the correct time twice a day by accident, so does Mr Corbyn. However, he hasn't been doing so good this year, as the following forecasts show : December 09: Wet and windy start giving way to severe Arctic blasts with heavy snow and blizzards in parts. Turning mild or very mild later – a ‘green’ Christmas before colder year end. I recall December being very cold, the coldest in a hundred years or something, but still he got it wrong. Ferocious and dangerous winter weather [for January 2011] Um, quite the opposite actually. [February] Overall much colder than normal with snowy Northerly / Easterly blasts at times Well, not so far, anyway but who is going to rely on that being correct...except by accident ! Jan AND Feb will be unusually cold in Britain, Ireland, & Europe Maybe I've been lucky not to have experienced any of that here in London ? Generally, the tone of his 'scientific predictions' and his website can be surmised from the following text, taken directly from the source : Constant references to 'ClimateGate News' ● ‘Global Warming’ forecasts will fail AGAIN. ● ‘ManMade Climate Change’ is failed science based on fraudulent data ● Gordon Brown & all politicians, please, PROVE IT or DROP IT ● 2010 is the year of the fight for evidencebased science & policy ● Carbon Trading & all CO2 reduction schemes must stop. ● ‘Warmers’ flee from challenge to present evidence for CO2 case. ● CO2 theory lies refuted by science fact ● ‘ManMade Climate Change’ scam now ignominiously doomed Hmmm...
  19. TIS... (From previous thread) What you are missing saying that the planet warms and cools 4C during the year is the trend. Take that same monthly series that I linked from NOAA and plot it on a graph. You see the series rise and fall the ~4C that you state. But read the rest of the page. This data is the basis for the anomaly. As the the planet warms that same series you plotted is moving upward. All the datasets plot this. UAH, RSS, GISS, CRU... They are all taking this annual cycle into account.
  20. Another observation re TIS' comment: "Explain the warmer July to me without using geography. ... if accurate, it does prove that geography plays a very strong role in global temperature." That's hardly an adequate 'proof.' But let's play with it anyway. Here's something that doesn't appeal to geography: Your statement 'the earth gets more energy in winter than in summer' clearly refers only to incoming solar radiation. It is certainly true that the peak value of solar insolation averaged across all latitudes at the time of perihelion (winter) is 7% greater than at aphelion (in summer), but isn't that primarily because the earth is closer to the sun in winter? However, basic Physical Geography (the name of textbooks, not part of the explanation) gives the control on temperature as the net radiation: the sum of incoming (daytime) and outgoing (nighttime). For example, this is London: --from physicalgeography.net During the winter months, outgoing longwave radiation actually exceeds incoming insolation producing negative net radiation values. The linked page gives examples for several other locations. So when length of day is taken into account, the 7% additional energy 'received' in winter is radiated away during those long winter nights; winters are colder than summer.
  21. It's so clear what is happening with TIS, and I see it in so many others who hold his position. They are in this constant process of confirmation bias. They start with the conclusion that AGW can't be correct and waltz through their way through the science locating the points that support that position. What they don't do is push past any of those points to fully understand the science because that endangers the conclusion they want to find.
  22. Rob, I often see this in students. They take a position based on something they've heard (or, sadly, been told by a parent or prior teacher) and cling to it no matter what. If, after a little Socratic give-and-take, you can see their doubt level rising, you can make a difference. However, some are afraid to simply admit that they've been misinformed or are just plain wrong. In the case of some of the most ardent skeptics, clinging to a pre-conceived notion frequently results in highly unscientific thinking -- and down goes credibility. In a case like this, realizing that net radiation is what matters leads to the next logical step: if we reduce the earth's outgoing radiation, the planet must warm. But that requires a greenhouse effect ... and that violates the pre-conceived notion. Illogical, does not compute!
  23. muoncounter @795, I'm afraid you are showing a Northern Hemisphere bias. Perihelion is not winter, but winter in the Northern Hemisphere, while being summer in the Southern Hemisphere. The reverse is true of aphelion. And the interesting facts about solar radiation and outgoing radiation that you point to apply approximately to all temperate and polar locations, regardless of their location in either the Southern or Northern Hemisphere, so it is not in itself the explanation of the phenomenon. This is complicated by geography, which influences the rate at which heat is transferred from the tropics to the poles. London, sitting close to a branch of the Gulf Stream, for example, will show a smaller (more negative) net radiation because it is substantially warmed by that current. Seattle would show a larger (less negative) net radiation because of the cold current of its coast (I believe). Both of these cities would show a larger net radiation in summer than, for example Moswow which would have hotter summers and cooler winters because of its inland location. In fact, overall the NH would display less of the disreprancy you indicate because of its larger land mass. That means fewer of its locations are close to the coast. It is that fact which in fact accounts for the Earth being warmer at perihelion (the NH summer). Temperature variations are smaller in the SH because so little of its land is far from the ocean, and there is so much more ocean. The greater heat capacity results in a smaller overall seasonal fluctuation in temperature. That means the NH seasonal fluctuation dominates overall, resulting in greater warmth during the NH summer, which coincidentally is at the moment during aphelion.
  24. Tom Curtis at 08:57 AM , I agree with the idea that geography is a factor and have posted on it on some other threads. I have focused more on the cycles such as ENSO which some people feel balances out once a cycle is complete, ignoring that it is the geographic distribution that determines what conditions each phase brings to a region, and thus all things are not equal, or mirror images of one another. This should be taken into account when considering how this plays into the heating or the cooling of the oceans.
  25. johnd, I was responding to Muoncounter, and to a specific challenge by Inconvenient Sceptic. With regard to ENSO, you are neglecting the fact that ENSO involves a redistribution of heat over depth in the pacific ocean. In particular, the deep warm waters of the Pacific Warm Pool are redistributed across the surface of the tropical Pacific. Therefore, as regards to its primary nature, it balances out in terms of energy distribution. Of course, the ocean interacts with the atmosphere through the surface, so an increased warmth at the surface should show similar feedbacks whether the cause is a change in forcing, or a redistribution of heat from the depths. Therefore we should expect a significant additional warming from El Nino events, and a significant extra cooling from La Nina events; which is what we in fact see. This contradicts denier claims of a low climate sensitivity. This additional warming (or cooling), however, will not introduce a trend to global temperatures because the same feedbacks operating in reverse will remove the additional warmth (or cooling) from an ENSO fluctuation from the atmosphere.

Prev  22  23  24  25  26  27  28  29  30  31  32  33  34  35  36  37  38  39  40  41  Next

Post a Comment

Political, off-topic or ad hominem comments will be deleted. Comments Policy...

You need to be logged in to post a comment. Login via the left margin or if you're new, register here.

Link to this page


The Consensus Project Website

THE ESCALATOR

(free to republish)


© Copyright 2024 John Cook
Home | Translations | About Us | Privacy | Contact Us