


 Arguments


The runaway greenhouse effect on Venus
What the science says...
| Select a level... |
 Basic
Basic
|
 Advanced
| |||
|
Venus very likely underwent a runaway or ‘moist’ greenhouse phase earlier in its history, and today is kept hot by a dense CO2 atmosphere. |
|||||
Climate Myth...
Venus doesn't have a runaway greenhouse effect
"I bought off on the “runaway greenhouse” idea on Venus for several decades (without smoking pot) and only very recently have come to understand that the theory is beyond absurd." (Steve Goddard, WUWT)
At a glance
Earth: we take its existence for granted. But when one looks at its early evolution, from around 4.56 billion years ago, the fact that we are here at all starts to look miraculous.
Over billions of years, stars are born and then die. Our modern telescopes can observe such processes across the cosmos. So we have a reasonable idea of what happened when our own Solar System was young. It started out as a vast spinning disc of dust with the young Sun at its centre. What happened next?
Readers who look up a lot at night will be familiar with shooting stars. These are small remnants of the early Solar System, drawn towards Earth's surface by our planet's gravitational pull. Billions of years ago, the same thing happened but on an absolutely massive scale. Fledgeling protoplanets attracted more and more matter to themselves. Lots of them collided. Eventually out of all this violent chaos, a few winners emerged, making up the Solar System as we now know it.
The early Solar system was also extremely hot. Even more heat was generated during the near-constant collisions and through the super-abundance of fiercely radioactive isotopes. Protoplanets became so hot that they went through a completely molten stage, during which heavy elements such as iron sank down through gravity, towards the centre. That's how their cores formed. At the same time, the displaced lighter material rose, to form their silicate mantles. This dramatic process, that affected all juvenile rocky planets, is known as planetary differentiation.
Earth and Venus are the two largest rocky planets. But at some point after differentiation and solidification of their magma-oceans, their paths diverged. Earth ended up becoming habitable to life, but Venus turned into a hellscape. What happened?
There's a lot we don't know about Venus. But what we do know is that the surface temperature is hot enough to melt lead, at 477 °C (890 °F). Atmospheric pressure is akin to that found on Earth - but over a kilometre down in the oceans. The orbit of Venus may be closer to the Sun but a lot of the sunlight bathing the planet is reflected by the thick and permanent cloud cover. Several attempts to land probes on the surface have seen the craft expire during descent or only a short while (~2 hours max.) after landing.
Nevertheless, radar has been used to map the features of the planetary surface and analyses have been made of the Venusian atmosphere. The latter is almost all carbon dioxide, with a bit of nitrogen. Sulphuric acid droplets make up the clouds. Many hypotheses have been put forward for the evidently different evolution of Venus, but the critical bit - testing them - requires fieldwork under the most difficult conditions in the inner Solar System.
One leading hypothesis is that early on, Venus experienced a runaway water vapour-based greenhouse effect. Water vapour built up in the atmosphere and temperatures rose and rose until a point was reached where the oceans had evaporated. In the upper atmosphere, the water (H2O) molecules were split by exposure to high-energy ultraviolet light and the light hydrogen component escaped to space.
With that progressive loss of water, most processes that consume CO2 would eventually grind to a halt, unlike on Earth. Carbon dioxide released by volcanic activity would then simply accumulate in the Venusian atmosphere over billions of years, creating the stable but unfriendly conditions we see there today.
Earth instead managed to hang onto its water, to become the benign, life-supporting place where we live. We should be grateful!
Please use this form to provide feedback about this new "At a glance" section. Read a more technical version below or dig deeper via the tabs above!
Further details
Venus may have experienced a runaway greenhouse effect in the geological past. To use the term 'runaway' is to refer to a highly specific process when discussed by planetary scientists. Simply having a very hot, high-CO2 atmosphere is not it. So let's start with a tutorial on Venus at the present day.
Venus’ orbit is much closer to the sun, which means it receives almost twice the solar radiation at the top of its atmosphere than Earth. Venus also has a very high albedo which ends up over-compensating for the closer distance to the sun. The result is that less than 10% of that incident solar radiation reaches the surface. High albedo can be attributed to sulphur-bearing compounds, along with minor water vapour (around 20 ppm). These substances form globally encircling sulphuric acid-dominated cloud decks (fig. 1). Venus’ atmosphere also has a surface pressure of around 92 bars (or if you like, 92,000 millibars), equivalent to what you’d feel on Earth beneath more than a kilometre of ocean.
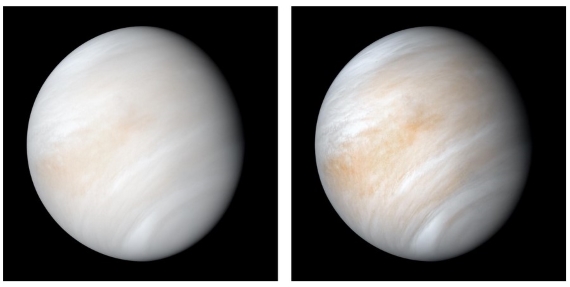
Fig. 1: Venus in its shroud of clouds - a false colour composite created by combining images taken using orange and ultraviolet spectral filters on the Mariner 10 spacecraft's imaging camera.The images used to create this view were acquired in 1974; the RH one has been enhanced to bring out texture and colour. Image: NASA.
Observations of the water vapour content in the Venusian atmosphere show a high heavy to light hydrogen isotopic ratio (D/H). This is best interpreted as the product of a preferential light hydrogen escape to space: deuterium escapes less easily. Venus is considered to have had at least 100 times its current water content in the past (e.g. Selsis et al. 2007 and references therein).
The greenhouse effect on Venus today is primarily caused by CO2, although water vapour and SO2 are important as well. Since most of the radiation that makes its way out to space comes from only the very topmost parts of the atmosphere, it can look as cold as Mars in infra-red (IR) imagery. In reality, the surface of Venus (Fig. 2) is even hotter than the dayside of Mercury, at a deadly 477 °C (890 °F).
Like Earth, the Venusian clouds also generate a greenhouse effect. However, they are poor IR absorbers and emitters compared to water clouds. The sulfuric acid droplets forming the clouds can also scatter IR radiation back to the surface, producing another form of the greenhouse effect in that way. In the dense Venusian CO2-rich atmosphere, there are IR-handling processes at work that are unimportant on modern Earth.
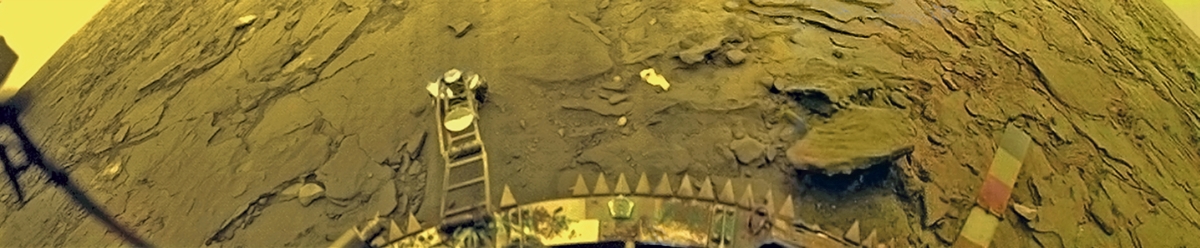
Fig. 2: The Soviet Union's Venera 14 probe captured two colour panoramas of Venus's surface in 1982. This panorama came from the rear camera. Image: Russian Academy of Sciences. More images can be seen at: https://www.planetary.org/articles/every-picture-from-venus-surface-ever
How to get a Runaway?
To get a true runaway greenhouse effect on Venus, you need a combination of solar radiation and the presence of a greenhouse gas. That gas has two key requirements. It must be condensable and it needs to be in equilibrium with its surface reservoir. In addition, its concentration must increase with temperature, as explained by the Clausius-Clapeyron relation. For Venus to enter a runaway greenhouse state, the greenhouse gas of interest is water vapour, plus its liquid reservoir, the water making up the oceans.
The greenhouse effect on any planet involves impeding the flux of outwards longwave radiation to space. Water vapour is very good at this so can potentially lead to a positive feedback runaway scenario. That works as follows: higher temperatures cause ever more water to evaporate and then drive temperatures even higher and on and on it goes - while there is an available liquid water reservoir.
Through water vapour's effectiveness at blocking IR, the outward longwave radiation flux eventually flatlines. If the incoming Solar flux is constantly greater than that outgoing flatline value, the planet is tipped out of radiative equilibrium and we have that runaway. If you like, it has a fever. The reservoir for water vapour - the oceans - is vast. That means the system may only be able to return to radiative equilibrium once the runaway process has stopped. In the extreme runaway greenhouse effect, that cessation may only happen at the point when the whole ocean has evaporated.
On present-day Earth, there is a strong temperature inversion, called the tropopause. It is situated between the troposphere and stratosphere. You can see it on thundery days when the tops of storm-clouds spread out beneath it to form the familiar anvil-shapes. The tropopause thus forms an effective barrier to moisture getting into the stratosphere. At the height of the tropopause on Earth, in any case, it's already too cold for water to remain in the vapour phase. The wispy clouds making up thunderstorm anvils consist of ice crystals. This impediment to water vapour's ascent is often referred to as a 'cold trap'.
In a runaway scenario, such as that proposed for Venus, no such impediment exists. This means the upper atmosphere would have become moist too. On Venus, the troposphere extends to a much greater height than on Earth. There is no stratosphere - we're talking about a very different situation here. That is critical because water vapour, upon reaching such great heights, has energetic Solar ultraviolet (UV) radiation to contend with. The UV is effective at splitting the H2O molecule into its constituent elements. Once that has happened, the hydrogen in particular is easily lost to space. One can envisage that once a runaway greenhouse effect got going, Venus' water content got steadily depleted in this manner through time. If Venus ever had oceans, they must have evaporated into oblivion. Because of the 'cold trap', this form of water-depletion is of very little significance on Earth - thankfully.
Once that water was lost, the chemical processes that lock up carbon in rocks on Earth could not operate. All of them involve water somewhere. Thereafter, every addition of carbon to the atmosphere, large or small, stayed up there. Most CO2 was probably of volcanic origin. The result was the 96.5% CO2 atmosphere and hellish surface temperature of Venus today.
Earth and the Runaway: Past and Future
Currently, Earth is well under the absorbed solar radiation threshold for a runaway greenhouse effect to occur. Its water condenses and is recycled back to the surface as rain, rather than accumulating indefinitely throughout the atmosphere. The opposite is true for CO2, which builds up and up through our emissions, only checked by natural removal processes. Note here that the runaway greenhouse threshold is largely independent of CO2 since the IR opacity is swamped by the water vapour effect. This makes it difficult to justify concerns over a CO2-induced runaway on Earth.
However, this immunity to a runaway greenhouse effect will not last forever. The most realistic scenario for Earth entering a runaway occurs a few billion years in the future, when the sun's brightness has substantially increased. Earth will then receive more sunlight than the outgoing longwave radiation escaping to space. A true runaway greenhouse effect is then able to kick in. Caveats apply, though. For example, greater cloud cover could increase planetary albedo and delay this process.
Interestingly, some (e.g. Zahnle et al. 2007) have argued that Earth may have been in a transient runaway greenhouse phase within the first few million years of its existence. Geothermal heat and the heat flow from the moon-forming impact would have made up for the difference between the net solar insolation and the runaway greenhouse threshold. But if this happened it could only have lasted for a relatively short period of time - since we still have plenty of water on Earth.
For further reading, a recent review paper (Gillmann et al. 2022) explores the various hypotheses concerning the evolution of the Venusian atmosphere over geological time. There's also an excellent book chapter (Arney & Kane. 2020, currently available as a PDF at arXiv). As might be expected, difficulties in fieldwork are plural on Venus and designing a probe that survives touchdown and can go on to do the required data-collecting is still some time away. The key piece of evidence we need to confirm the existence of a runaway greenhouse effect in deep time would be for free water having once been present. But it is apparent that large parts of the surface were covered with lava flows from monster volcanoes at some point. Is that evidence nowhere to be seen, or is it just hiding? Time will tell.
Last updated on 21 January 2024 by John Mason. View Archives


Michael Sweet : "Since the base 2 log of 150,000 is 17.2, you must divide the forcing on Vensus (13870 W.m2 according to you) by 17.2, not 150,000. That yields an estimated forcing on Earth of 806 w/m2. It does not take into accoount the vastly different albeido's of Venus and Earth (Earth has a much lower albeido than Venus about 0.3 and 0.75)".
But 806 W/m2 is not at all the value of the greenhouse effect of CO2 in the Earth's atmosphere (officially estimated at 26 W / m2 for 300 ppmv), so your calculation is not suitable ! In addition albedo does not intervene in the calculation of the greenhouse effect.
Science seems to be unable to have a universal theory of the greenhouse effect that is capable of explaining the T ° of Venus and the Earth. . As long as this point is not resolved how can one claim to predict radiative forcing ?
The amounts of CO2 (4.72.10 ^ 20 Kg of CO2 in the atmosphere of Venus, and 3.128.10 ^ 15 Kg for the Earth) were calculated taking into account the pressure and the temperature of each planet.
I do not see anywhere calculations taking into account the actual amount of CO2, which is still surprising because it is still the number of CO2 molecule that play a role in the power of the greenhouse effect.
[DB] Sloganeering snipped. You cannot simply ignore the rebuttals of your argument. You have to use the math, physics and citations to credible sources to support your position. That's how things work in science-based venues such as this.
Failure to do so means you concede the points.
JC,
I am sorry, I do not have enough time to search the internet to find the correct calculation for you. It is your responsibility to cite correct calculations to support your claims. As I stated, the most likely error in my calculations is that your unsupported value for Venus is too high.
I have shown that your calculation of the forcing from CO2 on Earth, using data from Venus, is incorrect. Now you have provided the value of 26 W/m2 which seems reasonable to me. You challange that value without providing any supporting data. The value you originally calculated at comment 219 of 0.092 W/m2 is clearly completely incorrect. My estimate of 322 W/m2 is closer to the value of 26 W/m2 you now propose, and I pointed out that my estimate had an error in it. The albeido must be considered. If the albeido was 100% the surface would be frozen no matter how much CO2 there was.
If you do not know how to do the calculation you must withdraw your wild claims. You have provided no citation of someone who knows how to do this calculation and you do not know how to do it. You are making an argument from ignorance. Scientists figured this out over 100 years ago. Try to catch up.
Where did you find this false information so I can read what the original person wrote?
JC,
Reading the OP I noticed this sentence:
"In the dense Venusian CO2 atmosphere, pressure broadening from collisions and the presence of a large number of absorption features unimportant on modern Earth can come into play (figure 1b), which means quick and dirty attempts by Goddard to extrapolate the logarithmic dependence between CO2 and radiative forcing make little sense."
This states that both our calculations cannnot be made because the atmosphere on Venus to too different from that of Earth for this simple extrapolation. It apears that Goddard is the originator of this malarky. Since the OP was written in 2011, it has been known since at least then that your source of information is incorrect.
I suggest that you read more background information and come back when you have questions. If you continue to read Goddard you will never understand what is happening. Read more of the posts here at Skeptical Science and you will begin to understand the process of AGW.
Once again, I note that JC does not dispute the fact that, unlike what his (her)previous claim suggested, global temperatures have not been stagnant since 2000.
Philippe Chantreau : "Once again, I note that JC does not dispute the fact that, unlike what his (her)previous claim suggested, global temperatures have not been stagnant since 2000".
Yet this is called hiatus in the last report of the giec !
JC @230.
"The giec" is usually known by its English acronym 'IPCC' and indeed the IPCC AR5 Technical Summary does include Box TS.3 'Climate Models and the Hiatus in Global Mean Surface Warming of the Past 15 Years.' This analysis dates to 2013 and thus predates Karl et al (2015) which rattled a number of 'artifacts' from the global surface temperature record and with it became an undeniable 'pause-buster' in the eyes of AGW-denying contrarians. And Box TS.3 will obviously not have been able to include in its analysis the last five years of global surface temperature (2014-18) which will soon become shown to comprise each of the warmest five years on record. Thus, if there were (as asserted by JC @222) some "stagnation of steam from 2000 to presently," it would not provide a "correlation" with global surface temperature which has been far from stagnant since 2000.
On Mars :
95.32 m3 of CO2 in 100 m3 of atmosphere.
PV = nRT
n = (685.4 Pa x 95.32 m3) / (8.314 x 210.15 ° K)
n = 37.39 mol of CO2 in 100 m3 of atmosphere
44 g of CO2 per 1 mol
So 37.39 mol = 1645.16 g of CO2 in 100 m3 of atmosphere
The density of Mars atmosphere = 1.9 Kg / 100 m3
We have 1645.16 g of CO2 for 1.9 kg of atmosphere
So 1645.16 / 1.9 = 865.87 g of CO2 per 1 kg of atmosphere
The mass of the atmosphere of March = 25.10 ^ 15 Kg
865.87 g of CO2 for 1 kg of atmosphere
So 865.87 x 25.10 ^ 15 = 2.165.10 ^ 19 Kg of CO2 in the atmosphere of Mars.
To summarize: The amount of CO2 (Kg) in the total atmosphere of each planet and its greenhouse effect (GHE) :
Venus : 4.72.10 ^ 20 Kg - GHE : 13870.15 W/m2 (+430°C)
Earth : 3.128.10 ^ 15 Kg - GHE : 26 W/m2
Mars : 2.165.10 ^ 19 Kg - GHE : 0 W/m2 !!!!!!!!!
Where is the logic ?
JC @232,
You appear to be using misconceptions of the operation of GHG on other planets to argue that CO2 is not driving climate change. I think that makes you commenting off-topic.
But to continue awhile here, there is no disagreement that Mars has a higher pressure of CO2 in its atmosphere (6.0mbar) than there is in Earth's atmosphere (0.6mbar) although you calculation is overly-complicated and wrong to suggest the atmospheric CO2 content on Mars is 2.165e19kg or 7,000-times greater than the value for Earth. The ratio will be less than the 10:1 ratio of CO2 pressures as Mars is a smaller planet. (NASA give the total weight of the Martian atmosphere as ~2.5e16kg suggesting a CO2 content of ~2.4e16kg, a ration of 7.7 to 1.0.)
Also, the impact of GHGs on the Martian surface temperature is small but it is not zero as your "GHE : 0 W/m2 !!!!!!!!!" implies. How do you obtain the zero value?
Ma Rodger : "NASA give the total weight of the Martian atmosphere as ~2.5e16kg suggesting a CO2 content of ~2.4e16kg, a ration of 7.7 to 1.0"
2.5e16kg That's the value I use.
But you made a miscalculation : 96% is the proportion in volume and not in mass. I want the real amount of CO2 (in kg or in mole) which explains my calculation :
In 2.5e16kg of Martian atmosphere, there is 2.165.10 ^ 19 Kg of CO2 (or 7000 times more kg of CO2 than in the atmosphere of the Earth).
The greenhouse effect of Mars is close to zero.
JC @234,
I think you demonstrate the problem we face with the discussion you bring here. How can a substance comprising 97.8% by weight of the Martian atmosphere weigh 2.165e19kg/2.5e16kg = 3800% of that atmosphere? To throw your own incredulity back in your face (and unlike yours, mine is well founded incredulity) "Where is the logic ?"
I correct. I made a unit error at the end of my calculation. Thank you :
The mass of the atmosphere of March = 25.10 ^ 15 Kg
865.87 g of CO2 for 1 kg of atmosphere
So 865.87 x 25.10 ^ 15 = 2.165.10 ^ 19 g of CO2 in the atmosphere of Mars = 2.165.10 ^ 16 kg
To summarize: The amount of CO2 (Kg) in the total atmosphere of each planet and its greenhouse effect (GHE) :
Venus : 4.72.10 ^ 20 Kg - GHE : 13870.15 W/m2 (+430°C)
Earth : 3.128.10 ^ 15 Kg - GHE : 26 W/m2
Mars : 2.165.10 ^ 16 kg - GHE : 0 W/m2 !!!!!!!!!
But there is always more amount of CO2 in the matter atmosphere (x 6.9) than in the Earth.
It would require a greenhouse effect theory that takes into account the exact amount of molecules and the available IR energy supported by these molecules.
JC,
But greenhouse theory does take into account the exact amount of molecules and the IR energy uspported by those molecules.
On Mars there is a smaller greenhouse effect because the atmosphere is so thin. Even so, Mars is about 10C higher in temperature from the greenhouse effect. Because the atmosphere is so thin and there is no water vapor, the height in the atmsophere where the IR energy can escape is much lower than it is on Earth. That makes the greenhouse effect less on Mars.
Just because you do not understand the greenhouse effect that does not mean that scientists do not understand it. Greenhouse models describe the temperature of Earth, Mars and Venus with great accuracy. You have just not looked for the data.
You have provided only your own error filled calculations to support your wild claims. Why should I believe a person whyo cannot even keep track of obvious errors like saying the CO2 in the Mars atmosphere weighs more than the entire atmosphere?
JC @236/237,
I concur with michael sweet @238.
Do note that the calculations required to determine GH-effects are complex. See for instance Postawko & Kuhn (1986) 'Effect of the greenhouse gases (CO 2 , H 2 O, SO 2 ) on Martian paleoclimate' which is a reasonably simple example of such analyses.
Also note Fig2 in that paper which represents today's Mars and Fig3 which sows the effect of having a 1,000mbar CO2 atmosphere instead of today's 6mbar CO2 atmosphere. The result is a warming of some 30K requiring an additional GH-effect of some 80Wm^-2 (additional to today's GH-effect which is some 12Wm^-2), the increased CO2 requiring the atmospheric CO2 content to rise from 2e16kg to 361e16kg.
Are you happy with these figures? If not we can perhaps try a different approach.
JC @ 230:
I don't see anything to add to MA Rodger's remarks, which also link to appropriate litterature. The pause-that-never-was is the only way to call this imaginary phenomenon. Who in their right mind would have expected a neutral/La Nina year to be warmer than a major El-Nino year after less than 20 years? That's the kind of warming we're seeing. and the answer is: scientists who study this stuff would have expected that, they even projected it in scientific papers.
The same kind of people who published the studies that have been linked in this thread to try to point you in the right direction, the kind that really knows what they're talking about. Perhaps you should accept the fact that there is nore to this body of knowledge than your back of the enveloppe calculations.
JC @ 237 "It would require a greenhouse effect theory that takes into account the exact amount of molecules and the available IR energy supported by these molecules."
As with the water vapor thing, it's only your ignorance that makes you think it is not the case. If you had any interest in learning about what's out there before trying to make a point, you would have started here: http://modtran.spectral.com/
And would have found this: http://web.gps.caltech.edu/~vijay/pdf/modrept.pdf
And, since you were concerned about water vapor, you could also have looked at this: http://climatemodels.uchicago.edu/modtran/
All of which are far more interesting than your "calculations." MODTRAN models atmospheric IR radiation at all altitudes quite well, and has been validated against measurements in multiple studies. In case you hold ideological or tribal hang outs that prevent you from trusting the "other camp" sources, be aware than the US Air Force is a major developper of these models, has copyrighted the name and holds several patents on it.
"Reality is that which exists whether we believe in it or not."
[PS] "Quite well" would be more accurately stated as "with exquisite accuracy". As to accounting for all molecules, then please see Ramanathan and Coakley 1978 . Arguments from personal incredulity dont cut it here, especially where the real science is confirmed by experimental evidence.
I seek explanations figures on the 3 planets from a universal law of the greenhouse effect. For the moment I only read studies for each planet as if we could isolate the greenhouse effect of CO2 and unify its effects. However, CO2 must react well to energy wherever it is and heat accordingly.
I am also a scientist (but not a climatologist or physicist) and the greenhouse effect does not seem clear to me at all, moreover no one can explain it simply. We are dealing with vague explanations.
As for the hiatus, it is visible, as is the current drop in global T °. But that's not the subject of this discussion.
As far as I am concerned, and in agreement with the studies of Leroy Ladurie, I realize that the current phase of warming follows the regularity of the last four thousand years.
Thank you for all the documents on the greenhouse effect, that's what I'm looking for. I would read them carefully. Thanks again.
[DB] Activated image link. It works easiest to use the insert image tool instead of using html.
There is no current change in the upward trend in global temperatures:
Multiple studies have shown the recent warming to be anomalous, regardless of the context of the time period involved, whether over the past 1,700 years, the past 10,000 years or even the past 22,000 years (below).
Thousands of posts on this site exist to edify the reader. Of particular relevance to your statements made in this comment can be found here, here, here and here.
A breakdown of skeptic arguments and the subsequent evaluation of them can be found here.
JC @241,
I appreciate you have a language barrier to leap with your contributions here. Yet you should appreciate that presenting a link to an illustration of unknown origin on a scientific web-site is not the done thing. Do we assume this diagram (pasted below) is somehow from historian Emmanuel Le Roy Ladurie? Is it just based on snow & ice or does it also involve the analysis of Grape Harvest Dates which ELR Ladurie has analysed for French regional harvests & more widely? (It is interesting that using Grape Harvest Dates as proxies for temperature has suffered correlation issues as "climate change has fundamentally altered the climatic drivers of early wine grape harvests in France", a bit like the famous "decline" problem faced by proxy tree ring reconstructions.)
Perhaps with the language barrier, your problems understanding why there is no simple relationship between levels of CO2 and the resulting GH-effects could stand further description of the workings of CO2.
CO2 does not provide a planet with a full suit of winter clothes. On its own, CO2 provides only hat and gloves. And if you venture out into the "neiges hivemales" wearing only hat and gloves, you will likely freeze to death by morning. It doesn't matter how thick and woolly the hat and gloves are: you will freeze. Venus without its H2O & SO2 would be very-much colder than it actually is. Likewise Earth without its H2O, but on Earth it is the CO2 that raises temperatures to the point where H2O melts and evapourates into the atmosphere. No CO2, then no atmospheric H2O and the Earth freezes.
There isn't and never was a hiatus. This has become a point because you attempted to make an argument about it, argument that was completely debunked right away because no part of it had any validity. "Visible" means nothing in the absence of real statistical analysis. Such analysis has been done and shows that there is no significant change in the long term trend. There is no current drop in temperature either. If you are trying to suggest that every year should be higher than the previous one in order to show a upward trend you are going to reveal that you are arguing in bad faith and should be ignored. What is happening now is similar to what happened after the massive El-Nino of 1998, when temperatures settled toward a baseline that was nowhere near where they were before the El-Nino, then continued increasing through natural variability.
I am not climate scientist or physicist either but I can read. The greenhouse effect is not that difficult to understand at all on its principle:
https://en.wikipedia.org/wiki/Greenhouse_effect
As fas as I know, Ladurie is not a prominent voice in paleo climate circles. The weight of the evidence in that area suggests that we were in a long term cooling trend that was interrupted by the massive injection of radiatively active gasses in the atmosphere. There is plenty of info on that, do your homework yourself.
Proper statistical analysis in the following paper:
http://iopscience.iop.org/article/10.1088/1748-9326/6/4/044022/meta;jsessionid=DC09E8CC6988FE0F8B81759491CA3939.c5.iopscience.cld.iop.org
That paper predates the multi year streak or record setting from 2014 on. The idea that there is a slow down in warming is unsupported by any data, even the satellite series that include a large stratospheric influence.
I am French and I have very bad english. Concerning the hiatus, we do not have the same references, I understood that there are two groups that do not have the same reading of the data. Anyway the Giec says in chapter 9 page 769:
"The observed global mean surface temperature (GMST) has been shown to increase in popularity over the past 15 years over the past 30 to 60 years (Section 2.4.3, Figure 2.20, Table 2.7, Figure 9.8, Box 9.2 Figure 1a, c). Depending on the observational
data set, the GMST trend over 1998-2012 is estimated to be one-third to one-half of the trend over 1951-2012 (Section 2.4.3, Table 2.7; Box 9.2 Figure 1a, c). For example, in HadCRUT4 the trend is 0.04ºC per decade over 1998-2012, compared to 0.11ºC per
decade over 1951-2012 ".
As for the current catastrophism, I find it exaggerated.
For the greenhouse effect, I understand the principle, the problem is to measure the impact of CO2 on temperature (and in particular the amount of CO2 released by humans). Georg Beck compiled data on the 19th century with high CO2 levels measured during the early ice age !
[DB] "Concerning the hiatus"
Please understand that the "hiatus" was a discussion of the seeming slowdown in the rate of warming in a small portion of where the Earth stores energy, in its surface. In reality, the vast majority of energy stored in the Earth system is found in the oceans. The oceans continue to warm, unabated, unpaused and unhiatused (2017 was the warmest year on record for the ocean):
And surface warming also continues unabated, as shown by NASA (132-month smooth applied to reduce the noise, allowing the underlying signal to be more readily shown):
"Georg Beck compiled data on the 19th century with high CO2 levels measured during the early ice age !"
Beck's work has been amply shown to be in error, as has been pointed out to you (but which you have ignored). Future references to such will be deleted unless you can furnish credible evidence to support your contentions.
Atmospheric CO2 levels have been extensively studied and numerous converging lines of evidence show the recent rise in atmospheric concentrations of such to be anomalous over every timescale relevant to humans, whether the last 1,000 years, the last 10,000 years or even the last 800,000 years.
Please stay on-topic.
JC,
Can you provide a citation for your claim that "Georg Beck compiled data on the 19th century". What is your point?
If you do not provide a citation to support your claims they have little meaning.
Your claim about the GIEC has been addressed upthread. To summarize:
http://www.realclimate.org/index.php/archives/2007/05/beck-to-the-future/
Georg Beck is known to have publicized a graph with a discontinuity in the x axis and a change in time scale that was downright laughable, he was not a credible source at all. Beck's nonsense has been debunked multiple times, years ago.
You need to choose your sources more carefully. It seems you're getting all your information from propagandists instead of looking in the litterature. You do not specifiy who the IPCC author you cite is and the date of the report. Cherry picking 1998 as a starting date is an obvious indication that one is trying to misrepresent the trend. 1998 saw a massive El-Nino and is obviously the worst possible choice for the start of any trend calculation, as would be a strong La-Nina year. Whenever I see a "trend" starting in 1998, I know that someone is trying to fool me and the alarm bells start ringing. The insistence by deniers to pick 1998 and their lack of mention of the corresponding El-Nino is the main reason why the so-called pause has no credibility. Start on any other year and the pause disappears. In the case of your citation, extend the period beyond 2012 to include 2017 and the trend is higher than ever. As was pointed above, there is no "current drop" in temperature. Attempting to argue with a pseudo trend that ended in 2012 does not help your case when there are 5 more years of data.
Let's summarize your contribution: you started with attempting to correlate a supposedly stagnant level of water vapor in the stratosphere (which is, in fact, increasing) with supposedly stagnant temperatures, which all sources show to be increasing as of 2017, regardless of the start year (yes, even if you cherry pick 1998, it no longer works). If you had even a superficial understanding of the seminal Iacono and Clough 1995 paper, you would have seen that water vapor (and other GH gasses) in the stratosphere contribute, in fact, to stratospheric cooling and have little influence on tropospheric temperatures.
Nonetheless, this was part of a rather pitiful effort to try to invalidate the greenhouse effect altogether, with "calculations' that were worthless; as was quickly pointed to you, you were nowhere near close to understand what you were talking about and ignorant of a large body of scientific research and litterature that you later, indirectly, confessed to be over your head. Just to be clear as to the validity of the MODTRAN model: that's what they use to ensure that IR guided weapons go where they're supposed to go. It works.
You did not have the decency to acknowledge any of these shortcomings in your argument, or the arrogance of the wide ranging pronouncements you made before the extent of your incompetence on the subject was revealed.
Instead, you moved on to what you thought were new things, bringing in something you considered to be paleo data evidence. Once again, there is far more about this than you suspected and that was pointed to you but, once again, you could not acknowledge how weak your argument was.
You are free to have whatever opinion you choose. Considering the level of ignorance and lack of understanding that you have shown in this thread post after post, it is obvious that your opinion is worthless and I am also free to point that out. Opinions do not have validity by virtue of their existence. Some people hold the opinion that the Earth is flat; their opinion has no value.
To ignore certain data (Leroy Ladurie and Beck for example) is not science. Science must take into account all available data. Vostoc's data have also been criticized.
Moreover, when science uses the deductive method, the initial hypothesis becomes an explanation only when the model works perfectly. This is not yet the case in climatology. Also the hypothesis remains a hypothesis.
I am not trying to invalidate the greenhouse effect but to understand how 7000 times more CO2 in the atmosphere of Mars compared to the Earth can not even heat the planet by at least 26 W / m2. The answer given above to this question is remains very imprecise and implies that CO2 alone (without the water vapor gene) actually has a very low greenhouse effect.
[DB] "The answer given above to this question is remains very imprecise and implies that CO2 alone (without the water vapor gene) actually has a very low greenhouse effect"
CO2 levels in the past were driven by known natural factors. None of those factors are in play during the recent increase in atmospheric concentration of CO2. The human forcing is now the largest forcing, dwarfing all natural forcings, including that from the sun itself.
Please remain on-topic to the nature of the OP of the post on which you place comments. Thousands of posts exist on this venue, on every topic related to climate science you can think of. Use the Search function present in the UL of every page or learn to use the Taxonomy listing of the site.
Please note that posting comments here at SkS is a privilege, not a right. This privilege can be rescinded if the posting individual treats adherence to the Comments Policy as optional, rather than the mandatory condition of participating in this online forum.
Please take the time to review the policy and ensure future comments are in full compliance with it. Thanks for your understanding and compliance in this matter.
Sloganeering snipped.
JC @248,
You say that "CO2 alone has a very low GH-effect." And the only place where we find what is effectively "CO2 alone" is the 6mbar atmosphere of Mars which provides something like a 12Wm^-2 GH-effect. The usual-reported calculations put the 0.6mbar CO2 contribution to Earth's GH-effect as being 25%, perhaps 40Wm^-2, this the GH-effect if all other GHGs were taken from the atmosphere. But that CO2 would still sit within 800mbar of N2 and 200mbar of O2. You may have a problem with this situation. Science does not. (Consider, the Mercedes F1 W09 EQ Power+ has a 1.6litre engine yet can travel at speeds more than three-times that of a Mercedes OM 501 LA-541 which has a 12litre engine. To borrow your incredulity for a second time, "Where's the logic in that?")
As for data being ignored, the publications of ELR Ladurie are not ignored, although the origin of the graphic you present up-thread @241 remains a complete mystery. The data examined by Beck (2007) or Beck (2008) is not ignored although it may be dismissed as irrelevant. What is ignored is the papers written by Beck because they are nonsense and unscientific. Beck agrees his analysis is ignored "The scientific community still ignore the above-cited critics," he says. But isn't that because Beck ignores all the real science, the stuff that shows he is spouting nonsense. He may feel that such a conclusion is "unjustified" but he does nothing to support his claim of injustice. Again he is unscientific!
MA Rodger :
« You say that "CO2 alone has a very low GH-effect." And the only place where we find what is effectively "CO2 alone" is the 6mbar atmosphere of Mars which provides something like a 12Wm^-2 GH-effect. The usual-reported calculations put the 0.6mbar CO2 contribution to Earth's GH-effect as being 25%, perhaps 40Wm^-2, this the GH-effect if all other GHGs were taken from the atmosphere. But that CO2 would still sit within 800mbar of N2 and 200mbar of O2.»
I do not understand your explanation. Why would strong pressure prevent CO2 from having a greenhouse effect ?