


 Arguments


The runaway greenhouse effect on Venus
What the science says...
| Select a level... |
 Basic
Basic
|
 Advanced
| |||
|
Venus very likely underwent a runaway or ‘moist’ greenhouse phase earlier in its history, and today is kept hot by a dense CO2 atmosphere. |
|||||
Climate Myth...
Venus doesn't have a runaway greenhouse effect
"I bought off on the “runaway greenhouse” idea on Venus for several decades (without smoking pot) and only very recently have come to understand that the theory is beyond absurd." (Steve Goddard, WUWT)
At a glance
Earth: we take its existence for granted. But when one looks at its early evolution, from around 4.56 billion years ago, the fact that we are here at all starts to look miraculous.
Over billions of years, stars are born and then die. Our modern telescopes can observe such processes across the cosmos. So we have a reasonable idea of what happened when our own Solar System was young. It started out as a vast spinning disc of dust with the young Sun at its centre. What happened next?
Readers who look up a lot at night will be familiar with shooting stars. These are small remnants of the early Solar System, drawn towards Earth's surface by our planet's gravitational pull. Billions of years ago, the same thing happened but on an absolutely massive scale. Fledgeling protoplanets attracted more and more matter to themselves. Lots of them collided. Eventually out of all this violent chaos, a few winners emerged, making up the Solar System as we now know it.
The early Solar system was also extremely hot. Even more heat was generated during the near-constant collisions and through the super-abundance of fiercely radioactive isotopes. Protoplanets became so hot that they went through a completely molten stage, during which heavy elements such as iron sank down through gravity, towards the centre. That's how their cores formed. At the same time, the displaced lighter material rose, to form their silicate mantles. This dramatic process, that affected all juvenile rocky planets, is known as planetary differentiation.
Earth and Venus are the two largest rocky planets. But at some point after differentiation and solidification of their magma-oceans, their paths diverged. Earth ended up becoming habitable to life, but Venus turned into a hellscape. What happened?
There's a lot we don't know about Venus. But what we do know is that the surface temperature is hot enough to melt lead, at 477 °C (890 °F). Atmospheric pressure is akin to that found on Earth - but over a kilometre down in the oceans. The orbit of Venus may be closer to the Sun but a lot of the sunlight bathing the planet is reflected by the thick and permanent cloud cover. Several attempts to land probes on the surface have seen the craft expire during descent or only a short while (~2 hours max.) after landing.
Nevertheless, radar has been used to map the features of the planetary surface and analyses have been made of the Venusian atmosphere. The latter is almost all carbon dioxide, with a bit of nitrogen. Sulphuric acid droplets make up the clouds. Many hypotheses have been put forward for the evidently different evolution of Venus, but the critical bit - testing them - requires fieldwork under the most difficult conditions in the inner Solar System.
One leading hypothesis is that early on, Venus experienced a runaway water vapour-based greenhouse effect. Water vapour built up in the atmosphere and temperatures rose and rose until a point was reached where the oceans had evaporated. In the upper atmosphere, the water (H2O) molecules were split by exposure to high-energy ultraviolet light and the light hydrogen component escaped to space.
With that progressive loss of water, most processes that consume CO2 would eventually grind to a halt, unlike on Earth. Carbon dioxide released by volcanic activity would then simply accumulate in the Venusian atmosphere over billions of years, creating the stable but unfriendly conditions we see there today.
Earth instead managed to hang onto its water, to become the benign, life-supporting place where we live. We should be grateful!
Please use this form to provide feedback about this new "At a glance" section. Read a more technical version below or dig deeper via the tabs above!
Further details
Venus may have experienced a runaway greenhouse effect in the geological past. To use the term 'runaway' is to refer to a highly specific process when discussed by planetary scientists. Simply having a very hot, high-CO2 atmosphere is not it. So let's start with a tutorial on Venus at the present day.
Venus’ orbit is much closer to the sun, which means it receives almost twice the solar radiation at the top of its atmosphere than Earth. Venus also has a very high albedo which ends up over-compensating for the closer distance to the sun. The result is that less than 10% of that incident solar radiation reaches the surface. High albedo can be attributed to sulphur-bearing compounds, along with minor water vapour (around 20 ppm). These substances form globally encircling sulphuric acid-dominated cloud decks (fig. 1). Venus’ atmosphere also has a surface pressure of around 92 bars (or if you like, 92,000 millibars), equivalent to what you’d feel on Earth beneath more than a kilometre of ocean.
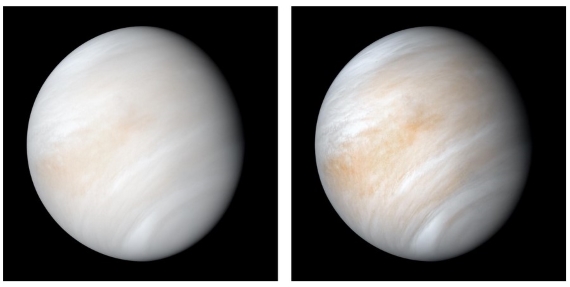
Fig. 1: Venus in its shroud of clouds - a false colour composite created by combining images taken using orange and ultraviolet spectral filters on the Mariner 10 spacecraft's imaging camera.The images used to create this view were acquired in 1974; the RH one has been enhanced to bring out texture and colour. Image: NASA.
Observations of the water vapour content in the Venusian atmosphere show a high heavy to light hydrogen isotopic ratio (D/H). This is best interpreted as the product of a preferential light hydrogen escape to space: deuterium escapes less easily. Venus is considered to have had at least 100 times its current water content in the past (e.g. Selsis et al. 2007 and references therein).
The greenhouse effect on Venus today is primarily caused by CO2, although water vapour and SO2 are important as well. Since most of the radiation that makes its way out to space comes from only the very topmost parts of the atmosphere, it can look as cold as Mars in infra-red (IR) imagery. In reality, the surface of Venus (Fig. 2) is even hotter than the dayside of Mercury, at a deadly 477 °C (890 °F).
Like Earth, the Venusian clouds also generate a greenhouse effect. However, they are poor IR absorbers and emitters compared to water clouds. The sulfuric acid droplets forming the clouds can also scatter IR radiation back to the surface, producing another form of the greenhouse effect in that way. In the dense Venusian CO2-rich atmosphere, there are IR-handling processes at work that are unimportant on modern Earth.
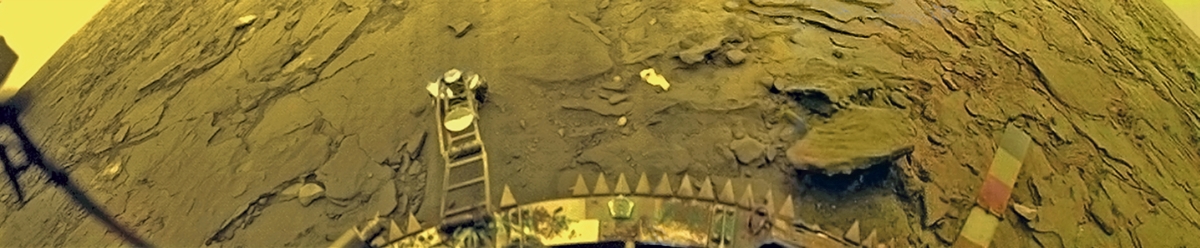
Fig. 2: The Soviet Union's Venera 14 probe captured two colour panoramas of Venus's surface in 1982. This panorama came from the rear camera. Image: Russian Academy of Sciences. More images can be seen at: https://www.planetary.org/articles/every-picture-from-venus-surface-ever
How to get a Runaway?
To get a true runaway greenhouse effect on Venus, you need a combination of solar radiation and the presence of a greenhouse gas. That gas has two key requirements. It must be condensable and it needs to be in equilibrium with its surface reservoir. In addition, its concentration must increase with temperature, as explained by the Clausius-Clapeyron relation. For Venus to enter a runaway greenhouse state, the greenhouse gas of interest is water vapour, plus its liquid reservoir, the water making up the oceans.
The greenhouse effect on any planet involves impeding the flux of outwards longwave radiation to space. Water vapour is very good at this so can potentially lead to a positive feedback runaway scenario. That works as follows: higher temperatures cause ever more water to evaporate and then drive temperatures even higher and on and on it goes - while there is an available liquid water reservoir.
Through water vapour's effectiveness at blocking IR, the outward longwave radiation flux eventually flatlines. If the incoming Solar flux is constantly greater than that outgoing flatline value, the planet is tipped out of radiative equilibrium and we have that runaway. If you like, it has a fever. The reservoir for water vapour - the oceans - is vast. That means the system may only be able to return to radiative equilibrium once the runaway process has stopped. In the extreme runaway greenhouse effect, that cessation may only happen at the point when the whole ocean has evaporated.
On present-day Earth, there is a strong temperature inversion, called the tropopause. It is situated between the troposphere and stratosphere. You can see it on thundery days when the tops of storm-clouds spread out beneath it to form the familiar anvil-shapes. The tropopause thus forms an effective barrier to moisture getting into the stratosphere. At the height of the tropopause on Earth, in any case, it's already too cold for water to remain in the vapour phase. The wispy clouds making up thunderstorm anvils consist of ice crystals. This impediment to water vapour's ascent is often referred to as a 'cold trap'.
In a runaway scenario, such as that proposed for Venus, no such impediment exists. This means the upper atmosphere would have become moist too. On Venus, the troposphere extends to a much greater height than on Earth. There is no stratosphere - we're talking about a very different situation here. That is critical because water vapour, upon reaching such great heights, has energetic Solar ultraviolet (UV) radiation to contend with. The UV is effective at splitting the H2O molecule into its constituent elements. Once that has happened, the hydrogen in particular is easily lost to space. One can envisage that once a runaway greenhouse effect got going, Venus' water content got steadily depleted in this manner through time. If Venus ever had oceans, they must have evaporated into oblivion. Because of the 'cold trap', this form of water-depletion is of very little significance on Earth - thankfully.
Once that water was lost, the chemical processes that lock up carbon in rocks on Earth could not operate. All of them involve water somewhere. Thereafter, every addition of carbon to the atmosphere, large or small, stayed up there. Most CO2 was probably of volcanic origin. The result was the 96.5% CO2 atmosphere and hellish surface temperature of Venus today.
Earth and the Runaway: Past and Future
Currently, Earth is well under the absorbed solar radiation threshold for a runaway greenhouse effect to occur. Its water condenses and is recycled back to the surface as rain, rather than accumulating indefinitely throughout the atmosphere. The opposite is true for CO2, which builds up and up through our emissions, only checked by natural removal processes. Note here that the runaway greenhouse threshold is largely independent of CO2 since the IR opacity is swamped by the water vapour effect. This makes it difficult to justify concerns over a CO2-induced runaway on Earth.
However, this immunity to a runaway greenhouse effect will not last forever. The most realistic scenario for Earth entering a runaway occurs a few billion years in the future, when the sun's brightness has substantially increased. Earth will then receive more sunlight than the outgoing longwave radiation escaping to space. A true runaway greenhouse effect is then able to kick in. Caveats apply, though. For example, greater cloud cover could increase planetary albedo and delay this process.
Interestingly, some (e.g. Zahnle et al. 2007) have argued that Earth may have been in a transient runaway greenhouse phase within the first few million years of its existence. Geothermal heat and the heat flow from the moon-forming impact would have made up for the difference between the net solar insolation and the runaway greenhouse threshold. But if this happened it could only have lasted for a relatively short period of time - since we still have plenty of water on Earth.
For further reading, a recent review paper (Gillmann et al. 2022) explores the various hypotheses concerning the evolution of the Venusian atmosphere over geological time. There's also an excellent book chapter (Arney & Kane. 2020, currently available as a PDF at arXiv). As might be expected, difficulties in fieldwork are plural on Venus and designing a probe that survives touchdown and can go on to do the required data-collecting is still some time away. The key piece of evidence we need to confirm the existence of a runaway greenhouse effect in deep time would be for free water having once been present. But it is apparent that large parts of the surface were covered with lava flows from monster volcanoes at some point. Is that evidence nowhere to be seen, or is it just hiding? Time will tell.
Last updated on 21 January 2024 by John Mason. View Archives


JC @250,
You ask "Why would strong pressure prevent CO2 from having a greenhouse effect ?" It is actually the other way about. On Mars we see ten times the CO2 but very low atmospheric pressure and a very low GH-effect resulting from that CO2.
You may have noted in the OP above the use of the term "pressure broadening." The absorption of radiation by a greenhouse gas occurs at very distinct wavelengths. These are usually bunched into a series of lines resulting from the quantum spins a gas molecule can have. But as the pressure of the gas increases (for instance, resulting from mixing in 800mbar of N2 and 200mbar of O2) these distinct wavelengths become broadened out. The result is that the greenhouse gas can more completely absorb a wider wavelength. (In the analogy @242, it's a bit like the "hat and gloves" becoming a full balaclava & arm-length gloves.) The graphic below is taken from a Science of Doom page, one of a series which explains the ins-&-outs of how GH-effects work.
The result of pressure broadening is a more effective GH-effect from a single gas operating in a particular wave-band.
JC @250,
You ask "Why would strong pressure prevent CO2 from having a greenhouse effect ?" It is actually the other way about. On Mars we see ten-times the CO2 but very low atmospheric pressure and a very low GH-effect resulting from that CO2.
You may have noted in the OP above the use of the term "pressure broadening." The absorption of radiation by a greenhouse gas occurs at very distinct wavelengths. These are usually bunched into a series of lines resulting from the quantum spins a gas molecule can have. But as the pressure of the gas increases (for instance, resulting from mixing in 800mbar of N2 and 200mbar of O2) these distinct wavelengths become broadened out. The result is that the greenhouse gas can more completely absorb a wider wavelength. The graphic below is taken from a Science of Doom page illustrates what can happen to a single line under presure broadening.
The result of pressure broadening is a more effective GH-effect from a single gas operating in a particular wave-band. (In the analogy @242, it's a bit like the "hat and gloves" becoming a full balaclava & arm-length gloves.)
Calculation of the greenhouse effect of CO2 on Venus, Mars and Earth:
My starting hypothesis is as follows : energy from the greenhouse effect is proportional to the total amount of CO2 present in the entire atmosphere.
Step 1 : To verify this hypothesis, take the case of Venus where the greenhouse effect is in total of CO2:
Irradiance of Venus: 2613,9 W / m2.
On Venus, at the top of the atmosphere 2613,9 / 4 = 653,475 W / m2 from the Sun penetrate the atmosphere.
Since the albedo is 80% or 522,78 W / m2, only 130,7 W / m2 reaches the surface of Venus, the equivalent of a temperature of T = ∜ 130.7 / 5,67.10^ -8 = 219.12 ° K = -54 ° C
The average surface area of Venus is 460 ° C, ie 733.15 ° K or E = (733.15)^ 4 × 5,67.10-8 = 16 381.5 W / m2.
From 130,7 W / m2 to 16 381,5 W / m2 from the CO2 greenhouse effect, a total greenhouse effect of: 16 381,5 - 130,7 = 16 250,8 W / m2.
Now we know that in the total atmosphere of Venus there is a total amount of CO2 equal to 4.72 × 10 ^ 20 kg.
4,72.10 ^ 20 kg of CO2 therefore produced a greenhouse effect equivalent to 16 250,8 W / m2.
Step 2 : Application of the hypothesis:
If there is a proportionality between the amount of CO2 and the energy produced by the greenhouse effect, then on Mars we should obtain a greenhouse effect equivalent to B W / m2.
Calculation of B :
We know that in the total atmosphere of Mars there is a total amount of CO2 equal to 2,165 .10 ^ 16 kg.
4,72.10 ^ 20 kg of CO2 corresponds to: 16 250,8 W / m2
2,165 .10 ^ 16 kg corresponds to: B W / m2
So B = (2,165 .10 ^ 16 x 16 250,8) / 4,72,10 ^ 20
B = 0,745 W / m2
If there is a proportionality between the amount of CO2 and energy produced by the greenhouse effect, then on Mars we should get a greenhouse effect equivalent to 0,745 W / m2.
Step 3 : Verifying the hypothesis:
Irradiance of Mars: 586,2 W / m2.
On Mars, at the top of the 146,55 W / m2 atmosphere from the Sun penetrate the atmosphere.
Since the albedo is 25% or 36,64 W / m2, only 109,91 W / m2 reaches the surface of Venus, the equivalent of a temperature of T = ∜ 109,91 / 5,67.10 ^ - 8 = 209.82 ° K = - 63.33 ° C
The average surface area of entrances is - 63 ° C, ie 210,15 ° K or E = 210,15 × 4 × 5,67.10^ -8 = 110,586 W / m2.
We thus go from 109,91 W / m2 to 110,586W / m2 by the CO2 greenhouse effect, ie a total greenhouse effect of:
110,586 - 109,91 = 0,676 W / m2.
What did we predict by proportionality? : a greenhouse effect of 0,745 W / m2
Conclusion : Since the two values (0,676 and 0,745) are very close we can consider the proportionality hypothesis as true.
Step 4 : Apply the hypothesis to the Earth:
The atmosphere of the Earth contains 3,128.10 ^ 15 kg of CO2.
Proportionally with Venus, the greenhouse effect of the Earth's CO2 should be:
4,72.10 ^ 20 kg of CO2 corresponds to: 16 250.8 W / m2
3,128.10 ^ 15 kg corresponds to: B W / m2
B = (3,128.10^15 x 16 250,8) / 4,72 × 10
B = 0,1077 W / m2
The greenhouse effect of the 400 ppm CO2 of the Earth's atmosphere should be 0,1077 W / m2.
The Giec gives a value close to 30 W / m2 for the greenhouse effect of the 400 ppmv of CO2 of the terrestrial atmosphere !
How can we find these 30 W / m2 by the calculation ????
JC,
You are trying to do a seat of the pants calculation for something you do not understand. It is impossible to do the calculation by the process you describe. you must use the Modtram software that was referred to you upthread.
We have already discussed that pressure effects make it impossible to compare Mars to Venus in the way you are attempting to do. The calculations at Goddards site are worthless and deliberately misleading.
I recommend that you GOGGLE scientific publications on the greenhouse effect on Venus and Mars. There is a lot of material on Venus. You can also use the search function at the top of the page to find related articles.
JC @253,
I wasn't aware that the IPCC (Geic) gave any value for total CO2 forcing. Perhaps you can give the reference to the IPCC (Geic) document.
Beyond that, you tread a path that is very close to the ridiculous.
As a test of your grand method, perhaps you can calculate the GH-effect for the Earth's moon. Our Moon of course has no atmosphere so this will test both you grand method as well as your data on average albedo and average surface temperature. (The average temperature you may find difficult to track down. I do have a calculated value if you need it.)
And once you have passed that test, prehaps we can address the big big problems you need to overcome in assessing the size of a real GH-effect with your grand theory.
I do not understand your test since I try to put in parallel the quantity of CO2 of an atmosphere and its greenhouse effect, but on the moon there is no atmosphere and therefore no greenhouse effect.
For the radiative part of CO2 : "The second most important greenhouse gas is CO2, which 32 W m-2 in agreement with Charnock and Shine (1993) goal differing from Kandel's (1993) estimate of 50 W m-2. (in : LINK)
JC @256,
Thank you for your link to Kiehl and Trenberth (1996). (You will note it is not a publication of by Geic-IPCC). The paper does demonstrate the complications in establishing Earth's CO2 GH-effect within Earth's total GH-effect but does show it is something like 32Wm^-2, and a little higher for the CO2-effect without the other GH-effects overlapping. I suggested up-thread @249 the value 40Wm^-2 as an all-sky modern value,
As for my suggestion that you test your grand method by using it on the Moon, I strongly advise that you do not dismiss it.
My reason is because Mars has such a small GH-effect that other considerations will make your calculation useless. The strength of the Martian GH-effect is very like the Moon's, at or close to zero.
Sadly, there is not a great deal of work published that calculates this Martian GH-effect (certainly not in recent years) but among these publications you will find Haberle (2013) 'Estimating the power of Mars’ greenhouse effect' which unfortunately is not directly available in full on-line. This paper suggests that the apparent GH-effect on Mars is actually negative, with the Martian temperature as-measured being Ts=~202K while the blackbody temperature calculates to Te=~208K. (Note this blackbody temperature Te is the value you use, as is made plain within Covey et al 2012. And note also I am minded not to go further into this situation with respect to Mars as it is somewhat complicated.)
The same problem with Te & Ts occurs on the Moon. If you use your grand method to calculate the blackbody temperature you would obtain Te=270K. This can also be calculated using the as-measured amount of long-wave radiation emitted by the Moon (which is how they calculate the albedo). But because the Moon has such a large spread of day-night temperature and equator-polar temperature (these spreads resulting from it having (1) such a long day and (2) no atmosphere), this method is hopeless for calculating the arithmetic mean temperature of the Moon surface. Ts and Te are wildly different.
The Moon's equatorial temperature range should give some indication of the Moon's average temperature by setting an upper limit. That provides a value of 243K, well below Te. The Moon's equator actually averages 216K (the noon-day maximum is far narrower than the midnight minimum) and for the Moon as a whole Ts=200K, these from my own calculation based on Fig9a of Williams et al (2017) (This calculation would be difficult to accept as there is no properly quoted Moon average to compare it to. Yet if I average the blackbody radation calculated for each portion of the Moon and then calculate temperature, the resulting Te=270K). Thus on the Moon the Ts-Te mismatch is very large.
I would suggest there is a similar but smaller Ts-Te mismatch on Mars as suggested by Haberle (2013) and this is of great relevance to your choice of grand method to test the GH-effects of CO2.
LINK
Here page 11 you have an estimate of the average temperature of the Moon: 197,35 +/- 0,9 ° K. This corresponds to your 200 ° K!
I think for the rest of your remarks (review the value of the Moon albedo ?).
[DB] Shortened and hyperlinked URL breaking page formatting. Please learn to do this yourself using the Insert/Edit Link tool.
JC @258,
Thank you for finding Nikolov & Zeller (2015). These exoplanet scientists often come up with interesting work but it is not an area I follow. You will note their Appendix B providing a calculation of the Martian average global temperature based on measurements taken from Martian probes.
The lunar temperature they use is reliant on Volokin & ReLlez (2014) who check their modelled value against the Diviner Lunar Radiometer Experiment data which is also the data presented by Williams et al (2017) which I mention @257 as the source of my calculated average lunar temperature.
MAR@259 , the Nikolov & Zeller / a.k.a. Volokin & ReLlez joke is getting a bit old these days. Is it still considered to have some instructive elements to it?
Eclectric @260,
My personal position is that I do not recall reading Nikolov & Zeller before. There are certainly within it some worrying constructions within their model, that is worrying for a science faced by deluded AGW contrarians. (It may be diferent if you are researching exoplanetry climate.) Particularly worrying is the idea of the density of an atmosphere being a (or indeed 'the') contributing factor to the greenhouse effect. There is also the acceptance of the 37% result from Volokin & ReLiez which I consider to be badly wrong. (That is the idea that all airless rocky planets, if without an atmosphere like our Moon would have an average surface temperture 37% less-than a temperature calculated globally using the S-B equation j=σT^4.)
But Nikolov & Zeller do present good accounts of the literature of lunar and Martian temperatues and also calculate a Martian temperature in a reasonable manner, something I've not seen elsewhere.
Volokin & ReLiez I do remember as I did some simplistic calculations to unpack their 37%. I can repeat these with more confidence since Williams et al (2017). What I don't recall is their use of the Diviner Lunar Radiometer Experiment data (as used by Williams et al) to check their Moon calculations. That is a useful calculation.
-----
Setting out the simplistic calcs that show the 37% value is misused for the Earth (& Mars as well):-
The 37% does occur on the Moon. Thus using S-B to calculate the lunar average temperature yields 270K, an over-estimation of some 70K. Only a small portion of this 70K is due to the zonal temperature range (hot tropics, cold poles), perhaps 5K of the 70K. The rest is due to the diurnal range. The Moon with a 708 hour 'day' has a very large diurnal range. Averaged across all zones, the range is 90K to 360K. It is this diurnal range that drops the remaining 65K below the S-B estimate. An Earth stripped of its atmosphere with a 24 hour day will have a smaller diurnal range (perhaps 40% of the lunar range). This is the point where Volokin & ReLiez "briefly explore" the issue. They examining the heat storeage of the planet surface thro the night, feeding conclusions back into their simplified modelling and find hardily any difference (0.3K) due to the 24 hour day. Somewhere they have forgotten Hölder’s Inequality (errors due to averaging a non-linear function) from which that 65K derives. The Moon's temperature between any single 29½ hour period (those used by Williams et al) varies up to a maximum of 114K while the Moon over the full 708 hours varies 267K, thus the 114/267=40%. If the Earth's 24 hour 'day' waggles temperature by only 40% of the Moon's 708 hour 'day', the Hölder’s Inequality shrinks massively, back-of-fag-packet perhaps from 65K to 10K.
Now, magically, add on the zonal 5K and subtract the 15.7K non-greenhouse zonal-heat-transfer effect (this value from Volokin & ReLiez) and the Earth non-GHG temperature returns to the S-B estimated value. This then magically returns us to a 255K non-GHG Earth and thus the 33K GH-effect we all know & love.
MAR@261 , my concern with Zeller / Rellez and his partner Nikolov / Volokin was more to do with the accuracy of the data they provide.
Since the retraction of their 2015 paper (a jocular scandal, at minimum) and pointed criticisms from Gavin Schmidt, as well as by David Grinspoon [re some fudging of Mars temperature and pressure data], it casts even more of a shadow on their 2014 paper ~ which in one sense was a re-run of the unphysical ideas of Gerlich & Tscheuschner.
I am not sure how much of the N&Z/V&Z business was an elaborate leg-pull. Or perhaps they have simply "gone emeritus" and become denialist.
Correction to last paragraph :-
N&Z/V&R
Eclectic @262,
I'm not sure whether you want (1) an appraisal of the various Nikolov & Zeller papers or (2) an appraisal of Nikolov & Zeller. (Note we move further off-topic.)
On the first point, the V&R/N&Z (2014) Moon temperature doesn't seem controversial. Their Mars temperature has been involved in criticism from David Grinspoon but I would ask that if the Mars temperature results of Nikolov & Zeller (2015)(withdrawn) are in error, I would be interested to see the results that demonstrate that error.
Of coure, their grand theory of a pressure-driven global temperature is so much cods-wallop. Yet published cods-wallop is not unknown and can at times be a useful exercise. Note Grinspoon's comment here:-
On the second point, the record shows that up to 2006 the pair have a history of publication but not in climatology. They turned climate skeptics in about 2010 and their first attempts at overturning AGW were dreadful enough to give them a reputation of swivel-eyed lunatics, apparently preventing publication of later work. The the pseudonyms were an attempt to overcome this rejection. It worked. Their 2014 paper has not been withdrawn. Their 2015 was published bu then withdrawn. Today they have a publisher who will publish any old crap of a denialist persuasion (described with others here), thus facilitating the publication of the dubious Nikolov & Zeller (2017).
Hello there :) Does it also debunk this theory here? It also take into account pressure and distances ratio beetween sun and venus, earth, also claiming no greenhouse effects.
http://theendofthemystery.blogspot.com/2010/11/venus-no-greenhouse-effect.html
His claims "Venus's atmosphere DOES absorb 1.91 times the power that Earth's atmosphere does, as their temperature ratio shows--and that ratio is precisely that predicted simply from the ratio of their distances from the Sun"
I'm really curious about your opinion. Is there an error in his math?
PS I suppose this is the right place to ask this question if not direct me to the proper one please.
Sarmata @265,
His (that is one Harry Dale Huffman) claim is that "Venus's atmosphere DOES absorb 1.91 times the power that Earth's atmosphere does" only holds if the reflectiveness of Earth & Venus are identical. The webpage does in an up-date acknowledge reflectiveness (albedo) and sets out to correct for it but makes the mistake of assessing albedo as being "the same fraction (f)" on both Venus & Earth. Yet they are not even similar as this NASA Fact Sheet shows. Venus receives 2601.3Wm^-2 solar radiation and Earth 1361.0Wm^-2, a ratio of 1.91-times. But the albedo's are vastly different, Venus 0.77 and Earth 0.306. This means the absorbed solar radiation is 601Wm^-2 on Venus and 948Wm^-2 on Earth (these values over the disc of the planet). The true ratio is thus not 1.91-times but 0.63.
And the fancy use of the 1.91 ratio (which is wrong so has no merit) only works over the Earth's troposphere and a portion of the Venus atmosphere. If it were some grand theory, you would expect it to work throughout these atmospheres and indeed throughout all atmospheres. So Jupiter the Harry Dale Huffman theory would give a 1bar atmospheric temperature on Jupiter of 55K (that's ignoring albedo which is similar to Earth's) and not the measured 168K.
There seems to have been a discussion about how to calculate the greenhouse effect on Venus, Earth, and Mars. I published a paper in 2011 where that was an important part of the argument. Here's a link:
[DB] Shortened link breaking page width formatting.
Please note: a new basic level version of this rebuttal was published on January 21, 2024 with the "at a glance“ section at the top. To learn more about these updates and how you can help with evaluating their effectiveness, please check out the accompanying blog post @ https://sks.to/at-a-glance