


 Arguments


The runaway greenhouse effect on Venus
What the science says...
| Select a level... |
 Basic
Basic
|
 Advanced
| |||
|
Venus very likely underwent a runaway or ‘moist’ greenhouse phase earlier in its history, and today is kept hot by a dense CO2 atmosphere. |
|||||
Climate Myth...
Venus doesn't have a runaway greenhouse effect
"I bought off on the “runaway greenhouse” idea on Venus for several decades (without smoking pot) and only very recently have come to understand that the theory is beyond absurd." (Steve Goddard, WUWT)
At a glance
Earth: we take its existence for granted. But when one looks at its early evolution, from around 4.56 billion years ago, the fact that we are here at all starts to look miraculous.
Over billions of years, stars are born and then die. Our modern telescopes can observe such processes across the cosmos. So we have a reasonable idea of what happened when our own Solar System was young. It started out as a vast spinning disc of dust with the young Sun at its centre. What happened next?
Readers who look up a lot at night will be familiar with shooting stars. These are small remnants of the early Solar System, drawn towards Earth's surface by our planet's gravitational pull. Billions of years ago, the same thing happened but on an absolutely massive scale. Fledgeling protoplanets attracted more and more matter to themselves. Lots of them collided. Eventually out of all this violent chaos, a few winners emerged, making up the Solar System as we now know it.
The early Solar system was also extremely hot. Even more heat was generated during the near-constant collisions and through the super-abundance of fiercely radioactive isotopes. Protoplanets became so hot that they went through a completely molten stage, during which heavy elements such as iron sank down through gravity, towards the centre. That's how their cores formed. At the same time, the displaced lighter material rose, to form their silicate mantles. This dramatic process, that affected all juvenile rocky planets, is known as planetary differentiation.
Earth and Venus are the two largest rocky planets. But at some point after differentiation and solidification of their magma-oceans, their paths diverged. Earth ended up becoming habitable to life, but Venus turned into a hellscape. What happened?
There's a lot we don't know about Venus. But what we do know is that the surface temperature is hot enough to melt lead, at 477 °C (890 °F). Atmospheric pressure is akin to that found on Earth - but over a kilometre down in the oceans. The orbit of Venus may be closer to the Sun but a lot of the sunlight bathing the planet is reflected by the thick and permanent cloud cover. Several attempts to land probes on the surface have seen the craft expire during descent or only a short while (~2 hours max.) after landing.
Nevertheless, radar has been used to map the features of the planetary surface and analyses have been made of the Venusian atmosphere. The latter is almost all carbon dioxide, with a bit of nitrogen. Sulphuric acid droplets make up the clouds. Many hypotheses have been put forward for the evidently different evolution of Venus, but the critical bit - testing them - requires fieldwork under the most difficult conditions in the inner Solar System.
One leading hypothesis is that early on, Venus experienced a runaway water vapour-based greenhouse effect. Water vapour built up in the atmosphere and temperatures rose and rose until a point was reached where the oceans had evaporated. In the upper atmosphere, the water (H2O) molecules were split by exposure to high-energy ultraviolet light and the light hydrogen component escaped to space.
With that progressive loss of water, most processes that consume CO2 would eventually grind to a halt, unlike on Earth. Carbon dioxide released by volcanic activity would then simply accumulate in the Venusian atmosphere over billions of years, creating the stable but unfriendly conditions we see there today.
Earth instead managed to hang onto its water, to become the benign, life-supporting place where we live. We should be grateful!
Please use this form to provide feedback about this new "At a glance" section. Read a more technical version below or dig deeper via the tabs above!
Further details
Venus may have experienced a runaway greenhouse effect in the geological past. To use the term 'runaway' is to refer to a highly specific process when discussed by planetary scientists. Simply having a very hot, high-CO2 atmosphere is not it. So let's start with a tutorial on Venus at the present day.
Venus’ orbit is much closer to the sun, which means it receives almost twice the solar radiation at the top of its atmosphere than Earth. Venus also has a very high albedo which ends up over-compensating for the closer distance to the sun. The result is that less than 10% of that incident solar radiation reaches the surface. High albedo can be attributed to sulphur-bearing compounds, along with minor water vapour (around 20 ppm). These substances form globally encircling sulphuric acid-dominated cloud decks (fig. 1). Venus’ atmosphere also has a surface pressure of around 92 bars (or if you like, 92,000 millibars), equivalent to what you’d feel on Earth beneath more than a kilometre of ocean.
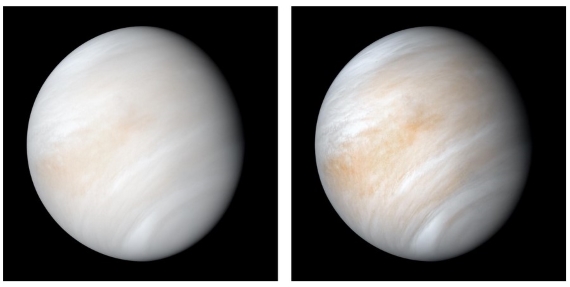
Fig. 1: Venus in its shroud of clouds - a false colour composite created by combining images taken using orange and ultraviolet spectral filters on the Mariner 10 spacecraft's imaging camera.The images used to create this view were acquired in 1974; the RH one has been enhanced to bring out texture and colour. Image: NASA.
Observations of the water vapour content in the Venusian atmosphere show a high heavy to light hydrogen isotopic ratio (D/H). This is best interpreted as the product of a preferential light hydrogen escape to space: deuterium escapes less easily. Venus is considered to have had at least 100 times its current water content in the past (e.g. Selsis et al. 2007 and references therein).
The greenhouse effect on Venus today is primarily caused by CO2, although water vapour and SO2 are important as well. Since most of the radiation that makes its way out to space comes from only the very topmost parts of the atmosphere, it can look as cold as Mars in infra-red (IR) imagery. In reality, the surface of Venus (Fig. 2) is even hotter than the dayside of Mercury, at a deadly 477 °C (890 °F).
Like Earth, the Venusian clouds also generate a greenhouse effect. However, they are poor IR absorbers and emitters compared to water clouds. The sulfuric acid droplets forming the clouds can also scatter IR radiation back to the surface, producing another form of the greenhouse effect in that way. In the dense Venusian CO2-rich atmosphere, there are IR-handling processes at work that are unimportant on modern Earth.
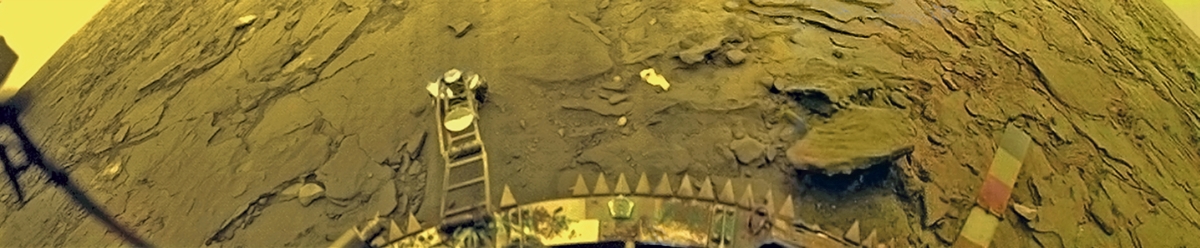
Fig. 2: The Soviet Union's Venera 14 probe captured two colour panoramas of Venus's surface in 1982. This panorama came from the rear camera. Image: Russian Academy of Sciences. More images can be seen at: https://www.planetary.org/articles/every-picture-from-venus-surface-ever
How to get a Runaway?
To get a true runaway greenhouse effect on Venus, you need a combination of solar radiation and the presence of a greenhouse gas. That gas has two key requirements. It must be condensable and it needs to be in equilibrium with its surface reservoir. In addition, its concentration must increase with temperature, as explained by the Clausius-Clapeyron relation. For Venus to enter a runaway greenhouse state, the greenhouse gas of interest is water vapour, plus its liquid reservoir, the water making up the oceans.
The greenhouse effect on any planet involves impeding the flux of outwards longwave radiation to space. Water vapour is very good at this so can potentially lead to a positive feedback runaway scenario. That works as follows: higher temperatures cause ever more water to evaporate and then drive temperatures even higher and on and on it goes - while there is an available liquid water reservoir.
Through water vapour's effectiveness at blocking IR, the outward longwave radiation flux eventually flatlines. If the incoming Solar flux is constantly greater than that outgoing flatline value, the planet is tipped out of radiative equilibrium and we have that runaway. If you like, it has a fever. The reservoir for water vapour - the oceans - is vast. That means the system may only be able to return to radiative equilibrium once the runaway process has stopped. In the extreme runaway greenhouse effect, that cessation may only happen at the point when the whole ocean has evaporated.
On present-day Earth, there is a strong temperature inversion, called the tropopause. It is situated between the troposphere and stratosphere. You can see it on thundery days when the tops of storm-clouds spread out beneath it to form the familiar anvil-shapes. The tropopause thus forms an effective barrier to moisture getting into the stratosphere. At the height of the tropopause on Earth, in any case, it's already too cold for water to remain in the vapour phase. The wispy clouds making up thunderstorm anvils consist of ice crystals. This impediment to water vapour's ascent is often referred to as a 'cold trap'.
In a runaway scenario, such as that proposed for Venus, no such impediment exists. This means the upper atmosphere would have become moist too. On Venus, the troposphere extends to a much greater height than on Earth. There is no stratosphere - we're talking about a very different situation here. That is critical because water vapour, upon reaching such great heights, has energetic Solar ultraviolet (UV) radiation to contend with. The UV is effective at splitting the H2O molecule into its constituent elements. Once that has happened, the hydrogen in particular is easily lost to space. One can envisage that once a runaway greenhouse effect got going, Venus' water content got steadily depleted in this manner through time. If Venus ever had oceans, they must have evaporated into oblivion. Because of the 'cold trap', this form of water-depletion is of very little significance on Earth - thankfully.
Once that water was lost, the chemical processes that lock up carbon in rocks on Earth could not operate. All of them involve water somewhere. Thereafter, every addition of carbon to the atmosphere, large or small, stayed up there. Most CO2 was probably of volcanic origin. The result was the 96.5% CO2 atmosphere and hellish surface temperature of Venus today.
Earth and the Runaway: Past and Future
Currently, Earth is well under the absorbed solar radiation threshold for a runaway greenhouse effect to occur. Its water condenses and is recycled back to the surface as rain, rather than accumulating indefinitely throughout the atmosphere. The opposite is true for CO2, which builds up and up through our emissions, only checked by natural removal processes. Note here that the runaway greenhouse threshold is largely independent of CO2 since the IR opacity is swamped by the water vapour effect. This makes it difficult to justify concerns over a CO2-induced runaway on Earth.
However, this immunity to a runaway greenhouse effect will not last forever. The most realistic scenario for Earth entering a runaway occurs a few billion years in the future, when the sun's brightness has substantially increased. Earth will then receive more sunlight than the outgoing longwave radiation escaping to space. A true runaway greenhouse effect is then able to kick in. Caveats apply, though. For example, greater cloud cover could increase planetary albedo and delay this process.
Interestingly, some (e.g. Zahnle et al. 2007) have argued that Earth may have been in a transient runaway greenhouse phase within the first few million years of its existence. Geothermal heat and the heat flow from the moon-forming impact would have made up for the difference between the net solar insolation and the runaway greenhouse threshold. But if this happened it could only have lasted for a relatively short period of time - since we still have plenty of water on Earth.
For further reading, a recent review paper (Gillmann et al. 2022) explores the various hypotheses concerning the evolution of the Venusian atmosphere over geological time. There's also an excellent book chapter (Arney & Kane. 2020, currently available as a PDF at arXiv). As might be expected, difficulties in fieldwork are plural on Venus and designing a probe that survives touchdown and can go on to do the required data-collecting is still some time away. The key piece of evidence we need to confirm the existence of a runaway greenhouse effect in deep time would be for free water having once been present. But it is apparent that large parts of the surface were covered with lava flows from monster volcanoes at some point. Is that evidence nowhere to be seen, or is it just hiding? Time will tell.
Last updated on 21 January 2024 by John Mason. View Archives


Try again:
The above image shows that most radiation to space from Earth comes from the troposphere, usually the lower troposphere (dotted line is the tropopause), except for a small band absorbed by CO2. The majority of upwelling IR is emitted to space by the surface itself with no absorption by greenhouse gases in the atmosphere. The chart assumes a cloud-free sky, and in real life there are clouds, it is true, but in your above description of cloud cover you said:
This is an under-exaggeration. A cursory look at a photo of Earth from interlunar space
Earth from interlunar space
shows that cloud covers well less than 50% of Earth, probably closer to 30% or 40% using the one significant digit typical of these arguments.
Earth's atmosphere is a leaky greenhouse with half its panes of glass broken or missing.
Mike Hillis @175 and 176, the Clough diagram shows the spectral cooling rate induced by changes in atmospheric composition graphed by wave number and by altitude. It does not show where the radiation comes from. I have discussed it in greater detail here.
The linked photo, "Earth from interlunar space" shows visible light, only, and hence shows only reflected light, not thermal emessions. It is literally irrelevant as evidence regarding the altitude from which most radiation comes.
Finally, your argument @173 that the majority of radiation to space comes from the surface betrays a misunderstanding of how the greenhouse effect works. Specifically, the greenhouse effectg occurs because some radiation from the surface is absorbed in the atmosphere, with radiation from the absorbing layers to space being less intense than the surface radiation because the absorbing layers are cooler. If the radiation from the CO2 band were as intense as that from the surface, there would be no greenhouse effect, yet you appear to be pointing to the reduced intensity in that band as proof that there is no greenhouse effect. Rhetorically that is something like pointing to a satellite photo of the Earth to prove that the Earth is flat.
Consider your graph from 173:
A key feature of the graph is that the total area under the graph equals the radiation to space in W/m^2. Had the radiation in the CO2 absorption band been as intense as that from the surface, there would have been no greenhouse effect as noted. Because it is very much less intense, however, the surface radiation must be stronger to radiate the same amount of energy as would be radiated through an atmosphere with no greenhouse gases. Ergo, the surface must be warmer to radiate the same amount of energy. Hence the presence of greenhouse gases results in the surface being warmer when incoming solar and outgoing IR radiation approach equilibrium.
Tom @177,
In your first paragraph you claim that the spectral cooling rate at various altitudes does not show the altitude from which the radiation from various parts of the spectrum emits. Really? Because that is exactly what it shows, and as far as I can tell, it's the only thing it shows.
In your second paragraph, regarding my linked photo, "Earth from interlunar space," it shows cloud cover and is entirely relevant to the discussion I was having with Glenn because he exaggerated the extent of Earth's cloud cover. Nobody is using it as evidence of altitude of emissions, and you should not enter a conversation unless you take the time to understand what the 2 other parties are discussing. Clouds, being liquid droplets and not gas, are black bodies that block all wavelengths of upwelling IR and emit blackbody radiation from their tops. Being black bodies, the cloud tops can be regarded as new "surfaces" like the terestrial surface, and as such are entirely relevant in discussions of altitude of emissions, since cloud tops can be at various altitudes, although I was not representing them as such. I was only showing that cloud cover was 30 or 40 percent of the globe, not some larger amount as Glenn implied. And you should look up the word "literally" in a dictionary because you use it wrong.
As for the third paragraph, if you do not know that the atmosphere is almost 100% transparent or largely transparent to a majority of upwelling wavelengths of IR, most importantly the large band from 8 to 13 microns known to IR astronomers as the N band, which means they are not absorbed by any greenhouse gases at all and play no role in a greenhouse effect, then I would suggest you not enter scientific discussions on this level until you study the subject. I would like to quote you from another thread, in a comment you made to me recently, which by the way has no discernible meaning:
Mike Hillis @178:
1) Spectral cooling rate is a function of:
Changes in the spectral cooling rate can be due to changes to any of the above. For example, the warming trend (grey shades) at 1100 cm^-1 from approximatley 8 to 28 km are primarilly due to an increase in UV-A and UV-B penetrating to that altitude due to the reduced stratospheric ozone levels. Interpreting it as simply a function of IR emissions to space is wrong. Even the third bulleted factor specified above is not IR radiation to space, but IR radiation in any direction, including downward. When you treat the diagram as being only a function of that one value, and indeed, only of the IR radiation to space, you merely show your ignorance.
2) Allowing that you used the photo to show cloud cover, it only shows the cloud cover over a quarter of the Earth at one point of time. That is no basis from which to infer typical cloud cover. If you instead look to satellite surveys of cloud cover, you see that on average 66% of the Earth is covered by cloud, not 30-40% as you claim:
Even that does not tell you the level of the cloud. Because IR emissions are dependent on temperature, and temperature is a function of altitude, an IR spectrum over cloud cover can tell you the cloud height, and hence the level of emissions. In contrast, the intensity of reflected light tells you nothing about the temperature of the object from which it reflects, and therefore nothing about the altitude from which it is reflected without the use of trignometry to determine distance. Needless to say a single 2D photo does not include that information. Ergo, the photo does not tell you the altitude from which the IR radiation originated on any part of the picture. Now either you knew these facts, and were literally trying to decieve, or again your argument is based on massive ignorance.
3) You site the N-band of 8-13 microns as being largely transparent to IR, ie, a total of 5 microns of the 0.7 - 1000 micron range of IR radiation. That is, it represents 0.5% of the IR spectrum. It is less than a third of the 4-20 micron range typically detected by satellite instruments. And that 8-13 micron range includes the absorption band of ozone, in which the majority of radiation to space comes from the stratosphere. Your claim that "the atmosphere is almost 100% transparent or largely transparent to a majority of upwelling wavelengths of IR" is not even close:
All this, however, is beside the point. If an planet existed with an atmosphere that absorbed 100% of IR in a narrow band with no emission to space, it would mean 100% of IR radiation from that planet would be from the surface. The total IR to space from that planet would still result in less power radiated to space, given the surface temperature of the planet, than would be the case with no atmosphere. Given that total energy in from insolation must match total energy leaving the planet for a stable temperature to exist, that means the surface temperature of the planet must be higher than it would be with no atmosphere. In contrast, a planet with an atmosphere having the same pressure profile but absorbing no IR radiation would not cause the IR to space to be less than the total radiated from the surface, and therefore would not result in an increase in surface temperature at quasi equilibrium.
You have been so eager to accuse me of invincible ignorance that you have merely demonstrated your own.
Mike Hillis
From here "ASSESSMENT OF GLOBAL CLOUD DATA S E T S F RO M S AT E L L IT E S"
One photo isn't exactly a global, time-integrated survey.
"Global total cloud amount (Fig. 1) is about 0.68 (±0.03) when considering clouds with optical depth > 0.1 (retrieval sensitivity of ISCCP during day, PATMOS-x, MODIS-ST, AIRS-LMD, HIRSNOAA, TOVS Path-B, and CALIPSO-GOCCP; cloud detection of MODIS-CE and MISR is slightly less sensitive over land). This value increases to about 0.73 when including subvisible cirrus (CALIPSO-ST) and decreases to about 0.56 for clouds with optical depth > 2 (POLDER). The optimal estimation method of ATSR-GRAPE leads to a slight underestimation (0.62), because only clouds with small uncertainty are reported (based on a single cloud layer model)."
Tom @179
This is the rambling of a non-scientist intending to deceive the readers. The entire 0.7 - 1000 micron range? Really? When we are talking about Earth's upwelling IR? And really, the 4 - 20 micron range detected by satellite instruments? Earth doesn't even emit 4 microns. And dividing up these absurd ranges of wavelengths as if the wavelengths all had equal amplitudes. Unbelievable. And claiming the 8-13 micron range, which presents a major chunk of Earth's Planck curve, and includes the peak wavelength according to Wein's law, is not really transparent because of the trivial 9.6 micron O3 absorption band? This sort of argument makes me want to quote a 1970's bumper sticker:
And a quote from your own post to me in this thread:
I'm done with you Tom. I'm not going to be reading any more of your comments from now on.
[RH] You are going to have to address the points where Tom has shown you in clear error. You don't get to unilaterally abandon a line of discussion once you've been shown to be wrong.
Glenn thanks for the link, I will revise my estimate of 30-40% up to somewhere around 50% for blackbody clouds, since some of the thinner clouds aren't.
Mike Hillis @181, I quote you in full:
I have not challenged the claim that the majority of energy radiated from Earth to space comes from the surface because I do not know it is false. Nor do I know it to be true, though I do know it is irrelevant to the debate. But when you make the damn fool claim that the majority of IR wavelengths are "transparent or largely transparent", I challenged you because it was transparently false. Your response it to claim that you wrote something other than what you actually wrote. Do the decent thing and accept that you mispoke; or confirm that you are deceitful as well as a fool.
And while we are on the topic of your being a fool, we have this prime example:
A fool not simply because you are wrong, but because you make this claim despite the evidence in the chart I showed, where the blue line is Earth's IR spectrum and the lowest wavelength of emissions is clearly seen to be less than 4 microns. But as you have demonstrated repeately on this thread, you never let evidence that would rebut your ideas enter your consciousness, so why would you start now.
Tom Curtis @183,
The usual graphic of the Earth's radiative balance (presented in-thread here @167) suggests that the surface IR emissions to space represent 12% of the total IR at 40wm^-2. Mind, Costa & Shine (2012) point to this being a rather "ad hoc"value and model the clear sky value as being 66Wm^-2 and revise the true global average down from 40WM^-2 to 20Wm^-2 (+/-20%). They conclude "This indicates that less than one-tenth of the Outgoing Longwave Radiation originates directly from the surface."
If the words of Mike Hillis are taken as his position on this %OLR to space, @176 he tells us "The majority of upwelling IR is emitted to space by the surface itself with no absorption by greenhouse gases in the atmosphere" which is quite a staggering assertion. He is asserting the surface IR flux to space is in excess of 120Wm^-2 but presents no evidence in support. Rather we are treated to empty assertiveness.
MA Rodger @184, thanks. Very interesting.
Tom @183:
"Earth doesn't even emit 4 microns."
I wouldn’t say that Mike’s claim is very wrong here. According to this blackbody calculator, a surface at 288 K emits only about 1 % of its total radiation at wavelengths between 3 and 5 µm, so I think it’s safe to say that absorption in that part of the spectrum is pretty insignificant for the greenhouse effect on Earth, though important on Venus.
Mike Hillis@178:
"....if you do not know that the atmosphere is almost 100% transparent or largely transparent to a majority of upwelling wavelengths of IR...."
Let’s compare the IR flow from the surface to that escaping to space in the chart posted by Bob Loblaw in @167.
A simple calculation shows at the latter (239 W/m2) is about 60 % of the former (396 W/m2), so by a simplistic glass greenhouse analogy one could claim that 60 % of the "roof" is open. That’s wrong because the atmospheric greenhouse effect both absorbs and reemits in accordance with the local temperature. As a result, the heat loss to space isn’t reduced to zero in any part of the IR spectrum. Consequently, you could have 100 % absorption in the entire spectrum and still have a more or less "open" greenhouse roof because the altitude of heat loss is just as important as the optical depth of the atmosphere. So, claiming that the atmosphere is largely or almost 100 % transparent to a majority of upwelling IR when the heat loss to space is reduced by 40 % is definitely wrong!
Imagine an Earth with present day surface temperature (288 K) and lapse rate (6.5 K/km) with 100 % cloud cover, the cloud tops 1 km above the surface and no greenhouse gases above them. That atmosphere would be virtually 100 % opaque to IR from the surface, but would that create a strong greenhouse effect? No, because the outgoing IR would only be reduced by 40 W/m2, not 157 W/m2 as in the chart in @167.
Regarding the 8 to 13 µm range, water vapour does absorb some radiation in that part of the spectrum, but pretty weakly. The absorption spectrum of water vapour is quit "messy", with a broad band from about 5 to 8 µm, and lots of very narrow, more or less widely spaced bands after that. The peaks of these narrow bands are at their lowest near 10 µm, but get progressively higher with longer wavelengths. So, much of the radiation escaping to space in the 8 to 13 µm range originates from low level water vapour (and stratospheric ozone), but since this water vapour isn’t much colder than the surface, it has a very minor impact on the greenhouse effect.
HK @186:
1) Again I refer you to the claim I was actually criticizing, ie, that "a majority of upwelling wavelengths of IR" were transparent to, or largely transparent to IR radiation. For a wavelength to fall into that category, and therefore be a relevant wavelength for assessing the claim, it is sufficient that it be a wavelength that emits IR radiation from the surface. However, while the 3-5 micron band is only responsible for % of all radiation from a source at 288 K, the 8-13 micron window that Mike Hillis would have us focus on is only responsible for 9.9%. That compares to 3.8% for the 4-8 micron band, and 9% for the 13-20 micron bands he would have us ignore. Even that comparison falsely favours his case in that he treats the 9.2-10 micron band, heavilly absorbed by O3 and accounting for 1.7% of emmissions at 288 K, as being essentially transparent.
The simply fact is that no matter what end limit I used, the total irradiance from that wavelength is trivial if you concentrate on just that wavelenght. Thus total emission from 7.6-8.6 microns (chosen because it brackets the wavelength of peak emission) represents just 1.8% of total emissions, and hence can be considered trivial. Had he focused just on the low emissions at 4 microns, he would have been cherry picking the edge of a broad band specified (4-20 microns). Of course, he did not even do that, but wrongly claimed zero emissions at 4 microns.
So, in short, he attempted to distract from rather than properly address my criticism by focusing on an edge value rather than the full band, pretended his claim was other than it actually was, and still got the facts wrong. I would say that qualifies as "very wrong", though those were not my words.
2) The point in your final paragraph is a very good one. There is reason earth bound IR telesopes are located at the top of tall mountains, or flown in balloons or planes (something not commented on by deniers when they trot out the "atmospheric window". The impact of water vapour at low levels in that window can be seen from this spectrum of downwelling IR radiation from Nauru, compared to that from Barrow Alaska, where cold weather has condensed most of the water vapour from the atmosphere:
Tom @187:
We are pretty much in agreement, but I want to point out a small error in your last post.
In your calculation of the window radiation (8-13 µm) you seem to have compared the band radiance with the radiant emittance. Note that the unit of the former is W/m2/sr, while the latter is W/m2, without the steradians at the end.
The correct comparison would be band radiance and radiance (the second row in the right column of the Blackbody Calculator). That increases the window fraction of the radiation from 9.9 to 31.2 %. Your conclusion is of course still true, as 68.8 % of the radiation comes from outside the window region, most of it strongly absorbed by the atmosphere, and there is also some absorption within the window itself, mainly by water vapour and ozone.
BTW, I was a little puzzled by the dip near 15 µm in Barrow, until I realised that it probably is the result of a temperature inversion. That part of the spectrum is so strongly absorbed by CO2 that the lower few metres of air is able to block the radiation from the warmer air higher up.
Spectroscopy can obviously tell us a lot about the conditions in an atmosphere. No wonder it’s the most important tool in astrophysics!
HK @188, thanks for the correction.
Which is true, because the section from 8 to 13 is between 95% and 100% transparent, the section from 17 to 100 is largely transparent (let's say around 50% on average. If glass were 50% transparent you'd call it tinted) leaving only the CO2 band from 13 to 17. (The ozone band at 9.6 is not relevant because there is no O3 in the troposphere unless there was alightning storn or somebody hired ToM Curtis to do the electrical work.
Tom quoted me as making
Note his lack of the word "upwelling" and his representing that I was talking about the entire IR spectrum from 700 nanometers to 1 mm, almost all of which is utterly not radiated by Earth.
This is the argument style of a BS artist, plain and simple. He knew I said upwelling, but went on to say something utterly different, fully aware of what he was doing.
As for the gish gallop of whether Earth radiates 4 microns:
[JH] The stricken paragraph is argumentative. Please keep the discussion civil.
Also, what is the source of the graphic embedded in this comment?
[RH] Moderation complaint snipped.
It doesn't
Mike Hillis @190,
Are you saying that when you wrote "the atmosphere is almost 100% transparent or largely transparent to a majority of upwelling wavelengths of IR" @178, you meant to say "the troposphere is almost 100% transparent or largely transparent to a majority of upwelling wavelengths of IR"? [snip].
I also wonder where you base your assertion that the atmosphere (or are we talking 'troposphere' again, although it doesn't matter a jot) is "largely transparent (let's say around 50% on average)" for IR wavelengths between 17 and 100 microns. The graphic below is a reasonably common representation of atmospheric IR absorption and shows rather an absence of transmission all the way up to 70 mocrons. (Elsewhere you can find similar graphics showing this zero transmission continues well beyond 1,000 microns.)
Note also this graphic shows that the level of "upwelling" IR at 4 microns does exceed the level of "upwelling" IR at 100 microns, the latter a wavelength you feel important enough to feature in you analysis. Is there a reason why you are so emphatic that "it doesn't" feature at 4 microns? [snip].
[GT] Hostile tone deleted.
Everyone, time to dial it down and call a halt to the name calling in any form.
Any future posts from anyone guilty of breaches of civility will be deleted.
Mike Hillis @190:
"....because the section from 8 to 13 is between 95% and 100% transparent...."
Take a look at the downwelling radiation at Nauru in @187.
This proves that water vapour can emit radiation between 10 and 13 µm and also between 8 and 9.4 µm. The almost total lack of radiation in Barrow at these wavelengths was caused by an almost total lack of water vapour as the temperature there was lower than -30oC.
From the Wikipedia article about Kirchhoff's law:
"For an arbitrary body emitting and absorbing thermal radiation in thermodynamic equilibrium, the emissivity is equal to the absorptivity."
Which means that if water vapour can emit at these wavelengths mentioned above, it can also absorb at them, although that absorption is pretty weak compared to other parts of the spectrum.
Regarding the rest of the relevant part of the spectrum – the chart posted by MA Rodger clearly shows that you are wrong about your "50% transparency" claim.
Spectral radiance from a 288 K blackbody at some wavelengths, given in W/m2/sr/µm:
4 µm: 0.438
10 µm: 8.114 (close to maximum)
30 µm: 1.143
50 µm: 0.222
100 µm: 0.018
Source: SpectralCalc.com
Mike Hillis @190 [snip].
Highlights:
1) "the section from 8 to 13 is between 95% and 100% transparent"
Ignoring the impact of ozone, it is true that the zone between 8 and 13 microns absorbs typically less than 10% of upwelling radiation from the surface as shown in the following diagram:
But radiation can be not only absorbed, but also scattered; and once absorption and scattering are included it is definitely not the case that the window is 95-100% transparent:
The degree of scattering varies by location, but for tropical regions, and not including scattering by salt or dust, transmittance falls to a mean value of about 0.4 (calculated from Modtran tropical clear sky). The effect of the back scatter plus reemittance are clearly seen in the Nauru downwelling radiation spectrum @187 above. In contrast, for very cold, or very high regions (hence with very little H2O) scattering and absorption falls to near zero in that window. Given that these only account for a small percentage of the Earth's surface, however, a transmittance even in the window of 0.8 is optimistic.
2) "the section from 17 to 100 is largely transparent (let's say around 50% on average"
Not even close. In fact so far from the truth it is difficult to distinguish from bald face lying:
The best that can be said for Mike Hillis claim is that he is mistaking emission from H2O in the atmosphere for emission from the surface. The former results in radiation in those wavelengths of about 50% of the surface expected radiation - but that is only because it is radiated from a higher, and colder location by H2O. That, of course, means radiation in those wavelengths generate a greenhouse effect.
3) "If glass were 50% transparent you'd call it tinted"
Possibly, but the original claim was "the atmosphere is almost 100% transparent or largely transparent to a majority of upwelling wavelengths of IR" and a glass that is 50% absorbing is not "largely transparent". Hillis claim re tinted glass is a transparent attempt to shift the goal posts.
4) "Note his lack of the word "upwelling" and his representing that I was talking about the entire IR spectrum from 700 nanometers to 1 mm, almost all of which is utterly not radiated by Earth"
Possibly more to the point, note the way Hillis avoids discussing the fact that I discusses to wavelength ranges, ie, the full IR spectrum and the more restricted range observed by IR satellites. That is because it was ambiguous what HIllis means by "upwelling".
The fact is that even at 0.7-0.8 microns,a 288 K black body, and hence also the Earth's surface, radiates energy (as can be checked on Spectral Calc). It certainly radiates at all wavelengths longer than that. Ergo, unless an intensity restriction is placed on what is considered to be an "upwelling wavelength", the entire IR spectrum has upwelling radiation from the Earth. If an intensity limit was intended, it should have been stated. The failure to prescribe it was Hillis fault, not my own.
Granted that if such an intensity limit has been stated, that would have cut of the higher and lower wavelengths. Except for tendentious limits, however, it would not have cut of the 4-20 micron range which I also discussed.
In all, Hillis [snip]... the faults in his presentation (ie, not being explicit about the wavelengths which he considered, and or explicitly stating a radiance threshold to be considered "upwelling").
[snip]
[GT] Insulting tone deleted.
The bitching has gone on long enough, irrespective of any ones views about who is at fault.
Everyone cease and desist immediately.
Any future comments containing any such tone or breaches of the code of conduct will be deleted. Stick to the science!
Upwelling radiation below 6 and above 30, for the purposes of a discussion about the Earth's greenhouse effect and the absorbtion of IR by its atmosphere, is trivial.
Also, the technologically defined end of the IR spectrum is around 350 um because waves around that length act less like photons and more and more like waves, according to Ian Glass p 27 of "Handbook of Infrared Astronomy"
I admit to thinking as an IR astronomer because most of my work in the field has been at Mauna Kea, which is high above much of Earth's water vapor, so I automatically didn't consider the difference when talking about the Q-band (17 - 24 micron) absorbing properties of the atmopshere at sea level, where much of the transmittance is brought down to a 20 or 40 %, while it remains a roughly flat 50% transmittance at Mauna Kea up to about 28. I will scan some charts now for the next post.
For all intents and purposes, transmittance in the N band on Mauna Kea is 100% or darn close to it. The reason we moved, first to Antarctica and then to Hubble, is due to the need to see things in the opaque bands, not because of any improvement in seeing in the N band, or even the Q band, really.
Mike Hillis @195,
It will be most interesting to see some charts that demonstrate that "upwelling radiation below 6 and above 30, for the purposes of a discussion about the Earth's greenhouse effect and the absorbtion of IR by its atmosphere, is trivial," especially given that chart you linked to @173 (in this thread about Venus) that also shows the "trivial" effect of doubling trace gas CO2.
Mike Hillis
IR Radiation outside 6-30 micron is still around 15% of total Radiance. Not that trivial. See here for the calculation.
Total Radiance for a temperature of 288K, emissivity of 1 is 124.178 W/m2/sr
Band Radiance between 6 & 30 is 105.277 W/m2/sr
So outside that band is 18.9 W/m2/sr
Mikw Hillis
From an earlier comment you made "The ozone band at 9.6 is not relevant because there is no O3 in the troposphere".
Not true. Ozone measured at Mauna Loa for example fluctuates around 40 ppb. Tropospheric ozone is formed via photochemical reactions with a number of largely man-made atmospheric pollutants. See here.
If I plug a figure of 40 ppb forTropospheric Ozone into the Modtran calculator at U Chicago, and contrast that with 0 ppb, using a US Standard Atmosphere, the difference is 0.565 W/m2. Not in the same league as the forcing from doubling CO2 of 3.7 W/m2 but still not trivial -15%
This discussion has been mostly about Earth lately, so I thought it was time to return to our beautiful/hellish sister planet!
The chart below illustrates the point I made in @141 and in the last paragraph of @160:
If the extreme temperature on Venus was caused by any kind of additional energy source rather than the atmosphere slowing down the heat loss to space, the red curve based on measurements outside the atmosphere would have been much closer to the black one.
It’s hard to find a more crystal clear fingerprint of an extreme greenhouse effect in action than this!
Source:
SpectralCalc.com and figure 3c here.
Yes, below 6 um and above 30 are trivial:
Now back to Venus