


 Arguments


The runaway greenhouse effect on Venus
What the science says...
| Select a level... |
 Basic
Basic
|
 Advanced
| |||
|
Venus very likely underwent a runaway or ‘moist’ greenhouse phase earlier in its history, and today is kept hot by a dense CO2 atmosphere. |
|||||
Climate Myth...
Venus doesn't have a runaway greenhouse effect
"I bought off on the “runaway greenhouse” idea on Venus for several decades (without smoking pot) and only very recently have come to understand that the theory is beyond absurd." (Steve Goddard, WUWT)
At a glance
Earth: we take its existence for granted. But when one looks at its early evolution, from around 4.56 billion years ago, the fact that we are here at all starts to look miraculous.
Over billions of years, stars are born and then die. Our modern telescopes can observe such processes across the cosmos. So we have a reasonable idea of what happened when our own Solar System was young. It started out as a vast spinning disc of dust with the young Sun at its centre. What happened next?
Readers who look up a lot at night will be familiar with shooting stars. These are small remnants of the early Solar System, drawn towards Earth's surface by our planet's gravitational pull. Billions of years ago, the same thing happened but on an absolutely massive scale. Fledgeling protoplanets attracted more and more matter to themselves. Lots of them collided. Eventually out of all this violent chaos, a few winners emerged, making up the Solar System as we now know it.
The early Solar system was also extremely hot. Even more heat was generated during the near-constant collisions and through the super-abundance of fiercely radioactive isotopes. Protoplanets became so hot that they went through a completely molten stage, during which heavy elements such as iron sank down through gravity, towards the centre. That's how their cores formed. At the same time, the displaced lighter material rose, to form their silicate mantles. This dramatic process, that affected all juvenile rocky planets, is known as planetary differentiation.
Earth and Venus are the two largest rocky planets. But at some point after differentiation and solidification of their magma-oceans, their paths diverged. Earth ended up becoming habitable to life, but Venus turned into a hellscape. What happened?
There's a lot we don't know about Venus. But what we do know is that the surface temperature is hot enough to melt lead, at 477 °C (890 °F). Atmospheric pressure is akin to that found on Earth - but over a kilometre down in the oceans. The orbit of Venus may be closer to the Sun but a lot of the sunlight bathing the planet is reflected by the thick and permanent cloud cover. Several attempts to land probes on the surface have seen the craft expire during descent or only a short while (~2 hours max.) after landing.
Nevertheless, radar has been used to map the features of the planetary surface and analyses have been made of the Venusian atmosphere. The latter is almost all carbon dioxide, with a bit of nitrogen. Sulphuric acid droplets make up the clouds. Many hypotheses have been put forward for the evidently different evolution of Venus, but the critical bit - testing them - requires fieldwork under the most difficult conditions in the inner Solar System.
One leading hypothesis is that early on, Venus experienced a runaway water vapour-based greenhouse effect. Water vapour built up in the atmosphere and temperatures rose and rose until a point was reached where the oceans had evaporated. In the upper atmosphere, the water (H2O) molecules were split by exposure to high-energy ultraviolet light and the light hydrogen component escaped to space.
With that progressive loss of water, most processes that consume CO2 would eventually grind to a halt, unlike on Earth. Carbon dioxide released by volcanic activity would then simply accumulate in the Venusian atmosphere over billions of years, creating the stable but unfriendly conditions we see there today.
Earth instead managed to hang onto its water, to become the benign, life-supporting place where we live. We should be grateful!
Please use this form to provide feedback about this new "At a glance" section. Read a more technical version below or dig deeper via the tabs above!
Further details
Venus may have experienced a runaway greenhouse effect in the geological past. To use the term 'runaway' is to refer to a highly specific process when discussed by planetary scientists. Simply having a very hot, high-CO2 atmosphere is not it. So let's start with a tutorial on Venus at the present day.
Venus’ orbit is much closer to the sun, which means it receives almost twice the solar radiation at the top of its atmosphere than Earth. Venus also has a very high albedo which ends up over-compensating for the closer distance to the sun. The result is that less than 10% of that incident solar radiation reaches the surface. High albedo can be attributed to sulphur-bearing compounds, along with minor water vapour (around 20 ppm). These substances form globally encircling sulphuric acid-dominated cloud decks (fig. 1). Venus’ atmosphere also has a surface pressure of around 92 bars (or if you like, 92,000 millibars), equivalent to what you’d feel on Earth beneath more than a kilometre of ocean.
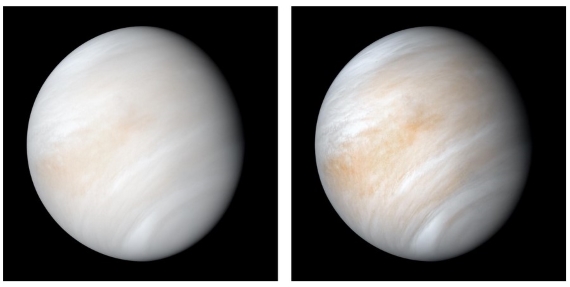
Fig. 1: Venus in its shroud of clouds - a false colour composite created by combining images taken using orange and ultraviolet spectral filters on the Mariner 10 spacecraft's imaging camera.The images used to create this view were acquired in 1974; the RH one has been enhanced to bring out texture and colour. Image: NASA.
Observations of the water vapour content in the Venusian atmosphere show a high heavy to light hydrogen isotopic ratio (D/H). This is best interpreted as the product of a preferential light hydrogen escape to space: deuterium escapes less easily. Venus is considered to have had at least 100 times its current water content in the past (e.g. Selsis et al. 2007 and references therein).
The greenhouse effect on Venus today is primarily caused by CO2, although water vapour and SO2 are important as well. Since most of the radiation that makes its way out to space comes from only the very topmost parts of the atmosphere, it can look as cold as Mars in infra-red (IR) imagery. In reality, the surface of Venus (Fig. 2) is even hotter than the dayside of Mercury, at a deadly 477 °C (890 °F).
Like Earth, the Venusian clouds also generate a greenhouse effect. However, they are poor IR absorbers and emitters compared to water clouds. The sulfuric acid droplets forming the clouds can also scatter IR radiation back to the surface, producing another form of the greenhouse effect in that way. In the dense Venusian CO2-rich atmosphere, there are IR-handling processes at work that are unimportant on modern Earth.
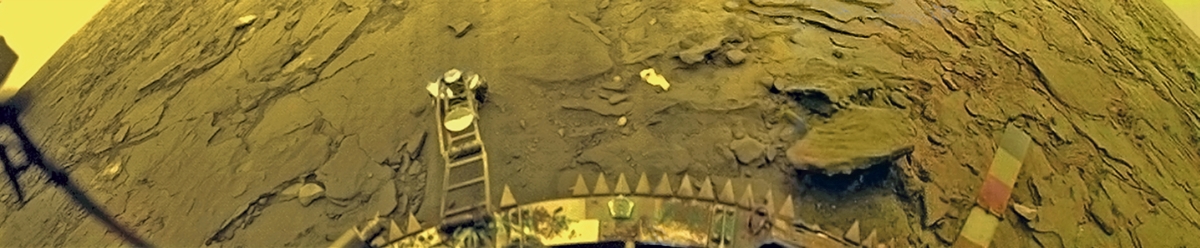
Fig. 2: The Soviet Union's Venera 14 probe captured two colour panoramas of Venus's surface in 1982. This panorama came from the rear camera. Image: Russian Academy of Sciences. More images can be seen at: https://www.planetary.org/articles/every-picture-from-venus-surface-ever
How to get a Runaway?
To get a true runaway greenhouse effect on Venus, you need a combination of solar radiation and the presence of a greenhouse gas. That gas has two key requirements. It must be condensable and it needs to be in equilibrium with its surface reservoir. In addition, its concentration must increase with temperature, as explained by the Clausius-Clapeyron relation. For Venus to enter a runaway greenhouse state, the greenhouse gas of interest is water vapour, plus its liquid reservoir, the water making up the oceans.
The greenhouse effect on any planet involves impeding the flux of outwards longwave radiation to space. Water vapour is very good at this so can potentially lead to a positive feedback runaway scenario. That works as follows: higher temperatures cause ever more water to evaporate and then drive temperatures even higher and on and on it goes - while there is an available liquid water reservoir.
Through water vapour's effectiveness at blocking IR, the outward longwave radiation flux eventually flatlines. If the incoming Solar flux is constantly greater than that outgoing flatline value, the planet is tipped out of radiative equilibrium and we have that runaway. If you like, it has a fever. The reservoir for water vapour - the oceans - is vast. That means the system may only be able to return to radiative equilibrium once the runaway process has stopped. In the extreme runaway greenhouse effect, that cessation may only happen at the point when the whole ocean has evaporated.
On present-day Earth, there is a strong temperature inversion, called the tropopause. It is situated between the troposphere and stratosphere. You can see it on thundery days when the tops of storm-clouds spread out beneath it to form the familiar anvil-shapes. The tropopause thus forms an effective barrier to moisture getting into the stratosphere. At the height of the tropopause on Earth, in any case, it's already too cold for water to remain in the vapour phase. The wispy clouds making up thunderstorm anvils consist of ice crystals. This impediment to water vapour's ascent is often referred to as a 'cold trap'.
In a runaway scenario, such as that proposed for Venus, no such impediment exists. This means the upper atmosphere would have become moist too. On Venus, the troposphere extends to a much greater height than on Earth. There is no stratosphere - we're talking about a very different situation here. That is critical because water vapour, upon reaching such great heights, has energetic Solar ultraviolet (UV) radiation to contend with. The UV is effective at splitting the H2O molecule into its constituent elements. Once that has happened, the hydrogen in particular is easily lost to space. One can envisage that once a runaway greenhouse effect got going, Venus' water content got steadily depleted in this manner through time. If Venus ever had oceans, they must have evaporated into oblivion. Because of the 'cold trap', this form of water-depletion is of very little significance on Earth - thankfully.
Once that water was lost, the chemical processes that lock up carbon in rocks on Earth could not operate. All of them involve water somewhere. Thereafter, every addition of carbon to the atmosphere, large or small, stayed up there. Most CO2 was probably of volcanic origin. The result was the 96.5% CO2 atmosphere and hellish surface temperature of Venus today.
Earth and the Runaway: Past and Future
Currently, Earth is well under the absorbed solar radiation threshold for a runaway greenhouse effect to occur. Its water condenses and is recycled back to the surface as rain, rather than accumulating indefinitely throughout the atmosphere. The opposite is true for CO2, which builds up and up through our emissions, only checked by natural removal processes. Note here that the runaway greenhouse threshold is largely independent of CO2 since the IR opacity is swamped by the water vapour effect. This makes it difficult to justify concerns over a CO2-induced runaway on Earth.
However, this immunity to a runaway greenhouse effect will not last forever. The most realistic scenario for Earth entering a runaway occurs a few billion years in the future, when the sun's brightness has substantially increased. Earth will then receive more sunlight than the outgoing longwave radiation escaping to space. A true runaway greenhouse effect is then able to kick in. Caveats apply, though. For example, greater cloud cover could increase planetary albedo and delay this process.
Interestingly, some (e.g. Zahnle et al. 2007) have argued that Earth may have been in a transient runaway greenhouse phase within the first few million years of its existence. Geothermal heat and the heat flow from the moon-forming impact would have made up for the difference between the net solar insolation and the runaway greenhouse threshold. But if this happened it could only have lasted for a relatively short period of time - since we still have plenty of water on Earth.
For further reading, a recent review paper (Gillmann et al. 2022) explores the various hypotheses concerning the evolution of the Venusian atmosphere over geological time. There's also an excellent book chapter (Arney & Kane. 2020, currently available as a PDF at arXiv). As might be expected, difficulties in fieldwork are plural on Venus and designing a probe that survives touchdown and can go on to do the required data-collecting is still some time away. The key piece of evidence we need to confirm the existence of a runaway greenhouse effect in deep time would be for free water having once been present. But it is apparent that large parts of the surface were covered with lava flows from monster volcanoes at some point. Is that evidence nowhere to be seen, or is it just hiding? Time will tell.
Last updated on 21 January 2024 by John Mason. View Archives


[DB] An open-pdf can be found here:
http://people.psych.cornell.edu/~dunning/publications/pdf/unskilledandunaware.pdf
[DB] "How did they measure this ?"
Please read the links given in the IPCC chapter you refer to. And at least try to be on-topic here. You were previously given advice on using the Search function to find better threads for this type of discussion and advice to read first and then ask questions: try to follow that sage advice.
Further off-topic comments will be deleted.
Mike, The equation you present simply says that temperatures will increase 5.35˚F for every doubling of CO2. It's a restatement of the equation in Celsius:From this perhaps it is easy for you to see that this equation simply assumes a climate sensitivity of 3˚C per doubling of CO2, something I'm sure you've seen before. Search for "climate sensitivity" to see the various ways in which that is estimated.