


 Arguments


The runaway greenhouse effect on Venus
What the science says...
| Select a level... |
 Basic
Basic
|
 Advanced
| |||
|
Venus very likely underwent a runaway or ‘moist’ greenhouse phase earlier in its history, and today is kept hot by a dense CO2 atmosphere. |
|||||
Climate Myth...
Venus doesn't have a runaway greenhouse effect
"I bought off on the “runaway greenhouse” idea on Venus for several decades (without smoking pot) and only very recently have come to understand that the theory is beyond absurd." (Steve Goddard, WUWT)
At a glance
Earth: we take its existence for granted. But when one looks at its early evolution, from around 4.56 billion years ago, the fact that we are here at all starts to look miraculous.
Over billions of years, stars are born and then die. Our modern telescopes can observe such processes across the cosmos. So we have a reasonable idea of what happened when our own Solar System was young. It started out as a vast spinning disc of dust with the young Sun at its centre. What happened next?
Readers who look up a lot at night will be familiar with shooting stars. These are small remnants of the early Solar System, drawn towards Earth's surface by our planet's gravitational pull. Billions of years ago, the same thing happened but on an absolutely massive scale. Fledgeling protoplanets attracted more and more matter to themselves. Lots of them collided. Eventually out of all this violent chaos, a few winners emerged, making up the Solar System as we now know it.
The early Solar system was also extremely hot. Even more heat was generated during the near-constant collisions and through the super-abundance of fiercely radioactive isotopes. Protoplanets became so hot that they went through a completely molten stage, during which heavy elements such as iron sank down through gravity, towards the centre. That's how their cores formed. At the same time, the displaced lighter material rose, to form their silicate mantles. This dramatic process, that affected all juvenile rocky planets, is known as planetary differentiation.
Earth and Venus are the two largest rocky planets. But at some point after differentiation and solidification of their magma-oceans, their paths diverged. Earth ended up becoming habitable to life, but Venus turned into a hellscape. What happened?
There's a lot we don't know about Venus. But what we do know is that the surface temperature is hot enough to melt lead, at 477 °C (890 °F). Atmospheric pressure is akin to that found on Earth - but over a kilometre down in the oceans. The orbit of Venus may be closer to the Sun but a lot of the sunlight bathing the planet is reflected by the thick and permanent cloud cover. Several attempts to land probes on the surface have seen the craft expire during descent or only a short while (~2 hours max.) after landing.
Nevertheless, radar has been used to map the features of the planetary surface and analyses have been made of the Venusian atmosphere. The latter is almost all carbon dioxide, with a bit of nitrogen. Sulphuric acid droplets make up the clouds. Many hypotheses have been put forward for the evidently different evolution of Venus, but the critical bit - testing them - requires fieldwork under the most difficult conditions in the inner Solar System.
One leading hypothesis is that early on, Venus experienced a runaway water vapour-based greenhouse effect. Water vapour built up in the atmosphere and temperatures rose and rose until a point was reached where the oceans had evaporated. In the upper atmosphere, the water (H2O) molecules were split by exposure to high-energy ultraviolet light and the light hydrogen component escaped to space.
With that progressive loss of water, most processes that consume CO2 would eventually grind to a halt, unlike on Earth. Carbon dioxide released by volcanic activity would then simply accumulate in the Venusian atmosphere over billions of years, creating the stable but unfriendly conditions we see there today.
Earth instead managed to hang onto its water, to become the benign, life-supporting place where we live. We should be grateful!
Please use this form to provide feedback about this new "At a glance" section. Read a more technical version below or dig deeper via the tabs above!
Further details
Venus may have experienced a runaway greenhouse effect in the geological past. To use the term 'runaway' is to refer to a highly specific process when discussed by planetary scientists. Simply having a very hot, high-CO2 atmosphere is not it. So let's start with a tutorial on Venus at the present day.
Venus’ orbit is much closer to the sun, which means it receives almost twice the solar radiation at the top of its atmosphere than Earth. Venus also has a very high albedo which ends up over-compensating for the closer distance to the sun. The result is that less than 10% of that incident solar radiation reaches the surface. High albedo can be attributed to sulphur-bearing compounds, along with minor water vapour (around 20 ppm). These substances form globally encircling sulphuric acid-dominated cloud decks (fig. 1). Venus’ atmosphere also has a surface pressure of around 92 bars (or if you like, 92,000 millibars), equivalent to what you’d feel on Earth beneath more than a kilometre of ocean.
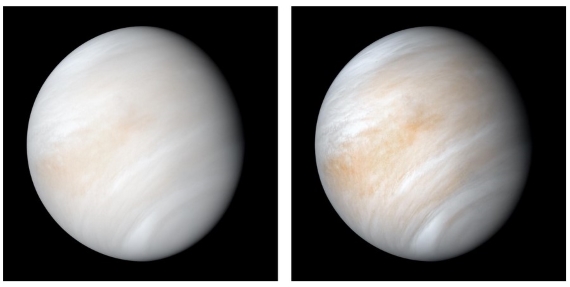
Fig. 1: Venus in its shroud of clouds - a false colour composite created by combining images taken using orange and ultraviolet spectral filters on the Mariner 10 spacecraft's imaging camera.The images used to create this view were acquired in 1974; the RH one has been enhanced to bring out texture and colour. Image: NASA.
Observations of the water vapour content in the Venusian atmosphere show a high heavy to light hydrogen isotopic ratio (D/H). This is best interpreted as the product of a preferential light hydrogen escape to space: deuterium escapes less easily. Venus is considered to have had at least 100 times its current water content in the past (e.g. Selsis et al. 2007 and references therein).
The greenhouse effect on Venus today is primarily caused by CO2, although water vapour and SO2 are important as well. Since most of the radiation that makes its way out to space comes from only the very topmost parts of the atmosphere, it can look as cold as Mars in infra-red (IR) imagery. In reality, the surface of Venus (Fig. 2) is even hotter than the dayside of Mercury, at a deadly 477 °C (890 °F).
Like Earth, the Venusian clouds also generate a greenhouse effect. However, they are poor IR absorbers and emitters compared to water clouds. The sulfuric acid droplets forming the clouds can also scatter IR radiation back to the surface, producing another form of the greenhouse effect in that way. In the dense Venusian CO2-rich atmosphere, there are IR-handling processes at work that are unimportant on modern Earth.
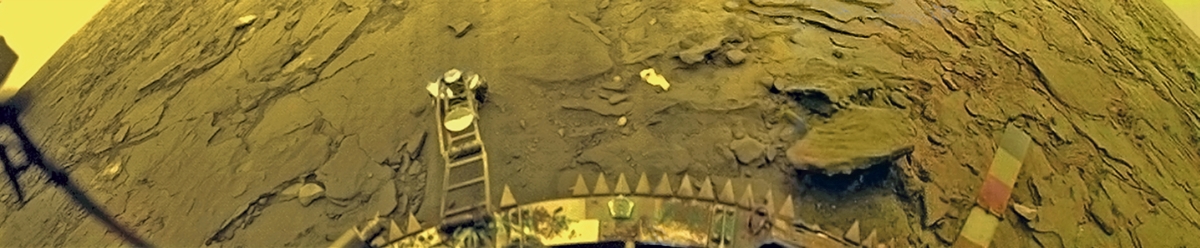
Fig. 2: The Soviet Union's Venera 14 probe captured two colour panoramas of Venus's surface in 1982. This panorama came from the rear camera. Image: Russian Academy of Sciences. More images can be seen at: https://www.planetary.org/articles/every-picture-from-venus-surface-ever
How to get a Runaway?
To get a true runaway greenhouse effect on Venus, you need a combination of solar radiation and the presence of a greenhouse gas. That gas has two key requirements. It must be condensable and it needs to be in equilibrium with its surface reservoir. In addition, its concentration must increase with temperature, as explained by the Clausius-Clapeyron relation. For Venus to enter a runaway greenhouse state, the greenhouse gas of interest is water vapour, plus its liquid reservoir, the water making up the oceans.
The greenhouse effect on any planet involves impeding the flux of outwards longwave radiation to space. Water vapour is very good at this so can potentially lead to a positive feedback runaway scenario. That works as follows: higher temperatures cause ever more water to evaporate and then drive temperatures even higher and on and on it goes - while there is an available liquid water reservoir.
Through water vapour's effectiveness at blocking IR, the outward longwave radiation flux eventually flatlines. If the incoming Solar flux is constantly greater than that outgoing flatline value, the planet is tipped out of radiative equilibrium and we have that runaway. If you like, it has a fever. The reservoir for water vapour - the oceans - is vast. That means the system may only be able to return to radiative equilibrium once the runaway process has stopped. In the extreme runaway greenhouse effect, that cessation may only happen at the point when the whole ocean has evaporated.
On present-day Earth, there is a strong temperature inversion, called the tropopause. It is situated between the troposphere and stratosphere. You can see it on thundery days when the tops of storm-clouds spread out beneath it to form the familiar anvil-shapes. The tropopause thus forms an effective barrier to moisture getting into the stratosphere. At the height of the tropopause on Earth, in any case, it's already too cold for water to remain in the vapour phase. The wispy clouds making up thunderstorm anvils consist of ice crystals. This impediment to water vapour's ascent is often referred to as a 'cold trap'.
In a runaway scenario, such as that proposed for Venus, no such impediment exists. This means the upper atmosphere would have become moist too. On Venus, the troposphere extends to a much greater height than on Earth. There is no stratosphere - we're talking about a very different situation here. That is critical because water vapour, upon reaching such great heights, has energetic Solar ultraviolet (UV) radiation to contend with. The UV is effective at splitting the H2O molecule into its constituent elements. Once that has happened, the hydrogen in particular is easily lost to space. One can envisage that once a runaway greenhouse effect got going, Venus' water content got steadily depleted in this manner through time. If Venus ever had oceans, they must have evaporated into oblivion. Because of the 'cold trap', this form of water-depletion is of very little significance on Earth - thankfully.
Once that water was lost, the chemical processes that lock up carbon in rocks on Earth could not operate. All of them involve water somewhere. Thereafter, every addition of carbon to the atmosphere, large or small, stayed up there. Most CO2 was probably of volcanic origin. The result was the 96.5% CO2 atmosphere and hellish surface temperature of Venus today.
Earth and the Runaway: Past and Future
Currently, Earth is well under the absorbed solar radiation threshold for a runaway greenhouse effect to occur. Its water condenses and is recycled back to the surface as rain, rather than accumulating indefinitely throughout the atmosphere. The opposite is true for CO2, which builds up and up through our emissions, only checked by natural removal processes. Note here that the runaway greenhouse threshold is largely independent of CO2 since the IR opacity is swamped by the water vapour effect. This makes it difficult to justify concerns over a CO2-induced runaway on Earth.
However, this immunity to a runaway greenhouse effect will not last forever. The most realistic scenario for Earth entering a runaway occurs a few billion years in the future, when the sun's brightness has substantially increased. Earth will then receive more sunlight than the outgoing longwave radiation escaping to space. A true runaway greenhouse effect is then able to kick in. Caveats apply, though. For example, greater cloud cover could increase planetary albedo and delay this process.
Interestingly, some (e.g. Zahnle et al. 2007) have argued that Earth may have been in a transient runaway greenhouse phase within the first few million years of its existence. Geothermal heat and the heat flow from the moon-forming impact would have made up for the difference between the net solar insolation and the runaway greenhouse threshold. But if this happened it could only have lasted for a relatively short period of time - since we still have plenty of water on Earth.
For further reading, a recent review paper (Gillmann et al. 2022) explores the various hypotheses concerning the evolution of the Venusian atmosphere over geological time. There's also an excellent book chapter (Arney & Kane. 2020, currently available as a PDF at arXiv). As might be expected, difficulties in fieldwork are plural on Venus and designing a probe that survives touchdown and can go on to do the required data-collecting is still some time away. The key piece of evidence we need to confirm the existence of a runaway greenhouse effect in deep time would be for free water having once been present. But it is apparent that large parts of the surface were covered with lava flows from monster volcanoes at some point. Is that evidence nowhere to be seen, or is it just hiding? Time will tell.
Last updated on 21 January 2024 by John Mason. View Archives


Mike
15% outside 6-30 isn't trivial in my book.
Mike, your comment about Mauna Kea which is just over 4000 meters high.
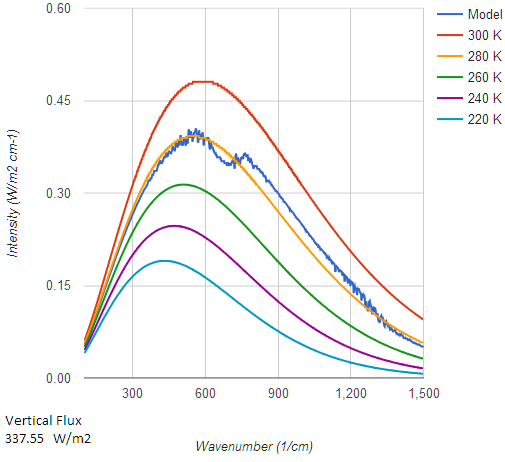
Stop and consider what one would see if you were to look down from that altitude. Here are a series of emission spectra, calculated using Modtran with different lookdown altitudes starting at zero - the surface. All graphs are using US Standard Atmosphere, surface temperature of 288.2 K, clear sky, 400 ppm CO2, 1.7 ppm CH4, 40 ppb Tropospheric O3, standard values for atmospheric water and Stratospheric O3.
As you go up in level you are seeing the impact of the levels below. When one part of the graph doesn't change between one level and the next, then the atmosphere has become transparent at that wavenumber. Also note the total upwards radiatave flux and how it declines with altitude.
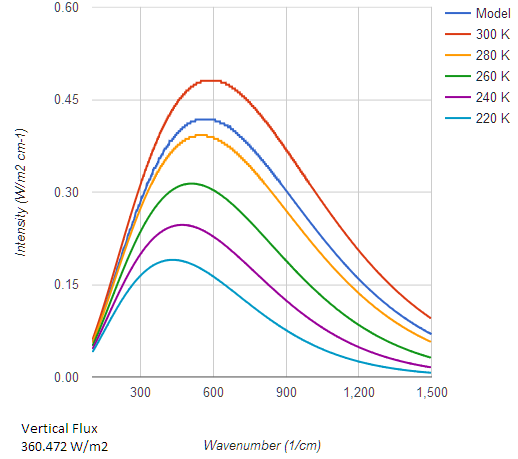
This is the surface. Flux is 360.472 W/m2. It follows the Planck Curve for 288.2K
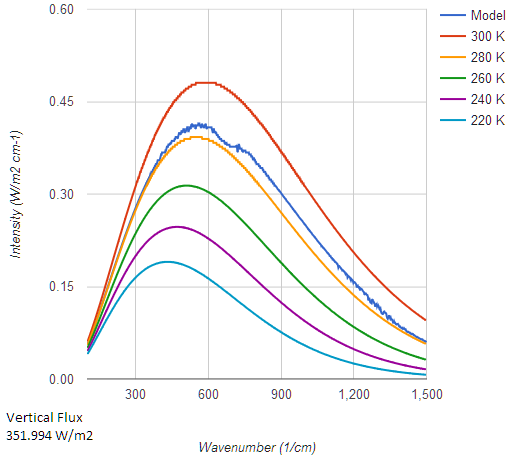
Next 1 km up, looking down. Flux has dropped to 351.994 Some small declines across the water bands, slightly larger effect from the CO2 band. Atmospheric window unchanged.
Next 2 km. Flux is now 337.55. More activity from water and CO2.
Next is 4km. Flux now 312.242 W/m2. The CO2 notch becoming more pronounced, Also the water regions are becoming more jagged. I will dscuss this later.
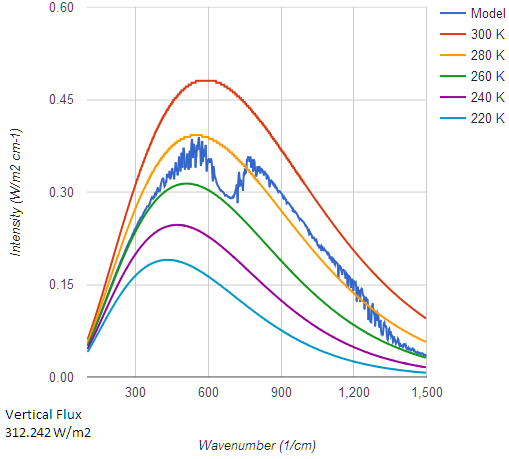
We have only just reched the altitude of Mauna Kea and activity from below has alreaady reduced the flux compared to the surface by around 48 W/m2. This much has happened before we even consider looking up.
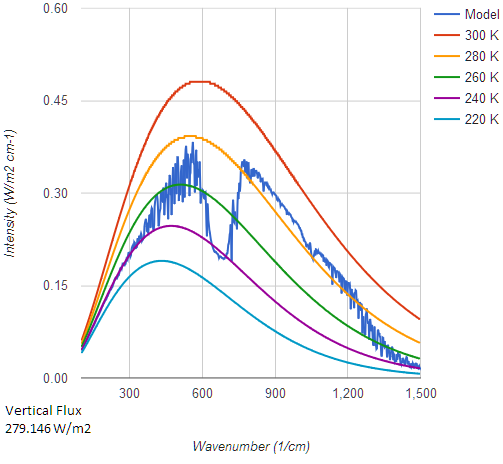
Next, 8km. Now in the upper troposphere. Flux is now 279.146. CO2 notch very prominent. Around 32 W/m2 decline in flux over the second 4 km contrasted with 48 W/M2 in the first 4 km. Reduced change from the water vapour regions nearere the CO2 regions, but still change below 450 and above 1350 cm-1.
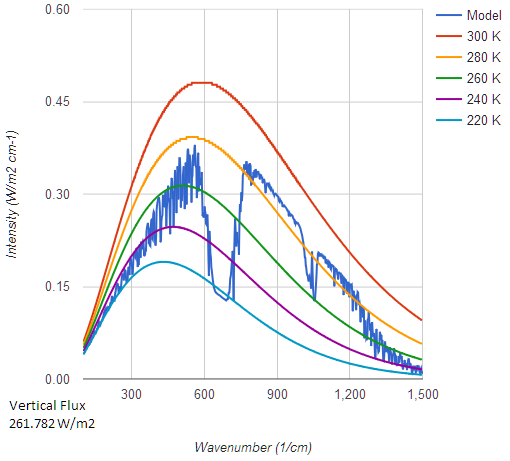
Next 16 km up. Now we are into the lower Stratosphere. Flux is now 261.782 W/M2. Only around 17.5 W/M2 change over the last 8 km vs around 71 W/M2 in the first 8 km. Essentially no change in any of the water bands above 450 cm-1. Water is only contributing more below 450 cm-1. where it is a stronger absorber. The atmosphere is now quite dry. CO2 is still contributing significantly and the Ozone notch due to statospheric Ozone has kicked in.
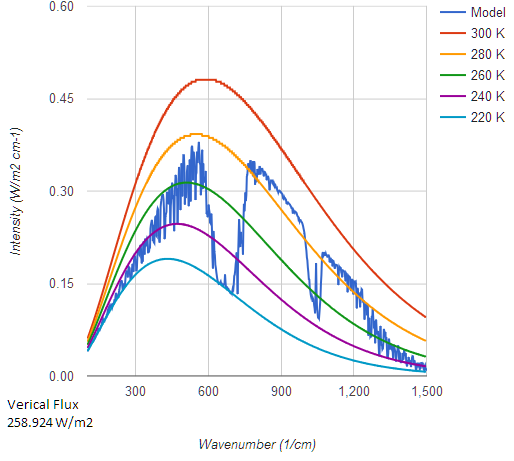
Next, 32 km looking down. Now in the upper Stratosphere where air temperatures are starting to rise. Flux is now 258.924. Only a small contribution now, mainly from Ozone. Notice the small spike visible at the bottom of the CO2 notch, and that the bottom of the notch is no longer below the 220 K Plamck curve but actuall is sitting on it. The CO2 band is actually radiating slightly more. This is originating from the warmer upper stratosphere.
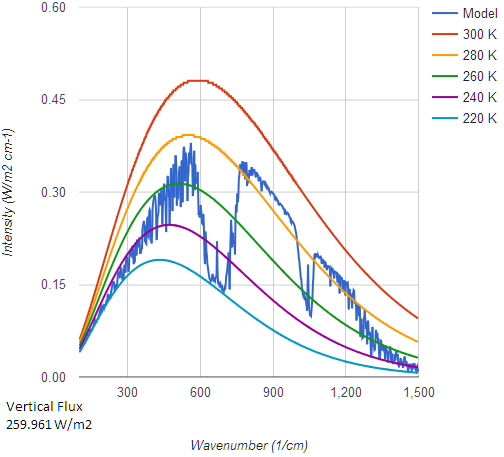
Next, 70 km looking down. Flux is now 259.961. Flux has actually increased slightly. Ozone hasn't contributed any more but the CO2 notch is now sitting a little above the 220K planck line and the central spike is higher. CO2 is adding slightly to emissions above the 32 km level.
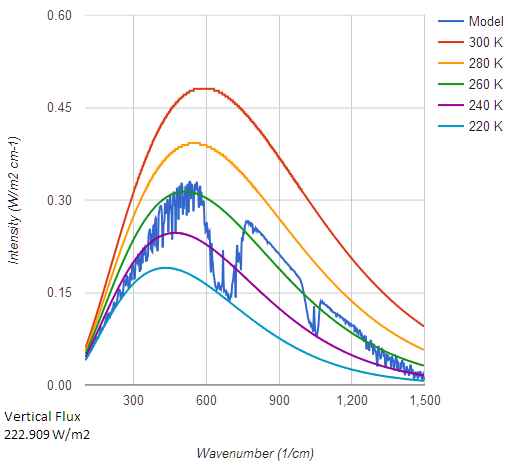
Finally, the same 70 km lookdown height, but with a cumulus cloud model added. Flux is now down to 222.909, 37 W/M2 lower! And we can see visibly reduced emissions across the water and atmospheric window regions from 450 to 1350 cm-1.
Summary.
Total decline in radiative flux between the surface and 70 km - (360.472 - 259.961) = 100.511 W/M2
Around 48% of this occurs within the first 4 km, below the height of Mauna Kea!
Another 32% occurs from 4 to 8 km, only partly due to water vapour.
The remaining 30% occurs from 8 km up.
Then adding clouds adds a further 37 W/M2 of reduction.
And a note about how jagged the curve becomes as we ascend. We are seeing the declining impact of line broadening. At lower altitudes the individual absorption lines are smeared out over each other producing more even absorption/emission. At higher altitudes we start to see the individal spectral lines standing out more distinctly.
Mike
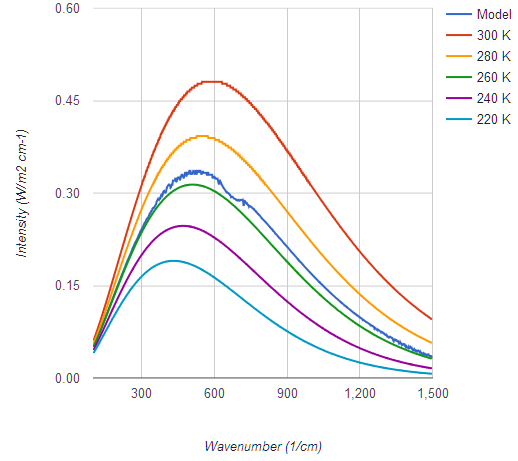
Finally, contrast this run, again with the Cumulus cloud model looking down from 4 km with the clear sky 4 km lookdown graph above. The presence of the clouds wipes out all structure from below, absorbs everything including in the Atmospheric Window (N-band) and forces emissions across the spectrum to a lower value. The model sets the cloudtops at 2.7 km.
A lot of stuff happens below the height of Mauna Kea. And since the average altitude of all land is around 850 meters, biasing your thinking around what happens above 4000 metres is missing a hell of a lot of detail.
Mike Hillis @200.
Your chart is a very bad choice and your interpretaion of it is exceedingly poor. Indeed, you are giving a very good impression of somebody well out of his depth.
The contention you make @195 is "Upwelling radiation below 6 and above 30, for the purposes of a discussion about the Earth's greenhouse effect and the absorbtion of IR by its atmosphere, is trivial."
The AGW discussion about the Earth's greenhouse effect is greatly concerned with an effect that will hopefully remain well below 1% of global energy flows. I appreciate that you comments here @SkS strongly suggest you have problems with the concerns others have with AGW but this is SkS and the goal of SkS is to explain what peer reviewed science has to say about AGW. Thus I would suggest that if you want to talk of some part of the planet's energy balance being "trivial," you bear in mind where you are and frame your argument accordingly.
The chart you present @200 does not well characterise your contended position. Why the two limits 30 microns & 6 microns? They are even strongly asymetric on the chart you chose to present. I feel you are but struggling to defend your statement @181 "Earth doesn't even emit 4 microns" and @190/91 "As for the gish gallop of whether Earth radiates 4 microns:- it doesn't." This was ever a hiding-to-nothing for you. Even the graphic you present @191 to defend your indefensible position graphs the "upwelling" emissions down to 2.5 microns. You were wrong. Get over it.
You latest chart is a very strange choice. Its origins are as Figure 1 on this webpage. Note that the discussion there for which that Fig 1 is presented is all about solar radiation. It is not about the earth's surface radiation, the "upwelling" stuff withinin your contention and so it is entirely wrong to start waving its Fig 1 as being an authority on that "upwelling" radiation. Mind, that image has spread across the interweb and been used for various purposes, not all of which are well advised. The "upwelling" radiation profile in that graphic is no more than schematic. And obviously so. Note how the peak radation level is at 10 microns. You present this graphic as your authoritative evidence but you grossly misrepresent it. Indeed, I am puzzled as to why you feel the need to source your own graphical representation of the "upwelling" radiation when this comment thread is stacked high with such graphics.
Mike Hillis @200, for what it is worth, 5.77 to 56.58 microns represents a band containing 95% of IR emissions at 288 K, with approximately symetrical quantities of excluded emissions in each tail, so it is probably closer to what you are looking for. The right tail (in your graph at 200) cuts of at a much lower point in the y-axis than does the left tail, but that is due to the truncated shape of the left tail curve requiring a lower instantanious radiative flux at the cut of to represent the same total radiative flux in the tail.
Regardless, for the purely technical point as to whether "the atmosphere is almost 100% transparent or largely transparent to a majority of upwelling wavelengths of IR", we only require a precise characterization as to what counts as an upwelling wavelength, and 6 to 30 microns is precise. It also represents a bandwidth of 24 microns compared to the 5 microns from 8-13 microns, that being the only band of IR radiation with >50% transmittance from surface to space within the 6-30 (or 5.77 to 56.58) micron band. Ergo for either definition, it is not true that "the atmosphere is almost 100% transparent or largely transparent to a majority of upwelling wavelengths of IR".
More substantially, nothing in this discussion has called into question Costa and Shine's estimate that the mean clear sky radiation from the surface to space is 66Wm^-2 and that the global mean all sky radiation from the surface to space is 20Wm^-2 (+/-20%), as discussed by MA Rodger @184. That is, only 28% of clear sky radiation to space directly from the surface, while only 8.5% averaged globally comes directly from the surface. The percentages are significantly smaller as a fraction of total surface emission.
Glenn @202
From your charts there is still plenty of water vapor above Mauna Kea, which doesn't surprise me because of the tropical latitude. The
Tokunaga charts
don't resemble the polar charts much in the water vapor Q-band (15-23 um), but they also don't resemble sea level tropical transmittiance charts. From Mauna Kea the Q band transmittance stays around 50% up to 28 um.
As for Venus, let me put this as simply as possible. Venus has an albedo of .65 which means 35% of the sun's radiation is absorbed. We know that only 10% reaches the surface, which means that 25% is absorbed by the atmosphere on the way in. But the atmosphere is not as hot as the surface, which is the hottest place on Venus, even though it only receives 10%. Why? It's obviously because of the lapse rate heat pump I described above. Heat is absorbed by the atmosphere and pumped downward.
How can you call this scenario a greenhouse effect?
[JH] Please specifiy who you are addressing a question to.
Mike Hillis @208.
You embark on yet another episode of poorly described nonsense. You now tell us that the surface temperature of Venus results "obviously because of the lapse rate heat pump I described above." I assume you refer to the comment thread at some point "above" your comment @171 when you initiated a long and rather silly argument about the relative size of absorption wavelengths in Earth's atmosphere.
To recap, at that point, you had just declared that you were "on the same page now" as Glenn Tamblyn @168, a page which Glenn helpfully put in context @170. So this 'above description' cannot be there.
I appreciate you find such tasks difficult, but you refer to a comment that is a very long way up the comment thread. Thus it is properly beholden on you to indicate you 'above description' with a little more exactitude.
My post was addressed to any reader who argues for a runaway greenhouse effect on Venus, and yes, the lapse rate heat engine I described was affirmed by Glenn Tamblyn @168, though he recanted later.
Now for some more evidence. Venus spectrum and CO2 bands
Venus is much hotter than Earth, and radiates a Planck curve with much shorter wavelengths. It appears to peak around 3 or 4 microns with the bulk between 2 and 10 microns. The 15 micron band is barely on the chart. The CO2 absorption bands within this Planck curve are very thin, so I ask again, how can you (we, or anybody) call this scenario a greenhouse effect, especially since most of the sun's radiation which Venus absorbs is absorbed by it's atmosphere on the way in?
Mike Hillis.
First I need to correct a basic mistake you have made wrt albedo. The figure you have cited of 0.65 is the simple albedo for Venus. The simple average of albedo's across a range of wavelengths. However if we were to use this to calculate how much energy is reflected we would get it wrong because energy isn't constant across all wavelengths obviously, it follows the Planck curve. So if for example albedo was higher at wavelengths that have high energy, near the peak of the Planck curve, this would reflect more energy. So we need to take an average that is weighted by energy density. This is called the Bond Albedo.
For Venus the Bond Albedo is 0.9.
Next, the graph you link to isn't what you think it is.
This is data for the Earth, not Venus!The site you have taken it from is here. As you will note, they don't dispute the role of the GH effect on Venus. However, they credit another site as the source, but do not give all the detail. The original source is here. And this is their discussion of that graph.
"There are two ways that Venus’ atmosphere could be responsible for keeping the surface hot, either individually or in combination. First, Venus’ atmosphere is very dense, and there is a physical relationship known as the ideal gas law that indicates that gases under pressure tend to be hotter. Second, robotic probes have measured Venus’ atmosphere to be about 97% CO2, and we can see from the image above (click for a larger version) that the absorption spectrum for CO2 (AT EARTH TEMPERATURE AND PRESSURE – VENUSIAN TEMPERATURE AND PRESSURE INCREASES THE WIDTH OF THE ABSORPTION BANDS, MAKING CO2 A STRONGER ABSORBER IN VENUS' ATMOSPHERE THAN IN EARTH'S) strongly overlaps the peak emission spectrum of Venus’ surface. The overlap in the spectra suggests that the greenhouse effect of so much CO2 is the cause" (my emphasis)
The graph you show is what CO2 does in Earth's atmosphere, not Venus!
What you are missing in this is referred to in the comment above about temperature and pressure increasing the width of the absorption bands. This factor is profoundly important.
The actual absorption properties of CO2 (and other GH gases) are that they have a large number (10's of 1000's) if distinct spectral absorption lines, spread over what we call bands. In principle each absorption line would be infinitely narrow, they would by exact wavelengths. However quantum mechanics imposes a minimum width restriction, based on Heisenberg's Uncertainty Principle. But this minimum width for each line is still extremely, extremely narrow.
A single molecule, at rest, not colliding with anything else would exhibit such idealised narrow absorption lines.
But two other factors produce what is known as 'line broadening'. This smears each line out, potentially till they overlap and possibly overlap over wider ranges of wavelengths.
Temperature Broadening is due to Doppler shift. Molecules aren't at rest, and their velocity distribution means that a proportion of molecules absorb at somewhat differing wavelengths from the primary wavelength of each line since the molecule is moving realtive to the photon it absorbs.
Pressure Broadening is due to the fact that absorption events for a single molecule may occur while that molecule is colliding or in close proximity to another molecule, again shifting the wavelength that the absorption occurs at.
At sea levle pressures hear on Earth Pressure broadening is already significant, as well as Temperature broadening.
When we move to Venus, with much higher temperatures, and pressures vastly higher than Earth, with also hugely higher CO2 proportions, broadening essentially smears absorption across the entire spectrum.
Mike, I think the mistake you are making is projecting what you know about IR absorption from an Earth context and assuming it is similar on Venus.
[JH] I inadvertently deleted a second response by Glenn Tamblyn. Here is the complete text of it.
Next Mike, I didn't 'recant' about the Lapse Rate Engine. It is central to understanding what is going on.
It sems here you haven't fully understood previous comments. You seem to think that the Lapse Rate is a process to be considered instead of the GH Effect.
As I have said before, the Lapse Rate is a part of the GH effect.
Let me reiterate.
The GH effect arises as a result of 3 mechanisms.
These two process tend to drive the EEA to the required emission temperature. On Earth this tends to drive the 5 km level towards a temperature of -18 C. And for Venus this tends to drive the 50+ km level to a temperature between -80 and -90 C.
So for example, on Earth Radiative Balance and GH Gases drive the 5 km layer towards -18C. The Lapse Rate engine then drives the surface towards + 15 C and the 10km level towards -41C.
On Venus Radiative Balance and GH Gases drive the 50+ km layer towards -80 - -90 C, and the Lapse Rate drives the surface towards 500 C warmer than this.
The Lapse Rate is a part of the GH Effect!
And your comment about incoming solar radiation being absorbed by the atmosphere. So what.
1/3rd of solar energy absorbed on Earth is absorbed in the atmosphere. It doesn't matter whether absorption happens at the surface or in the atmosphere. The air circulation behind the Lapse Rate redistributes energy within the atmosphere, irrespective of whether it was originally absorbed at the surface or in the atmosphere, to produce a temperature gradient, and allow the EEA to tend towards the needed balance temperature.
Mike Hills @210.
You still fail to describe the workings of your proposed Lapse Rate Heat Engine. We can see from Glenn Tamblyn's comments @211/212 were he stands on the matter and that it is incompatable with your comments @208/210. Yet #208/210 does not give "any reader who argues for a runaway greenhouse effect on Venus" the slightest inkling of what you propose. In truth, anyone familiar with your input into this comment thread would still struggle, unable to glean whether you still incorporate any or all of the various fallacies you presented variously down this thread. The Unified Theory of Climate from denialists Nikolov & Zeller whose work you cited @121? A katabatic-type mechanism as you proposed @132, which is strangely a mechanism that does the exact opposite of what you appear to propose? The vertical-means-down fallacy you use at, for instance, @158? Or your fallacy that the surface of Venus would require more direct solar heating than it does so as to be hotter than the insulating atmosphere above it, as described say @208? How many of these fallacies do you still use to support your proposed Lapse Rate Heat Engine?
Simply, nobody else truly knows what it is your trying to say. Can you give it your best shot?
Mike Hillis.
In your posts @143 and @147 you seem to agree with me that adiabatic processes can’t increase the average temperature of an atmosphere, but merely redistribute it.
If the average temperature is determined by absorbed insolation only, one would expect the Venusian atmosphere with its very high albedo to be colder than the Earth’s, right?
So, how do you explain this temperature/pressure profile?
Source: Wikipedia
As you see, about 50% of Venus’ atmosphere (by mass) is hotter than 385oC, nearly 90% is hotter than 222oC and nearly 99.9% is warmer than the average of the terrestrial atmosphere (about -20oC).
If you calculate a "mass-weighted" average temperature based on this table the result is about 350oC. This is obviously much, much hotter than can be explained by any redistribution of heat. Something else must be going on!
The graph below gives a clear indication of what this "something" is.
Only a very tiny fraction (~1 %) of the nearly 16,000 watts/m2 of IR radiation from the surface escapes to space. The lower and middle atmosphere is almost completely opaque to IR, so virtually all the heat loss to space happens from the very thin and cold upper layers that are more or less transparent. This raising of the effective emission altitude to colder, less emitting layers of the atmosphere is the very core of the atmospheric greenhouse effect. The lapse rate engine is not an alternative to this, but a crucial part of it, as Glenn Tamblyn has explained.
An isothermal atmosphere (same temperature at all altitudes) full of greenhouse gases couldn’t raise the surface temperature because the effective emission altitude wouldn’t matter for the heat loss to space. And an atmosphere with normal lapse rate but no greenhouse gases would be transparent to IR and thus let the surface radiate directly to space as if the atmosphere wasn’t there at all.
Mike Hillis
You might also be interested in this chapter by Crisp & Titov about the development of the understanding of thermal balance and radiative trannsfer in the Venusian atmosphere. The book was published in 1997 so more has happened since.
There are a number of extra factors that need to be consered.
Consider Mike. Gases absorb in lines/bands but solids and liquids absorb/emit with continuous spectra. Venus has an atmospheric density nearly 100 times that of Earth. That means it has a density nearly 10% of liquid water. Is the lower Venusian atmosphere a thick gas or a thin liquid? At what density does the transition from discrete band/line absorption to continuous whole-of-spectra absorption occur?
Elsewhere, EE writes:
I am not sure what is meant by "the same greenhouse effect", but it is interesting to explore the difference between the actual Venus, and Venus with an Earthlike and with zero albedo, all with no greenhouse effect.
First, the mean incoming solar radiation for Venus an albedo of 0, 0.306 (ie, Earthlike) and 0.77 (its current value) are 650.4, 451.4 and 149.6 W/m^2 respectively. As it happens, for a body with liquid water, the water vapour feedback imposes a cap on OLR on the assumption that there is such a thing as the greenhouse effect. That cap arises because, as temperatures rise, the water vapour feedback becomes stronger until a point is reached were the increase in the water vapour feedback compensates for any increase in outgoing radiation from the surface, so that while the temperature may rise, the OLR does not. That cap, for Earth is approximately 385 W/m^2 (Nakajima et al, 1992), and would be similar for Venus. Indeed, prior to the formation of Venus very thick atmosphere, it would have been slightly lower.
Crucially, for Venus with 0 or an Earthlike albedo, that cap is less than the globally averaged incoming insolation. That means that for Venus with Earthlike albedo, there is an excess of about 70 W/m^2 between the energy Venus would recieve from the Sun, and the amount it would radiate to space. That extra 70 W/m^2 must go into heating the surface, first by boiling away any liquid water on the surface, and then by raising the temperatures well above anything like the temperatrures we are used to.
That, in essence, is the runaway greenhouse effect. It cannot exist without a greenhouse effect, but a Venus with Earthlike albedo and zero initial greenhouse effect cannot avoid it.
In some respects, even more interesting is the current very high upward surface radiation coupled with the very low OLR found on Venus, or in simpler terms, the fact that Venus with less recieved radiation than Earth, has a surface hot enough to melt lead. Given that Venus is less dense than Earth, and consequently does not have as much radioactive material, that cannot be due to high geothermal heat flux. Consequently it is inexplicable without a greenhouse effect.
These two crucial facts about Venus show that the greenhouse effect is real, and that it is potent. There exist no other viable explanations; and certainly none proposed by AGW "skeptics" (whose explanations tend to start by ignoring the conservation of energy). In science, a theory is only as good as its ability to explain things better than its competitors. In this case the greenhouse effect is an efficient explanation of both the current state of Venus, and how it got into that state. It has no viable competition in that role. This, rather than our relative comfort on Venus with no greenhouse effect (or a much reduced greenhouse effect) and Earthlike albedo is what makes mention of Venus a good argument in favour of the theory of the greenhouse effect.
Granted it will not persuade all AGW "skeptics", but that is because most AGW "skeptics" have decided to make their beliefs on AGW immune to evidence. Nothing is a good argument for those with minds so closed.
John and Others: I apologize - this may already be answered in the 5 pages of posts, but that is rough sledding.
I have read a number of papers on the runaway greenhouse effect (Hastings, 1988 and others) and can see how water vapor plays a role in spinning up the temps – a fascinating process. However, once the water is expensed, is the system left in a state of equilibrium? I asked because I tried to apply a simple one-layer equilibrium energy balance model to Venus. The TOA is fine, but I am not even in the ballpark on the surface temperature. A full radiative transfer model will likely get to a better answer, but I am wonder if you have any idea what assumptions or basic physics is missing from those models that they don’t hold on Venus?
Many thanks,
M
MVW @216:
1) The runaway greenhouse effect is premised on two essential facts. First, increasing water vapour in the atmosphere, as with any GHG, decreases the total amount of Outgoing Longwave Radiation (OLR) for a given Global Mean Surface Temperature (GMST). Second, if OLR is less than the Net Incoming Solar Radiation (NISR), surface temperatures will increase. The way the runaway greenhouse effect works is that, for a given atmospheric pressure, and GMST, as surface temperature increases the amount of evaporated H2O increases at a sufficient rate that the OLR stays constant. Because it stays constant, the gap between OLR and NISR cannot be closed while this situation occurs, and the temperatures must keep on increasing.
Eventually, of course, if this situation arises, the oceans will boil dry. At that point, the gap between OLR and will still exist, but can begin to close. That is, the system is not in a state of equilibrium at that point, but can finally achieve it over the course of time. (Technically it does not achieve equilibrium, but quasi equilibrium, ie, equilibrium approximated over a short time period of at least a year, given that solar insolation is not constant throughout the year.)
2) Energy transfers within the atmosphere are not restricted to just radiation. Therefore a model of atmospheric temperature that relies solely on radiative energy transfers will not accurately estimate surface temperatures. This was first shown by Manabe and Strickler (1964), from whom this figure comes:
As you can see, using a simple, one dimensional model they showed that if radiative transfers within the atmosphere were the sole source of energy transfers, that would result in a much warmer surface temperature (approx 30oC warmer). For Earth, energy transfers by convection and latent heat need to be accounted for in addition to those by radiation. On Venus, because of the absence of water vapour, only energy transfers by convection and radiation need to be accounted for. In a full Global Circulation Model, lateral energy tranfers also need to be accounted for.
The temperature profile of Venus atmosphere has been modeled. As one example, here is a one dimensional model equivalent to that from Manabe and Strickler from Tomasko et al (1980):
For what it is worth, here is a 2017 paper on a full Venus GCM (pay wall for full paper), and a 2017 update on another full Venus GCM.
Thanks Tom. This is helpful. A couple additional thoughts. As you note, the purely radiative model will produce a surface temperature that is 30 degrees warmer than a more complete model. Just applying a simple energy balance model to Venus gives a surface temperature that is cooler. I just now found a paper by Titov and others "Radiation in the Atmosphere" and they noted (as does original article here) that very little of the NISR reaches the surface of Venus. It struct me that Venus is heated from the top rather than the bottom, so it is more like the ocean than the atmospheric situation on Earth. But that is just a thought.
Mike
There is 4.72.10 ^ 20 Kg of CO2 in the atmosphere of Venus, this CO2 is responsible for 430 ° C of the greenhouse effect of the planet = 13870.15 W / m2.
On Earth, there are 150 000 times less CO2 (3.128.10 ^ 15 Kg) than on Venus, which corresponds to an energy of 0.092 W / m2 (for the whole 400 ppm of the atm) that is to say Nothing at all !
[DB] It is well-understood by science that without the GHG effect the surface of the Earth would be some 33 C lower than at present. And research has shown that without the stable backbone provided by CO2, the terrestrial temperature profile of the atmosphere would collapse in short order, dropping the surface temperature of the Earth by about that amount.
What you have made is basically an argument from your personal incredulity, a logical fallacy. Such do not cut it, here. Please familiarize yourself with this venue's Comments Policy and comport future comments to comply with it. Thanks!
The simulations of the greenhouse effect do not take into account the quantities of CO2, but it is essential. The greenhouse effect on Earth is essentially due to the atmospheric water whose variations range from 0.4 to 7% ! In addition nobody follows the evolution of the global humidity of the atmosphere. There is therefore a lack of data.
JC, your post does not seem to make any sense. Simulations of the GH effect take into account not only CO2 but H2O, CH4 and numerous other gasses. Water vapor is well studied and monitored by NASA's Aqua satellite, through the MODIS instrument:
https://earthobservatory.nasa.gov/global-maps/MYDAL2_M_SKY_WV
NOAA's Earth System Research Laboratory has an Ozone and Water Vapor group whose focus is more specifically on stratospheric water vapor:
https://www.esrl.noaa.gov/gmd/ozwv/wvap/
These took me less than a minute each to find. There is a considerable amount of litterature on the climate effects of increasing global water vapor content, too much to link here.
Here, on your link, https://www.esrl.noaa.gov/gmd/ozwv/wvap/, we see the increase in water vapor from 1980 to 2000 then the stagnation of steam from 2000 to presently . There is therefore a correlation with the T ° of the globe much better than the correlation CO2 / T °.
We thus see that the atmospheric variations of the water vapor is the cause of the variations of T °!
As for the amount of CO2 in the Earth's atmosphere (150,000 times less molecules than in the Venus atmosphere), the energy retained is also 150,000 times less since a CO2 molecule acts in the same way on Venus and on earth.
[PS] A lot of misconceptions here. Please see the Water Vapour argument to understand the processes better. You might like to look up the clausius-clapeyron equation too.
I note that JC does not dispute the fact that the statement "nobody follows the evolution of the global humidity of the atmosphere" has no grounding whatsoever in reality. There is so much wrong with the following post #222 that I won't have the patience to address it all. It reflects ignorance more than anything else. Among other things, it seems to suggest that global temperatures have been stagnant since 2000. This is obviously not the case since all 4 warmest years on record have happened since 2014. In fact, 2017 holds the dubious distinction of being the warmest non El Nino year in the instrumental record, beating the massive El Nino year of 1998.
https://www.climate.gov/news-features/understanding-climate/climate-change-global-temperature
There is no statistical analysis or link from JC to substantiate any "correlation." The long term trend on the higher tropospheric/stratospheric water vapor is undoubtedly up, per the NOAA link I provided above.
JC @222,
I concur with both the Response@222 and Philippe Chantreau @223. The data you suggest demonstrates water vapour being "the cause" of changing global temperature shows solely stratospheric water vapour. Thus the SkS page "What is the role of stratospheric water vapor in global warming?" is relevant as it puts in context the climate forcing from changing stratospheric water vapour levels.
The second point you make concerns there being 150,000 more CO2 in the Venusian atmosphere. Such a massive difference in CO2 levels would only result in a similar massive difference in radiative forcing if the relationship between CO2 levels and CO2 forcing were linear. It is not. Increases in atmospheric CO2 levels on Earth yield a linear forcing for each doubling of the CO2 level. While such a logarithmic relationship would not hold for 150,000 times the level of CO2, such a rise does represent seventeen doublings. And Venus isn't the Earth in that a temperature of Venusian levels on Earth would presumably see Earth's oceans evaporate resulting in 270 bar of water vapour in the atmosphere, that being about 150,000 times the level of water vapour in the Venusian atmosphere.
JC,
As MA Rodger pointed out, the relationship between CO2 concentration and climate forcing is logarithmic. Since the base 2 log of 150,000 is 17.2, you must divide the forcing on Vensus (13870 W.m2 according to you) by 17.2, not 150,000. That yields an estimated forcing on Earth of 806 w/m2. It does not take into accoount the vastly different albeido's of Venus and Earth (Earth has a much lower albeido than Venus about 0.3 and 0.75). Adjusting for albeido I get a CO2 forcing on Earth of 322 W/m2 which is a little high but much closer to the actual value than your number. Probably your value for Venus is too high.
There are obviously several gross errors in your calculations since you did not account for the logarithmic relationship to forcing or the albeido. There may be an error in my calculations, but it is better than yours. To eliminate errors we should only use peer reviewed data. Please cite a peer reivewed source to support your wild claim.
It appears to me that you have simply copied the analysis of some denier who does not know how to do the calculations. Can you tell us where you obtained this argument?