Climate Science Glossary

Term Lookup

Enter a term in the search box to find its definition.

Settings

Use the controls in the far right panel to increase or decrease the number of terms automatically displayed (or to completely turn that feature off).

Term Lookup

Settings


All IPCC definitions taken from Climate Change 2007: The Physical Science Basis. Working Group I Contribution to the Fourth Assessment Report of the Intergovernmental Panel on Climate Change, Annex I, Glossary, pp. 941-954. Cambridge University Press.

Home Arguments Software Resources Comments The Consensus Project Translations About Support

Bluesky Facebook LinkedIn Mastodon MeWe

Twitter YouTube RSS Posts RSS Comments Email Subscribe


Climate's changed before
It's the sun
It's not bad
There is no consensus
It's cooling
Models are unreliable
Temp record is unreliable
Animals and plants can adapt
It hasn't warmed since 1998
Antarctica is gaining ice
View All Arguments...


Username
Password
New? Register here
Forgot your password?

Latest Posts

Archives

How reliable are climate models?

What the science says...

Select a level... Basic Intermediate

Models successfully reproduce temperatures since 1900 globally, by land, in the air and the ocean.

Climate Myth...

Models are unreliable

"[Models] are full of fudge factors that are fitted to the existing climate, so the models more or less agree with the observed data. But there is no reason to believe that the same fudge factors would give the right behaviour in a world with different chemistry, for example in a world with increased CO2 in the atmosphere."  (Freeman Dyson)

At a glance

So, what are computer models? Computer modelling is the simulation and study of complex physical systems using mathematics and computer science. Models can be used to explore the effects of changes to any or all of the system components. Such techniques have a wide range of applications. For example, engineering makes a lot of use of computer models, from aircraft design to dam construction and everything in between. Many aspects of our modern lives depend, one way and another, on computer modelling. If you don't trust computer models but like flying, you might want to think about that.

Computer models can be as simple or as complicated as required. It depends on what part of a system you're looking at and its complexity. A simple model might consist of a few equations on a spreadsheet. Complex models, on the other hand, can run to millions of lines of code. Designing them involves intensive collaboration between multiple specialist scientists, mathematicians and top-end coders working as a team.

Modelling of the planet's climate system dates back to the late 1960s. Climate modelling involves incorporating all the equations that describe the interactions between all the components of our climate system. Climate modelling is especially maths-heavy, requiring phenomenal computer power to run vast numbers of equations at the same time.

Climate models are designed to estimate trends rather than events. For example, a fairly simple climate model can readily tell you it will be colder in winter. However, it can’t tell you what the temperature will be on a specific day – that’s weather forecasting. Weather forecast-models rarely extend to even a fortnight ahead. Big difference. Climate trends deal with things such as temperature or sea-level changes, over multiple decades. Trends are important because they eliminate or 'smooth out' single events that may be extreme but uncommon. In other words, trends tell you which way the system's heading.

All climate models must be tested to find out if they work before they are deployed. That can be done by using the past. We know what happened back then either because we made observations or since evidence is preserved in the geological record. If a model can correctly simulate trends from a starting point somewhere in the past through to the present day, it has passed that test. We can therefore expect it to simulate what might happen in the future. And that's exactly what has happened. From early on, climate models predicted future global warming. Multiple lines of hard physical evidence now confirm the prediction was correct.

Finally, all models, weather or climate, have uncertainties associated with them. This doesn't mean scientists don't know anything - far from it. If you work in science, uncertainty is an everyday word and is to be expected. Sources of uncertainty can be identified, isolated and worked upon. As a consequence, a model's performance improves. In this way, science is a self-correcting process over time. This is quite different from climate science denial, whose practitioners speak confidently and with certainty about something they do not work on day in and day out. They don't need to fully understand the topic, since spreading confusion and doubt is their task.

Climate models are not perfect. Nothing is. But they are phenomenally useful.

Please use this form to provide feedback about this new "At a glance" section. Read a more technical version below or dig deeper via the tabs above!


Further details

Climate models are mathematical representations of the interactions between the atmosphere, oceans, land surface, ice – and the sun. This is clearly a very complex task, so models are built to estimate trends rather than events. For example, a climate model can tell you it will be cold in winter, but it can’t tell you what the temperature will be on a specific day – that’s weather forecasting. Climate trends are weather, averaged out over time - usually 30 years. Trends are important because they eliminate - or "smooth out" - single events that may be extreme, but quite rare.

Climate models have to be tested to find out if they work. We can’t wait for 30 years to see if a model is any good or not; models are tested against the past, against what we know happened. If a model can correctly predict trends from a starting point somewhere in the past, we could expect it to predict with reasonable certainty what might happen in the future.

So all models are first tested in a process called Hindcasting. The models used to predict future global warming can accurately map past climate changes. If they get the past right, there is no reason to think their predictions would be wrong. Testing models against the existing instrumental record suggested CO2 must cause global warming, because the models could not simulate what had already happened unless the extra CO2 was added to the model. All other known forcings are adequate in explaining temperature variations prior to the rise in temperature over the last thirty years, while none of them are capable of explaining the rise in the past thirty years.  CO2 does explain that rise, and explains it completely without any need for additional, as yet unknown forcings.

Where models have been running for sufficient time, they have also been shown to make accurate predictions. For example, the eruption of Mt. Pinatubo allowed modellers to test the accuracy of models by feeding in the data about the eruption. The models successfully predicted the climatic response after the eruption. Models also correctly predicted other effects subsequently confirmed by observation, including greater warming in the Arctic and over land, greater warming at night, and stratospheric cooling.

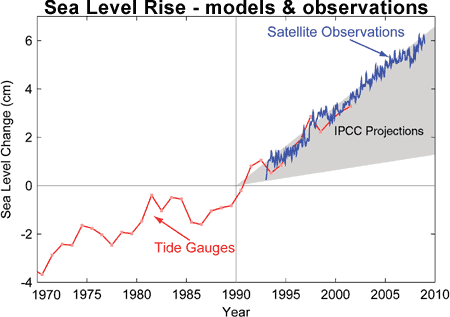
The climate models, far from being melodramatic, may be conservative in the predictions they produce. Sea level rise is a good example (fig. 1).

Fig. 1: Observed sea level rise since 1970 from tide gauge data (red) and satellite measurements (blue) compared to model projections for 1990-2010 from the IPCC Third Assessment Report (grey band).  (Source: The Copenhagen Diagnosis, 2009)

Here, the models have understated the problem. In reality, observed sea level is tracking at the upper range of the model projections. There are other examples of models being too conservative, rather than alarmist as some portray them. All models have limits - uncertainties - for they are modelling complex systems. However, all models improve over time, and with increasing sources of real-world information such as satellites, the output of climate models can be constantly refined to increase their power and usefulness.

Climate models have already predicted many of the phenomena for which we now have empirical evidence. A 2019 study led by Zeke Hausfather (Hausfather et al. 2019) evaluated 17 global surface temperature projections from climate models in studies published between 1970 and 2007.  The authors found "14 out of the 17 model projections indistinguishable from what actually occurred."

Talking of empirical evidence, you may be surprised to know that huge fossil fuels corporation Exxon's own scientists knew all about climate change, all along. A recent study of their own modelling (Supran et al. 2023 - open access) found it to be just as skillful as that developed within academia (fig. 2). We had a blog-post about this important study around the time of its publication. However, the way the corporate world's PR machine subsequently handled this information left a great deal to be desired, to put it mildly. The paper's damning final paragraph is worthy of part-quotation:

"Here, it has enabled us to conclude with precision that, decades ago, ExxonMobil understood as much about climate change as did academic and government scientists. Our analysis shows that, in private and academic circles since the late 1970s and early 1980s, ExxonMobil scientists:

(i) accurately projected and skillfully modelled global warming due to fossil fuel burning;

(ii) correctly dismissed the possibility of a coming ice age;

(iii) accurately predicted when human-caused global warming would first be detected;

(iv) reasonably estimated how much CO2 would lead to dangerous warming.

Yet, whereas academic and government scientists worked to communicate what they knew to the public, ExxonMobil worked to deny it."
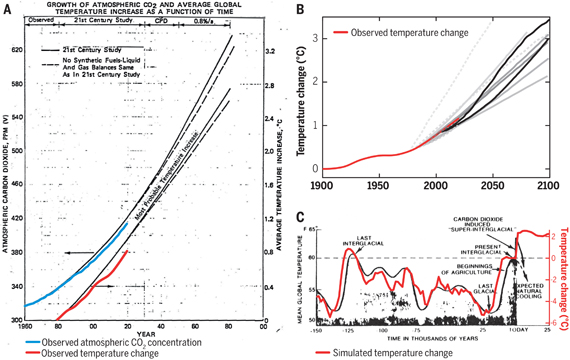

Exxon climate graphics from Supran et al 2023

Fig. 2: Historically observed temperature change (red) and atmospheric carbon dioxide concentration (blue) over time, compared against global warming projections reported by ExxonMobil scientists. (A) “Proprietary” 1982 Exxon-modeled projections. (B) Summary of projections in seven internal company memos and five peer-reviewed publications between 1977 and 2003 (gray lines). (C) A 1977 internally reported graph of the global warming “effect of CO2 on an interglacial scale.” (A) and (B) display averaged historical temperature observations, whereas the historical temperature record in (C) is a smoothed Earth system model simulation of the last 150,000 years. From Supran et al. 2023.

 Updated 30th May 2024 to include Supran et al extract.

Various global temperature projections by mainstream climate scientists and models, and by climate contrarians, compared to observations by NASA GISS. Created by Dana Nuccitelli.

Last updated on 30 May 2024 by John Mason. View Archives

Printable Version  |  Offline PDF Version  |  Link to this page

Argument Feedback

Please use this form to let us know about suggested updates to this rebuttal.

Further reading

Carbon Brief on Models

In January 2018, CarbonBrief published a series about climate models which includes the following articles:

Q&A: How do climate models work?
This indepth article explains in detail how scientists use computers to understand our changing climate.

Timeline: The history of climate modelling
Scroll through 50 key moments in the development of climate models over the last almost 100 years.

In-depth: Scientists discuss how to improve climate models
Carbon Brief asked a range of climate scientists what they think the main priorities are for improving climate models over the coming decade.

Guest post: Why clouds hold the key to better climate models
The never-ending and continuous changing nature of clouds has given rise to beautiful poetry, hours of cloud-spotting fun and decades of challenges to climate modellers as Prof Ellie Highwood explains in this article.

Explainer: What climate models tell us about future rainfall
Much of the public discussion around climate change has focused on how much the Earth will warm over the coming century. But climate change is not limited just to temperature; how precipitation – both rain and snow – changes will also have an impact on the global population.

Update

On 21 January 2012, 'the skeptic argument' was revised to correct for some small formatting errors.

Denial101x videos

Here are related lecture-videos from Denial101x - Making Sense of Climate Science Denial

Additional video from the MOOC

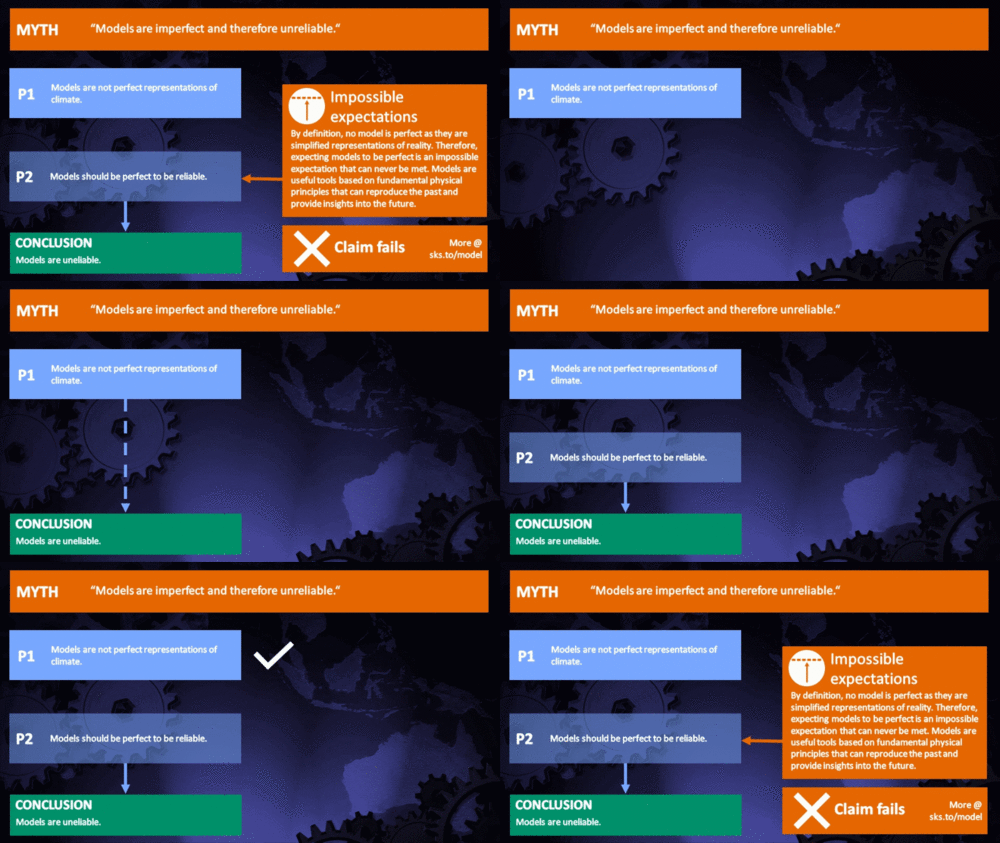
Dana Nuccitelli: Principles that models are built on.

Myth Deconstruction

Related resource: Myth Deconstruction as animated GIF

MD Model

Please check the related blog post for background information about this graphics resource.

Fact brief

Click the thumbnail for the concise fact brief version created in collaboration with Gigafact:

fact brief

Comments

Prev  8  9  10  11  12  13  14  15  16  17  18  19  20  21  22  23  24  25  26  27  Next

Comments 426 to 450 out of 1331:

  1. (- off topic snipped -]
    Response:

    [muon] This isn't about the weather, its about the climate; you apparently do not know the difference. Anyone investing in the market must have a reasonable expectation that his or her investment will increase in value over a long enough term; that's climate. Day-to-day, week-to-week fluctuations: weather.


    [DB] See the previous moderated comment.

  2. Statistics with no physical basis describing a matter of physics is a perfect example of "lies, damned lies, and statistics." This would be why your comments conflating stock market analysis with climatology are being deleted, at least in my non-moderator opinion.
  3. Bibliovermis, the thread is about whether the climate change model is reliable or not. Given that we have to wait until 2100 to prove whether it is or not, we have to examine the beliefs that this model is based upon. One of which is that you can extrapolate past history.
    Response:

    [DB] Let the reader note that Jdey123 found compliance with the Comments Policy too onerous a burden.

  4. Are you extrapolating past history based on curve-fitting or physical basis? Conflating "beliefs" with independently validated scientific research leads me to conclude curve-fitting.
  5. Jdey, The reason we observed climate change is thought to be manmade is because it is consistent with the physics, not due to extrapolation from statistical correlations. The models are not statistical -- they cannot behave differently than dictated by the physics of radiation, heat transfer, mass flow, etc. That physics is based on an enormous amount of experimental, observational and theoretical work that has built up over the years, and must be acknowledged. Given this physics and observed forcings (GHG, aerosols, solar), the only way to explain the recent global warming is via greenhouse gasses. Morever, given good input on forcings, the models do very well at predicting their consequences for climate past and present. It's that simple. It's crazy to compare climate models to the stock market models; they are apples and oranges. The rules governing the stock market are poorly understood and possibly maleable through time depending on human behavior and perceptions. We can use complex statistical time series analysis to analyse these patterns, but we cannot say for sure whether the rules governing the patterns we see now will not change in the future. It's a real and difficult challenge for that field - hats off to them for trying. In physics, by contrast, the factors do not change through time. As long as you capture the key variables, your will do OK. And there are many, many well established constraints that limit the range of possible solutions. In that sense, climate scientists have it easy! That's why Arhenius 100 years ago was able to estimate pretty well the CO2 climate sensitivity, and why models haven't really deviated far from that number much in the intervening century. Also, it isn't so hard to understand the inability to predict changes due to greenhouse changes for periods less than 15 years. The signal from GHGs accumulating increases over time while variation from natural sources does not. So naturally the effect of GHG will be more obvious over longer time scales, when it is larger relative to background natural variation.
  6. Stephen Baines, the article to which these comments are attached says that the model is based on hindcasting. I thought GHGs were already large enough to be a significantly stronger forcing agent than natural sources. It's only deniers who claim otherwise.
  7. mace@431, GHG may be the dominant forcing, but that doesn't mean that their effect on climate dominates unforced variability on short timescales (e.g. 15 years). GCMs are just approaching the point where decadal predictions are beginning to be interesting. There was a good article at RealClimate on this recently.
  8. 431, mace, Not based on, but tested with. The models are physics based, but may be run over past periods so that the outcomes of the model can be compared to what we know already happened. And GHG's are a significantly stronger forcing agent on climate scales, but not simple monthly to inter-annual variability. The swings from one year to the next or over several years are still large. Consider the monthly and annual changes in temperatures here, versus the trend, using the BEST data:
  9. Let's be clear about what happens in the modelling process. There is the famous George Box statement. "Essentially, all models are wrong, but some are useful". When you hindcast, you find models capture some observations but all. So what do you do to improve the model? In a physics model, you add more physics. Beyond bugs in the code, a failure in the model is physics not working. A lot of that has to with simplifications necessary for hardware of the time, so it's choose the important stuff. In 1975, "Broecker, W.S. 1975. "Are We on the Brink of a Pronounced Global Warming?" used Manabe's model to make a very good fist of predicting the 2010 temperature. However, the Manabe model was so primitive, that it had little to say of use about a great many other parameters. Improving computer power allows better spatial and temporal resolutions; more direct physics calculations rather than parameterisations etc. You will have no trouble finding things that the models still dont capture well - ask the modellers - but more and more of the important stuff go in. What doesnt happen in the process is tweaking numbers to fit a line. There are parametrizations made from empirical data - eg evaporation as function of temperature,humidity and wind speed - but the fitting is done in terms of data on evaporation, temperature and windspeed, not fiddling the function to make achieve say a particular global temperature curve.
  10. Further on volcano predictions - in fact climate modeller did make very accurate predictions about the effects of the Pinatuba eruption as it happened. See Potential climate impact of Mount Pinatubo eruption Hansen et al 1992.
  11. scaddenp, Hansen et al 1992 predicted a 0.5C drop and the observed drop was 0.3 (see http://paos.colorado.edu/~dcn/ATOC6020/papers/Soden_etal_727.pdf) The difference is usually attributed to El Nino in 1992 (see fig 2a in Soden). I am not so sure since that figure shows the model preceding the observed-ENSO drop by about 6 months and that is not explained.
  12. Hansen has said in this paper that water vapour is the dominant greenhouse gas, rather than CO2 or methane. Can we conclude, that if the ice melts in Greenland, rather than the sea level increasing as many may expect, the global warming will cause seawater to evaporate and hang in the atmosphere. Not sure if more cloudy conditions would cause the earth to cool due to sunlight being unable to penetrate or to warm, as it acts like a blanket keeping the land warm. Any thoughts on this?
  13. mace wrote: "Can we conclude, that if the ice melts in Greenland, rather than the sea level increasing as many may expect, the global warming will cause seawater to evaporate and hang in the atmosphere." No. A warmer Earth does mean more water vapor, but the increased atmospheric water vapor content is much smaller than the increase in liquid water due to ice melt. The planet would have to get very hot (c.f. Venus) in order for that to stop being true. As to cloud feedbacks... there has been alot of research on the positive and negative feedback effects of clouds which you elude to. The exact net value is still uncertain, but it has been narrowed down to 'small'. That is, whatever the exact value it isn't going to have a major impact on the climate compared to the more prominent factors; CO2 forcing, water vapor feedback, and ice albedo feedback.
  14. Eric - I am not sure where you see 0.3 on Soden. It says ~0.5K (text above Fig1) and that seems to match Fig 2a as well. The GCM predictions are helpfully on the same graphs and seem to match my assessment of "very accurate".
  15. scaddenp, you are right, I was confused. Fig 2a shows both the raw observation which is -0.5 peak cooling and the ENSO-adjusted which is -0.7 UAH shows a bit over -0.4: http://www.drroyspencer.com/wp-content/uploads/UAH_LT_1979_thru_November_2011.png
  16. "Noone has created a general circulation model that can explain climate's behaviour over the past century without CO2 warming." This isn't true regardless of the veracity of Qing-Bin Lu's claim that CFCs actually more closely model Global Warming trends than CO2: It is a model that shows the trend without using CO2 as the driver. CFCs are also much more of a GHG than CO2. Lending them actually higher credibility as the driver of Global Warming. From a scientific perspective you need much less of them to cause a problem.
  17. The Graph of Sea Levels according to Jason 2 is out of date. This is the Nasa site. Oddly the Jason-2 site shows the change and drop starting in 2010 but I can't find a link to that at the moment. http://climate.nasa.gov/keyIndicators/
  18. JamesWilson - "CFCs are also much more of a GHG than CO2. Lending them actually higher credibility" Higher credibility with whom? Random bloggers on the internet? CO2 is a powerful greenhouse gas. Note the relationship between CO2 and global temperature from the ice cores: Because of fossil-fuel burning (mainly) atmospheric CO2 is now at its highest concentration in at least 15-20 million years. See Tripati (2009). The satellites also observe CO2 trapping more heat. See SkS post: How do we know more CO2 is causing warming? And finally, CFC's are discussed in this SkS post: It's CFCs The heat-trapping ability of CO2 does not simply disappear because man-made chemicals can also trap a small amount of heat. And if you wish to comment further on CFC's, do so on that thread. Thanks.
  19. James Wilson#441: CFC's are indeed greenhouse gases, but measured in parts per trillion, they don't do much. As the figure shows, CO2 and CH4 are the big kahunas of GHGs.
  20. JamesWilson -"Oddly the Jason-2 site shows the change and drop starting in 2010 but...... See SkS post: Sea level fell in 2010 And the latest update from AVISO
  21. I have now looked briefly at Kramm and Delugi. One thing I noted is that large sections of the introductory material is more diatribe than discussion. More troubling to me, however, where sections like the following:
    "The notion “global climate”, however, is a contradiction in terms. According to Monin and Shishkov, Schönwiese and Gerlich, the term “climate” is based on the Greek word “klima” which means inclination. It was coined by the Greek astronomer Hipparchus of Nicaea (190-120 BC) who divided the then known inhabited world into five latitudinal zones—two polar, two temperate and one tropical—according to the inclination of the incident sunbeams, in other words, the Sun’s elevation above the horizon. Alexander von Humboldt in his five-volume “Kosmos” (1845-1862) added to this “inclination” the effects of the underlying surface of ocean and land on the atmosphere."
    Of course, it is obvious that in modern usage that climate does not mean "inclination" as in the angle of the sun. In fact, it currently means, as defined by the IPCC and WMO:
    "Climate Climate in a narrow sense is usually defined as the average weather, or more rigorously, as the statistical description in terms of the mean and variability of relevant quantities over a period of time ranging from months to thousands or millions of years. The classical period for averaging these variables is 30 years, as defined by the World Meteorological Organization. The relevant quantities are most often surface variables such as temperature, precipitation and wind. Climate in a wider sense is the state, including a statistical description, of the climate system. In various chapters in this report different averaging periods, such as a period of 20 years, are also used."
    Now, patently it is possible to determine the mean and variability of temperature, precipitation, wind speed, frequency and types of extreme events for the Earth's surface just as it is possible to do so for some subpart of the Earth's surface, say Texas. It follows that the only way “global climate” can be "a contradiction in terms" is if, for example, the "the climate of Texas" is a contradiction in terms, or indeed, if "the climate of Houston" is a contradiction in terms. As it happens, the Ancient Greek word "οἰκονομία" from which we derive the term "economics" means "household management". Kramm and Dlugi's argument that global climate is a contradiction in terms is as coherent as an argument that there is no such thing as the world economy because the world is not a household, and economics means household management. Such nonsense verbal arguments are a clear sign of pseudoscience, and their prominent presence and Kramm and Delugi shows that it is ideology, not science that drives their work. However, that is not the reason I am discussing their work on this thread (which would be off topic). Rather it is because of their critique of the WMO definition of the greenhouse effect. In that critique they correctly develop a zero dimensional model of the global energy balance. They then proceed to criticize it because: 1) Surface storage of energy is not considered in the zero dimensional model; 2) The zero dimensional model assumes the entire Earth's surface has the same temperature; 3) The albedo used in the equation includes contributions to the Earth's total albedo from the atmosphere, and not just those from the surface only (I kid you not); 4) Comparing Te, the predicted temperature required to maintain equilibrium temperature with Tns is inappropriate because Te is the theoretically predicted temperature and Tns is the actually observed temperature. (Again, I kid you not!) 5) The observed mean surface temperature of the Moon is 31 degrees Kelvin lower than that predicted for the moon using the Zero dimensional model. I note that all five objections are true. Some are bizarre stated as objections, or course. For instance, it is always true in any prediction that the prediction is not the measurement. To conclude from that, as Kramm and Dlugi do in their fourth objection is breath taking, to say the least. It shows a gall not found even in creationists. One objection, the fifth, does need a small comment. It is well known that surfaces with variable temperatures will radiate away more energy than similar surfaces with even temperatures given that they have the same mean temperature. This is so well known that planetary scientists never use the zero dimensional model used by Kramm and Dlugi for planetary bodies known to have very large heat differences at their surface (such as the moon). Further, because of this it is also known that the estimate of the greenhouse effect obtained by zero-dimensional models are an underestimate of the full strength of the greenhouse effect, although still a good first approximation. And that is the point, really. Zero dimensional models are only intended to provide a first approximation. They make counter factual but convenient assumptions for simplicity knowing that they are not determining the exact effect. In this regard they are like other physics models that ignore friction, or wind resistance, or (as famously done by Newton) the extended nature of planetary bodies. Of course, climate scientists do not rest on first approximations and zero dimensional models. Instead they develop more complex models which eliminate the simplifying assumptions used in zero dimensional models. Coupled Ocean-Atmosphere Global Circulation models (AOGCM) include, for example, (1) heat storage and transport by atmosphere and ocean; (2) variable surface temperatures; and (3)surface only albedo at the surface, with atmospheric contributions to albedo included in the modeled atmosphere. In other words, not one of Kramm and Dlugi's objections (that can be taken at all seriously) is an objection to AOGCMs. That being the case, Kramm and Delugi's argument logically devolves to this: The predictions of AOGCMs are necessarily wrong because zero dimensional models are only first approximations. Nothing more need be said to refute them, and having stated their argument, nothing could ever make me take them seriously again.
  22. @Tom Curtis #446: You have just written a blog post. Go for it!
  23. John Hartz, no I haven't. I have discussed in slight detail two arguments out of many in a large, and confused paper. I may consider a blog post on the issue after following through SoD's series.
  24. Tom @ 445 Thank you. Beautifully clear. I was quite disturbed by the use of language in the abstract - it was not particularly objective and used emotive terms. Please do expand this to a full blog post.
  25. Curiously, the publisher of the Kramm and Delugi article, Scientific Research Publishing, is an open access (translation, pay to be published) set of journals with a curious reputation for (re)publishing old articles, listing academics on the editorial boards much to the surprise of said academics, who in some cases had agreed to be associated with different journals, and in others had not agreed to any relationship. The publisher appears to be based in China, but details of the publisher, staff, etc., are very hard to come by. While not E&E (with an editorial policy of posting papers just because they disagree with the consensus), I would consider SRP a not terribly reliable source...

Prev  8  9  10  11  12  13  14  15  16  17  18  19  20  21  22  23  24  25  26  27  Next

Post a Comment

Political, off-topic or ad hominem comments will be deleted. Comments Policy...

You need to be logged in to post a comment. Login via the left margin or if you're new, register here.

Link to this page


The Consensus Project Website

THE ESCALATOR

(free to republish)


© Copyright 2024 John Cook
Home | Translations | About Us | Privacy | Contact Us