


 Arguments


What caused early 20th Century warming?
What the science says...
| Select a level... |
 Basic
Basic
|
 Intermediate
|
 Advanced
| ||||
|
Early 20th century warming is due to several causes, including rising CO2. |
|||||||
Climate Myth...
It warmed before 1940 when CO2 was low
"Of the rise in temperature during the 20th century, the bulk occurred from 1900 to 1940. It was followed by the aforementioned cooling trend from 1940 to around 1975. Yet the concentration of greenhouse gases was measurably higher in that later period than in the former. That drop in temperature came after what was described in the National Geographic as 'six decades of abnormal warmth'." (James Schlesinger)
At a glance
The Twentieth Century climate was a veritable Smorgasbord of natural and manmade factors. They vied with or against one another, driving temperatures in various directions at different times. Conditions were on the cool side up until the 1920s. That was followed by a sustained warming through to the late 1940s. From then until the late 1970s, periods of warmer and cooler conditions alternated. Thereafter, we saw the erratic but one-way climb of temperatures that has persisted through to the present day.
This was also the period during which CO2 emissions from use of fossil fuels really took off, from 1.5 billion tonnes a year in 1900, through 6 billion tonnes in 1950, 25 billion by 2000 and 44 billion now. How well do those figures correlate with what was going on in Earth's climate system at the time?
Planetary climate is affected by a number of factors. Examples include solar variability, the amount of volcanic activity, fluctuating ocean currents, cyclic variations in Earth's orbit, the strength of the Greenhouse Effect and the amount of sunlight reflected by Earth's surface. Some are forcings - factors that dictate and change the total energy within the climate system. Others are feedbacks - they respond in various ways to those changes.
Both forcings and feedbacks operate on a variable timescales - from years to millennia. That variability means they may sometimes reinforce one another and at other times cancel each other out. To assess why the climate behaved in a certain way at a certain time, all must be examined.
In the case of the 1920-1940 period, the increase in global temperature is thought to have been largely caused by three of the above factors. The amount of solar energy reaching the top of Earth's atmosphere rose steadily from 1920-1940. Although the amount of change was small, it was certainly not negligible. Volcanic activity produces atmospheric aerosols that can have a cooling effect by partly blocking out the sun. Lower than normal volcanic activity, as was the case in the 1920-1940 period, would result in less of those airborne coolants. Our early, albeit relatively low greenhouse gas emissions also contributed to the warming. Regional factors played a role in increasing temperatures in some parts of the world, too. Most notably, changes in ocean currents led to warmer-than-normal sea temperatures in the North Atlantic.
Anyone who has been around for long enough to recall the chemical smogs of the 1950s and early 1960s will know that pollution can be deadly. In one smog, in London in December 1952, between 4,000 and 12,000 people died, victims of severe respiratory disease. Governments responded. Over the next two decades numerous Clean Air Acts were passed. Pollution levels fell accordingly. But such pollutants, just like volcanic gases, are aerosols that have that same cooling effect. Clearing them away removed that effect and tore off the mask behind which CO2 emissions had been hiding - and off we went on our warming journey.
Please use this form to provide feedback about this new "At a glance" section. Read a more technical version below or dig deeper via the tabs above!
Further details
It is a widespread misconception that anthropogenic global warming has been the dominant factor driving climate during all periods of the twentieth century. It is clear that anthropogenic carbon emissions are the reason we are warmer today than we were in the mid-1800s. But here we are considering the whole 20th century. As has obviously been done with respect to the more recent, post 1970s warming, to examine the evolution of climate through the whole 20th Century it is necessary to investigate all potential causes of climate forcing and establish how they have interacted. In addition to greenhouse gas emissions, other key variables to consider include:
- solar variability
- volcanic activity
- aerosol concentrations - both natural and anthropogenic
- changes in albedo
- fluctuations in oceanic currents
- orbital factors (Milankovitch cycles)
These factors operate on various timescales and interact variably with one another, but despite such complexities, climate science has drilled down into the pre-1940s period and has identified the key reasons for the warming at the time.
In the early 20th century, while CO2 levels were much smaller, they were rising despite emissions being a fraction of what they are today. Solar activity was on the rise throughout this period, amounting to a change in incoming radiation of approximately a watt per square metre.
Also, after a burst of volcanic activity in the late 19th century (think Krakatoa etc), there was a relatively quiet volcanic period in the early 20th century. These were two dominant factors in the warming from 1900 to 1940 (fig. 1).
However, those factors have played little to no part in the warming since 1975. Solar activity has declined since that time whereas temperatures have continued climbing. Volcanoes have been relatively frequent in the last few decades and if anything, have exerted a cooling effect that has somewhat masked the CO2 warming effect. The 1991 eruption of Mt Pinatubo is an example.
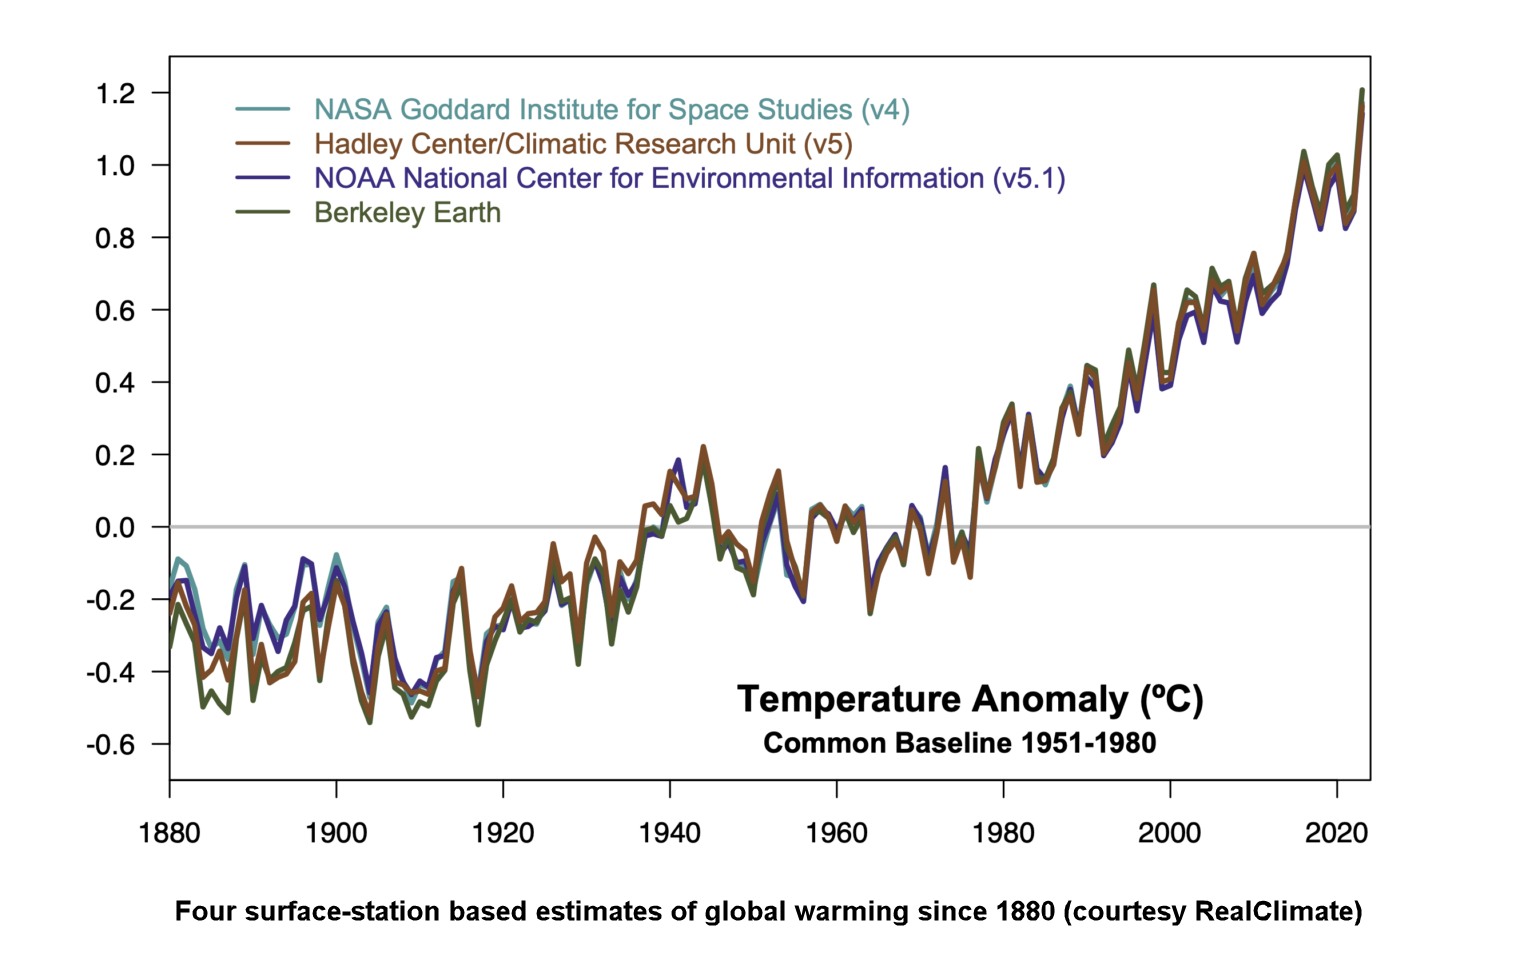
Figure 1: Multiple independent global surface temperature products show a very coherent pattern of temperature change over the 1880-2023 period. While there is overlap in the weather station inputs and ocean data, the methods for correcting for missing data, inhomogeneities, spatial sampling etc. are independent. Graphic: Realclimate.
Papers studying climate change over the early 20th century
In, "Estimation of natural and anthropogenic contributions to twentieth century temperature change" (Tett et al. 2002), the authors commented: "During 1907–57 we found that there was negligible net anthropogenic warming with the effect of greenhouse gases largely being balanced by other anthropogenic forcings. Therefore, in this period, the warming was largely naturally caused. The late century warming was largely explained by greenhouse gases offset by the effect of volcanic aerosol and the indirect effect of anthropogenic aerosols. Over the entire century natural forcings make no net contribution as they warm early in the century and cool from the 1960s on."
In the paper, "Solar Forcing of Global Climate Change Since The Mid-17th Century" (Reid 1997), the author found a link between solar variability and early 20th Century climate change, concluding that "solar forcing and anthropogenic greenhouse-gas forcing made roughly equal contributions to the rise in global temperature that took place between 1900 and 1955".
More recently, in an important review paper (Hegerl et al. 2019), the causes of observed climate variations were discussed in the period from 1750 to the present day. Interestingly, a synthesis of results from attribution studies showed how greenhouse gases began to cause a warming trend that was attributable to greenhouse gases by 1900 in proxy-based temperature reconstructions.
Hegerl et al. found that the influence of greenhouse gases unsurprisingly increased over time, dominating recent trends. However, other forcings caused substantial deviations from this emerging greenhouse warming trend. Intense periods of volcanicity caused strong cooling in the early 19th century. Warming occurred during periods of low volcanic activity, such as in the early-to-mid 20th century. Anthropogenic aerosol forcing most likely masked some anthropogenic global warming over the 20th century. That was particularly the case in the period since the accelerated increase in sulphate aerosol emissions starting around 1950, thereby explaining the overall cooler conditions in the post-1940s period. This paper is open-access.
Of course, that sulphate aerosol pollution was a bit different to CO2 - you could see it and taste it. The London Smogs are just one example. Such appalling air quality led to measures in various countries to limit such pollutants, such as the UK government passing the Clean Air Acts of 1956 and 1968. With this negative forcing mechanism strongly reduced, the modern anthropogenic warming signal emerged a few years later.
Last updated on 16 June 2024 by John Mason. View Archives


Klapper - I would suggest as a starting point following the link I previously provided for tables of forcings, and from there to the tropospheric and stratospheric aerosol measures. Those include listing multiple supporting references that you can read for questions you might have regarding those measures and uncertainties.
Again - if you are leaving out major forcings such as aerosols, you are basically guaranteed to have incorrect results.
Klapper @25: "They are the most recent I could find so I'll assume they are the best."
Why would you assume that? If they do not reflect the range of reasonable values that are supportable in the literature (remember, we have no direct satellite-based measurements of TSI from the 1910-1940 period to check the reconstructions against), then you are assuming that TSI for the period is known with greater accuracy than it is. "The best" in science isn't necessarily decided by "the most recent".
You just may be on your way to assuming your conclusions again.
Have you read and understood my example in #18? Do you agree with it, or do you find fault in the reasoning? IMO, you keep sending yourself off on the Bad Idea path...
Klapper: if you haven't already seen it, I suggest you read the comment here, posted on another thread. Look for the quote half way down, from Gavin Schmidt (RealClimate) on the 1910-1940 period.
@KR #26:
I checked the graph (a) from Hansen et al 2007 at the GISS website link you provided. In the period 1910 to 1945 the reflective aerosol and indirect aerosol effects combined look to almost cancel out the forcing from GHG's. There are postive forcings from BC and TSI in this period but these forcings estimates appear to be small compared to GHG's and aerosols.
To me this confirms what I've been saying all along: there is some forcing at play in the 1910 to 1945 period which the models have not captured. Since these forcings come from the GISS E model, I also checked the warming rate from a GISS Model E2-R model run of the 20th century from the CMIP5 database. The warming rate in the 1910 to 1945 period from that model is 0.043C/decade. Compare that to the actual observations of 0.14C/decade.
By including aerosols, the model/observations divergence just becomes that much worse. The error on the GISS model trend would have to be +/- .06C/decade to close the gap with the observations.
@Bob Loblaw #28
If Gavin thinks there's reason to believe the lapse rate, or ocean heat mixing were different in the period 1910 to 1945, then he should do a model run to see if that explains the model/observation discrepancy. As it is, I checked a GISS Model E2-R model run of the 20th century and it predicts a warming rate of less than 1/3 the warming rate of the observations in this period. There is no excuse the trend isn't long enough either. There is also no excuse that volcanoes muddled the picture.
If the error boundaries overlap, absolving everyone from having to think about this discrepancy, they probably only barely overlap. I don't think I'm going to convince you this period is worthy of more detailed investigation, and may pose a problem for model assumptions, and I don't think I'll try. I've done enough back of the envelope calculations on TSI (and also aerosols, using some guesstimates for forcing from Hansen et al 2007, chart (a)), to believe the model/observations gap is larger than the posting above would have you conclude. Please no comments on "back of the envelope" after all that's all the above calculations are too.
Klapper:
All the model runs in the world will not improve the accuracy of the observations. Gavin's quote clearly talks about the lack of suitable observations in the period in question. You cannot "improve" a model to the point where it is more accurate than the observations you are testing it with. Trying to fit the model to errors in the data will just introduce errors into the model. It is becoming increasingly obvious that you cannot see past this barrier to your learning.
Now you're just creating strawmen. I never said the period wasn't worthy of investigation. There is a limit to what can be done, however, due to the limitations of the observations that are available to test the model. Unless the observations (or proxy reconstructions) can be improved, doing more model runs won't change that. It is far more productive to continue to work on comparing the models to more recent periods where observations are more complete.
Given the lack of any response to my question regarding my example at #18, I will conclude that you either haven't bothered reading it, don't understand it, or are just unwilling to deal with its implications. Until you provide an answer to my question (in #27), instead of avoiding it, there seems little point in watching you chase your tail.
@Bob Loblaw # 31:
Bob, your posts are too long. Don't waste your time bloviating about sociology/politics, just stick to what's wrong with my numbers. I have read your #18 post but I'm not going to respond to non-qualitative commentary (more or less, I might change my mind but for now let's just stick to numbers/quantitative type commentary).For example, if my delta TSI number of 0.09W/m2/decade is wrong, then show me a recent peer-reviewed number that is higher, and give me the reason it is better.
Klapper:
I have already told you why a reconstruction using nothing but sunspot numbers is poor/limited, and KR has pointed you to literature disucssing sunspot number in more detail.
That you dismiss a mathematical discussion - of how limited accuracy in observations means limited ability to improve models - as "bloviating about sociology/politics" tells me pretty much all I need to know about your scientific skills.
It is up to you to demonstrate why your back of the envelope calculation is better than what is in the literature. I won't hold my breath waiting.
Whenever I show this plot in a talk, someone invariably asks about the cause of the maximum around 1945. The only info I can find, including your posting above, talks about the general increase from about 1910 to 1945, followed by aerosol cooling until around 1975.
This 1935-1950 feature certainly looks real so the only thing I can say to the questioner is that I am not aware of a specific answer from climatologists, but I suppose that the pronounced bump is an accident of natural variability. The questioner usually appears as unsatisfied as I feel. Do any of you have a better answer?
[DB] Resized image breaking page formatting.
tcflood
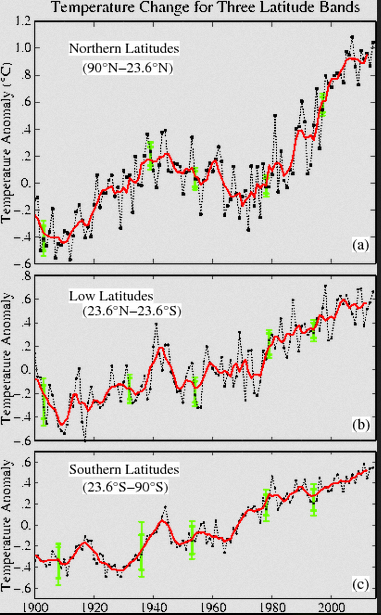
These graphs, also from GISS, show different regions - Norther exa-tropics, tropics and southern exa-tropics. Quite different pictures.
Also this paper might be interesting, particularly figure 11.
tcflood: The narrow WWII peak itself is almost certainly spurious. It only shows up in the SST data, and particularly in ERSSTv4. There are very substantial known changes in SST measurement practices during WWII, which are hard to correct for completely. Hansen discusses it here.
Kevin C @36, this is the relevant image from the article to which you link:
The right hand series of panels is ERSST v4-v3b. In it land temperatures are cancelled out and consequently not shown. The middle column of panels (ERSSTv4) however, does show land temperatures. In particular, it shows a very warm Chile plus Argentina, more or less adjacent to the unusually warm south east Pacific temperatures. Further, checking the 250 km resolution, meteorological station only map for the 44-45 period at Gistemp shows an off shore (island) meteological station of the coast of Namibia or Angola which again shows unusual warmth. Finally, the west coast of Australia is warm, although not exceptionally so in the 250 km resolution GISTemp map. These correlations to the warm pools in the SH in that period suggest those warm pools are not, or at least not entirely artifacts.
@35 - 37 in response to 34
Thanks for the references and comments. Now I can give a more informed answer to the question.
Please note: the basic version of this rebuttal was updated on June 16, 2024 and now includes an "at a glance“ section at the top. To learn more about these updates and how you can help with evaluating their effectiveness, please check out the accompanying blog post @ https://sks.to/at-a-glance