


 Arguments


Human activity is driving retreat of Arctic sea ice
What the science says...
| Select a level... |
 Basic
Basic
|
 Intermediate
| |||
|
Thick arctic sea ice is undergoing a rapid retreat. |
|||||
Climate Myth...
Arctic icemelt is a natural cycle
"In 2007, the Northern Hemisphere reached a record low in ice coverage and the Northwest Passage was opened. At that point, we were told melting was occurring faster than expected. What you were not told was that the data that triggered this record is only available back to the late 1970s. We know the Northwest Passage had been open before." (Matt Rogers)
At a glance
The Northwest Passage is the sea route around the waters off northern Canada and Alaska. Its discovery and eventual navigation involves a fascinating tale of endeavour, adventure and tragedy, too, for some expeditions ended in disaster.
Of the many mishaps, by far the worst was that which befell Sir John Franklin and the 128-strong crews of his two ships: they were last heard of in 1845. It took many expeditions and almost ten years before their fate was finally pieced together. One thing became clear by then: the Northwest Passage does not take prisoners. Yet at the same time, those searches for Franklin and his crew generated lots of new chart cover of the waters between the islands making up the Canadian Archipelago.
Complete navigation of the Northwest Passage was finally accomplished by Norwegian explorer Roald Amundsen between 1903 and 1906. Amundsen's boat was relatively small at 47 tons and 70 feet long but usefully it had a very shallow draft. That meant it was able to pass through areas where a bigger boat would have fouled the bottom, thus offering a wider choice of courses to take. Amundsen's route was criticised in some circles because of that factor - what was the point of making the crossing if bigger freight ships could not? But Amundsen was motivated not by money but by science.
With his experienced crew of six, they spent two winters off the eastern side of King William Island, about halfway through the archipelago, collecting data on Earth's magnetic pole and local meteorology, traded with the Inuit and developed hunting and fishing skills. Leaving there in August 1905, they reached Nome, Alaska twelve months later. The ice had pinned them in for a third winter. There was not to be a single-season crossing for another 38 years, when Sergeant Henry Larsen of the Royal Canadian Mounted Police managed it in a schooner.
So yes, while the Northwest Passage was successfully navigated before 2007, the current state of the sea ice means that the picture is now quite different. Part of the reason for that is down to the age of much of the Arctic sea ice today. Sea ice that has yet to experience a summer melting season is known as first-year ice. It's relatively thin, fragile and more vulnerable to melting compared to the ice that has withstood one or more melting-seasons, known as multiyear ice. Multiyear ice can even give a good ice-breaker a run for its money. But now there's a lot less of it.
During many recent summers the Northwest Passage has become open: freight ships and even cruise liners have steamed through. That doesn't mean it's risk-free of course - there are still icebergs to watch out for. Nevertheless, it's getting to the point where there are various concerns being voiced about the number of ships passing through the area, on both ecological and political grounds. For the Northwest Passage, global warming really is a mixed blessing.
Please use this form to provide feedback about this new "At a glance" section. Read a more technical version below or dig deeper via the tabs above!
Further details
Arctic sea ice has aptly been termed a "canary in the global warming coal mine". In other words, it is regarded as a sensitive indicator of manmade climate change. Because of that importance, climate science deniers will often attempt to fob off the decline of Arctic sea ice as a natural phenomenon.
Satellite measurements of Arctic sea ice extent (fig.1) reveal a rapid decline over the past 45 years, particularly at the end of each year's annual melt season. The downward trend and the increasing difference between seasons are both in keeping with predictions of the effects of global warming.
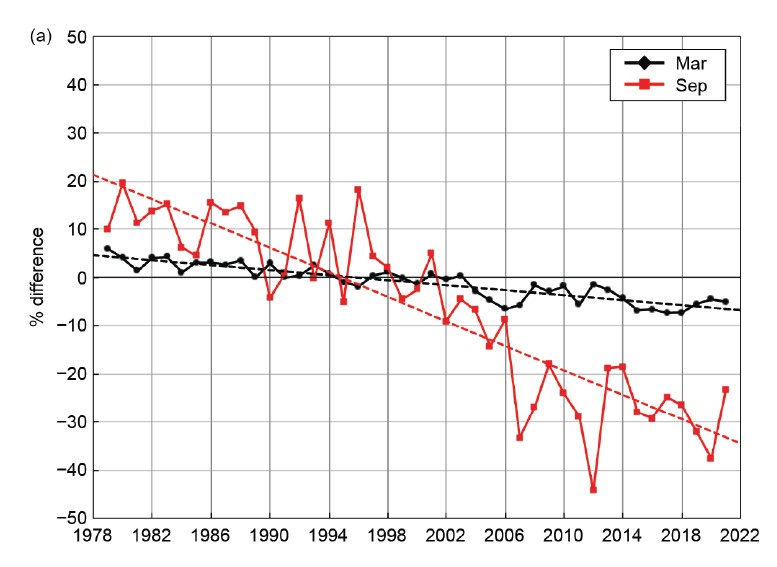
Fig. 1: Monthly sea ice extent anomalies (solid lines) and linear trend lines (dashed lines) for March (black) and September (red) from 1979 to 2021. The anomalies are relative to the 1981–2010 average for each month. Image: American Meteorological Society State of the Climate 2021 (index here).
As the Arctic warms, the volume of ice in the region gradually declines. In particular, the thicker multiyear ice that used to be present in abundance has declined significantly (fig 2). Instead, today's ice-pack is dominated by first-year ice that is far more prone to seasonal melt. Combined with natural factors such as storms, this vulnerability can sometimes produce huge melt years such as 2012's record-buster.
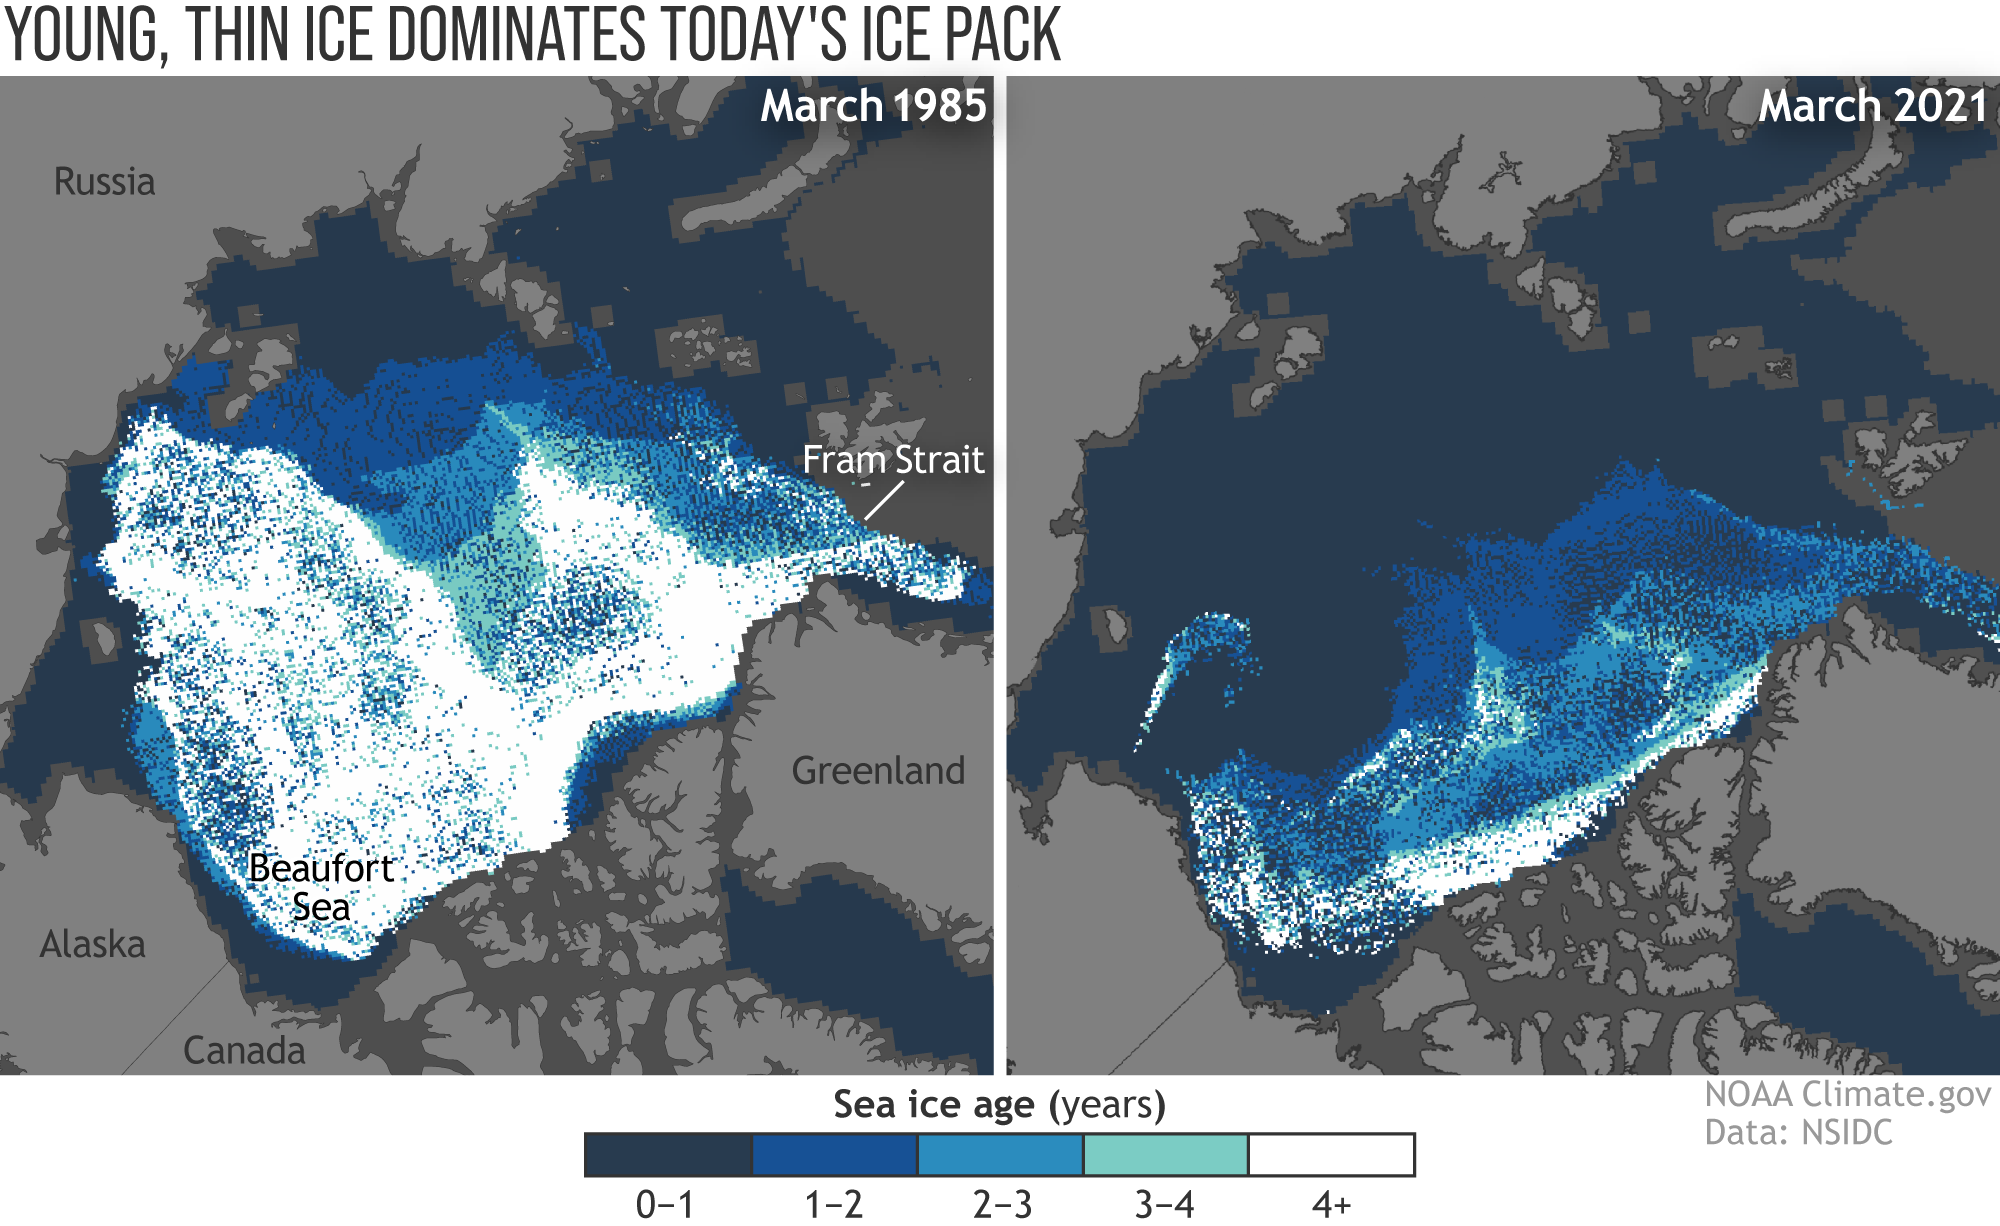
Fig. 2: The age of the ice pack—which has been observed since the 1980s is used as a proxy for ice thickness. In mid-March 1985 (left), the winter maximum ice pack was dominated by ice at least 4 years old (white). In 2021 (right), only a small strip of very old ice remained tucked up against the islands of the Canadian Arctic. More than half of the winter ice pack was less than a year old (dark blue). NOAA Climate.gov image, based on data from the National Snow and Ice Data Center. Original can be found here.
So, how can one expect climate science deniers to claim all of this melting is simply natural? A popular misinformation-technique is to state that we are just seeing the effects of multidecadal natural cycles causing deep swings in Arctic sea ice coverage and volume. Direct observational support for such 'cycles' is of course impossible. Convenient, eh? Since 1979, we have relied upon direct observations of sea ice extent with contemporary instruments aboard satellites. That's not a long time in the grand scheme of things. What about before then?
In fact, thanks to ocean sediment cores and other physical clues left behind by past climate regimes, we do have pretty good insight into past Arctic sea ice extent. Combining various sources of information about past climate behaviour, we can figure out why changes in ice coverage have occurred in past times.
Natural climate variations have indeed caused significant changes in past Arctic ice extent. Of course they have. But it's important to remember that such changes in no way constitute airtight arguments against modern ice-loss being contributed to by anthropogenic global warming. Events of the pre-industrial past obviously had other causes. Today's losses of sea ice can in contrast be partly attributed to our disruption of the Carbon Cycle through fossil fuel-burning. Indeed, comparisons between past and present Arctic climate reveal different reasons for past and modern sea ice changes (Overpeck et al. 1997). Meanwhile, analysis of several hundred markers of past Arctic sea ice extent tells us that recent losses appear to have no parallel in records going back many thousands of years (Polyak et al. 2010).
Evidence from the past two hundred years shows how natural and anthropogenic influences on Arctic sea ice can be distinguished. Data demonstrate that the Arctic underwent an unusually cool period in the early 19th century. That was followed by recovery to milder conditions extending all the way into the 20th century. After the middle of that century, we see the accelerated warming of recent decades. This pattern is in good agreement with other observations of global warming such as increasing air and ocean temperatures.
It is worth saying again: both observations and model simulations indicate that the nature of the Arctic warming in the last two decades is distinct from the early twentieth-century mild period. Recent, additional reductions in Arctic sea ice are mostly caused by a new, anthropogenic mechanism (Johannessen et al. 2004) and are thus unique in Earth's history.
Last updated on 25 February 2024 by John Mason. View Archives


[DB] Hot-linked URL.
[DB] Assertions without links to sources will be disregarded. IIRC, the Komet took the NE passage, not the fabled NW passage (so even that does not help you).
BTW, Climate4you is a blind guide: it will lead you astray.
"How can I question cyrosphere? Quit easily. It is a graph posted with no supporting data prior to 1979."
Study this link for a history of Arctic Sea Ice, how to find the data on it...and how to properly analyze it.
Or you can email your questions to the good people at the Arctic Climate Research at the University of Illinois here: cryosphere-science@atmos.uiuc.edu
[DB] I looked up your comment:
"During WW2, the Northest Passage was also sailed by German Warships......remember? If you don't you can look it up. Some simple history items are well known."
Fortuitous typo? A thinly veiled attempt at a snarky witticism? Be it known that your narrative you are pursuing is from the Climate4you/WUWT/CA playbook and that our patience with it...grows thin.
From time to time you show signs of being an actual skeptic and then you return to form. So be it.
Please support assertions with links to peer-reviewed science, construct your comments to comply with the Comments Policy and also ensure that they are on-topic in the future.
[DB] Would you care to write up and contribute a guest post on that topic? :)
[DB] Short answer: There's no easy way to find a comprehensive listing in all the SkS comments. A search of various terms will bring up a listing of blog posts containg the terms, but one is still forced to then hunt-and-peck through the sometimes length comment threads.
If you are interested in doing it, it would be easiest (from a manhours perspective) to start from scratch.
A good starting point for research:
http://www.athropolis.com/links/nwpass.htm
[DB] "This doesn't quite gel with previous reporting does it?"
I doubt that you care to elaborate on your implication here, as I'm pretty sure where you're coming from (and it won't pass the Comments Policy prohibitions).
Needless to say, that's old news, I'm afraid. Discussed extensively already at Neven's and RC. Per Gavin:
Note the bit about "not being relevant for current behavior"...because the ice is currently disappearing in the Arctic 4 times faster than predicted by all models except Maslowski's (which is still tracking for his 2016±3 years).
[DB] For the many reasons stated earlier, the study is essentially a thought experiment not supported by actual observations and metrics. You were pointed out why it's not applicable to what we observe and measure by myself in my earlier response to you and by CBD in his repy to you above.
Compared to the rate of demise of the Arctic Sea Ice, as ably denoted by muoncounter below, the study is indeed old news. Obsolete, even.
Just because we allow occasional reinvention of the wheel does not also mean we will suffer through continual reinvention of the flat tire.