Climate Science Glossary

Term Lookup

Enter a term in the search box to find its definition.

Settings

Use the controls in the far right panel to increase or decrease the number of terms automatically displayed (or to completely turn that feature off).

Term Lookup

Settings


All IPCC definitions taken from Climate Change 2007: The Physical Science Basis. Working Group I Contribution to the Fourth Assessment Report of the Intergovernmental Panel on Climate Change, Annex I, Glossary, pp. 941-954. Cambridge University Press.

Home Arguments Software Resources Comments The Consensus Project Translations About Support

Twitter Facebook YouTube Mastodon MeWe

RSS Posts RSS Comments Email Subscribe


Climate's changed before
It's the sun
It's not bad
There is no consensus
It's cooling
Models are unreliable
Temp record is unreliable
Animals and plants can adapt
It hasn't warmed since 1998
Antarctica is gaining ice
View All Arguments...


Username
Password
New? Register here
Forgot your password?

Latest Posts

Archives

Does ocean cooling prove global warming has ended?

What the science says...

Select a level... Basic Intermediate

The most recent ocean measurements show consistent warming.

Climate Myth...

Oceans are cooling

“Ocean heat touches on the very core of the AGW hypothesis:  When all is said and done, if the climate system is not accumulating heat, the hypothesis is invalid.

[…]Now that heat accumulation has stopped (and perhaps even reversed), the tables have turned.  The same criteria used to support their hypothesis, is now being used to falsify it.” (William DiPuccio)

In 2008, climate change sceptic Roger Pielke Sr said this: “Global warming, as diagnosed by upper ocean heat content has not been occurring since 2004”. It is a fine example of denialist spin, making several extraordinary leaps:

  • that one symptom is indicative of the state of an entire malaise (e.g. not being short of breath one day means your lung cancer is cured).
  • that one can claim significance about a four year period when it’s too short to draw any kind of conclusion
  • that global warming has not been occurring on the basis of ocean temperatures alone

So much for the hype. What does the science say about the temperature of the oceans – which, after all, constitute about 70% of the Earth’s surface? The oceans store approximately 80% of all the energy in the Earth’s climate, so ocean temperatures are a key indicator for global warming.

No straight lines

Claims that the ocean has been cooling are correct. Claims that global warming has stopped are not. It is an illogical position: the climate is subject to a lot of natural variability, so the premise that changes should be ‘monotonic’ – temperatures rising in straight lines – ignores the fact that nature doesn’t work like that. This is why scientists normally discuss trends – 30 years or more – so that short term fluctuations can be seen as part of a greater pattern. (Other well-known cyclic phenomena like El Nino and La Nina play a part in these complex interactions).

Looking at the trend in ocean heat, this is what we find:

Source: Levitus 2009

There are, however, disputes about the accuracy of Argo buoys and expendable measuring devices dropped into the sea, and the reporting of temperatures down to only 700 metres. How do scientists resolve these kind of disputes – bearing in mind that such disputes are the very stuff of science, the essence of true scepticism? One way is to find more data sources – different ways of measuring the phenomenon in dispute. By using results from seven different teams of scientists, all using different tools and methods, we are able to see a clear trend. And while there is variation between team results due to the differences in technique and measurement methods, one thing they all agree on: long term, temperatures are going up.
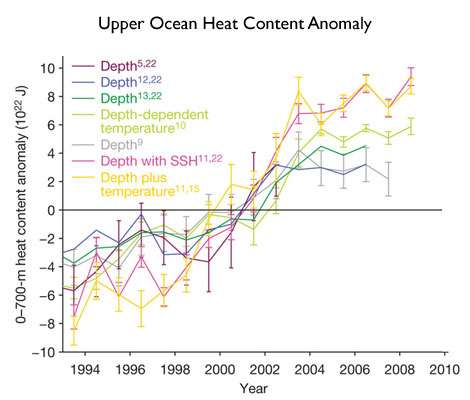
Source: Lyman 2010

The reaction of the oceans to climate change are some of the most profound across the entire environment, including disruption of the ocean food chain through chemical changes caused by CO2, the ability of the sea to absorb CO2 being limited by temperature increases, (and the potential to expel sequestered CO2 back into the atmosphere as the water gets hotter), sea-level rise due to thermal expansion, and the amount of water vapour in the atmosphere.

While there is a great deal we don’t know about how the oceans behave, we do however know that it’s safer to discuss all aspects of climate change using multiple sets of data, rather than just one, as Pielke Sr did. If ocean heat is a guide, then global warming is still on track to cause great disruption if we don’t modify our actions to reduce the release of anthropogenic CO2.

Claims that global warming is not happening on the basis of short-term ocean temperatures are not supported by the evidence.

Basic rebuttal written by GPWayne

Last updated on 1 August 2013 by gpwayne. View Archives

Printable Version  |  Offline PDF Version  |  Link to this page

Argument Feedback

Please use this form to let us know about suggested updates to this rebuttal.

Further reading

The IPCC AR4 section on Oceanic Climate Change and Sea Level (15Mb PDF) gives a good overview of ocean heat and sea level change. Interestingly, they use the ocean heat data with the erroneous 2003 cooling trend (see Figure 5.1).

Josh Willis writes a good overview of the challenges of measuring ocean temperatures in Is It Me, or Did the Oceans Cool?

Comments

Prev  1  2  3  4  Next

Comments 26 to 50 out of 85:

  1. @ KR (25) You really know how to put a stake through the heart of a dead debate. ;) The devil's advocate in me can hear the cries now: "They've hidden the decline!" The Yooper
  2. #26: Stake through the debate or the debaters? Is it just me or does it look like that graph needs a quadratic fit: kind of flattish from '55-'75, then Bang Zoom Straight to the moon!
  3. Is BP still trying to argue that oceans aren't heating up because they were shown to heat up too much? Some people really do sound like broken records...
  4. Berényi - Referring to your post here: The Argo network is quite new, expanding rapidly over the last few years, and proper calibration methods are apparently still being developed. The current Argo data (not the badly calibrated 2006 data), along with currently calibrated XBT data from the past, is shown and linked to here. While the last few years (Argo only data) are not increasing at a high rate, they are showing some increase in ocean heat content over that period. Given the inherent variability of the measurements, I don't think that any "decline" can be statistically justified using just the last 7 years of data. Incidentally, you stated that you weren't making any claims about trends? Isn't stating that OHC content "...has got definitely smaller in seven years" a trend statement? I think it's only reasonable to use statistical analysis on a noisy sample - making claims without statistics is, well, not convincing.
  5. A question for the ocean experts out there: In (I believe) the Why are there fewer weather stations thread someone noted that the temperature anomalies (not temperatures, but anomalies) seen across the surface record have a high correlation over fairly large areas, and hence a reasonable surface temperature anomaly record could be obtained with just a few hundred stations. Is this the case with the Argo and XBT data? Do OHC measures display large area correlations in anomalies, or does the 3D current structure of the ocean prevent that? I'm wondering just how many Argo floats (or better yet, some deeper samples) are required to accurately measure ocean temperatures.
  6. BP, I will also reply in the correct thread with a quantified followup to your claim: "Heat content anomaly of the upper 700 m of oceans in the fourth quarter of 2003 is 11.655±0.975×10²² J, while in the third quarter of 2010 it is 9.589±0.690×10²² J,....a net heat loss (of at least 4×10²¹ J)." The Loehle paper http://www.ncasi.org/publications/Detail.aspx?id=3152 shows about a 5×10²² J annual cycle of OHC. From the third to fourth quarter every year the rise is about 2×10²² J or a loss of 2×10²² J when picking a fourth quarter as a starting point and a third quarter as an ending point. or about 5 times the loss you stated in the other thread. The reason is simply that the earth gets closer to the sun during that interval each year.
  7. BP @85, "Of course I am the person responsible for radically decreasing MBT coverage in 1991 and XBT coverage soon after it while restarting measurements in 2003 by ARGO..." Come on, you are arguing a strawman.... Do you deny saying this @53? "Except there's no "planetary energy imbalance" there for the last eight years." Do do deny saying this @69? "In fact there's no heat accumulation in the system even from mid-2007 to mid-2010. Given you insist on posting on this thread, and insist on focusing on short periods of time, please allow me to post this: 
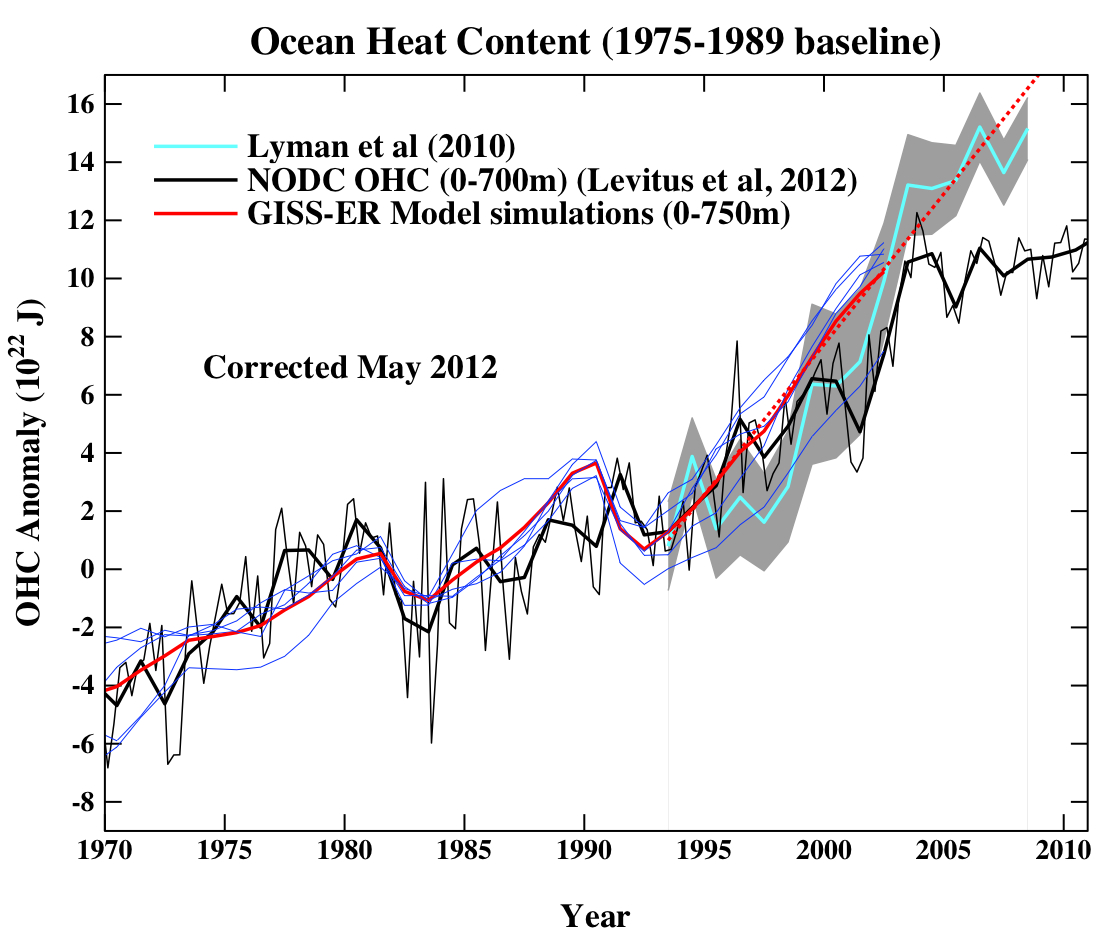
Caption: Changing heat content of the global ocean. Black curve is changes in upper ocean heat content (0 to 700 metres). Pink line is trend in upper ocean heat content. Blue line is trend in ocean heat content down to 2000 metres (Trenberth 2010). But then again it seems that you think that you know more about OHC than Palmer, Lyman, Trenberth, Levitus, Domingues, von Schuckmann, Good,Gouretski, Ishii, Komoto, Johnson, Smith, Haines, Murphy, Reseghetti, Antonov, Mishonov, Garcia, Locarnini, Boyer and Willis. You are railing against an awful lot of grey matter, experience, expertise and training BP. Something else to consider, according to Palmer et al. (2009): "Deep ocean warming may account for some of the missing energy (Johnson and Doney 2006; Johnson et al. 2007; Johnson et al. 2008a). Only with a truly global ocean observing system can we close fully the global energy and sea level budgets, so we must improve our observations of the ocean below 2000 m where Argo floats currently do not reach."
    Response: This is Albatross's reply to BP's comment on a different (and inappropriate) thread.
  8. Albatros, KR, Asteel Is BP's OHC chart posted here at comment #69 wrong?? viz: http://www.skepticalscience.com/news.php?n=519&p=2#37765 Well indeed why don't we invite Palmer, Lyman, Trenberth, Levitus, Domingues, von Schuckmann, Good,Gouretski, Ishii, Komoto, Johnson, Smith, Haines, Murphy, Reseghetti, Antonov, Mishonov, Garcia, Locarnini, Boyer and Willis to comment on BP's analysis. Surely John Cook has some contacts with some of these scientists who could be asked to comment. The nub of BP's argument is simple: Satellite measurements of absolute TOA imbalance is poor to useless (not even the sign is sure), but month on month and year on year precision is good (ie the deltas). The jumps in the OHC charts published 1993-2009 (Trenberth 2010 above) and Lyman composite show OHC gains 2001-03 of about 7E22 Joules (700E20 Joules) which is a rate of about 350E20 Joules/yr. Trenberth's 0.9W/sq.m TOA imbalance equates to 145E20 Joules/yr. To get a 350E20 Joules/yr increase in OHC, the TOA imbalance must have leapt from 0.9 to 2.2W/sq.m in the period 2001-03. Satellite measurement shows no such change in that period. The period coincides with the XBT to Argo transition, so which is right? - high precision delta measurement by established satellites or XBT-Argo in transition?? I would plug for the Satellites. The conclusion is that the step jumps in OHC Charts in this period are an artifact of the transition, and the greater deployment of Argo shows flat OHC since ARO 2003. Therefore, drawing a linear curve fit (the red line on Trenberth 2010) from 1993-2009 and calling it a 0.64W/sq.m (or 103E20 Joules/yr) rate of TOA warming imbalance is bogus if the step jump is incorrect. The blue line (o.54W/sq.m) looks like a dodgy fit as well as it should terminate somewhere near the end of the red line I would have thought. Arguing that BP's 7-8 year period is ridicuously short, is ridiculous itself in the context of OHC Charts which only span 16-17 years (1993-2009). BP's Chart referenced above shows flat OHC with seasonal variations 2003-2010. This means no TOA warming imbalance; because a linear OHC increase has to result from a constant positive warming imbalance (positive net forcing). No warming imbalance for 7-8 years is a terminal inconsistency in the whole theory of AGW by CO2GHG forcing and positive feedbacks.
  9. Kinda sez it all: Source here RC commentary on Lyman et al 2010 here The Yooper
  10. #33: "No warming imbalance for 7-8 years is a terminal inconsistency in the whole theory of AGW" Looking at the graph in #34, I would have to agree; The current 7 year flat spot, if real, is terminal. Just like the flat spot from 1982-1988 was terminal. Guess AGW stopped then, too. Or like it stopped in the late '60s on the graph in #25. Or maybe OHC does have an upward trend, with some more complex behavior that gives rise to these occasional residuals. Funny how one can argue that there's no warming based on a shoulder in the upward trend, all the while ignoring the upward trend itself.
  11. #32 Albatross at 15:15 PM on 21 January, 2011 But then again it seems that you think that you know more about OHC than Palmer, Lyman, Trenberth, Levitus, Domingues, von Schuckmann, Good,Gouretski, Ishii, Komoto, Johnson, Smith, Haines, Murphy, Reseghetti, Antonov, Mishonov, Garcia, Locarnini, Boyer and Willis. You are railing against an awful lot of grey matter, experience, expertise and training BP. I do. And I tell you why. Your figure of OHC history is from Trenberth 2010 (link corrected), which is a simplified remix of Figure 2 from Lyman 2010. Nature, Vol. 465, pp. 304 (20 May 2010) doi:10.1038/465304a Global change: The ocean is warming, isn't it? Kevin E. Trenberth Nature, Vol. 465, pp. 334–337 (20 May 2010) doi:10.1038/nature09043 Robust warming of the global upper ocean John M. Lyman, Simon A. Good, Viktor V. Gouretski, Masayoshi Ishii, Gregory C. Johnson, Matthew D. Palmer, Doug M. Smith & Josh K. Willis On the other hand I have used the OHC reconstruction published online at the NOAA (National Oceanic and Atmospheric Administration) NODC (National Oceanographic Data Center) OCL (Ocean Climate Laboratory) site, based on Levitus 2009 and updated regularly. GEOPHYSICAL RESEARCH LETTERS, VOL. 36, L07608, 5 PP., 2009 doi:10.1029/2008GL037155 Global ocean heat content 1955–2008 in light of recently revealed instrumentation problems S. Levitus, J. I. Antonov, T. P. Boyer, R. A. Locarnini, H. E. Garcia & A. V. Mishonov Fortunately the NOAA NODC OCL OHC site also has annual data in tabular format with proper error bars. If it is copied to your figure, it looks like this: Now. As you know science is never about pictures. It is about propositions, preferably with a truth-value attached to them or at least a not-known tag. Figures like the one above is only meant to be concise representations of complex propositions. For example OHC history reconstruction according to Levitus can be translated to a proposition like "There is a constant c that if ohck is the sum of c and the true value of OHC measured in 1022 J units for year k, then 0.246 < ohc1993 < 1.122 and 0.764 < ohc1994 < 2.256 and 1.615 < ohc1995 < 2.913, etc., etc." A similar proposition can be constructed for the curve in your figure which is Trenberth's representation of Lyman's finding. If you put the two propositions together like I did above by making a joint representation, it is clear that they contradict each other. Therefore if they are supposed to be joined by the logical operation conjunction as the graphical representation suggests, what you get is a false proposition. As you know, from a false proposition anything follows with the force of logical necessity, and of course among the many possible consequences there is the one you are seeking. Or its negation. The problem is the error bars do not overlap. If it happens for different measurements of the same quantity, it is a sure sign it was not a measurement just some pure guesswork. Based on guesswork (as opposed to measurement with proper error analysis) you can never say things like "OHC is increasing". Of course you can say "I guess OHC is increasing" or "the educated guess (using some as yet unspecified system of fuzzy logic) of Palmer, Lyman, Trenberth, Levitus, Domingues, von Schuckmann, Good, Gouretski, Ishii, Komoto, Johnson, Smith, Haines, Murphy, Reseghetti, Antonov, Mishonov, Garcia, Locarnini, Boyer and Willis is that OHC is increasing",. However, it is not a factual statement, but a proposition regarding the personal or community beliefs of a group of individuals. As such, it belongs to the field of social, not natural sciences.
  12. Berényi - I have seen a consistent slant in your postings. In all cases, if there is any uncertainty whatsoever, you put forth the propositions that global warming isn't happening/is less than expected/that negative feedbacks will save us. Now, I will be one of the first to say that OHC measurements are not the best data we have. And that satellite TOA measurements are precise, but not as accurate as we would like. But - Consistency is not just the hobgoblin of little minds. The majority of the indicators (ice melt, surface temps, flora region migration, physics of CO2, etc.) point in a singular direction. OHC measures are clearly imprecise, poorly calibrated, and only measure the top 700 meters of rather deep oceans. Are they the Michelson–Morley experiment of global warming, as you propose, or are they simply a rather imprecise measurement??? This is experimental science, not a logical exercise in a toy mathematical domain, Berényi. The mass of evidence indicates continuing global warming. Occams's razor would indicate that the error(s) are in the OHC measurements and are limits thereof, rather than in everything else we know. Please - consider the fact that this is experimental science, not a logical proposition with fixed premises, and look at the weight of evidence.
  13. Continued from another thread: Robert S., "No one is claiming that. The fact that there are large seasonal temperature variations in no way contradicts a long equilibrium time. With seasons we are not talking about equilibrium time because, as Tom says, the hemispheres do not reach equilibrium with the max and min values of insolation and albedo. No where even close." OK, let's run some numbers. The northern hemisphere surface air temperature increase at peak summer is over 10 C on average. The sea surface temperature increase is about 5 C. This is an enormous accumulation of heat in a very short period of time - only 6 months, during which only part of the +100 W/m^2 peak solar energy is forcing the hemisphere. Let's say hypothetically speaking, the earth were to suddenly remain at its maximum summer tilt angle permanently. If the equilibrium response time were a decade, then we should expect at least an accumulation of over 20 C a year air and about 10 C ocean, correct? Over ten years, that amounts to over 200 C air and 100 C ocean. That is obviously way too high, don't you think? Let's shorten the time span to only 2 years. That would still amount to over 40 C air and 20 C ocean. That still seems too high, doesn't it?
  14. Robert S., "On a hypothetical Earth where we instantly doubled the CO2 from 280ppm to 560ppm, the bulk of the temperature change would indeed be felt within the first few years, but full equilibrium is not reached for a century or longer according to climate commitment studies (try Meehl 2005" This is interesting. I though the AGW theory is saying the opposite of this - that is most of the warming is in the pipeline and yet to occur?
  15. RW1, please look at the paper I linked in #31 which gives an estimate of the seasonal ocean heat storage (5×10²² J trough to peak). Then compare that to the seasonal increase in TSI (need to integrate the increased power over the same portion of the year). Unfortunately I do not have the numbers to do that. Then compare the two and see how much of the extra solar energy made it into the ocean in one season.
  16. "If the equilibrium response time were a decade, then we should expect at least an accumulation of over 20 C a year air and about 10 C ocean, correct? Over ten years, that amounts to over 200 C air and 100 C ocean." Ah, I wondered if this was your issue. Nonlinear, RW1, Nonlinear. As the Earth warms, the more it emits (a la Stefan-Boltzmann), the less the imbalance becomes = less energy builds up in the system per unit time. Temperature will follow a roughly logarithmic curve with a horizontal asymptote at the new equilibrium temperature. "This is interesting. I though the AGW theory is saying the opposite of this - that is most of the warming is in the pipeline and yet to occur?" No - ~0.8C seen so far, ~0.6 to go. But this issue is complicated by other forcings and a gradual (but increasing) buildup of CO2. That's why I gave the hypothetical Earth example to simplify things.
  17. Robert S (RE: 41), "Ah, I wondered if this was your issue. Nonlinear, RW1, Nonlinear. As the Earth warms, the more it emits (a la Stefan-Boltzmann), the less the imbalance becomes = less energy builds up in the system per unit time. Temperature will follow a roughly logarithmic curve with a horizontal asymptote at the new equilibrium temperature." Some of the nonlinearity was factored in because it's not +100 W/m^2 for the whole 6 months. OK, how should we calculate the non linear response given these knowns (+10C surface air and about 5 C ocean)? Let's run the numbers - it still isn't going to be anywhere near a decade.
  18. RW1 - You are still not looking at this from a standpoint of penetration depth. Given the thermal conductivity and circulation patterns of the oceans, it takes time for heat to reach the deep ocean, and hence short term seasonal variations do not penetrate very far into the ocean mass. The total mass changing temperatures up and down is a relatively small portion of the ocean thermal mass. A constant offset, on the other hand (like the current energy imbalance) held over what is now multiple decades - that has time to affect deep waters, and affect the average temperatures. If I take a brick and repeatedly pass a hot torch and a block of ice over the top of it, the bottom of the brick will change temperature almost not at all. If, on the other hand, I sit an electric blanket on it all day, the bottom of the brick will warm up. Penetration depth, and time for heat transfer!
  19. KR, "If I take a brick and repeatedly pass a hot torch and a block of ice over the top of it, the bottom of the brick will change temperature almost not at all." Neither will the top of the brick.
  20. KR, Also, why are you analogizing with a brick rather than a pot of water?
  21. RW1 - "Neither will the top of the brick." Really? The top of the brick will alternately be hot enough to burn your hand and cold enough for a nice iced drink. As to why a brick - I thought that a simpler case for discussing slow thermal transfer from top to bottom. Only the upper layer of the ocean gets seriously involved in short term seasonal temperture/insolation variations, and since it's a fairly small mass it changes quite a lot. But a constant offset? That has time to sink in, to change the deep ocean. And hence the average temperature of the oceans. I'm beginning to find your objections to this disingenuous...
  22. You can prove that there is heating in the pipeline, as it were, by using a simple capacitance relationship: I = C * dV/dt, where C is the heat capacity of a block of ocean, dV is the change in temperature, I is the amount of power injected into the block of ocean, and dt is the time it takes to heat up the amount dV. Note that I used electrical terminology because of my EE background, but the math is the same. Rearrange the terms to solve for dt and then do a little digging for the heat capacity of a block of seawater, and ta-da, you've got your first-order approximation of the answer. It neglects seasonal variations, convection, and radiation, and heat conductivity so it's hardly perfect, but it's a good starting point. Add heat conductivity and the time goes up. Add convection and radiation and the time drops. Add seasonal variation and the time shouldn't change much if at all.
  23. KR, "The top of the brick will alternately be hot enough to burn your hand and cold enough for a nice iced drink." I wouldn't think so - I think the whole brick would warm and cool, but a pot of water would be more analogous to use. That's not going to work either though, I don't think. "Only the upper layer of the ocean gets seriously involved in short term seasonal temperture/insolation variations, and since it's a fairly small mass it changes quite a lot. But a constant offset? That has time to sink in, to change the deep ocean. And hence the average temperature of the oceans." Why? What is the physical reason? If the whole ocean participated in the thermal mass, the short term seasonal warming could not occur. There is no reason to believe the tiny little increase from CO2 wouldn't also change the ocean surface temperature just a quickly. The question is equilibrium time per incremental amount of forcing - not whether or not gradual changes in the upper ocean layers can eventually trickle to the deep ocean waters somewhat. There are also many reasons why the temps of deep ocean waters can change.
  24. #48: "the whole brick would warm and cool" That is a standard high school physics demonstration. I promise you the back side of the brick stays much cooler than the rapidly heated side. "What is the physical reason? If the whole ocean participated in the thermal mass, the short term seasonal warming could not occur." Let's lose the hypothetical nature of this question and start with the observation that seasonal warming and cooling does indeed occur. We certainly can agree that ocean surface layers therefore act as if they have low thermal inertia and participate in these relative rapid changes. As to the greater inertia question, do you agree with the analysis presented by NOAA here? The seasonal variations in heating penetrate into the ocean through a combination of radiation, convective overturning (in which cooled surface waters sink while warmer more buoyant waters below rise) and mechanical stirring by winds. There are your mechanisms. ... These processes mix heat through the mixed layer, which, on average, involves about the upper 90 m of ocean. The thermal inertia of a 90 m layer can add a delay of about 6 years to the temperature response to an instantaneous change ... As a result, actual changes in climate tend to be gradual. There is the reason why 'the tiny little increase from CO2' does not change the ocean temperature quickly. With its mean depth of about 3800 m, the total ocean would add a delay of 230 years to the response if rapidly mixed. However, mixing is not a rapid process for most of the ocean ... An overall estimate of the delay in surface temperature response caused by the oceans is 10–100 years. --emphasis added All of that inertia, without any discussion of the complicating roles of density layering and thermocline structure. Salinity effects on ocean density are also important but are poorly measured at present. It is essential to be able to attribute changes in ocean heat content and the mass of the ocean to causes (such as changing atmospheric composition), perhaps using models. Climate models suggest that the THC could slow down as global warming progresses, resulting in counter-intuitive relative regional cooling or, more likely, reduced warming on multi-decadal time-scales.
  25. muoncounter, "That is a standard high school physics demonstration. I promise you the back side of the brick stays much cooler than the rapidly heated side." Can you direct me to a source that shows or documents this demonstration? I guess it would depend on the size and makeup of the brick, as well as the amount of and duration of heating/cooling, etc.

Prev  1  2  3  4  Next

Post a Comment

Political, off-topic or ad hominem comments will be deleted. Comments Policy...

You need to be logged in to post a comment. Login via the left margin or if you're new, register here.

Link to this page


The Consensus Project Website

THE ESCALATOR

(free to republish)


© Copyright 2024 John Cook
Home | Translations | About Us | Privacy | Contact Us