


 Arguments


Is the science settled?
What the science says...
| Select a level... |
 Basic
Basic
|
 Intermediate
| |||
|
That human CO2 is causing global warming is known with high certainty & confirmed by observations. |
|||||
Climate Myth...
The science isn't settled
"Many people think the science of climate change is settled. It isn't. And the issue is not whether there has been an overall warming during the past century. There has, although it was not uniform and none was observed during the past decade. The geologic record provides us with abundant evidence for such perpetual natural climate variability, from icecaps reaching almost to the equator to none at all, even at the poles.
The climate debate is, in reality, about a 1.6 watts per square metre or 0.5 per cent discrepancy in the poorly known planetary energy balance." (Jan Veizer)
At a glance
Science, in all of its aspects, is an ongoing matter. It is based on making progress. For a familiar example, everyone knows that the dinosaurs died out suddenly, 65 million years ago. They vanished from the fossil record. The science is settled on that. But how and why that happened is still a really interesting research area. We know a monster asteroid smacked into the planet at roughly the same time. But we cannot yet conclude with 100% certainty that the asteroid bore sole responsibility for everything that followed.
With regard to climate science, the basis of the greenhouse effect was demonstrated in the 19th Century. The effect on global temperature through doubling the concentration of atmospheric CO2 had been calculated before 1900 and was not far off modern estimates. Raising global temperature causes Earth's climatic belts to shift polewards. Higher temperatures reduce the amount of land-ice on the planet. That in turn causes sea levels to rise. These are such simple basic physical principles that we can confidently state the science is settled on all of them.
Where the science is less settled is in the fine detail. For example, if you live in a coastal town at a low elevation, you would obviously like to know when it is likely to be affected by rising seas. But that's difficult.
Difficult because changes in sea levels, variations in the sizes of tides and weather patterns are all factors that operate independently of each other and on different time-scales. We may well know that a big storm-surge hitting the coast at high water on a spring tide is the worst-case scenario, but we don't know exactly when that might happen in the decades ahead. Too many variables.
Such minute but important details are where the science isn't settled. Yes we know that if we carry on spewing out tens of billions of tonnes of CO2 every year, things will get really bad. Where and when is the tricky bit. But if climate change was a deadly pathogen, for which there was a vaccine, most of us would get that jab.
In passing, the myth in the box above illustrates a key tactic of misinformation-practitioners, to mix up a whole bunch of talking-points into a rhetorical torrent. The classic example of the practice is the 'Gish-gallop'.
The term Gish-gallop was coined in reference to a leading American member of the creationist movement, Duane Gish (1921-2013). Gish was well-known for relishing fiery public debates with evolutionists. He perfected the method of presenting multiple arguments in a rapid-fire but scattergun manner so that they are impossible to answer in a structured form. It's the opposite of scientific discussion. The Gish-galloper appears to the viewers or listeners to be winning the debate. 'Appears' is the keyword here, though. If you can recognise a Gish-gallop developing, you can make your own mind up quickly.
Please use this form to provide feedback about this new "At a glance" section. Read a more technical version below or dig deeper via the tabs above!
Further details
Deniers often claim that the science of anthropogenic global warming (AGW) is not 'settled'. But think about this for a moment. No science is ever completely settled. Science deals in probabilities, not certainties. When the probability of something being correct approaches 100%, though, scientists agree that's the most likely answer. Consensus is achieved.
Thus we agree that certain pathogens can make us extremely unwell. We agree that a big asteroid hitting the planet would be nothing short of catastrophic. We agree that if we live in a district prone to tornadoes, it makes sense to have a good storm-shelter in your home. There are countless other examples, all of which can be filed under the same term, 'obvious'. That's even if we don't know exactly when the next pandemic, impact or tornado outbreak will occur.
Climate science deniers, on the other hand, insist that results must be double-checked, triple-checked and uncertainties must be narrowed before any action is taken. This is basically stalling for time, since the basic principles behind AGW have been staring us in the face for decades. It's also very misleading because by the time scientific results are offered up to policymakers, they already have been quintuple-checked.
Scientists have been predicting AGW with increasing confidence since the 1950s. Indeed, the hypothesis, backed up by detailed calculations, was first proposed in 1896. As science learned more and more about the climate system, a consensus gradually emerged. Many different lines of inquiry all converged into the IPCC’s 2007 conclusion that it is more than 90% certain that anthropogenic greenhouse gases are causing most of the observed global warming.
Some aspects of the science of AGW are known with near 100% certainty. The greenhouse effect itself is as established a phenomenon as any. There is no reasonable doubt that the global climate is warming (fig. 1). And there is also a clear trail of evidence leading to the conclusion that it’s caused by our greenhouse gas emissions. Some aspects are less certain; for example, the net effect of aerosol pollution is known to be negative, but the exact value needs to be better constrained. We're working on it. But it changes nothing regarding the basic principles.
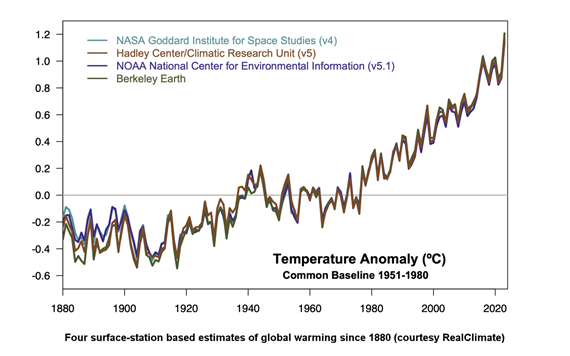
Fig. 1: the latest temperature anomalies from four leading datasets, relative to a 1951-1980 baseline. The trend continues upwards and upwards. Graphic: Realclimate.
What about those remaining uncertainties? Should we wait for 100% certainty before taking action? No. Outside of logic and mathematics, we do not live in a world of absolute certainties. Science comes to its conclusions based on the balance of evidence. The more independent lines of evidence are found to support a scientific hypothesis, the closer it is likely to be to the truth. Hypotheses are tested to death before they are able to graduate into a theory. If someone tells you something is 'only a theory', they do not know what they are talking about. Theories are extremely robust explanations.
Just because some details about AGW are still not well understood, that should not cast into doubt our understanding of the big picture: humans are causing global warming. It is specifically down to our perturbation of Earth's carbon cycle by chucking some 44 billion tonnes of CO2 into the atmosphere every year. That's around a hundred times more than annual volcanic emissions. It's such a huge amount it's almost incomprehensible.
In most aspects of our lives, we think it rational to make decisions based on incomplete information. We all take out insurance when there is even a slight probability that we will need it. We don't know when that tornado might pay a visit, but we want to be covered for the possibility that the house might get flattened, because we all know tornadoes can flatten houses.
Likewise, we don't know the exact details in terms of when or how disasters may strike due to global warming. Nevertheless, we know it will make more intense rainfall events more likely. We know it will cause more land-ice to melt, further raising sea levels. We know it will make fire-weather more common and intense. We know it will cause agriculture to be compromised, to the point of non-feasibility in some places. We know it will displace human populations. These are all very basic principles based on elementary physics. In other words, they are obvious. Why, then, do we ignore such settled things?
Last updated on 7 April 2024 by John Mason. View Archives


@ Bob, It's just a miscommunication on my part. I couldn't think of how to word my question that's why I ended up asking that subjective question in the beginning.
I'm not questioning the reliability of models...models are used all the time like CFD. The limitations in CFD is due to budget and computer power. I was wondering where the uncertainty in climate was mainly coming from like the uncertainty in equilibrium climate sensitivity from double co2. was it because of theory or tech? but you guys already answered my questions that the it's due to limits on current tech. thanks.
engineer
There are a range of potential feedbacks that are hard to quantify because each one of them is an entire field of study in its own right. For example:
Vegetation response. Will the Amazon for example remain a rainforest? Become a drier forest? Grassland? Each has different implications for carbon cycle sinks and sources, surface albedo and evapotranspiratioin patterns.
Ice sheet retreat. What are the dynamics of any decline in Greenland ice sheet cover, WAIS, EAIS? Timing and extent of this for any particular level of GHG forcing again has significant impacts on albedo.
Ocean Circulation. Major ice sheet melt might impact on the Thermo-Haline circulation that drives ocean currents - there is some evidence this was a part of what happened during the warming from the last Glacial Maximum. If ocean currents change, this can alter the distribution of where heat is transported to. Thus cloud patterns, climate zones, all sorts of things.
Methane release from Permafrost. How fast will permafrost melt and where? Will this produce more aerobic or anaerobic decomposition of the defrosted organic matter, influencing whether carbon outgasses as Methane or CO2. Higher rates of methane release will have a greater short term warming effect than if it is released as CO2 even though the longer term impact will be the same as ultimately the methane is oxidised to CO2
This stuff is too hard to do at a theoretical level and even modelling involves stacking models on models. Thats why paleo climate studies are an important reference point. That is what climate has actually done in other circumstances.
@engineer
Here's a concise descpriton of how global climate models evolved and function.
Source: How Do We Know Humans are Responsible for Global Warming? by Michael Mann, WeatherUnderground, April 22, 2013
engineer:
I don't think it is correct to just call it a technical problem. To follow on Glenn's comment, when you are trying to model today's climate, you can get away with saying "this is what the vegetation is", or "this is where the ice sheets are", etc., and simply measure the required input parameter for the climate models. You can even do that to a certain extent for past climates, as there are proxies that will give you an indication of vegetation cover, ice cover, etc. Understanding why the vegetation, ice, etc. are the way they are is a help, but not an absolute necessity to be able to develop a good understanding and a reliable model of current climate.
Contrast that with the future: we can't measure the vegetation cover or ice sheet distributions - we have to model them. But uncertainties in how vegetation responds to a changing climate is not a problem that necessarily requires increased understanding of climate dynamics - it is a problem of understanding vegetation dynamics. Predicting something like future aerosols not only requires estimating future levels of existing emission sources (which requires economic modelling), it also requires assumptions of what future combustion technology might produce, and what social policy choices might be made. You can start by assuming they won't change, but proper policy decisions require that you also evaluate what might happen if they do change (using realistic ranges of possibiliites).
It's a classic multi-disciplinary issue.
Replying to TLander from another thread :-
TLander, you are deceiving yourself if you propose that there is some as-yet-unknown or undiscovered dominant cause of the rapid modern global warming. You wish to imply that that we should halt activities designed to mitigate CO2 emissions . . . until such time that your not-even-yet-hypothesized mechanism of rapid global warming gets discovered (and also shows itself to be so strong and beyond human influence, that it is futile for humans to attempt softening [through CO2 reduction] the warming effect caused by your notional new discovery).
TLander, there are at least two counter-arguments against your proposal.
You are already aware of (A) : That for many decades, many tens of thousands of scientists have very closely studied climate-related science (and the underlying physics). This is not the era of science in the mid-1800's . The chance of them entirely missing a major previously-unknown factor . . . is exceedingly small. Indeed, so vanishingly small, that surely no sane man would gamble the health of his planet on that chance.
But you might not be aware of (B) : That CO2 (and the other greenhouse gasses) form a superb match for the physics of modern global warming — both in theory and in empirical evidence. Merely a correlation, you say? No — the theory backs the observations, and the observations back the theory. So, if you are proposing an as-yet-unimagined novel "dark cause" of Global Warming . . . then you have a big problem, a double explanation which you need to pull out of your hat.
Firstly you need to find a "dark cause" factor which very closely matches the historical & growing effect of CO2. Then you also need to discover another new factor — this time a cooling factor which matches and cancels out the known warming effect of CO2.
All a very big ask.
TLander, the implication is that you have not thought things through.
Regarding the plane falling out of the sky analogy... If you had to get on one of two planes, would you pick the one with a tem percent chance of survival or the one with a 90 percent chance of survival.
Please note: the basic version of this rebuttal was updated on April 7, 2024 and now includes an "at a glance“ section at the top. To learn more about these updates and how you can help with evaluating their effectiveness, please check out the accompanying blog post @ https://sks.to/at-a-glance
I still get hung up on the plane example, not sure anybody is framing it correctly.
If you consider the plane to be built upon an aeronautical theory of AGW and is predicted with 97% certainty by those who designed it to be airworthy and get you to your destination, which would be surviving changes in the climate by preventing them altogether using a human controlled CO2 thermostat to control the temperature of the verses planet... verses choosing an alternative, far more pedestrian and proved means of transportation to climate survival that has worked for thousands of years, namely innovation, adaption and migration, which would you choose?
For example, a five gallon bucket of sand tossed upon your acre of oceanfront property every day will keep up with 8" of sea level rise over the next century.
"a five gallon bucket of sand tossed upon your acre of oceanfront property every day will keep up with 8" of sea level rise over the next century."
I think that example is problematic.
8" = 200mm -> 2mm per year. Global sealevel rate is currently 3.4mm and accelerating.
Check your maths on the 5gal of sand. I make that 19L or 19,000 cubic cms. 1 acre = 40470000 cm2 19,000/40470000 isnt remotely keeping up with 2mm/year of sealevel. Out of curiousity, where did you find this statement about the 5gal bucket? Sounds like a source bent on misinformation.
Where do you get your sand? At a sustained 4mm/year of sealevel rise, your beachs vanish.
Sand or any other easily mined material is also highly erodable - without an expensive seawall, wave action will take it away.
And finally, the real point. Adaption is not free. It costs to make those changes. Why are you so confident that adaption is cheaper than just converting energy sources to renewables, especially as renewables+storage has better LCOE than FF?
I came up with that bucket in a quick mental estimate, which was well within an order of magnitude of your exhaustive analysis... so big deal, it's two buckets a day, not ten or a hundred, and that's for somebody with the money to have an acre on the beach.
Nobody with beachfront property of any size is going to be moving, I can assure you, even after hurricanes with 15' storm surges they don't. Obama has two lavish oceanfront estates in the Atlantic and Pacific, he doesn't seem to be worried about his great, great grandkids drowning.
It is not 2 buckets - it is close to 1000 buckets a year. Maths matters.
"Nobody with beachfront property of any size is going to be moving"
Trivial to see that is not true. Why do you believe that given that coastal erosion data and property loss is readily available? You can also look up loss of agricultural land to salt incursion.
Again, why do you believe adaption is going to be cheaper than FF phase-out?
TWFA @85 ,
the Obamas' expensive mansions have something like 10 feet (or more) of elevation . . . and judging by expected sea-level rise, the Obama grandchildren may well need to sell (or abandon) the mansions when they themselves reach the age of 100 years or thereabouts. Yes, it's a sad problem when super-rich families have to move house ;-) And perhaps you could spare some thoughts & concerns for the poorer folks who live on the coastlines of the world?
TWFA . . . please use more mathematics, and less sour grapes.
Come on, 2 buckets a day is 730 a year, and now you're bitching that it's a thousand a year instead, like that changes anything, it's all within an order of magnitude of my first 365 estimate, why didn't you just go right to 100,000 a century for greater effect?
The point is we KNOW such methods work and have been effective, not just on the coast, but improved insulation, hydroponics and gee, maybe agriculture will come back in thenorthern climes.
The Venetians have been dealing with rising water since the 5th century, on the other hand we only have an alleged 97% certainty that by adjusting the atmospheric content of CO2 up or down by a fiftieth of a percent from the four tenths of a percent it is now that we can control the temperature of the entire planet and avoid having to buldoze all that sand.
Besides, according to the Jevregeva data in '08 and refined in '14 the sea levels stopped receding and began to rise in 1750, when James Watt was twelve years old and over a century before our emissions were even measurable, see Fig. 1
Jevrejeva '08
TWFA @88 ,
The paper Jevrejeva et al., 2008 does not support your wild claims.
Did you actually read that paper? It appears you did not look at Figure 1, and it appears you did not look at Figure 3.
Nor does it appear that you read or understood the Conclusion of Jevrejeva ~ which states in its final sentence :- "However, oceanic thermal inertia and rising Greenland melt rates imply that even if projected temperatures rise more slowly than the IPCC scenarios suggest, sea level will very likely rise faster than the IPCC projections [Meehl et al., 2007]"
TWFA ~ where do you get your strange ideas from?
Of course I looked at Fig. 1... the ebb point in curve is at 1750, clearly rising by 1800 and well on the way by 1850.


I just want to know why, if we are the ones causing all this, that it began long before we were emitting measurable amounts of CO2, which was around 1890. Do I need to show you a chart of sea levels vs emissions?
Time series of sea level anomalies (blue) Jevrejeva et al. (2014).
Million tons of carbon emitted from burning fossil fuels from the Carbon Dioxide Information Analysis Center (CDIAC 2014)
Oh, and as to their conclusion, inertia works both ways, if temperature is the controlling factor, in order for the levels to stop receding and "turn the tide" around 1750 the temperatures would actually have to have been climbing beforehand.
TWFA @90 (etcetera) :-
Your second graph clearly does not support your claim in @88 that: "...sea levels began to rise in 1750, when James Watt was twelve years old..." Indeed that graph shows sea level falling until about 1860 (when James Watt had been dead forty years).
And your first graph ( Jevrejeva; Figure 1 ) shows no support for your wild claim, whatsoever. Please consult your optometrist, urgently.
TWFA, it appears you are regurgitating some wild claims from some third-party source. Where is that source ~ and how did they get it all so very wrong?
Still not answering:
"Again, why do you believe adaption is going to be cheaper than FF phase-out?"
This is the core of the issue isnt it?
Sorry, you're wrong again, perhaps your eyes didn't notice the first chart starts at 1700 and the second at 1800.
In the second chart the authors used data from the 2014 study, which basically took some of the noise out of the '08 paper but did not change the overall curve from 1700, however this particular evangelist cut off the data prior to 1810 to show the slight dip between 1810 and 1860 in order to make an apparent human caused reversal to fit the Industrial Revolution chronological orthodoxy, even though the lagging emissions curve still needed quite a bit of explaining... perhaps in the future they will discover or "adjust" preceding emissions to better fit the narrative.
By the way, I am not "regurgitating" anything, I first noticed the second chart about six months ago when somebody posted it as some sort of devastating proof of the coming inundation we are to be blamed for, it didn't make sense to me based upon the lagging emissions curve, then I drilled deeper into the source data and it all made even less sense.
In any event whether the science is settled (an oxymoron if there ever was one, no theory or law following the scientific method can ever be proved right, only not yet proved wrong) or not is moot, the evangelists ARE getting their way and we WILL be spending hundreds of trillions over the next four or five decades, probably forgoing a chunk of liberty along the way as well, seeing if we can operate a global CO2 controlled thermostat, either it will work, or nature will have something to say about it.
My money, if there is any to be left over, is on the buckets.
I don't know that innovation, adaption and migration will be cheaper, but I know it has worked every time tried. On the other hand you do not know the global thermostat approach will work for sure, will be cheaper, or even that, given all the people on the planet that may not be able to be controlled without global autocracy, a fate worse than a few degrees and inches of water, IMO, it can or will work even if the West goes net negative or transfers wealth to the underdeveloped world to bring us down to equilibrium for our sins.
scaddenp, FF phase-out means petrochemical phase-out as well, you can't have one without the other, refine a quart of corn chowder into a quart of vegetable soup with nothing left over, so as long as there is plastic, insulation for all those wires needed in the FF-free world and asphalt to roll the synthetic rubber Tesla tires on, there will still be at least a third of every barrel of crude being cracked into some form of hydrocarbon fuel or gaseous byproduct that cannot be sequestered or stored, only burned.
Correction, vegetable soup into corn chowder...
TWFA @90 (and others) :
Yes, the two graphs are somewhat different ~ and they both contradict your claims. (How do you disbelieve your own eyes?)
Your Jevrejeva Figure 1 shows not only a great deal of jagged variation in the main black line (which is quite to be expected in averaged measurements at different dates) . . . but also shows the broad mauve bands above & below the averaged measurements in the pre-1850 region.
TWFA, what do you suppose that very broad mauve band means? ~ For one thing, it means that the smooth calculated curve is merely a convenient approximate fit. Also, that the smooth curve is not imposed by Divine Will upon that wiggly graph in order to show TWFA a 5mm sea level fall (& rise) between 1700 and 1800.
TWFA, in this thread please do not raise all that Conspiracy Theory stuff ~ it is difficult to have an intelligent discussion about real things, if you choose instead to wander off into Conspiracy Crazy Land.
The phase out of Fossil Fuels is not (and cannot) be carried out "overnight". It is looking like it will take maybe 40 years or more ~ and so your precious plastic shopping bags will be available for quite some time yet. No need for alarm or panic.
It probably comes as no surprise that TWFA is relying on the Jevrejeva sea level reconstruction. It is probably the least reliable one, and a 2013 post at RealClimate discussing the state of knowledge of sea level rise has provided detailed discussion of the methodology and its problems.
Two paragraphs from that RealClimate post:
Follow down that RealClimate post to the section titled "A reader’s exercise: the “virtual station method” of Jevrejeva et al" for further details.
Perhaps TWFA will illuminate us on why he prefers that Jevrejeva analysis, but I won't hold my breath.
Noise or improved processing does not change a trend fom negative to positive, where were the sea levels in 1600 vs 1750, higher or lower? Is the assertion that but for mankind the sea levels today would be at or below the level they were in 1600?