


 Arguments


Does CO2 always correlate with temperature (and if not, why not?)
What the science says...
| Select a level... |
 Basic
Basic
|
 Intermediate
| |||
|
Surface temperature measurements are affected by short-term climate variability, and recent warming of deep oceans |
|||||
Climate Myth...
There's no correlation between CO2 and temperature
"Twentieth century global warming did not start until 1910. By that time CO2 emissions had already risen from the expanded use of coal that had powered the industrial revolution, and emissions only increased slowly from 3.5gigatonnes in 1910 to under 4gigatonnes by the end of the Second World War.
It was the post war industrialization that caused the rapid rise in global CO2 emissions, but by 1945 when this began, the Earth was already in a cooling phase that started around 1942 and continued until 1975. With 32 years of rapidly increasing global temperatures and only a minor increase in global CO2 emissions, followed by 33 years of slowly cooling global temperatures with rapid increases in global CO2 emissions, it was deceitful for the IPCC to make any claim that CO2 emissions were primarily responsible for observed 20th century global warming." (Norm Kalmanovitch).
At a glance
If you happen to be reading something about climate change in the popular media, be sure to keep an eye out for certain words. The one in this case is 'deceitful'. Why? Because it's an emotive word. It's a good sign that the writer is not a scientist but someone with a political axe to grind.
The heat-trapping properties of carbon dioxide, water vapour and other greenhouse gases were identified over 160 years ago. After that, climate research continued unhindered for many decades. However, by the second half of the 20th century the seriousness of the threat of climate change was well-understood. That led in due course to the involvement of bodies such as the United Nations. Treaties such as the Kyoto Protocol of 1997 followed.
In response, the fossil fuels sector and their political and media associates, perceiving threats to profitability, turned climate science into a political football. With climate science thus politicised, the arena within which research and outreach were conducted had changed. This was no longer a quiet backwater.
That's the historical context. Now we can get to the meat of the myth. The quote above this piece dates from September 2009. Apart from anything else, it's 14 years out of date now. Globally, the ten warmest years since 1880 have all occurred since the statement was made. According to NASA’s Goddard Institute for Space Studies, the average global temperature has increased by 1.4° Celsius (2.5° Fahrenheit) since 1880.
However, global temperature does not correlate exactly with CO2 emissions on a year in, year out basis.There are other well-understood factors that can warm or cool the climate over such short-term periods. You may have heard of El Nino and La Nina. These phenomena involve above- or below-average sea surface temperatures respectively, in the central and eastern Pacific Ocean. Their effects are global.
A strong El Nino can produce a massive global temperature-spike. Such very warm years once led to people making the claim of, "no warming since 1998". Briefly sounding plausible for a few years, it soon became self-evidently incorrect.
Instead, the correct way to look at temperature trends is to examine them over multiple decades - 30 years is standard in climate science. So to answer the question, "where are we now?", one would look at the temperature record from 1992-2022. Doing so takes out the noise, the ups and downs due to El Nino, La Nina and other factors. And the trend is most certainly upwards.
To the newcomer to climate science, it can be difficult to spot misinformation. However, opinion-pieces that accuse bodies such as the Intergovernmental Panel on Climate Change (IPCC) of intentions like deceit should instantly ring alarm-bells.
It is important to point out that the motive for such political misinformation is to spread confusion and doubt. The organisations behind it simply seek delaying any meaningful action. In kicking the can down the road, they try to deflect the pressure to get their own houses in order, and to hell with the consequences.
Please use this form to provide feedback about this new "At a glance" section. Read a more technical version below or dig deeper via the tabs above!
Further details
The amount of CO2 in our atmosphere is increasing all the time. On February 26th 2024, according to the monitoring resource Daily CO2, it had exceeded 425 parts per million (ppm). That's up by 3.96 ppm since the same time last year - but more importantly, up from around 280 ppm before the industrial revolution - a 50% plus increase.
Pre-industrial levels of CO2 and other greenhouse gases, like methane and water vapour, were sufficient to keep the Earth’s surface 30°Celsius (54°F) warmer than it would have been without them. Since then, we have added 50% more CO2 - but that doesn't mean the temperature will go up by 50% too.
There are several reasons why. Doubling the amount of CO2 does not double the greenhouse effect. The way the climate reacts is also complex and it can be difficult to separate the effects of natural changes from man-made ones over short periods of time.
As the amount of man-made CO2 goes up, temperatures rise but not at the same rate. Estimates vary - climate sensitivity is a hot topic in climate science, if you’ll forgive the pun. Based on multiple lines of evidence, according to the IPCC Sixth Assessment Report (2021), the "very likely range [for climate sensitivity to doubling of CO2] is 2°C to 5°C".
So far, the average global temperature has gone up by about 1.4 degrees C (2.5 F).
"In 2023, hundreds of millions of people around the world experienced extreme heat, and each month from June through December set a global record for the respective month. July was the hottest month ever recorded. Overall, Earth was about 2.5 degrees Fahrenheit (or about 1.4 degrees Celsius) warmer in 2023 than the late 19th-century average, when modern record-keeping began."
Source: NASA.
The speed of the increase is worth noting too. Unfortunately, as this quote from NASA demonstrates, anthropogenic climate change is happening very quickly compared to changes that occurred in the past (text in bold for emphasis):
"As the Earth moved out of ice ages over the past million years, the global temperature rose a total of 4 to 7 degrees Celsius over about 5,000 years. In the past century alone, the temperature has climbed 0.7 degrees Celsius, roughly ten times faster than the average rate of ice-age-recovery warming."
Source: NASA Earth Observatory.
Small increases in temperature can be hard to measure over short periods, because they can be masked by natural variation. For example, cycles of warming and cooling in the oceans such as the El Niño-Southern Oscillation (ENSO) cause temperature changes that can mask small changes in temperature caused by CO2 emissions that occur at the same time. That's why scientists measure changes over long periods so that the effects of short natural variations can be distinguished from the effects of man-made CO2.
The rate of surface warming varies year by year, yet the physical properties of CO2 and other greenhouse gases do not change. Neither has the amount of energy arriving from the sun changed significantly in recent decades. But if that’s true, where is this heat going?
The answer is into the oceans. Fig. 1 is a graphic showing where the heat is currently going:
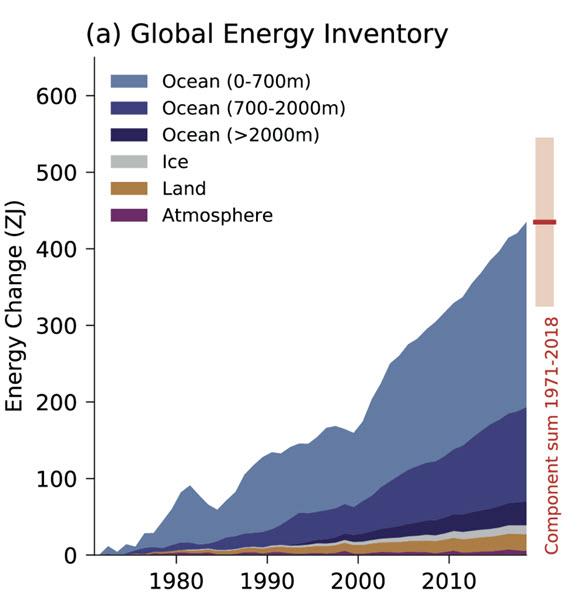
Figure 1: Global Energy Inventory: observed changes in the global energy inventory for 1971–2018 (shaded time series) with component contributions as indicated in the figure legend. Cross-Chapter Box 9.1 Figure 1 (part a) - From IPCC AR6 WGI Chapter 9.
The way heat moves in the deep oceans was poorly understood up until around the turn of the millennium. Since then, vast improvements in measurement techniques, such as the Argo float system, have allowed scientists to far more accurately gauge the amount of energy the oceans are absorbing. Argo floats, numbering several thousands, weigh 20-30 kilograms and are packed with instruments. They typically travel through the oceans around a kilometre below the surface. But they can rise up to the surface or dive down to 2 km. That makes it possible to collect profiles in terms of temperature, salinity and other parameters. So far, over two million such data-profiles have been collected.
Argo data have shown the upper 2,000 metres of the oceans has captured roughly 90% of the anthropogenic change in ocean heat content since the programme started in 1999. Temperatures in the upper 600 metres have been seen to fluctuate with shorter-term climate events like El Niño-Southern Oscillation. In deeper waters, however, there is a more consistent warming trend. In summary, the 700–2,000 metres ocean layer accounts for approximately one-third of the warming of the whole 0–2000 m layer of the World Ocean being mapped by the Argo floats.
So we know that the energy added to the climate system by man-made CO2 is not only apportioned into surface warming, because a large part of the heat goes into the oceans. The rate at which surface temperatures go up is not proportional to the rate of CO2 emissions but to the cumulative total amount of atmospheric CO2. Only by looking at long-term trends - 30 years is the standard period in climate science - can we measure surface temperature increases accurately, and distinguish them from short-term natural variation.
Last updated on 10 March 2024 by John Mason. View Archives


MA Rodger @175.
I didn't suggest there was a 0.6 increase 1880 to 1940's. My figure was 0.4 (Based on Global).
Your "three quarters would perhaps have been closer to the mark" is not representative of the timeframes the NASA statement refers to. I'll assume you've added the 0.2 you referred to.
Point was, NASA was talking about a portion of a total increase in a shorter timeframe than that overall gain was actually made, when looking at the total period. They have done this to create a narrative and the OP has seized on that to further that narrative.
There's no point selecting a short period to further a theory when the previous short period contradicts that theory. Being selective with data to illustrate a point doesn't work and raises the question of objective credibility.
There may have been some relevance to a rate of gain if a trend was always gaining.
strop @176.
You fail to describe this "theory" you mention @176. As it appears as a fundamental consideration of what you describe as "point was..." it does appear to be an important part of your comment. Can you describe what you mean by the "theory"?
You did indeed set out @174 a 0.4 deg warming in the period 1880s-1940s, this 50% relative to the warming in the period 1880s-2010. And if your argument is made for you, the topic under discussion is the correlation between CO2 and global temperature (specifically here the Gistemp LOTI) and thus the comparison you suggest is not in principle unmerited. My apologies. I was paying little attention to your comment as it is somewhat banal.
You still fail to explain properly your derivation of the numbers you set out and how you obtain the 50% result so I will do this analysis for you. To achieve a more fruitful outcome, I will not expend apples and oranges within this analysis. Rather than mix period-averages with cherry-picked period-maximims, I will use period-maximums throughout.
If we consider the maximum annual LOTI temperature within the start period (1880-1900, sometimes considered a measure of pre-industrial temperature) and the intermediate period (1940s) and the end periods (1) 1970s-2010 and (2) 1970s-2017:
This yields a result of (1) 38% and (2) 28% of the warming occuring by the 1940s (specifically in 1944), a time when the industrial-period CO2 forcing had reached (1) 34% and (2) 30% relative to the end periods. Thus the level of warming is reasonably reflective of the CO2 forcing (and indeed also if all positive forcings are included in the analysis). It should be noted that the 38% value relies solely on the 1944 annual anomaly. If multi-year averages are substituted for annual temperatures, something that should be done given the nature of the data, the percentage drops markedly.
MA Rodger @ 177
I am somewhat confused by the discussion between MA Rodger and strop regarding what the temperature rise has been since the 1880's. My understanding is that MA Rodger suggests that it has increased from .8C to 1C as of now.
But on Feb 4, MA Rodger on the "There is no empirical evidence" blog, he stated the following for 2016:
"Using a modern global surface record to fill in recent decades (BEST was to hand) and aligning it with the tag end of the Loehle and McCulloch data (1850-1935), the temperature for 2016 would be plotted at +1.2ºC which is plainly off the graph."
If the yearly temperature can jump up and down by .2C per year then do we not really have to use a minimum 10 year period in anything we talk about? I appreciate that El Nino's and La Nina's, as well as volcanoes, complicates looking at what temperature rise we have had over this period. But is even an average over a 10 year period relevant? Look at the famous "hiatus".
NorrisM @178.
You are famously confused, so you better concentrate.
The recent BEST & GISS global temperature anomalies are in close agreement, their maximum annual values (2016) within 0.02ºC of each other. So the bulk of the 0.2ºC discrapency will likely be due to the other end of the record.
There are a couple of other factors which cancel each other out. Here in this thread you will note I was using 'period-maximums' (which thus includes 2016) but the 'Empirical evidence that humans are causing global warming' comment was using BEST 'period-average' values (1850-1935) to align the BEST data with the Loehle & McCulloch data (covering 11,700BC-1935AD with their zero equal to their full 'period-average'). Not using 'period-maximums' increases the measure of rise-in-temperature-since-pre-industrial by about 0.1ºC, but this is canceled out by the re-basing to the Holocene 'period-average' which is warmer than pre-industrial by a similar amount.
At the early end of the two temperature records, there is more of a discrepancy between BEST & GISS (with BEST -0.17ºC cooler than its GISS equivalent) which, coupled with BEST extending back to 1850 with even lower temperatures, this providing adjustments that tot-up to the bulk of the extra +0.2ºC above the zero to yield +1.2ºC on the Loehle & McCulloch graph.
MA Rodger @ 179
Thanks, I see the difference between the comparison of maximum annual values and average values. I learn by asking questions but, as per strop's comment above, I do not appreciate being insulted. Take the edge off.
@MA Rodge
Now an atmosphere becomes formed around the hot body which is warmed by the hot body (this atmospheric warming you apparently have no problem with), the atmosphere reaching a chilly -18ºC = 255K at equilibrium. Being warmer than absolute zero, the atmosphere will radiate upward into space and downward back to the hot body. So will the extra energy flux back to the hot body not have a heating effect? Note - if it doesn't we will have to rewrite the laws of thermodynamics and we are not very keen on doing that.
Pardon me, I am new here. And it has been 2 decades since I touched physics but doesn't thermodynamic equalibrim itself mean there will be no net energy transfers between the two objects?
First you state that there is equalibirm then you suggest there will be a net heat transfer, how is that possible?
ankit662003:
You are confusing "no net transfer" with "no transfer at all".
Adding $2000 to your bank account by depositing your paycheck, and then taking $2000 out to pay your bills results in no net change in your bank balance, but you still have $2000 as a "flux" in from your employer, and a $2000 "flux" out due to your withdrawal. Your bank account is in "equilibrium", but fluxes are not zero.
Likewise for energy. Even at local thermodynamic equilibrium, two objects can be exchanging energy it just has to be in equal quantities. And you need to consider all energy transfers - which in the atmosphere includes convection as well as IR radiation.
Please note: the basic version of this rebuttal has been updated on March 10, 2024 and now includes an "at a glance“ section at the top. To learn more about these updates and how you can help with evaluating their effectiveness, please check out the accompanying blog post @ https://sks.to/at-a-glance
Could someone clear up another little issue for me. I've come across this graph today, which was taken last year from a big literature review in the journal Science. I'm confused by the dip at about 25 million years ago. It seems to show CO2 levels similar to today but temperatures much higher. I don't think I've seen this dip on other graphs.
news.climate.columbia.edu/2023/12/07/a-new-66-million-year-history-of-carbon-dioxide-offers-little-comfort-for-today/
Martin Watson @ 184:
The diagram you post is not radically different from the graphs and data presented in the intermediate tab of the "CO2 was higher in the past" rebuttal. That rebuttal gives a fairly detailed look at CO2 history over longer periods, and discusses many of the other factors that also affect temperature at geologic time scales.
From a brief point of view, many other factors would have been different at the time you ask about (25 million years ago), so one would expect that temperatures would not exactly match those of today.
I suggest that you look over that rebuttal for possible answers, and then continue the discussion on that thread.
Martin Watson @ 184,
As you say, the graphic appears in a Science article CenCO2PIP Consortium (2023) 'Toward a Cenozoic history of atmospheric CO2', although more correctly it was in the 'commentary' of the paper and it also then sported a scale for the GMST (which in my eyes isn't so helpful).
The paper itself does provide a more conventional graphic (Fig2) which does show 20-odd Mya CO2 levels of perhaps 300ppm and GMST of some +3ºC above pre-indusrial.
While CO2 is the major control knob of Earth's GMST, other factors can make a big difference. The closure of the Panama Isthmus certainly is one of these 'other factors'. The timing is not so well defined (with some even suggesting a date as ancient as 23Mya, this a seriously controversial suggestion), and the changes at work in the climate system which resulted are far from straightforward. The conventional version is that the inital result of the closure was a warmer Earth but that kicked-off the Norhern glaciations which tipped the Earth into a colder phase leading to the recent ice-age cycles (as per for instance Bartoli et al (2005) 'Final closure of Panama and the onset of northern hemisphere glaciation'.)
Bob Loblaw and MA Rodger
Thank you both for your replies. I will follow up on those suggestions.