


 Arguments


Recent Comments
Prev 102 103 104 105 106 107 108 109 110 111 112 113 114 115 116 117 Next
Comments 5451 to 5500:
-
MA Rodger at 15:41 PM on 10 May 20212021 SkS Weekly Climate Change & Global Warming News Roundup #19
nigelj @5,
If you believe Koonin, in his recent NY Post OP he tells us he was fully-signed-up to the science of AGW until he took part in the 2014 APS Climate Change Review Workshop which he chaired. The APS found nothing in this workshop to change its stance on AGW which pitted the science against the grand theorising of John-boy Christy, Judy Curry & Dicky Lindzen, a falsely-balanced debate that had been exposed as nonsense for decades. So why Koonin was so strongly convinced by the denialist arguments, indeed his role in setting up the event (he has been advocatng the use of such a process ever since), does need more explanation from Koonin, explanation which is simply absent.
His work with BP back in the 2000s involved biofuels which do present a problem with high land-use but it would be a fool who took a decade to spot that truth and, then without pause jump to the view expressed in his Sept 2014 OP. While the usual take-away from this Sept 2014 OP is his denial of the science, it is actually a call to resolve the divide (the unresolvable divide) between AGW "belief" and AGW "hoax", to resolve through re-directing scientific effort, as this resolution "should be among the top priorities for climate research." But I neither see any emphasis being made by Koonin in 2014 that the cure (a zero carbon economy) would be a worse outcome that AGW. Nor do I see any emphasis by Koonin in 2021 any message calling to re-direct the scientific effort. The only sign of his continued holding of this view is his involvement in the RedTeam/BlueTeam initiatives, not the most scientific methods of tackling science.
A year later as the Paris climate talks draw near, Koonin is advocating AGW adaptation because mitigation cannot be achieved in time, a new slant on things again.
Now his 2021 OP (and presumaby his grand book) he brands talk of a climate emergency and the policies to address it as being fallacy, basing this on some very silly denialist nonsense.
So Koonin presents a wibbly-wobbly argument against AGW science. And if anybody sees in this reason not to brand Koonin a nought but a vaccuous blowhard, I'd be interested to hear that reason.
-
nigelj at 13:19 PM on 10 May 20212021 SkS Weekly Climate Change & Global Warming News Roundup #19
I read somewhere that Steve Koonin is worried that renewable energy will be allegedly too expensive and will hurt poor people. I wonder if this is why hes a luke warmer. There appears to be a small but genuine group of left / liberal leaning people like that. If so, he should check the numbers. Solar and wind power have plumetted in cost in the last 20 years, and are are now very cost effective (Lazard energy analysis).
He did work at British Petroleum about 20 years ago (according to his wikipedia entry) , and this was developing renewables. He may have lost track on the more recent trends in renewables. Of course he might have other motives for his luke warmerism. The motives of these people intrigue me. I get a bit obsessive about it.
-
Jim Hunt at 07:01 AM on 10 May 20212021 SkS Weekly Climate Change & Global Warming News Roundup #19
Bob @3 - Thanks for mentioning the work of my Arctic alter ego.
dmyerson @1 - I have a copy of the Kindle version of Dr. Koonin's new book. Here's a brief extract from my initial review at Great White Con:
I was compelled to acquire my own review copy, and have just purchased the electronic version. I eagerly searched the virtual weighty tome for the term “Arctic sea ice”, and you may well be wondering what I discovered?Nothing. Nada. Zilch. ничего такого. Nic.
What more would you like to know? -
Bob Loblaw at 06:49 AM on 10 May 20212021 SkS Weekly Climate Change & Global Warming News Roundup #19
I have not read Koonin's book,. but I am aware of some that have. Seems to be the same old misinformation he usually peddles.
A recent post over at And Then There's Physics talks about it briefly with links to previous criticisms of his work.
https://andthentheresphysics.wordpress.com/2021/04/18/did-a-physicist-become-a-climate-truth-teller/
A couple of posts from an Arctic perspective:
https://greatwhitecon.info/2021/04/allegedly-unsettled-science-by-steven-koonin-et-al/
https://greatwhitecon.info/2021/05/steve-koonins-unsettled-arctic-science
...and general background on Steve Koonin
-
ubrew12 at 05:19 AM on 10 May 20212021 SkS Weekly Climate Change & Global Warming News Roundup #19
Tenth item from the top: "Dissecting ‘Unsettled,’ a Skeptical Physicist’s Book About Climate Science"
-
michael sweet at 04:57 AM on 10 May 2021Is Nuclear Energy the Answer?
John ONeill:
A free copy of the Sovacoll article concerning brds is here. From the abstract:
"The study estimates that wind farms and nuclear power stations are responsible each for between 0.3 and 0.4 fatalities per gigawatt-hour (GWh) of electricity while fossil-fueled power stations are responsible for about 5.2 fatalities per GWh. While this paper should be respected as a preliminary assessment ..."
Your claim that Sovacool "claimed that nuclear power was responsible for three times as many bird deaths per watt hour delivered as wind turbines." is false. Your description of Sovacool's work is so far from reality it is a waste of my time to address the facts. Sovacool describes his study as preliminary. He notes that all sources of energy are bad for birds.
You present material that is completely false. Keep in mind that your comments can be checked for accuracy.
-
dmyerson at 04:05 AM on 10 May 20212021 SkS Weekly Climate Change & Global Warming News Roundup #19
Would be good to get a book review of the recent Koonin book, Unsettled.
-
michael sweet at 22:51 PM on 9 May 2021Is Nuclear Energy the Answer?
John ONeill:
Here is a free copy of the Sovacool paper apparently my previous link is broken. It took me 15 seconds to find. If you read the literature you would be able to do this yourself. You are welcome to think anything you want. The peer reviewed literature contradicts you. You are sloganeering.
"If we really try to build out wind and solar there will be a substantial decrease in carbon emissions in a short period of time.' That's something I haven't seen, though I rather obsessively scan www.electricitymap.org/zone/JP-KY?wind=false&solar=false for examples of it." italiced is a quiote of me
I provided Uruguay as an example of reduction of carbon emissions from renewable energy. I found this clear example in less than 5 minutes on your reference. This proves that you do not "obsessively scan" for examples. You are simply trolling us.
At 236 you claimed "The BN600 and BN800 in Russia seem to be operating without any leaks or fires" I showed that the BN600 has had at least 14 fires. You are trolling us again.
At 238 you stated:
"'These reactors cost even more to build than normal reactors. They will never be economic. No more are planned worldwide.' - Apart from the one Gates' company is developing, there's one being built in India, and one in China." Italics is you quoting me.
The reactors you cite in 245 are a completely different design and are new, experimental builds financed entirely by the government. They are liquid sodium reactors, but are a different design. As one design fails, nuclear supporters give it a new hat and claim it will finally work. Your current claim that they are the same is false. Construction of the Indian reactor begun in 2007 for completion in 2012. Now due in 2022. Every year they extend the operational date another year. Typical nuclear build.
More renewable energy was installed last year than all other power systems combined.
"IRENA’s annual Renewable Capacity Statistics 2021 shows that renewable energy’s share of all new generating capacity rose considerably for the second year in a row. More than 80 per cent of all new electricity capacity added last year was renewable, with solar and wind accounting for 91 per cent of new renewables." source
At 245 you say:
"Exponential growth [of renewable energy] is easy enough from a small base"
In 2021 wind and solar power generated will surpass nuclear power worldwide. Nuclear currently has a smaller base to ridicule than renewable energy, after 60 years of operation. Nuclear generated less power in 2020 than in 2004. They are not buiding enough nuclear power worldwide to replace retiring reactors. You are trolling us again.
Moderator Response:[BL] Although countering repeated claims can be frustrating, please keep it civil.
-
John ONeill at 18:04 PM on 9 May 2021Is Nuclear Energy the Answer?
michael sweet at 242
'Sovacool is a peer reviewed scientific study.'The paper you linked is behind a pay wall, but examples I have given show emissions from electricity generation, at least, are considerably lower in some nuclear-reliant countries than in comparable countries without it. For example, from 2000 to 2019, Germany's electricity generation from fossil fuels went down by 29%, France's ( to 2020) by only 1% ( from 'Our World in Data'). Nevertheless, in absolute terms, Germany was still getting 248 TWh from fossil fuels to France's 50 TWh. The difference in emissions would be even greater, since so much of Germany's power is from lignite, and even their 'renewable' thermal generation has a fairly hefty carbon footprint. The UK, which, unlike Germany, chose to close its coal plants instead of its nuclear ones, saw power from fossils fall by 49% over the same period. In 2020 the UK generated 5 TWh from coal, France 4 TWh, and Germany 134 TWh. (Denmark also made 4 TWh from coal, but it only has a twelfth the population of France or the UK.)
https://ourworldindata.org/fossil-fuels
My scepticism of Ben Sovacool's work stems from a paper he wrote, also peer reviewed, which claimed that nuclear power was responsible for three times as many bird deaths per watt hour delivered as wind turbines. This was based on a single incident of geese hitting cooling towers at a coal plant, and another isolated case of waterfowl dying in a copper mine waste pond. ( His estimates of lifecycle CO2 emissions from nuclear, in another paper, are rather higher than the IPCC's, but not as outrageous as some of the other authors he considers. )
'Uruguay produced 40% of its electricity from wind in 2020 while Sweden produced only 30% of its electricity from nuclear power. If you claim Sweden as a nuclear success than Uruguay has to be a wind success.' I would say that Uruguay is a wind success, but the circumstances allowing that are limited. The world currently gets 86% of its energy from coal, oil and gas, and has done for the last forty years. Wind backed by hydro will not replace that - the gaps in wind power would simply be far greater than hydro could fill. I can't show you a grid running on SMRs yet, but likewise you can't show me one with significant battery storage.
'I provided proof of at least 14 fires at the BN600 plant. Your claim of no fires was false.' I didn't claim they had not had any fires, I said they weren't having any currently. The last leak at the BN600 was in May 1994. https://www.gen-4.org/gif/upload/docs/application/pdf/2019-01/gifiv_webinar_pakhomov_19_dec_2018_final.pdf
'The World Nuclear Organization does not show any of these reactors under construction. Please provide evidence to support your claim that two are under construction.'
'The CFR-600 is a sodium-cooled pool-type fast-neutron nuclear reactor under construction in Xiapu County, Fujian province, China, on Changbiao Island...Construction of the reactor started in late 2017...A larger commercial-scale reactor, the CFR-1000, is also planned...On the same site, the building of a second 600 MW fast reactor CFR-600 was started in December 2020 and four 1000 MW CAP1000 are proposed.'
https://en.wikipedia.org/wiki/CFR-600
The Indian Prototype Fast Breeder Reactor, also sodium-cooled, is scheduled to go critical in October 2022 - though it's been delayed multiple times before. It's intended to close the fuel cycle from India's heavy water reactors, and allow the use of thorium, which India has very large reserves of.
'Worldwide installation of renewable energy is increasing exponentially. Your cherry picking a handful of countries that are not increasing wind or solar this year is simply an attempt to distract which will not work. Any cursory look at data shows that installation of renewable energy is increasing rapidly while nuclear plants are not being started up.'
Exponential growth is easy enough from a small base, but in the real world, it will eventually hit natural limits. In nearly every case, growth in solar has started falling, i.e. it's no longer exponential, when solar provides between five and ten percent of total generation. Wind has double the capacity factor, doesn't regularly drop to zero, and is usually less seasonal. Where there's plenty of hydro as backup, it does, in a few areas, help lower emissions to levels approaching those of a nuclear + hydro grid. In places like Texas or California, where it's backed by gas, average emissions stay higher. Since replacing current power fossil generators is only a small first step - we also need to provide clean power for much of the third world, and we've hardly started on industry and transport - it would be ill judged to rule out the world's second largest combustion-free energy source ( after hydro.) Nuclear can be installed as a plug-in replacement for coal plants, a role unsuited to power sources which spend much of the time powerless.
Moderator Response:[BL] Please make note of the fact that you are repeating claims and not addressing points made by others.
I suggest that you re-read the Comments Policy, taking particular note of the sections on excessive repetition and sloganeering:
- Comments should avoid excessive repetition. Discussions which circle back on themselves and involve endless repetition of points already discussed do not help clarify relevant points. They are merely tiresome to participants and a barrier to readers. If moderators believe you are being excessively repetitive, they will advise you as such, and any further repetition will be treated as being off topic.
- No sloganeering. Comments consisting of simple assertion of a myth already debunked by one of the main articles, and which contain no relevant counter argument or evidence from the peer reviewed literature constitutes trolling rather than genuine discussion. As such they will be deleted. If you think our debunking of one of those myths is in error, you are welcome to discuss that on the relevant thread, provided you give substantial reasons for believing the debunking is in error. It is asked that you do not clutter up threads by responding to comments that consist just of slogans.
-
Bob Loblaw at 23:30 PM on 8 May 2021Is Nuclear Energy the Answer?
I case people missed it buried in the text from MA and michael, the web site Our World In Data has quite a bit more than just nuclear data. The main web site is:
-
michael sweet at 22:23 PM on 8 May 2021Is Nuclear Energy the Answer?
Hey MA Rodger:
Your link to Our World in Data is a great site. I have been having trouble finding energy data updated to 2020 and they have everything! It is easy to search. Thanks for the link.
-
michael sweet at 22:09 PM on 8 May 2021Is Nuclear Energy the Answer?
John Oneill at 238:
Sovacool is a peer reviewed scientific study. You are attempting to substitute your personal opinion unsupported by any data or analysis at all. This is a scientific site. You must provide peer reviewed data to support your wild claims. You are simply sloganeering.
Uruguay produced 40% of its electricity from wind in 2020 while Sweden produced only 30% of its electricity from nuclear power. If you claim Sweden as a nuclear success than Uruguay has to be a wind success. (Our world in data linked below). Both have high hydro.
Nuclear electricity generation is (2020 TWh, 2000 TWh) World 2,616, 2498, France 355, 414 Canada 95, 69 and Sweden 50, 57 TWh our world in data Generation of electricity from wind is (2020 TWh,2000 TWh) World 1590, 31, France 39,0.04, Canada 34, 0.16, Sweden 27, 0.46, US 336, 6, Uruguay 5.5, 0, Denmark 16, 4. IBID
This data shows that worldwide nuclear is reducing or flat and everywhere is building out wind. Solar is much the same. Sweden and France are slowly shutting nuclear plants as renewable energy comes online. That allows them to progressively reduce carbon emissions while switching to renewable energy.
Talk to me about small modular reactors when they have a working pilot plant. That will be in 2029 at the earliest. Utilities are backing out of the NuScale project because of cost. Safety questions remain.
At 236 you said:
"The BN600 and BN800 in Russia seem to be operating without any leaks or fires - unlike some of the new grid storage battery plants,"
I provided proof of at least 14 fires at the BN600 plant. Your claim of no fires was false. I have to Google everything you say. They have to build expensive, duplicate cooling systems so that they can repair the fire damage without shutting down the entire plant. It is uneconomic to build duplicate cooling systems. The World Nuclear Organization does not show any of these reactors under construction. Please provide evidence to support your claim that two are under construction.
Worldwide installation of renewable energy is increasing exponentially. Your cherry picking a handful of countries that are not increasing wind or solar this year is simply an attempt to distract which will not work. Any cursory look at data shows that installation of renewable energy is increasing rapidly while nuclear plants are not being started up.
-
Evan at 21:49 PM on 8 May 2021SkS Analogy 22 - Energy SeaSaw
Whatever the technical merits of what you're saying OPOF (I'm not disagreeing with anything you're saying), it has to be personal for people to feel it enough to move them to action. The problem with going back to 1880 is that we cover a period where other signals were on the same order of magnitude or larger than the warming signal. Although industrial output cranked up after WWII, the warming signal was still muddled by other signals. But ince about 1970 the warming signal has emerged from the noise. It is also convenient that 1970 is within the consciosness of many people alive, so this is not a matter of history but of personal experience. Many people feel a difference in winters now than during their childhood (1970's or earlier). Can you tell how old I am? :-)
For me one of the most striking statistics is this. During the last deglaciation cycle CO2 rose 100 ppm in 10,000 years. CO2 has risen that much in my lifetime!
Perhaps the largest benefit of going back to1880 with the temperature record is to show how strong the variability was compared to the underlying warming signal prior to 1970, and by comparison, how strong the warming signal is now compared to the variability.
-
garyjenkins at 19:11 PM on 8 May 2021Welcome to Skeptical Science
M A Rodger @90
Very helpful, thank you. I'll use your numbers in the thing I'm writing. And I've just found a paper that agrees with what you say.
https://agupubs.onlinelibrary.wiley.com/doi/full/10.1002/2015GL063514
-
John ONeill at 10:28 AM on 8 May 2021Is Nuclear Energy the Answer?
Philippe Chantreau - I was actually looking for another item that Thunberg linked to. The relevance is that nuclear is always contasted with 'renewables'. In theory, at least according to Mark Jacobson's 'Solutions Project' scheme, that would be over 90% wind and solar - for everything. In practice, at present, it also covers the burning of various forms of biofuel and biomass. These are welcomed by some W & S advocates as covering the obvious gaps in energy supply from weather, and also by owners of fossil fuel businesses, who can claim various percentages of emission reduction, by putting corn ethanol in petrol, woodwaste in coal feed, or biodiesel in fossil diesel. The island of Bornholm, for example, cited by Michael Sweet as 100% renewable, uses farm waste for power when the wind drops. The website we both referred to lists biomass as having CO2 emissions of 230 grams per kw/h, versus 45 for solar, 11 for wind, and 12 for nuclear.
We have history for societies running on 100% renewable energy. In Britain in 1700, for example, there were about five million people, there was a desperate shortage of wood, and so eventually coal extraction led to the steam engine and the industrial revolution. Now there are 60 million people on the same islands, with much higher levels of energy use. Even just to cover steel manufacture, there is no way to go back to relying on growing our power, and any effort to do so will decimate remaining natural sanctuaries just as it did 300 years ago.
www.fern.org/fileadmin/uploads/fern/Documents/Up%20in%20Flames.pdf
-
Eclectic at 09:27 AM on 8 May 2021Why scientists shouldn't heed calls to 'stay in our lane'
Jim Hunt @30 : thank you for that. I won't be purchasing a copy of Koonin's book, for I have zero hope that it would contain anything other than Points Refuted A Thousand Times. But I shall be grateful if you can unearth anything at all which will prove me wrong about that.
From the snippets of the book so far received at second hand, it is disappointing that someone of Koonin's education & intelligence could produce such a book. If I were a certain cartoon character, I would describe the book as "dethpicable". ;-)
As mentioned in an earlier comment, Koonin seems (at first glance) to be rather different from the usual nutty denialists and the run-of-the-mill rightwingers who care only for their own short term interests and who have no compassion or charity for their fellow citizens. His mindset puzzles me ~ perhaps we need a psycho-analyst to delve into his early childhood traumas etc etc.
Jim, it would be great if you would provide more insights into Koonin and his book. Interesting - and as expected - the elephantine omissions in his Propaganda Piece. (As a frequent visitor to WUWT, it is very noticeable to me that the question of summer minimum sea ice volume is unmentionable there. Among various other perpetual omissions.)
-
One Planet Only Forever at 09:16 AM on 8 May 2021SkS Analogy 22 - Energy SeaSaw
Evan and Bob,
We appear to be discussing the same things from different perspectives.
I appreciate that using the term Trend for the impression a person would get from seeing the red-line presentation of the moving-average is not “Technically the Trend”. My perspective is that many people will accept a Trend like a Fashion Trend, something that they can see changing, more readily than the result of a statistical analysis of data.The SkS Temperature Trend Calculator presents what is being discussed: Trend, Moving Average, and the See-Saw.
Images from the SkS Temperature Trend Calculator would help explain my perspective. But I am not skilled at “image” inserting, so I will try to present it with words.
The difference between the Statistical Trend and a 360-month moving average can be seen when looking at the full set of surface temperature data from 1880 to 2021. The Statistical Trend for the full data set does not show what is happening as well as the moving average. The moving average line shows that the recent temperature Trend is steeper than the Statistical Trend of the full data set.
And the See-Saw effect can be seen by using a shorter moving average like 60 months. So the use of a longer moving average with the full data set provides a visual impression of what is happening that is better than the statistical Trend calculations that are the “Scientifically more precise” way to determine if there is a Trend in the Data. And that presentation does not require the further manipulation of data, and related questions about how it is done, to "attempt to remove variables that create the See-Saw effect".
-
Jim Hunt at 02:11 AM on 8 May 2021Why scientists shouldn't heed calls to 'stay in our lane'
Eclectic @28 - Having purchased my very own copy of Dr. Koonin's tome I have now personally, if rather hastily thus far, reviewed it:
https://GreatWhiteCon.info/2021/05/steve-koonins-unsettled-arctic-science/We eagerly searched the virtual weighty tome for the term “Arctic sea ice”, and you may well be wondering what we discovered?
Nothing. Nada. Zilch. ничего такого. Nic.
Evidently there are some areas of climate science that Dr. Koonin tells his eager readers nothing whatsoever about. It seems likely that he is also well aware that Arctic sea ice is the canary in the climate coal mine, which is why he has chosen to make no mention of it in his magnum opus.
-
Philippe Chantreau at 23:29 PM on 7 May 2021Is Nuclear Energy the Answer?
John O'Neill,
The Guardian article you cited is about Sweden's forestry practices and has nothing at all to do with its energy generation, or policies. It does not support any part of your argument. The "article" (mostly a succession of pictures with captions) mentions the country's export of paper, pulp and sawn timber, it does not allude to energy policy or energy from biomass at any point. It does make a good point that the forestry practices are less than ideal. Similar practices exist in the US and Canada, unfortunately.
-
MA Rodger at 23:22 PM on 7 May 2021Is Nuclear Energy the Answer?
Quoted @237 & 238 - "After 60 years nuclear generates less than 5% of world energy." The 2019 nuclear contribution to world primary power was 4.3% according to the BP Review but OurWorldInData shows nuclear did manage 6.5% back in the 1990s, so after 30 years. Since that time nuclear has failed to keep up with demand, with output stalling at 2,600TWh/yr since 2005. Given the need for carbon-free energy, the failure of nuclear to deliver can have no excuses.
Meanwhile OurWorldInData shows the renewable contribution continues to grow, with solar & wind reaching 2,400TWh/yr in 2020, an increase of 14% on 2019.
-
John ONeill at 21:24 PM on 7 May 2021Is Nuclear Energy the Answer?
'Countries that build nuclear as a group do not reduce carbon emissions. Countries that build out renewables do.'
By restricting his study to emissions reductions over the last 25 years, Sovacool omits the period when nuclear build massively replaced oil and coal power generation. The legacy plants left over from this period are still making far more power than wind and solar, and most of them are light water reactors, which have been licensed to eighty years in the US, and should be in most other places too.
'.. looking at Uruguay 100% renewable mostly wind.
North east Brazil 95% renewable, mostly wind. And
Bornholm, Denmark 100% renewable, no hydro'
Uruguay gets 60% of its power from hydro. It also resembles Denmark, in being a small country in between two much larger ones, to which it can export its surplus wind, and from which it can import during calm periods. North East Brazil also has quite a lot of hydro, and can import much more from North Brazil when needed. Just now it is getting 43% from wind, the rest from local or North Brazil hydro. I'd also note that it's running at about 10 to 12 GW for a population of 50 million people, well below the level associated with places with a high human development index, and that without replacing fossil fuels for uses like transport and industry. Bornholm has no hydro, but imports up to 95% of its power from Sweden at times, usually mostly hydro and nuclear. ( Sweden has wind turbines too, but when they're not spinning in Bornholm, they're usually not doing much on the mainland either.) Bornholm's power emissions would also be much lower if it wasn't burning so much biomass.
'Sweden closed 2 of their 8 remaining nuclear reactors in the last 18 months..... Hydro will provide more than enough backup when the wind does not blow.
Sweden provides clean power not just for itself, but also for Denmark, Germany, Finland and the formerly Soviet Baltic countries. It's likely that if they close their nukes, these other countries will have to burn more fossils, even if Sweden doesn't. Greta Thunberg recently posted a link to an article describing how much damage biomass harvesting is doing to Sweden's forests. Nuclear is a much less land-hungry, and lower carbon, alternative for power independent of weather conditions.
'France is planning to shutter 14 nuclear plants in the near future (they also closed two last year) and install renewables.' -Macron closed the two reactors at Fessenheim, which had received 2 billion Euros worth of upgrading in the last few years, making them effectively the country's most modern plants. This fulfilled a campaign promise by his predecessor, President Hollande, whose Energy Minister (and former lover), Segolene Royale, had offered to donate them to Elon Musk to turn into Tesla car factories. She also vowed to build a thousand kilometres of solar roadways. Macron has subsequently stated that further reactors will not be closed if the result would be a rise in emissions. It certainly would be.
'Ontario's nuclear plants are old and they are installing wind.' Ontario is refurbishing its heavy water reactors in the Darlington and Bruce plants, and the Canadian government is actively promoting new Small Modular Reactor designs. The province has not tendered for any new wind since 2014.
'I noticed you forgot links to descriptions to the Russian nuclear reactors. According to Wikipedia, the BN600 has had 27 sodium leaks resullting in 14 fires...The BN 600 runs only 70% of the time because of required maintenance.' In its early years, the BN 600 did suffer a number of leaks, but since this was expected, it had been given three independent cooling systems, each capable of 50% of the thermal load, so that any one could be worked on with the reactor still operational. The BN 800 had no leaks. Operational status of the BN 600 over the last six years averaged 85.1 % capacity factor - roughly double a wind plant. https://pris.iaea.org/PRIS/CountryStatistics/ReactorDetails.aspx?current=484
'Both reactors have three complicated triple part cooling systems to isolate the radioactive sodium coolant from water since sodium is flammable in water.' Bill Gates' sodium reactor directly heats nitrate salts, for energy storage.
'These reactors cost even more to build than normal reactors. They will never be economic. No more are planned worldwide.' - Apart from the one Gates' company is developing, there's one being built in India, and one in China. Nasa is also working on a similar design for use in space, and a company called Oklo has just received the first US licence for a non-light water SMR. Two other designs are under licence review in Canada. With no water adjacent to the hot fuel, they should be able to run much hotter than LWRs, greatly increasing thermal efficiency, while avoiding any danger of a steam explosion, and thus most of the cost of containment.
'After 60 years nuclear generates less than 5% of world energy.' -In 2019, wind made up 2.2%, and solar 1.1%.
'In 2020 more than 80% of new electrical capacity added world wide was renewable. ' -Since wind and solar have the second lowest and the lowest capacity factors of any generation source, their contribution to world energy was much lower, proportionally, than their increased nameplate capacity.
'In the future renewables will dominate all new construction.' In places such as Italy and Spain, solar installations boomed till they reached between five and ten percent of total power generation, by which time the costs, and the stresses to reliable power supply, led to a dramatic decline in growth. Japan's solar installations peaked in 2015, at which point they were generating 3.5% of the country's power ( Wikipedia ). Since then, yearly additions have been gradually declining, even though prices are still falling. In 2019, solar made 7.6% of electricity generated there, still far below the third from nuclear pre-Fukushima. Most of the shortfall since then has been from increased coal and gas imports. Japan has also recently suffered massive power spikes in winter, as LNG availability fell during cold spells. The government wants to reopen more reactors to reduce power costs. It would also reduce emissions - a win-win.
-
Evan at 19:05 PM on 7 May 2021SkS Analogy 22 - Energy SeaSaw
scaddenp@12 You make a valid point, and perhaps we should plot ocean temperatures together with air temperatures to emphasize their link and that they are driving each other upwards.
michael sweet@13, thanks for your comments. It's good to get affirmation of what is and is not connecting with readers (e.g., concept of decadal averages). The point of these analogies is certainly not to educate the experts (which I am not), but rather to communicate what the experts know to non-technical people.
I appreciate the time all of the experts have given to adding their comments here. Thanks.
-
michael sweet at 13:33 PM on 7 May 2021SkS Analogy 22 - Energy SeaSaw
Evan:
I thought your post has an interesting perspective. I don't have anything to add there.
I think one additional reason that ten year averages are used is because of the Sun's cycle. The Sun gets stronger for a while and then gets dimmer. This pattern is clearly seen in the temperature record. Most of the highest temperatures are at the height of the Sun cycle. The average Sun cycle is about 11 years. That means that a 10 year average removes most of the Sun cycle effect.
I think your point that 10 years is meaningful to the person on the street is a good one also.
-
scaddenp at 11:29 AM on 7 May 2021SkS Analogy 22 - Energy SeaSaw
In the Argo age, you could argue that OHC www.ncei.noaa.gov/access/global-ocean-heat-content/ is both a less noisy dataset (and so significance of trends is established over shorter time frames), and a better indicator of climate.
-
Evan at 06:34 AM on 7 May 2021SkS Analogy 22 - Energy SeaSaw
Bob@10
"Dana did a post here about results of an analysis by John Nielsen-Gammon, which plotted independent lines for El Nino, neutral, and La Nina years."
We did something similar with our Christmas Dinner analogy where we plotted a trend line through annual temperatures and a trend line through decadal maximum temperatures.

-
Bob Loblaw at 05:32 AM on 7 May 2021SkS Analogy 22 - Energy SeaSaw
Running means represent smoothing, but they are highly auto-correlated and normal significance testing cannot be used.
Decadal averages do provide a clear step-by-step indication that things are warming.
Another convenient tool is looking at the list of warmest years - so many of the top 10/15/20 years are the recent ones.
One last link to an interesting analysis to remove some of the variation: Dana did a post here about results of an analysis by John Nielsen-Gammon, which plotted independent lines for El Nino, neutral, and La Nina years.
https://skepticalscience.com/john-nielsen-gammon-commentson-on-continued-global-warming.html
The key graphic:

-
Evan at 05:08 AM on 7 May 2021SkS Analogy 22 - Energy SeaSaw
OPOF@7 and Bob@8
I am not suggesting that we need to wait until 2030/2031 to assess current trends. Just that it seems that talking about decadal averages is more intuitive for non-technical people than refering to moving averages. That may change now in the age of Covid, because we are hearing more and more about 7-day moving averages, for obvious reasons. If moving averages move into and stay in the modern lexicon, I will consider using them. But decadal averages seems like a concept that is easy to understand, and accurate: for about 50 years each decade has been warmer than the previous, and with CO2 accumulation in the atmosphere continuing its 60-year, upward acceleration, there is no idication this trend is going to stop anytime soon.
I appreciate all of the references that you are suggesting and will consider additional modifications to my messaging.
-
Bob Loblaw at 04:38 AM on 7 May 2021SkS Analogy 22 - Energy SeaSaw
Evan:
"Is the record long enough?" is a characteristic of the data, not so much the method. A rule of thumb for global surface air temperature is that you need to have somewhere around 15-20 years of data to determine a trend - but that is deterimed from the noise characteristics of surface air temperature. It is not generally applicable to other data sets.
In addition to statistical significance, you also need to look at the power of the test. For a small trend, you need more data than for a large trend. With low power, a non-significant result may just be a lack of data, whereas if you have high power, no significant result is more likely to mean no relationship. Dikran Marsupial did a good post on this four years ago:
https://skepticalscience.com/statisticalsignificance.html
In addition to this, we are no longer in a position where the significance of our temperature trend is in question. We are clearly in a warming trend. When we encounter someone claiming "the warming has stopped!" or "No warming since 1998 2006 2010" (or whatever year they pick), asking if the trend is significantly different from zero is the wrong statistical test.
A statistical test involves evaluating the significance of the difference between "observed" and "expected". When testing if the trend is non-zero, the "expected" is zero. When testing if the existing trend has stopped, the "expected" value is the previous trend, not zero. So that is the comparison you need to make when determining something like a t-statistic.
So, to try to directly answer your question, any 10-year period should be looked at in the context of what preceded it. For the "warming stopped in..." argument, the easiest statement to make would be to say "the last 10 years shows the trend continuing".
The Foster and Rahmstorf paper that KR mentions is very good. Foster is the person that writes https://tamino.wordpress.com/, where you will find lots of excellent posts on statistics and climate (He's been on hiatus for while now, but the archives are a treasure-trove of good stuff.)
The approach taken in the Foster and Rahmstorf paper is to quantify known sources of variation and remove them from the data, leaving the long-term trend showing clearly. If you leave that variation in, it is treated as unidentified noise in a regression, which makes the trend harder to see. (It would be wrong to reduce the noise by averaging - that just deceives the regression test. You need to be able to independently say "yes this causes variation and I know how much".)
...and we always can make use of the SkS Escalator image:

-
One Planet Only Forever at 04:15 AM on 7 May 2021SkS Analogy 22 - Energy SeaSaw
Evan,
I am not a climate science specialist, but as an experienced engineer I have experience in evaluating data to see what is important, and to see through misleading claims (Technical Sales Reps often struggle to answer the questions that good engineers will ask them about technical claims they make to promote their product).
Do not lose sight of the point I make in my comment @1 "... a 10 year moving average, or longer, ..."
When the data is evaluated using a tool like the SkS Temperature Trend Calculator, all of the data should be looked at, starting in 1880 for the surface temperature data sets (called Global and Non-global) and 1979 for the Satellite data sets). Note that manipulations of satellite data do not represent the "Surface Temperature" (They are manipulations of data to represent the averages of temperatures within a thickness of atmosphere, so they are not "surface temperatures").
What is important to avoid is making a statement that could be interpreted to mean that "the Complete Next Decade of data" must be waited for to see if the new "10 year average data point" is warmer or not. The rolling average updated each month gives an indication of the trend, and the longer the rolling average is the less noise there is in the trend line (without needing to remove the variable influences like ENSO).
The National Climate Normal values in Canada are updated every 10 years using the most recent 30 years of data. So from that perspective a 30 year rolling average is better. And this can be seen by comparing the trend line of the 10 year rolling average to the trend line of the 30 year rolling average. However, because the satellite data set only starts in 1978, a 20 year rolling average shows the trend better than the 30 year rolling average, especially 10 years ago when the data set was only about 40 years.
-
MA Rodger at 23:36 PM on 6 May 2021Welcome to Skeptical Science
garyjenkins @89,
Your 'kettle' question would be quite straightforward but for two complications which to overcome require assumptions to be made.(1) The means of boiling this kettle can be more-or-less carbon intense. Thus that jolly swagman of song may be boiling his billie over a fire made of driftwood from the billabong and thus be seen as carbon-neutral. Or perhaps there is coal lying about nearby which the swagman could use which would lead to a particularly carbon-intense outcome.
In the past I considered a similar question to the one you pose and, assuming the kettle was powered by UK electricity, I found the accumulating AGW energy would equal the FF energy in roughly a year. The energy-mix of the electricity generation wold impact this result, gas requiring 18 months for the AGW to equal the kettle's electric, coal requiring just 9 months.
(2) Also, and more difficult, there is the need to account for the level of atmospheric CO2 and how long it "hangs around," or indeed when in time this kettle is being boiled as CO2 forcing is logarithmic not linear so the result will alter with differeing atmospheric ppm CO2. And a final consideration - are AGW forcings accounted with-or-without feedbacks? Perhaps that is a consideratio too far.The SKS graphic below (from this SKS post) is useful in setting the scene for your kettle question. (The 2005 AGW forcing given appears to be actually the CO2 forcing which for 2005 is 1.6Wm^-2 according to the Global Carbon Project.) The values in the graphic give a ratio AGW Forcing-to-Energy Production of roughly 50:1, pretty-much identical to the ratio of 2005 CO2 emissions to accumulative total emissions provided by the GCP data.
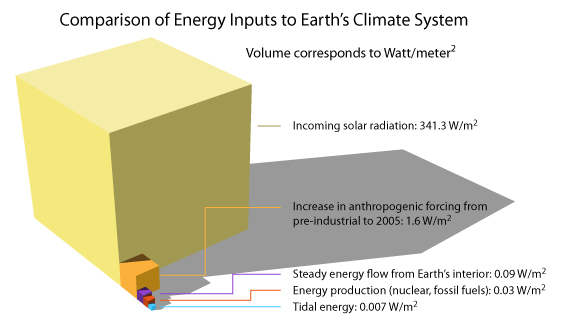
This then sort-of supports the one-kettle-per-year result.However, with CO2 being slowly drawn down out of the atmosphere following its emission, perhaps the ratio of 2005 CO2 emissions to accumulated-by-2005 atmospheric burden should be used, this roughly halving the ratio. Thus immediately following emission of the CO2, the rate woud be perhaps two-kettle-per-year.
I note you say "CO2 hangs around in the atmosphere for 30-50 years" but it hangs round longer than that. Rougly, 30-50 years is how long it takes half of it to be drawn down. After 100 years perhaps 33% remains, 1,000 years perhaps 20% and it is tens-of-thousands of years before it is benothinged. And integrated over that full period, the accumulative count of AGW in kettles would be rather large (perhaps 100 kettles in 100 years, 300 in 1,000, maybe above 5,000 kettles before it is all gone) but the rate of kettles-per-year becomes smaller and smaller and the resulting global warming will thus diminish. -
Evan at 23:30 PM on 6 May 2021SkS Analogy 22 - Energy SeaSaw
Thanks for the clarifications Bob.
So my question to you and KR is this. Is there any reason to direct people to observe a temperature record longer than 10 years, or are we on sufficiently solid ground directing casual readers to consider 10-year atmospheric temperature trends as indicative of what the climate is doing?
-
Bob Loblaw at 23:26 PM on 6 May 2021Why scientists shouldn't heed calls to 'stay in our lane'
alonerock @ 27:
Science does not do "moral obligations". Science attempts to find observable patterns and understanding that allow people to make better predictions.
From a moral standpoint, this allows us to better realize the implications and likely outcomes of our choices - but it does not tell us what the moral choice is.
Right now, the science of climatology is telling us with a high degree of certainty that burning fossil fuels will lead to warming at rates far greater than anything humans have experienced before. The science of biology is telling us that nature will find it very hard to adapt to this rapid change. The science of economics (please don't laugh - let's be generous today) is telling us that as time goes on the economic costs of this rapid warming (and other anthropogenic climate changes) will greatly exceed the costs of avoiding it or minimizing it, and that these costs will be unequal across different parts of society.
What specifically is your moral concern? My morals tell me that I should have concern for my fellow humans, and nature in general. There is no Planet B if we get this badly wrong.
-
Bob Loblaw at 23:03 PM on 6 May 2021SkS Analogy 22 - Energy SeaSaw
Evan:
1988 would have been when Hansen was testifying in front of Congress. A pivotal point - at that time a lot of politicians were much more open to the idea that climate was changing. You may be remembering that testimony, or other statements/papers at the time.
Hansen's testimony and predictions are covered here at Skeptical Science:
https://skepticalscience.com/Hansen-1988-prediction.htm
A little earlier, in 1981, was when a key Hansen et al paper was published in Science:
Climate Impact of Increasing Atmospheric Carbon Dioxide
J. Hansen, D. Johnson, A. Lacis, S. Lebedeff, P. Lee, D. Rind, G. Russell
Science 28 Aug 1981:
Vol. 213, Issue 4511, pp. 957-966
DOI: 10.1126/science.213.4511.957At that time, the paper said "It is shown that the anthropogenic carbon dioxide warming should emerge from the noise level of natural climate variability by the end of the century".
In a paper, authors tend to be a little less assertive about their projections. The late 1980s was also a period of abnormal warmth, so that may have changed the statistics.
-
Eclectic at 23:01 PM on 6 May 2021Why scientists shouldn't heed calls to 'stay in our lane'
Nevertheless, there seems to be an increase in "positive" reviews of Koonin's new book. True, to some extent this is to be expected with any new book. The real test will be the test of time ~ will the book be a Nine-Day Wonder, or a 90-day, or a 900-day?
Ordinarily, for any new book, one might suspect the hand of the publisher is pushing the perceived enthusiasm. But with the Koonin book, one might also suspect the climate-science-denying Establishment is adding its own weight of propaganda. ( I noted that, inter alia , the book's review on WUWT was nauseatingly fawning . . . much as WUWT fawns on Lord Monckton's ludicrous & often self-contradictory emanations. Possibly a consequence of their very slim pickings for such purposes.)
Koonin is certainly running "out of his lane" regarding science. And the question is : Why is he doing such a political Propaganda Piece of half-truths?
Nothing unusual for paid shills to go deceiving the public. And nothing unusual for crackpots, crazies, and rabid right-wingers to try the same. But why is Koonin doing it? Yes, there are a few elderly eminent scientists (you know their names) who have Gone Emeritus for presumable reasons of mild early dementia / religious fundamentalism / loss of inhibition of their underlying Maverick tendencies / and so on.
But Koonin is in his late sixties, and so is rather below the usual age of elderly pre-frontal brain deterioration. Moreover, I recall his work on a subcommittee of the American Physical Society's review of the APS climate change statement. That was seven years ago (2014) and he was even then showing the same sort of eagerness to undermine a reasonable assessment of mainstream climate science & the reasonably-expected consequences of modern global warming.
So, no, I don't understand where his mind is coming from. And I am glad he is a rare case.
-
alonerock at 22:47 PM on 6 May 2021Why scientists shouldn't heed calls to 'stay in our lane'
Can anyone please suggest some past articles regardin why we have a moral obligation as a species to adress climate change? I am interested in writing a paper on this topic and want other points of view. I treid searching with no luck
-
Evan at 22:28 PM on 6 May 2021SkS Analogy 22 - Energy SeaSaw
KR thanks for your comments. Because I am not a climate scientist, but I am a chemical engineer, my role is to understand what the experts are saying and then find ways to communicate that message effectively and accurately to non-technical people. One of my goals is to be as consistent as possible with the messaging I hear from the professionals, which you also appear to be.
Whereas I agree technically with what you're saying, what I heard James Hansen say in 1988 is that the warming signal had emerged from the background noise, which was still present in the early 1970's. I hear you saying that James Hansen was able to make his statements because he knew how to remove from the temperature signal the effect of transients, such as ENSO, PDO, volcanoes, ect. I concede that point, but to the casual observer, what they hear is that the 80's were hotter than the 70's. What we commonly hear now is that since the 1970's each successive decade has been hotter than the previous decade. This is the message that I think resonates with people who are really trying to understand what's happening, and not just endlessly argue the points. Considering that globally averaged atmospheric temperatures are increasing about 0.2C/decade, and that the effect of ENSO is to create a transient with a maximum of about 0.2C over a few years, 10 years seems like a suffiiently long time to provide a degree of technical rigour, yet short enough that people can grasp the immediacy of the problem. I can only assume that this is why we hear reports of the trends of decadal, average temperatures
If I try to present all of the nuances, then the presentation also becomes more difficult to follow. Therefore, whereas I concede the point you're making, materially I think it is accurate and consistent with the messaging from climate scientists that the warming signal is clearly seen if we look at the decadal temperature trends.
-
Jim Hunt at 20:06 PM on 6 May 2021Why scientists shouldn't heed calls to 'stay in our lane'
Thanks Bob and Eclectic!
Getting back towards the topic at hand, as far as I can tell the Guardian article is still the only one in the global MSM mentioning over 400 scientists that have moved out of "their lane" in order, one assumes, to raise awareness of what they refer to as "climate breakdown as an existential crisis for humanity".
Meanwhile WUWT is a mere sideshow to the main event. There are hundreds of articles in media outlets of all shapes and sizes favourably reviewing the latest magnum opus of one Steven E. Koonin, currently peddling his "Unsettled Science" snake oil to hordes of eager buyers.
Fortunately in all the circumstances the Great God Google seems to have noticed our antidote advertisement:
https://GreatWhiteCon.info/2021/04/allegedly-unsettled-science-by-steven-koonin-et-al/#May-06
-
Eclectic at 10:23 AM on 6 May 2021Why scientists shouldn't heed calls to 'stay in our lane'
@24 , You're welcome, Jim Hunt. Your internet efforts are indeed deserving praise.
If the Moderators will allow me this brief OT digression :-
Jim, I did catch a couple of your comments at WUWT. When I went back to read them again, your comment to Willis-E was still standing. But (allowing for my possibly confused memory about threads) your "elsewhere" comment had been zapped by the petulantly wrathful Anthony-W. Either way, your comments were very reasonable (plus a hint of humor) ~ and did not receive a good response.
WUWT is a dreary wasteland of angry extremist & barely-sane people. They are whistling in the dark and are ever hopeful they will eventually be vindicated. It is pleasing to see how their spirits are rather low, after 2020 events . . . yet, however much reality they have to swallow, they will never change their position/positions.
BTW, I note how the good Willis-E's reply went somewhat to the side of the bullseye target. Must say that I like reading Willis posts ~ he has a sense of humor, and he is a clever fellow. Unfortunately his strong emotional bias keeps him firmly in the grip of motivated reasoning. He can analyse a tree, but can't recognize a forest. Gotta love his Thunderstorm Theory of global temperature homeostasis. AFAIK he has never quantified it ~ and like most denizens of WUWT, the concept of TOA is an elephant which does not exist.
. . . . And to Bob Loblaw, thanks for injecting some dry humor. (Not a vaccination, I hope.)
-
Jim Hunt at 07:00 AM on 6 May 2021Why scientists shouldn't heed calls to 'stay in our lane'
You are very kind Eclectic.
Anthony has indeed "outed" me again for the umpteenth time. It wasn't as though I was wearing a heavy disguise! No doubt it was mere coincidence that his scurrilous attack on my character occured shortly after I sent a missive to Willis including a link to some actual Arctic science? Which coincidentally never saw what passes for the light of day at WUWT.
At the risk of drifting off topic, if you're also interested in all things Arctic please see:
https://GreatWhiteCon.info/2021/05/month-in-review-arctic-science-edition/#Timmermans -
garyjenkins at 02:51 AM on 6 May 2021Welcome to Skeptical Science
Hi thanks for the great website and all the work behind it. I just have a simple question, inspired by the 4 Hiroshimas calculation. I'd like to complete the following sentence (or one like it) if possible: "The energy absorbed by the earth as a result of radiative forcing by the CO2 emitted when you boil a kettle of water is X times the energy used by kettle, spread over Y years."
My thought was that this would be easy to work out from the global TPES which seems to be about 6x10^21 J/annum and the forcing rate which seems to be about 8x10^21 J/annum, given that CO2 hangs around in the atmosphere for 30-50 years .... then I realized that I was playing with numbers I don't really know how to handle. I'd be eternally grateful if someone could advise me on the calculation and on whether the result might be easier to imagine than all those Hiroshimas.
-
Bob Loblaw at 01:57 AM on 6 May 2021Why scientists shouldn't heed calls to 'stay in our lane'
As the one that started teasing Jim about Twitter, it was his use of the word "informed" that caught my eye.
If he had said "I heard about it via Twitter..." then my sarcastic humour would not have been twigged... :-)
-
Eclectic at 23:31 PM on 5 May 2021Why scientists shouldn't heed calls to 'stay in our lane'
Jim Hunt @20 :
An amusingly ambiguous comment about the ephemera of Twitter !
And thanks for your good work at Great White Con .
And for your very recent amusing appearances at WUWT , regarding Professor Monckton's continual nonsenses on his "Pauses". I see that the good Anthony Scissorhands has now excised your comments. But, pleasingly, you have a several staunch companions who have not (yet) been banned there. (If it weren't for those few guys, the comments columns would be unmitigated dreck of anger & drivel.)
-
One Planet Only Forever at 23:16 PM on 5 May 2021Why scientists shouldn't heed calls to 'stay in our lane'
Jim Hunt,
Twitter is a lousy source for verified evidence-based information. Mind you so is media that is under the influence of the Propaganda Model of Communication.
As an Engineer I would dread the thought of any engineer considering that technical sounding stuff on Twitter is as valid as any other technical information.
Twitter is great for quickly disseminating fairly inconsequential information like sports scores or other entertainment information. It can be a source of verifiable information that can help build a verified better understanding of what is happening or has happened. But, tragically,it can more easily be abused to mislead and misinform. It, like other social media, is a perfect platform for disinformation because it can keep people from being exposed to the fuller story.
Some politicians have learned to turn politics into simplistic competition that can be won by harmful cheaters, like Sports. And they do it to Pump up Pride among Their Type of People. They can make Politics be like:
- Keeping people from understanding the harm they will do to Win, or how they cheat to Win (keeping people fascinated and engaged by grotesque engrossing distractions and other forms of hiding or masking the Truth - likely results of the Propaganda Model of Communication).
- Trash Talking Professional Wrestling (a tactic of the likes of Trump - Trump wasn't the first of this type and won't be the last)
- Gossip Rag Speculation-based Story-telling using selected bits of information, including made-up bits (also a tactic of the likes of Trump - Their Type are The Pure Best who Fight for their Deserved Glory and are Always Excusable. Others are: Less-worthy, Blame-worthy, Inexcusable - that loops back to the Pro-Wrestling style of Sport - those Trash Talking Gladiators, the Heroes of Their Type of People).
-
Jim Hunt at 21:37 PM on 5 May 2021Why scientists shouldn't heed calls to 'stay in our lane'
However Twitter is perhaps a good place to get the latest news before it's been "filtered" by the oligarch owned "mainstream media"?
-
One Planet Only Forever at 12:10 PM on 4 May 2021Skeptical Science New Research for Week #17, 2021
Oortcloud @1,
I hope this helps you better understand how to be less harmful and mnore helpful regarding CO2.
For the past 2000 years (likely 4000 years), up until the 1800s, the level of CO2 in the atmosphere was pretty steady at about 275 to 285 ppm.
And from the 1800s all the way back to 800,000 years ago the CO2 level varied from 180 ppm to 300 ppm until recently (and it only once reached 300 ppm about 300,000 years ago).
In about 1920 the CO2 level was up to 300 ppm. And by 1940 it was about 310 ppm (higher than any time since 800,000 years ago). And today the level is about 410 ppm and still climbing.
There are many references for this, including on SkS, but I like to refer to source data presentations like the NOAA Global Monitoring Laboratory animation.)
And the main reason for the rapid recent increase in CO2 is the burning of buried ancient hydrocarbons (fossil fuel). No other explanation explains it.
So now that you can understand what is really going on, if you had shared your previous misunderstanding anywhere, hopefully you will go back and correct what you incorrectly believed and shared. And hopefully in the future you will seek better understanding before sharing it, but admittedly everyone can always learn something new to be less harmful and more helpful.
-
Bob Loblaw at 02:01 AM on 4 May 2021Why scientists shouldn't heed calls to 'stay in our lane'
"I am informed via Twitter..."
Now there is a phrase you don't hear very often.... :-)
-
KR at 01:20 AM on 4 May 2021SkS Analogy 22 - Energy SeaSaw
Even a decade may not be enough. There needs to be sufficient time to see a trend appear over fluctuations with scientific significance (to reject the null hypothesis of no warming). That's on the order of 20-30 years given current trends.
Unless you are accounting for cyclical and spike variations like the see-saw so well described above - ENSO, solar cycle, volcanic aerosols, etc. See Foster and Rahmstorf 2011 for an example of that. If you do, significance can be detected in perhaps 10-15 years, although that leaves open quibbling about how those variations were dealt with.
-
Jim Hunt at 17:59 PM on 3 May 2021Why scientists shouldn't heed calls to 'stay in our lane'
I am informed via Twitter that a judge ordered the Guardian/MSN stories to be taken down in order to avoid influencing the jury of the recent "Shell Knew" trial here in the UK:
https://GreatWhiteCon.info/2021/04/stop-attempts-to-criminalise-nonviolent-climate-protest/#May-02
Via Extinction Rebellion:
https://extinctionrebellion.uk/2021/04/23/breaking-the-xr-activists-who-took-on-oil-giant-shell-and-won/
Six Extinction Rebellion activists have been acquitted in a landmark verdict at Southwark Crown Court this afternoon.The jury delivered its not guilty verdict for each defendant, despite Judge Perrins ruling that five of the six had no defence under the law.
The trial, for criminal damage to the Shell HQ building in London’s Waterloo in April 2019, which could have led to a maximum five year prison sentence and/or a £10k fine each, is XR’s second only case to be heard before a jury.
The verdict is being hailed as a major victory for climate campaigners everywhere facing increasing criminalisation.
No doubt the mainstream media across the planet will now plaster the climate scientists' "open letter" and XR's victory in court across their front pages?
-
nigelj at 08:14 AM on 3 May 2021Skeptical Science New Research for Week #17, 2021
Oortcloud @1, what you say is a strawman. Definition of a straw man from Oxford dictionary: "noun, an intentionally misrepresented proposition that is set up because it is easier to defeat than an opponent's real argument." The real argument is too much carbon dioxide in the atmosphere in a short time frame causes a climate change problem, not that we have to get rid of all carbon dioxide.
-
Philippe Chantreau at 00:33 AM on 3 May 2021We're heading into cooling
I am not holding my breath for evidence (been more than 24 hrs already and none surfaced). I am familiar with Potholer, he does have good moments. I got a kick of Real Climate summary of the state of climate bets, especially with the NoTricksZone people. I have challenged people on a couple of occasions for bets on the next decade temp rise and all I got was lame excuses...
Prev 102 103 104 105 106 107 108 109 110 111 112 113 114 115 116 117 Next


