


 Arguments


Recent Comments
Prev 61 62 63 64 65 66 67 68 69 70 71 72 73 74 75 76 Next
Comments 3401 to 3450:
-
Eclectic at 12:55 PM on 6 August 2022CO2 effect is saturated
My apologies, OldHickory @646 and prior ~ but I am having difficulty understanding exactly where you think the climate scientists are wrong about the physics of climate. And it's likely that other readers are sharing my difficulty.
Please explain yourself more clearly. You seem to be ignoring the effect of the atmospheric Lapse Rate, which is so crucial to the mechanism of "greenhouse".
And infra-red photons from the planetary surface can only go a short distance before being absorbed by a CO2 or H2O molecule. Most of those photons would not even reach the rooftop of your house. So in that sense you can say that the lower atmosphere is "saturated" for CO2 , H2O etcetera ~ and it would be "saturated" whether the CO2 level were 200ppm or 400ppm or 800ppm or 1600ppm.
But the concentration level of greenhouse gasses at the bottom of our atmosphere will directly affect the concentration level near the TOA, and the TOA (for each specific gas) is the level where the infra-red is radiated out into space. The lower levels of air have a colossal re-cycling of IR photon energy . . . but what ultimately matters is the temperature of the TOA level. Because that is the level from which our planet loses (to space) the heat energy being gained from the sun. (Here I am disregarding the directly reflected sunlight from Earth's surface; and also the small portion being the IR "window" where IR of that wavelength that can pass directly through the air & clouds).
And the TOA temperature is dependent on the Lapse Rate. Conversely, the Lapse Rate determines the surface temperature, if you care to think about it in that way.
-
OldHickory at 11:56 AM on 6 August 2022CO2 effect is saturated
After reviewing several papers on the topic, I can only conclude that the water vapor feedback loop (from Climate Myth 36) is not possible due to saturation of the CO2 greenhouse effect. As noted in The Irrelevance of Saturation: Why Carbon Dioxide Matters, the saturation length for the (most important) 14.99 micron CO2 absorption line at a partial pressure of 0.0004 atm is about 18 meters. Also, the author dana1981 of the rebuttals for this Is the CO2 effect saturated? forum stated the claim is true that adding more CO2 won't absorb much more IR radiation at the surface.
Now I realize that the bottom layer of the atmosphere (near the surface) will warm the layers above it, but that is irrelevant regarding the water vapor feedback loop. In this case, we are only interested in what warming occurs at altitudes where there is still liquid or solid state H2O available in order to complete the loop.
In general, we can expect that adding more CO2 to the atmosphere will increase the CO2 greenhouse warming, but at altitudes well above that which would result in a CO2 "control knob" or disruptions to the weather or climate. Therefore, atmospheric H2O is in fact the dominant and controlling GHG and Climate Myth 36 actually isn't a myth.
-
David-acct at 11:19 AM on 6 August 2022Skeptical Science New Research for Week #30 2022
The Article "Clean Energy Investments are the Antidote to Inflation" by Rewiring America 7-14-2022 which is included in the above list is a fasinating article on benefits of completely electrifying peoples homes and eliminating all the fossil fuel appliances and heating.
Though there were a few things in the article that caught my eye.
The article mentions that converting to electricity from natural gas will reduce the effect of inflation since 41% of the inflation has occurred since putins invasion of Ukraine. Its been well known in economic areana that the primary driver of inflation is lax monetary policy, so while oil prices have been a major component of the inflation over the last 18-24 months, the lax monetary policy has been the primary driver of inflation.
The article notes that if homeowners would save a approximately $1,000 over a year by converting from gas to electric. Though installing new equipment almost always cuts utility bills simply because new units are more efficient whether it is gas to gas, gas to electric, electric to electric or even electric to gas. The article also omits any mention of the cost of installing new equipment. The typical payback period for new furnace and / or ac or both is 8-12 on the average.
the article frequently mentions that oil prices are more volitale than electric prices though again that omits context. electricity prices will always be less volitale than oil & gas prices since A) the electric utility markets are regulated, b) the fuel sources for electricity is from several sources so there is the natural diversification in costs, c) electric utilities purchase fuel costs using long term contracts therefore their costs are far less effected by daily fluctuations in pricing along with using cash flow hedging to dampen the impact of short term price fluctuations.
The Article also mentions the millions of jobs created by electrifying homes. The article specifically references the study in footnote 16 "mobilizing for zero carbon america" that study estimated the 25 milllion jobs would be created. The US workforce in currently 170million, so even if only have those new jobs were created, that would still be 5%-9% increase in employment, which is totally implausible.
In summary, the article paints a very glossy picture via the omission of data that would provide appropriate context.
-
One Planet Only Forever at 02:41 AM on 6 August 2022Skeptical Science New Research for Week #31 2022
Presentations like “Climate Endgame: Exploring catastrophic climate change scenarios” are what matter most in science.
And the matter is more than "Given our circumstances and the wellspring of advice at hand, we'd be stupid not to pay attention." Not pursuing increased awareness and improved understanding and applying it to limit harm done and help those needing assistance is unethical - immoral.
Ethical Scientists need to maintain a focus on identifying the harm done by developed human activity. The marketplace competition for perceptions of superiority based on popularity and profit has proven to be uninterested in identifying and limiting harm done.
In the 2022 book “What Climate Justice Means and Why We Should Care” Elizabeth Cripps provides a well-reasoned moral/ethical understanding built on the thoughtful work of many others.
The bottom line understanding undeniably includes:
- the impacts of everyone’s thoughts and resulting actions add up to become the future reality.
- it is catastrophic for anyone to choose to act in ways that are unnecessarily harmful
- it is sad and harmful when a person chooses to be less helpful than they could be
The question of ‘unnecessary harm’ leads to understanding that only people living less than a basic decent life can be excused for acting harmfully in pursuit of a basic decent life. But the actions taken to achieve a basic decent life need to be as harmless as possible. Others who are living ‘better than basic decent lives’ at least owe assistance that they can easily provide to help those living less than basic decent lives sustainably improve their lives. In many cases the least that is owed is ‘to seek out and vote for leaders who would lead effective collective efforts to limit harm done and sustainably improve conditions for those who live less than basic decent lives’.
That ethical understanding makes it plain that people living more than basic decent lives are only pursuing ‘wants’, not ‘needs’. Pursuit of improved circumstances above a basic decent life ‘need’ to be essentially harmless because everyone doing a little bit of unnecessary harm can easily add up to a massive amount of harm. And any claim that ‘it is harmful to limit the excess harmful actions of people who are enjoying more than basic decent lives’ is an absurd, but potentially very popular and profitable, argument.
That understanding leads many people to try to deny that there is any harm being done by the harmful actions they developed a liking for. They try to deny there is any harm done by the undeniable increased CO2 due primarily to fossil fuel use. Some try to promote beliefs that there is no relationship between increased CO2 and harmful results of increased global average surface temperature (many of the items on the SkS list of “arguments” are versions of that).
The ability of misleading marketing efforts to tempt people to deny or excuse the unnecessary harmfulness of their chosen ways of enjoying ‘better than basic decent lives’ is potentially the most catastrophic thing that humans have developed. The resulting unsustainable harmful over-developed consumption by supposedly 'more advanced' people is a catastrophe. That portion of humanity 'is the asteroid ruining the future of humanity'.
-
Fixitsan at 23:07 PM on 5 August 2022CO2 is just a trace gas
Ha ho and hee haw...the humour is , well, it just about qualifies as humour
MA Rodger the battery size is irrelvant to all but a pedant. but regardless of that the AAA battery can easily generate huge heat if applied to a low enough resistance where IR will pour forth. I accept there is current limiting in the form of a resistor in series with the led to protect it, but the wavelength quoted of 0.94 microns is not the same wavelength already quoted as being of concern which is 15 microns. (I actually think I used that as a reerence because it was in the wording of one of the links I have been sent by this forum's members, maybe it was even NASA, although that's unimportant now)
So back to the 15 micron wavelength IR , of which there is a lot in every home and factory and yet, the existence of any CO2 based heat trapping device or construction or insulation is completely absent in society.
Am I also correct in assuming there is no repeatable experiment which can be performed in a lab which proves the heat trapping quality of CO2 or is there an absence of such an experiment because CO2 possesses that quality only as a direct consequence of it's lower pressure, at high altitudes ? (But that seems unlikely, no ?)
I guess the question I have is, can it be proven beyond doubt that CO2 traps heat at all ?
Moderator Response:[BL] Skeptical Science is not place to to post random, irrelevant speculation.
Rather than choosing to follow the Comments Policy, Fixitsan has chosen a path that does not include continued posting here.
-
Eclectic at 21:30 PM on 5 August 2022CO2 is just a trace gas
Fixitsan @40 : you have made a fundamental error.
The wit of man is not the wit of a sealion.
Indeed, few sealions are witty. If any. Such is the nature of the beast.
-
MA Rodger at 21:11 PM on 5 August 2022CO2 is just a trace gas
Fixitsan @40,
A TV remote "has no heating component, as far as humans being able to feel" because it operates using just a couple of AAA batteries and, like the rest of the electro-magnetic spectrum, the wavelength used (0.94 microns) does indeed have a "heating component." And if you turn up the power, human beings will feel it.
-
Fixitsan at 18:41 PM on 5 August 2022CO2 is just a trace gas
scaddenp, from taking your advice to look it up (and to double check my existing understanding) 15 micron infrared is 'thermal', or 'far infrared'
CO2 interactions at these wavelengths are considerable, or in other words CO2's energy absorption rate is highest with this far infrared, as opposed to near infrared, which is more like light and has no heating component, as far as humans being able to feel it is concerned (think infrared emitters in remote controls, cold to the touch)
What befuddles, is the fact that nowhere on earth at ground level has the science, the wit of man, or nature made use of this interactive property of CO2 with regards to the huge amounts of far infrared which is in among the built environment. From domestic appliances, to industrial applications, far infrared is abundant on earth's surface
Far infrared is also expensive, and hence why we choose to insulate with great care the manmade applications, generators or soaks of far IR in order to improve the efficiency of the gas, electricity, or solar derived application of IR.
Take a steel furnace for example, heavily insulated, you can imagine the amount of IR which could be lost without insulation. A domestic oven is barely different, and indeed, our homes are heated with far IR and we do our best to trap as much of that heat in as possible in order to keep the heating bills down. We do this with insulation, in the cavities between the external structural walls, in the double glazing, and even triple glazed windows, in the loft space and also under the floor.
Currently, most insulation contributes to heat storage by entrapping air in small volumes in a structural support, such as foams. We use foam boards, foam pellets, liquid expanding foams and so on, filled with air in many cases, in the small bubbles in the foam.
In double glazing we use Argon now, previously we used a vaccuum for example.
But, what we never use, is CO2. Yet, we see CO2 being portrayed as an immensely effective molecule which is purported to trap heat. That's an amazing property for any portable colourless gas to have. It has a lower thermal conductivity than Argon and would be batter in double glazing for that reason alone, and add into the equation the fact that it has an additional benefit over Argon that it traps long wave IR which we need to keep in our homes I am left wondering how it is we simply don't bother.
Argon is 23 times more plentiful in the atmosphere than CO2, perhaps that is reason enough to use it, but it is more expensive too.
Have we not reached the stage of thought yet where we can imagine that using the extremely strongly purported far IR heat trapping effects of CO2 in insulation down here at ground level, or, is there just something about CO2 which means it only traps heat in low pressure environments such as in the upper layers of the atmosphere ?
CO2 traps heat, but the wit of man has so far failed to put such an amazing property to any use on earth. How come ?
Moderator Response:[BL] This is all pointless, irrelevant, and incorrect rambling.
-
Bob Loblaw at 22:01 PM on 4 August 2022CO2 effect is saturated
OldHIckory @ 643:
You have made some very vague, non-specific, non-quantitative statements.
As Eclectic points out, "saturation" can mean many things. You need to explicitly say exactly what you mean by that term, preferably with a mathematical expression.
"Enough CO2" is meaningless. With enough power, you can make a bathtub fly.
"So easy" is also meaningless.
"Would not cause much more warming" is a vague generality. How much is "much"? Bigger than a house? Smaller than a mouse?
People that actually do the math have shown that the global mean surface temperature will continue to warm for increasing amounts of CO2 untl CO2 reaches levels at least several times higher than they are now.
Your last sentence, where you say "more warming, either at the surface, high in the atmosphere, or anywhere in between" demonstrates a severe lack of understanding of the effects of CO2. Increasing CO2 leads to surface warming, but there is less warming the higher you go in the troposphere. At the tropopause, warming is negligible. In the stratosphere, increasing CO2 causes cooling. This was well understood as far back as the 1960s, in such papers as this one:
I refer you to figure 16 from that paper:

-
Eclectic at 18:46 PM on 4 August 2022CO2 effect is saturated
OldHickory @643 ,
your final sentence is simply wrong.
It is a verbal/semantic problem which has confused you. Saturation is a term with several meanings ~ but if you look at the actual mechanism of the Greenhouse Effect (for all greenhouse gasses), then you will see that the important factor is the average inter-molecular distance between "greenhouse" molecules at the so-called Top-Of-Atmosphere . . . combined with the Lapse Rate.
Denser ("more saturated") CO2 at the surface level will result in a higher T-O-A where the sufficiently-large intermolecular distances are achieved to allow infra-red photons to escape the planet. And that TOA height (and thus temperature) will be different for different types of greenhouse gas (but making some allowance for any infra-red spectrum overlap).
In short, an increase in CO2 at ground level must result in more warming effect. And the effect is very far from negligible.
-
OldHickory at 15:37 PM on 4 August 2022CO2 effect is saturated
Regardless of where the CO2 greenhouse warming takes place, it will still saturate if enough CO2 is added. It is the very strong (but narrow) absorption lines in the IR spectrum of CO2 that makes it so easy for its greenhouse effect to saturate, and has nothing to do with location. Therefore, we should expect that adding more CO2 to the atmosphere would not cause much more warming, either at the surface, high in the atmosphere, or anywhere in between.
-
scaddenp at 07:44 AM on 4 August 2022CO2 is just a trace gas
Fixitsan, your instinct that 400 ppm is a small number is not helping you understand it's actual effect. Perhaps you need to also need realize that avagadro's number is very large.
Without looking it up, what does your instinct tell you about how far an infrared photon of appropriate wavelength would travel on average before interacting with a CO2 molecule (mean path length) for an atmosphere with 400ppm?
Now you can look it up...
You do not form accurate beliefs about the nature of reality from handwavy arguments that suit what you would like to believe. Scientists make as precise as possible predictions from theory and then make observations to check. The observed spectrum of infrared, whether measured at top of atmosphere by satellite or on earth surface match the predictions of greenhouse gas theory to a very high degree.
-
Bob Loblaw at 06:22 AM on 4 August 2022There's no correlation between CO2 and temperature
ankit662003:
You are confusing "no net transfer" with "no transfer at all".
Adding $2000 to your bank account by depositing your paycheck, and then taking $2000 out to pay your bills results in no net change in your bank balance, but you still have $2000 as a "flux" in from your employer, and a $2000 "flux" out due to your withdrawal. Your bank account is in "equilibrium", but fluxes are not zero.
Likewise for energy. Even at local thermodynamic equilibrium, two objects can be exchanging energy it just has to be in equal quantities. And you need to consider all energy transfers - which in the atmosphere includes convection as well as IR radiation.
-
Bob Loblaw at 06:12 AM on 4 August 2022CO2 effect is saturated
No, OldHickory, you do not need a single-layer model. The entire atmosphere is coupled together as a series of layers. What happens in one layer (e.g. the upper atmosphere) then affects the fluxes with the layer below it, which affects the fluxes within the layer below that, etc. The net energy flux - all fluxes, radiative and convective - needs to adjust so that all layers are in local equilibrium (steady mean temperature).
What happens at the top of the atmosphere affects the entire profile, so that the lower layers (and surface) increase in temperature, which leads to more evaporation (where water is available). That increased evaporation leads to global average higher water vapour. That is the feedback loop.
It is an entire coupled system. Not one or two layers.
-
ankit662003 at 05:42 AM on 4 August 2022There's no correlation between CO2 and temperature
@MA Rodge
Now an atmosphere becomes formed around the hot body which is warmed by the hot body (this atmospheric warming you apparently have no problem with), the atmosphere reaching a chilly -18ºC = 255K at equilibrium. Being warmer than absolute zero, the atmosphere will radiate upward into space and downward back to the hot body. So will the extra energy flux back to the hot body not have a heating effect? Note - if it doesn't we will have to rewrite the laws of thermodynamics and we are not very keen on doing that.
Pardon me, I am new here. And it has been 2 decades since I touched physics but doesn't thermodynamic equalibrim itself mean there will be no net energy transfers between the two objects?
First you state that there is equalibirm then you suggest there will be a net heat transfer, how is that possible? -
OldHickory at 05:16 AM on 4 August 2022CO2 effect is saturated
As MA Rodger @638 points out, the CO2 greenhouse effect operates above the bulk of atmospheric water vapor, or atmospheric H20 in any phase. This is consistent with The Science of Doom website which states
The key point behind all the detail is that the top of atmosphere radiation change (as CO2 changes) is the important one. The surface change (forcing) from increasing CO2 is not important, is definitely much weaker and is often insignificant. Surface radiation changes from CO2 will, in many cases, be overwhelmed by water vapor.
Water vapor does not overwhelm CO2 high up in the atmosphere because there is very little water vapor there – and the radiative effect of water vapor is dramatically impacted by its concentration, due to the “water vapor continuum”.
So my question is if the CO2 greenhouse effect operates high in the atmosphere where there is very little H2O in any form, how is it possible for this greenhouse warming to cause further evaporation of condensed H2O (ie. liquid water or ice) in order to complete the water vapor feedback loop discussed in the debunking of Climate Myth 36? For this, it seems we do need the "single layer" model mentioned by BoB Loblaw @640. Otherwise, there is no correlation between the H20 and CO2 greenhouse warmings, and the controlling GHG would simply be the stronger of the two.
-
MA Rodger at 01:07 AM on 4 August 2022Taking the Temperature: a dispatch from the UK
Fixitsan @97,
I have replied to you off-topic comment on a more appropriate trhead.
Moderator Response:[BL] Please note that since moderation has been applied to Fixitsan's comment (to delete off-topic portions), regular readers can no longer see what he wrote.
-
MA Rodger at 01:06 AM on 4 August 2022CO2 is just a trace gas
Fixitsan @97 elsewhere,
You say "I struggle to find anyone who can offer a sensible explanation why it is, that if 0.04% of the atmosphere consisting of CO2 traps significant heat, enough to warm the planet an estimated 1 Celsius in 1 century, why is CO2 at higher concentrations not used more often (or even ever) in common or garden insulation."
99.95% of the Earth's dry atmosphere comprises N2, O2 or Ar but they are transparent to IR. It requires a more complicated molecule to absorb or emit IR at the temperatures found in the Earth's atmosphere. So any IR passing through the atmosphere will only be absorbed by those more-complicated molecules and IR will only be emitted these same molecules.And this is only at certain wavelengths which equate to the various wobbles that can be induced in those molecules. Of these, in the dry atmosphere, the big daddy of the IR-reacting molecules is CO2 which acts at 15 microns wavelength (666 cm^-1 wavenumber). This effect is responsible for a big bite seen in the spectrum of IR emitted out into space.

Thus about 20% of the Earthly IR has to negotiate the CO2 in the atmosphere and this mechanism directly provides perhaps 7ºC of the full 33ºC pre-ndustrial greenhouse effect.
The important variable is the altitude at which the CO2 emits the 15 micron IR out into space, and specifically the temperature of that altitude. The hotter it is, the more IR is lost to space, helping to cool the planet. But a colder gases emits less and that then insulates the planet better.
Now, if the upper atmosphere at the altitudes at which CO2 allows this 15 micron IR to escape into space were really really really cold, you could double that direct 7ºC CO2 effect by blocking all the IR in that band. But you need that really really really cold temperature to achieve it.
So if you;re after "common or garden insulation", if you want to keep something warm by half-a-dozen degrees or more, it is far easier covering it with a more conventional insulating barrier.As far as anthropogenic global warming goes, filling the atmosphere with extra CO2 concentrations results in the space-bound IR in the 15 micron waveband being emitted at higher altitudes and, because those higher altitudes have a lower temperature, less IR will this be emitted in the 15 micron waveband out into space adding to the insulating greenhouse effect.
-
Fixitsan at 22:32 PM on 3 August 2022Taking the Temperature: a dispatch from the UK
""The relationship between temperature and CO2, and harmful consequences, is fairly obvious today"
I struggle to find anyone who can offer a sensible explanation why it is, that if 0.04% of the atmosphere consisting of CO2 traps significant heat, enough to warm the planet an estimated 1 Celsius in 1 century, why is CO2 at higher concentrations not used more often (or even ever) in common or garden insulation.
Could somebody explain the science about why we choose to fill double glazing cavities with argon, which has worse thermal conductivity and costs more than, CO2, when a change in concentration from 0.03% to 0.04% is considered to be significant.
Surely if we were to extrapolate further and suggest atmospheric CO2 were 0.1% then the theory holds the planet will be warmed much more than in the past during the period when the level rose from 0.03% to 0.04%, so I just wonder why, if CO2 is such a powerful heat trapping gas, it is not used anywhere at all in any way which makes use of that arguably excellent thermal property ?
The only time CO2 seems to have any ability to trap heat is in the upper atmosphere apparently, so why is that, specifically ?
Moderator Response:[BL] Off-topic deleted.
Please note that posting comments here at SkS is a privilege, not a right. This privilege can and will be rescinded if the posting individual continues to treat adherence to the Comments Policy as optional, rather than the mandatory condition of participating in this online forum.
Moderating this site is a tiresome chore, particularly when commentators repeatedly submit offensive, off-topic posts or intentionally misleading comments and graphics or simply make things up. We really appreciate people's cooperation in abiding by the Comments Policy, which is largely responsible for the quality of this site.
Finally, please understand that moderation policies are not open for discussion. If you find yourself incapable of abiding by these common set of rules that everyone else observes, then a change of venues is in the offing.Please take the time to review the policy and ensure future comments are in full compliance with it. Thanks for your understanding and compliance in this matter, as no further warnings shall be given.
-
MA Rodger at 22:04 PM on 3 August 2022It's the sun
cgfree59 @1301,
The best initial assessment of any work by the Connolly brothers or Willie Soon is to assume it is yet another pile of their usual nonsense (I was much surprised recently seeing an NSIDC blog actually citing one of their papers for real!!) and given the lengths they go in obfuscating and misdirecting folk, this is not entirely a falacious use of an ad hominem argument.There are responses to this particular serving of nonsense Connolly et al (2021) 'How much has the Sun influenced Northern Hemisphere temperature trends? An ongoing debate' (thus a layman's efforts or a reply from the numpties themselves to a criticism of press coverage of their paper) but I do not see anything here at SkS.
The conculsions of Connolly et al (2021) are to assert that the IPCC is premature with its conclusions as it ignores certain estimates of TSI and thus solar forcing which provide radically different results to the global warming attribution reached by the IPCC.
"Different TSI estimates suggest everything from no role for the Sun in recent decades (implying that recent global warming is mostly human-caused) to most of the recent global warming being due to changes in solar activity (that is, that recent global warming is mostly natural)."
You could expend time and effort trawling though Connolly et al (2021), picking out the obfuscation and misdirection they employ but the crux of it is the crazy method they use. That is they the employ blind curve-fitting of their preferred solar-caused climate forcing onto some crazy NH temperature estimates and only after this first-step into the lunatic asylum do they then get to attributing the left-overs of any temperature trends to anthropogenic forcings.
So the results are pure nonsense.
Further a rather telling observation is that of these TSI estimates which they claim are being ignored (TSI High Variability Estimates all plotted out in their Fig 3), only two would allow any naive correlation between rising global temperature with TSI through the all-important "recent decades."
One of these two exceptional TSI estimates was scaled from a postage-stamp-size graphic in Ammann et al (2007), a paper which contradicts the muppets in that it concludes:-"Although solar and volcanic effects appear to dominate most of the slow climate variations within the past thousand years, the impacts of greenhouse gases have dominated since the second half of the last century.
The second is cherry-picked TSI estimate is from yet another tiny graphic (Fig 5b of Egorova et al 2018) in turn the trace being based on Muscheler et at (2016) which employs proxy data to create estimates of TSI, so not a precise method you would want to put much faith in.
The numpties offer no comment on such an obvious problem with their grand thesis, that it has such a narrow and less-than-reliable basis for the singularly important calculation within their account. Such an omission is a sign that you have strayed from reasonable analysis and entered the lunatic asylum. -
Jim Hunt at 21:00 PM on 3 August 2022Taking the Temperature: a dispatch from the UK
Not that it will actually come to pass, but in recent related news:
For the first time in history, a deterministic model simulates 40 degrees over Denmark.
https://twitter.com/SebastianTV2dk/status/1554360935246094336 -
Fixitsan at 19:13 PM on 3 August 2022Record rain in St. Louis is what climate change looks like
I was just looking at the very beautiful 'live' GPM model by NASA showing where precipitation is most likely to occur on earth.
It seems to me that somewhere on the planet potentially record rainfall arrives every day.
If there is no rain guage at that location to measure it's accumulation then sadly it is not entered into 'record books'.
And it seems just as likely to me that this has always been the case.
If you have no instrumentation present then the record level cannot be officially observed, no matter how extreme the new record is, or, has been in the past.
But, regardless of that the tenacity of Galveston residents is something to be admired. The worst weather catastrophe in US history took place during flooding at Galveston in September 1900, killing 8000, people.
The geographical location of Galveston is plainly a key issue. Storms last year, storms in 2017, many storms and floods since 1900, seem to point to one thing - If you build a city on a low level island by the sea, in a storm prone area, then you need to be thankful for the subsidised flood insurance you get, as a result of the area being a well known heightened flood risk zone.
I was talking to my friend in New York a couple of days ago about this, he just said, "well, it's Galveston, what do they expect". Harsh, but probably fair
Moderator Response:[BL] Throwing around statements like "it seems", "potentially", "if there is no", "it seems just as likely", "If you have no instrumentation present", etc. is just adding noise.
You went through this sort of behaviour on other threads. You are making an argument from incredulity.
Your misguided attempts to look at single events in isolation is as worthless here as it was on the UK temperature threads. Your statements prove nothing.
-
cgfree59 at 14:15 PM on 3 August 2022It's the sun
Trying to find responses to Connolly et al 2021 in RAA on solar contribution to GW.
-
Bob Loblaw at 10:14 AM on 3 August 2022From the eMail Bag: a review of a paper by Ziskin and Shaviv
Hello, yanirdz. Welcome to Skeptical Science, and I hope that this is a useful resource.
The short story is that the model used by Ziskin and Shaviv introduces an "indirect solar effect" that is based on an index (the AA index) that starts positive and grows over time (figure 4). All other forcings (direct solar, CO2, aerosols, etc.) represent a departure from equlibrium - i.e., they would have a value of zero in a stable climate, and a non-zero value would push temperatures away from that equilibrium (warmer, or colder, depending on whether the value is positive or negative).
Since the AA index is always positive, it is always "causing" a warming trend in the model output of temperature. And since the AA index increases over time, it pushes the temperature warmer and warmer. The AA index never has a value of zero, so it can never not contribute to warming in the model.
...and as a result, the observed warming over the past century gets "explained" by the "indirect solar effect", because the model is created in such a way that the "indirect solar effect" absolutely must cause warming. And since the "indirect solar effect" must cause warming, the fitting of the model to actual observations must reduce the warming effect of anything else (e.g., CO2).
Really short version: they assumed continuous warming due to the "indirect solar effect" when they built the model, and therefore their "conclusion" is not a conclusion, it is their original assumption.
Minor point: they have a multiplier (fudge factor) for the "indirect solar forcing" that hypothetically could have a zero value, making the AA index always zero, or even negative (see the last row in table 2 in their paper). The fitting process, though, finds it easier to use the always-positive AA index to "explain" the warming, instead of CO2 or direct solar, etc.
Feel free to ask any further questions.
-
yanirdz at 09:15 AM on 3 August 2022From the eMail Bag: a review of a paper by Ziskin and Shaviv
Hi, In Israel Saviv is getting popolarity. This post is very important, but it is hard for non sceintifc person to understand it
If I want to summerize this post in simple language, few sentences so I could use for example in twitter - how do you suggest to do it? -
Bob Loblaw at 05:23 AM on 3 August 2022Record rain in St. Louis is what climate change looks like
macquigg:
"Atmosphere holds more water" is too simplistic to evaluate water cycle changes. It's true that warmer air hold more water vapour, which is likely to lead to increased evaporation, but that also means that somewhere, at some time, there will be more precipitation, too. Globally, evaporation = precipitation on any reasonably long time scale (months), and the question becomes one of "how does the local balance change?".
Most land areas receive more precipitation than they lose in evaporation. Oceans are the opposite. Proof? Rivers draining from land to ocean. A lot of global variations in vegetation are explained by climate classifications that include some sort of water balance considerations (precipitation minus evaporation). The classic is the Koppen system.
Soil moisture for agriculture can decrease even if local precipitation increases - if local evaporation increases even more. So "more precipitation" does not necessarily mean "wetter" from a soil perspective. And for agriculture without irrigation, when rain falls is critical. As the old story goes, farmers always complain about rain. Too much; not enough; not at the right time.
For municipal uses, storage can help with seasonal and annual variability, but it can't make up for long-term expectations that want to use more water than is available from the long-term average.
Very local predictions from global climate models are hard to do, but Michael Sweet has pointed you to some possible sources of information.
-
michael sweet at 02:45 AM on 3 August 2022Record rain in St. Louis is what climate change looks like
The 4th National Climate Assessment (2018) is located here. It is a good start and is easy to read. They have a Southwest section. Googling climate models Arizona also gets several useful hits. The 5th assessment is due next year.
The first rule of thumb is wet places will get wetter and dry places will get dryer. In addition, when rain arrives more will come in big days with longer dry periods in between. The US Southwest is expected to get dryer. When the land drys out the temperatures go up since evaporating water cools the ground.
Water from the Colorado river was allocated during a particularly wet period. The future flow is expected to be a lot lower than it was in the past.
-
macquigg at 01:08 AM on 3 August 2022Record rain in St. Louis is what climate change looks like
I live in Southeast Arizona, at the edge of an expanding drought area affecting the entire Southwest. I have been trying to understand how global warming might make this better or worse. It could go either way - more rain because the atmosphere holds more water, or less because climate change is always bad. Are there any reliable predictions, based on climate models or other scientific reasoning?
-
One Planet Only Forever at 03:15 AM on 2 August 2022Taking the Temperature: a dispatch from the UK
fixitsan's comment @88 included the following enlightening bit: "I did not indicate any relationship between temperature and CO2 levels at all" That appears to indicate a powerful 'need' to deny that there is any relationship between increasing CO2 levels and global average surface temperature (and the related harmful regional/local impacts).
The relationship between temperature and CO2, and harmful consequences, is fairly obvious today. It was pretty clear in the rigorous evaluation of evidence at the time of the 1990 IPCC report. And it has become increasingly obvious since then.
The CO2-temperature relationship was particularly well displayed by the image in Bob Loblaw's comment @47 (which I referred to in my comment @51 that opens with the bit that fixitsan chose to take exception to @88).
-
Jim Hunt at 01:42 AM on 2 August 2022Taking the Temperature: a dispatch from the UK
Mod @93 - Sorry, my bad.
I'll try to avoid clicking helpful links in future! -
michael sweet at 23:28 PM on 1 August 2022Sea level rise is exaggerated
Fixitsan,
Unfortunately, you are completely misinformed on the subject of long term sea level rise.
Fortunately, Skeptical Science has a post that describes the science and facts of long term sea level rise. Your claim that sea level has been rising for the psat 20,000 years is simply incorrect.
The fact is that sea level increased from about 24,000 years ago until about 4-5,000 years ago. Then the Earth started cooling (!!!). The sea level dropped slowly until about 200 years ago. Then global warming caused the decline to reverrse and sea level rise has been increasing since then.
I note that you have provided no linkis to support your wild claims. Wild, unsupported claims by anonymous internet persons do not haol much weight in scientific discussion. I look forward to your references that show sea level rise for the past 4,000 years ws increasing.
I have visited many of the islands described in the linked article at Skeptical Science. They are low islands formed when coral grew to the surface during the high stand 4,000 years ago. The decrease in sea level for the past 4,000 years made them islands. If you insist that sea level has consistently risen for the past 20,000 years, how did coral atolls form?
-
Jim Hunt at 21:30 PM on 1 August 2022Taking the Temperature: a dispatch from the UK
Fixitsan@87
Gotta link to the CET data you recall downloading? Remember the bit about "individual time series of all UK stations contributing to CET".
And please take the SLR "debate" elsewhere.Moderator Response:[BL] The link to the processed CET time series has been provided previously within this thread. The phrase "individual time series of all UK stations contributing to CET". is only visible to people that actually follow the link given in comment #84, and read the original. It's the second sentence in that comment, though, so a reader has to have the patience/willingness to read past the first line.
-
Eclectic at 21:07 PM on 1 August 2022Sea level rise is exaggerated
Thank you, MA Rodger. I had better follow your example, and transfer my reply to Fixitsan into this thread, from his (incorrect) thread "elsewhere".
To repeat :-
Curiouser and curiouser, Fixitsan. While I appreciate your desire to emulate the White Queen in believing six impossible climate things before breakfast ~ I do confess to being intrigued by your statement that "sea level rise is undeniably normal". Mr Milankovitch and his cycle would suggest (strongly) that the planet is in its natural cooling stage for about the last 4,000 years (minus the last couple of centuries of AGW, of course).
So why would the sea level be rising recently, without cause? Or do you define AGW as "normal" ? (With another five impossible things yet to be enumerated by you.)
-
MA Rodger at 20:30 PM on 1 August 2022Taking the Temperature: a dispatch from the UK
Fixitsan @87,
-
MA Rodger at 20:28 PM on 1 August 2022Sea level rise is exaggerated
Responding to Fixitsan @84 elsewhere.
The NTSLF provides tidal gauge data around UK. The UK shows on average 150mm of SLR You say "the tide guages around the UK show some decline in sea level rise. One guage measuring the Thames estuary shows a decline, several Scottish ones too."
The Sheerness gauge (the gauge in the Thames estury) shows positive SLR. As for Scotland, Kinlochbervie, Portpatrick & Aberdeen show none of this "decline" you talk of.
Moderator Response:[BL] Note that the post by Fixitsan linked to here has had its contents deleted due to repeated off-topic posts by Fixitsan.
-
Eclectic at 20:20 PM on 1 August 2022Taking the Temperature: a dispatch from the UK
Curiouser and curiouser, Fixitsan @89. While I appreciate your desire to emulate the White Queen in believing six impossible climate things before breakfast ~ I do confess to being intrigued by your statement that "sea level rise is undeniably normal". Mr Milankovitch and his cycle would suggest (strongly) that the planet is in its natural cooling stage for about the last 4,000 years (minus the last couple of centuries of AGW, of course).
So why would the sea level be rising recently, without cause? Or do you define AGW as "normal" ? (With another five impossible things yet to be enumerated by you.)
Moderator Response:[BL] Off-topic deleted.
-
John Mason at 19:05 PM on 1 August 2022Taking the Temperature: a dispatch from the UK
For future reference, the Ed Hawkins graphic in the post uses HadCRUT5 data with the baseline being 1960-1990.
-
Fixitsan at 18:49 PM on 1 August 2022Taking the Temperature: a dispatch from the UK
Michael Sweet.
Coarse sea level rise since the start of the ice age melt, approx 20,000 years.
https://external-content.duckduckgo.com/iu/?u=https%3A%2F%2Ftse1.mm.bing.net%2Fth%3Fid%3DOIP.nUK9Ty2xjWQgiVLRcDeFngHaE9%26pid%3DApi&f=1
Alternatively
https://kartverket.no/contentassets/ed899aa3266245028d9e9b502ba5930b/global-sea-level-change-past-20000-years.jpg?width=1104&height=621&quality=85&mode=crop&scale=both
If these are at all disagreeable please feel free to post a corrected version
Clearly, sea level is not changing around a middling value, it has only really risen continuously, for 20,000 years and therefore I feel safe in my position to say sea level decline is probably impossible given the massivity of the system and almost uncountable variables which affect it which currently trend upwards in their output effects.
My issue, again probably focussed more towards the media misreporting, which few climate scientists seem to contest, centres around the lack of context of reporting of sea level rise as a distinct topic, but instead it is bundled into one topic of climate change.
If more people were more aware that sea level rise is 'normal', as opposed to sea level decline or even sea level stability, then much fear could be taken out of the subject and less anxiety induced in young and influential minds who sometimes feel the need to take their own lives due to feelings of hopelessness about the future of the planet.
Sea level rise is undeniably normal, it is all we have really seen for 20,000 years, only the rate has varied over that time and the current rate is much less than it was previously
Moderator Response:[BL] Off-topic deleted.
-
Fixitsan at 18:40 PM on 1 August 2022Taking the Temperature: a dispatch from the UK
ONE PLANET
"Thank you for accepting that averaging larger amounts of data provides a clearer indication of long-term trends like the impacts of increasing CO2 levels.""
That is a deliberate misrepresentation of my words. I did not indicate any relationship between temperature and CO2 levels at all
Moderator Response:[BL] More from the Comments Policy that you are so eager to ignore:
No accusations of deception. Any accusations of deception, fraud, dishonesty or corruption will be deleted. This applies to both sides. You may critique a person's methods but not their motives.
-
Fixitsan at 18:39 PM on 1 August 2022Taking the Temperature: a dispatch from the UK
Bob...
""Bindidon states that he's been trying to get the data for the CET record, but has not yet succeeded.""
CET data can be downloaded by the public can it not ?
I recall several occassions in the past decade I have downloaded it, has it been taken offline ?
Moderator Response:[BL] Clear evidence that Fixitsan has not actually bothered to follow a link and read what it says.
-
Fixitsan at 18:36 PM on 1 August 2022Taking the Temperature: a dispatch from the UK
MA Rodger,regarding tide guages, the tide guages around the UK show some decline in sea level rise.
One guage measuring the Thames estuary shows a decline, several Scottish ones too.
We're back to the topic of local evaluations not being representative of global trends I guess.
'Bendy sea'
Moderator Response:[BL] Off-topic deleted
-
Bob Loblaw at 22:48 PM on 31 July 2022Taking the Temperature: a dispatch from the UK
And Tamino has a post today that also shows how hand waving assertions of "no trend in [insert choice] temperature" are debunked by proper analysis. In this case, it is Seattle summer maximum temperature, but it is of interest in this thread because it illustrates how to do things properly.
-
Bob Loblaw at 22:31 PM on 31 July 2022Taking the Temperature: a dispatch from the UK
For what it is worth, there is an example on Tamino's blog of what it is like when someone posts a comment that actually includes analysis, rather than just hand-waving.
Tamino's post on the recent UK heat wave has already been mentioned here in this thread:
...and yesterday a participant using the name bindidon posted a comment with links to two graphs that examine the frequency of record highs or lows for the last 125 years. One is for continental US stations:
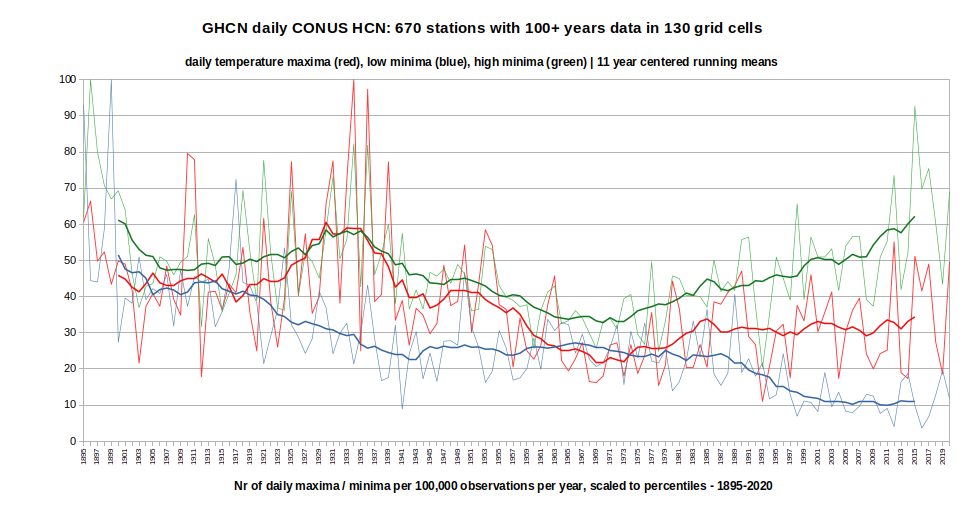
and an equivalent one for global temperatures.
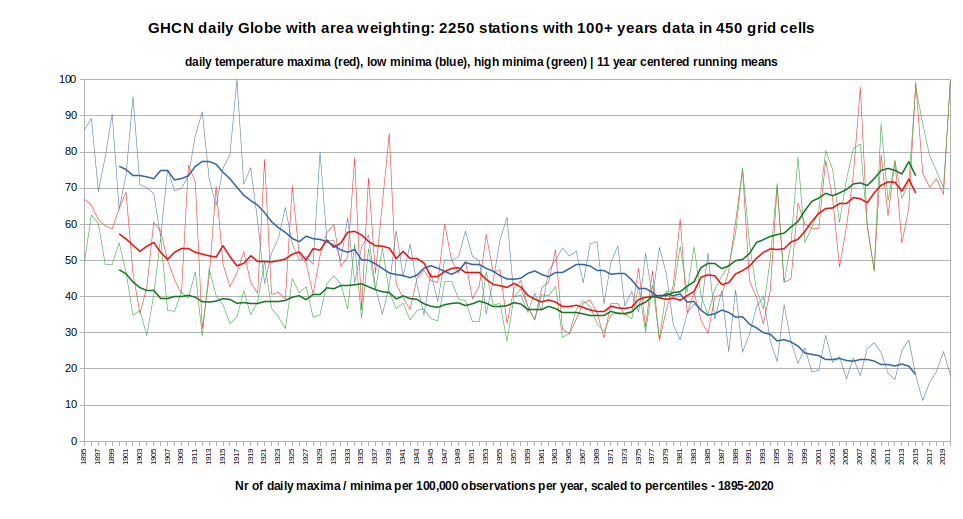
Bindidon states that he's been trying to get the data for the CET record, but has not yet succeeded.
The two graphs for US and global records clearly show that record cold events used to happen as frequently as (or more frequently than) record warm events, but now they are much less frequent. Exactly what is expected in a warming world.
...and showing that occasional record cold events can still happen, and are not evidence that climate science has failed. Analysis of extremes needs to be done properly - not by hand waving.
-
One Planet Only Forever at 03:06 AM on 31 July 2022Taking the Temperature: a dispatch from the UK
To recap (a term used by fixitsan @2).
Fixitsan @67 claims “I made it5 clear in my first response that I was aware of a difference between local and regional and global terminologies”.
Their responses have clearly indicated something, but not what they hope to indicate.
Fixitsan @2 ends with the following para. I provide a response to each part in brackets:
So to recap, lets recall the amount of serious messaging about climate change which probably dates back to 1989, when Mrs Thatcher addressed the UN and stressed the importance of a worldwide commitment to reducing CO2 [Many global leaders spoke more strongly on the issue and did it years before Thatcher did. They had been learning since the 1972 Stockholm Conference which led to the 1987 Montreal Protocol about Ozone and formed the IPCC which issued its first report in 1990].
Anything since then is a year in an era when it has been fine to suggest we might only have ten years left to live, or only a few days left before doomsday due to climate change, [The correct understanding based on increased awareness and improved understanding since 1990 is undeniable. Avoiding the creation of significant harm to the future of humanity requires dramatic reduction of fossil fuel use by 2030. Many other dramatic corrections of harmful ways of living developed by humans are also required]
and recall how most of the CO2 was produced before 1989, [wrong, and shown to be wrong by other comments]
so how come that of the 12 months in every year, only 5 of those months have been hottest since 1989, [wrong – and proven by subsequent comments to be an incorrect claim, a gross misunderstanding about the meaning of bits of data found in the record of temperature in a small part of the planet. A ‘hottest date does not make a ‘hottest month’, or a ‘hottest year’. And finding a ‘hottest ’ in a region of the planet does not indicate a hottest global condition]
and 2 were hottest before the start of the industrial revolution (which apparently causes global warming, except not in April or May) [repeatedly proven to be a grossly incorrect way to think about the issue]
Further early evidence of fixitsan’s incorrect understanding is provided by fixitsan @8: ”Be honest you don't know if it was hotter 20 years ago in a place where there was no thermometer. Statictiscally possibl;e, as thermometers are located on such a small amount of area of the UK” [Nonsense belief that some actually collected temperature information indicates nothing meaningful ‘because everything hasn’t been measured rigorously everywhere all the time’. That nonsense appears to be the reason they refuse to learn about Sea Level rise or any other matter they do not want to learn about.]
That type of nonsensical thinking can be understood to be related to conspiracy type thinking - thinking that will not be a sustainable 'common sense' in any sub-set of humanity unless the subset is permanently isolated for all others. Review the following brief (about 6 minutes each) BBC Reel videos (I referred to the first one in my comment @51:
And that awareness and understanding makes sense of the success of the efforts to mislead people about climate science I refer to in my comment @39 pointing to my comment on the Skeptical Science New Research for Week #29 2022.
My comment on New Research for Week #29 links to The following BBC News item:
The audacious PR plot that seeded doubt about climate change
That BBC story includes the following concise summary point:
"What the geniuses of the PR firms who work for these big fossil fuel companies know is that truth has nothing to do with who wins the argument. If you say something enough times, people will begin to believe it."
A concluding Note:
It appears likely that the massive efforts to mislead regarding climate science were a response to the way that global leaders collectively agreed to meddle in the marketplace to limit the harm done to the Ozone layer. That type of global leadership effort appeared to be working towards a similar action on climate impacts, which would focus of ending fossil fuel impacts – and some harmful misleading people believed that that ‘helpful harm reduction action’ had to be delayed any way that could be gotten away with.
People like fixitsan appear to have allowed themselves to be so deeply misled into conspiracy belief that they cannot easily be helped to learn what is really going on and what needs to happen to limit the harm being done.
Moderator Response:[BL} Please let's stop rehashing Fixitsan's earlier posts. Until he has something new to say (that will be on topic and survive application of the Comments Policy), let's all try to end this circular discussion.
-
John Mason at 01:27 AM on 31 July 2022Taking the Temperature: a dispatch from the UK
Initial figures are in on the estimated excess deaths in England and Wales on July 17-19 2022. 948 people (844 of them on July 18-19) according to a London School of Hygiene & Tropical Medicine researcher. The work is summarised in New Scientist. See:
-
michael sweet at 01:12 AM on 31 July 2022Taking the Temperature: a dispatch from the UK
Fixitsan,
You need to read my last post at 69. Most of your questions are answered in my post. If you read the linked posts by Tamino that would answer the rest of your questions. It is not my problem that you do not do your homework.
The reason that Tamino's sea level rise rate is differrent than NASA is because Tamino uses a 10 year average and NASA uses a 30 year average. Simply looking at the graph in post 69 it is obvious that sea level rise is accelerating. Therefor a 30 year average underestimates current sea level rise.
The data I referenced only considers sea level rise, ground water extraction is a separate issue more important in other areas. Florida gets so much rain that ground water extraction is not an issue here.
All the rates that I quoted are from Tamino who is a professional statistician who specializes in time series analysis like looking at sea level rise. Your suggestion that I used three different sources is simply false.
Sea level rise is different in different places, as you have been told repeatedly on this thread. You claim that sea level rise is zero in the Maldives. I state that sea level rise is 11 mm.year in Florida. Since I live in Florida, along with 21 million other Americans, I care more about sea level rise in Florida. It turns out that sea level rise now and in the future on the US East coast will exceed the global average by a lot.
You are certainly well informed about deniers claims that sea level rise will not be too bad. Unfortunately, sunny day flooding has become a big ptoblem on the entire East coast of the USA. It is particularly bad in flat areas like Florida.
Path: pModerator Response:[BL] Note that Fixitsan's most recent ramblings on sea level have largely been snipped from his comment. This will continue until Fixitsan takes the time to find one of several sea level posts here at SkS where the discussion will not be a violation of the comments policy. MA Rodger has suggested one.
This post will be left as-is, because it contains general advice that Fixitsan needs to follow: read the responses to his comments, read the links presented (where he can obtain additional information), and stop repeating claims that others have debunked with actual analysis.
-
EddieEvans at 21:37 PM on 30 July 2022Skeptical Science New Research for Week #30 2022
This is an impressive page!
-
Jim Hunt at 21:29 PM on 30 July 2022Taking the Temperature: a dispatch from the UK
Getting back on the topic of UK "heat waves", the GEFS mid range forecast for sunny South West England is heating up again:
https://Davidstow.info/2022/07/drought-for-cornwall-later-in-2022/#comment-2627
This is one of the more extreme ensemble members: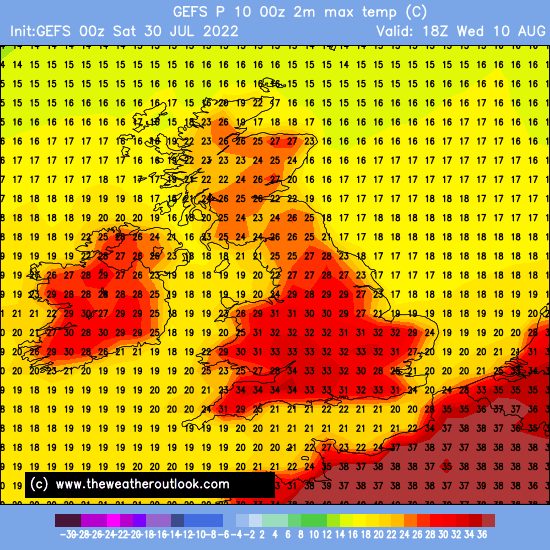
-
Jim Hunt at 21:24 PM on 30 July 2022Taking the Temperature: a dispatch from the UK
Fixitsan@77 - I heartily recommend that you read the attribution study I linked to @75 from cover to cover.
After that there are also numerous references the document links to.
I also feel compelled to point out that John's original post makes no mention of SLR. See also MAR@78. -
MA Rodger at 21:12 PM on 30 July 2022Taking the Temperature: a dispatch from the UK
Fixitsan @76,
You blather is entirely off-topic but if you were to examine the comment of michael sweet @69, you may perhaps see where the value of 5mm/year for global SLR is sourced. And you will possibly then note that the data used is from tidal gauges which measure the sea level round the coasts while the NASA data is satellite data that measures the level of the entire ocean. You may wish to consider which measure is more important for humanity.
The method of calculating SLR is also different.
But if you have anything sensible to say on this subject of SLR, I would suggest a different SkS thread, perhaps this one -'How much is sea level rising?'


