


 Arguments


Recent Comments
Prev 770 771 772 773 774 775 776 777 778 779 780 781 782 783 784 785 Next
Comments 38851 to 38900:
-
Doug Hutcheson at 17:54 PM on 3 February 2014Why rainbows and oil slicks help to show the greenhouse effect
Like Andrew Mclaren, I am not a scientist (poet here ...), but I agree that this is a useful article to be able to link to. Sadly, the committed denialospheroids will dismiss it as just more spin and claim it has been 'widely discredited' (though so far they have been curiously unable to point to the scientific papers discrediting anything about which they make this claim). Neverthless, I will gladly add this arrow to my quiver of links to post in rebuttal of denialist comments on other sites I haunt, such as The Conversation, on the basis that any ambivalent people reading such a thread of comments need to be pointed to reliable information, to counter the ridiculous denialospheroid claims.
-
Vonnegut at 17:50 PM on 3 February 2014Skeptical Science Study Finds 97% Consensus on Human-Caused Global Warming in the Peer-Reviewed Literature
@265 Doug you mean "Do you think that climate sciensts working out the perturbed changes in the climate have been affected by man"
SKS assumes every climate scientist knows mankind is to blame, That being the case what of the 3% who dont? are they in the rogues gallery too?
-
Doug Hutcheson at 17:25 PM on 3 February 2014Skeptical Science Study Finds 97% Consensus on Human-Caused Global Warming in the Peer-Reviewed Literature
Vonnegut @ 264, do you think astroscientists working out the perturbed orbits of planets around the sun explicity affirm the theory of gravity in every paper they publish, or do you think in their field the phenomenon of gravity is so well understood that it needs no explicit restatement? Whatever your answer, you can apply the same reasoning to the question of climate scientists and the theory of anthropogenic global warming.
-
Vonnegut at 16:38 PM on 3 February 2014Skeptical Science Study Finds 97% Consensus on Human-Caused Global Warming in the Peer-Reviewed Literature
1) most journals have strict word limits for their abstracts, and 2) frankly, every scientist doing climate research knows humans are causing global warming. There's no longer a need to state something so obvious.
quote from text in article above.
Do you think perhaps you let emotion and assumtion get in the way of a valid assessment?
Will there ever be a basic break down of how many climate scientists actually disagree and how many actually agree and the total climate scientists involved in proving AGW true or false?
-
Andrew Mclaren at 16:38 PM on 3 February 2014Why rainbows and oil slicks help to show the greenhouse effect
Great to see some clear evidence that answers the common 'skeptic' demand for empirical evidence of enhanced greenhouse warming. Though I am not myself a climate scientist (artist here, heh heh) I have been drawn into the arguments quite a bit in media commentary, and have cited the example of heat-seeking missile technology a number of times. Suppose I should get some proper references for the actual work in that field (maybe some of it is classified info, not sure) but it is fairly well known that the early development of such technology had to work out instrumental errors due to the heat masking properties of CO2 and other GHGs, and to re-calibrate such guidance systems in order to make them work properly.
I can never resist the zinger which most effectively closes this Q.E.D. response to the 'no greenhouse effect' claims: should these folks find themselves up in the air with a heat-seeking missile on their tail, they can bet their flaming backsides, its aim is true!
-
Tom Curtis at 16:30 PM on 3 February 2014Models are unreliable
Daniel, for what it is worth, wikipedia's (and hence Vonnegut's) claim is based on the following statement by the BAS:
"Global climate model predictions of how the Antarctic climate may change over the next 100 years differ in detail from model to model. Most models, however, indicate relatively modest temperature rises around Antarctica over the next 50 years and, over this time period, increased snowfall over the continent should more than compensate for increased melting of Antarctic ice and will thus partially offset the rise in sea level resulting from thermal expansion of the oceans and melting of icecaps and glaciers elsewhere in the world. However, many processes occurring in the polar regions are not well represented in climate models at present and further research is needed to improve our confidence in these predictions. This is particularly true for predictions beyond 50 years, when Antarctica may start to warm enough to have a significant impact on the ice sheets."
The only problem is that the statement comes from a page that was taken down by the BAS sometime between Feb 7th, 2006 and June 7th, 2007. Ergo the statement precedes the IPCC AR4, let alone AR5.
The nearest recent equivalent (from the page you are currently redirected to) reads:
"Antarctica is a vast ice sheet, around the size of the USA, and it is not surprising that different areas are behaving differently. On the Antarctic Peninsula, where climate is warming rapidly, 87% of glaciers are retreating but the area is small and the contribution to sea-level rise, a few centimetres per century, is comparable to that from Alaskan glaciers. The East Antarctic ice sheet appears close to balance, although increased snowfall may cause this area to thicken slowly in future. In West Antarctica, there is an area roughly the size of Texas where the ice sheet is thinning rapidly — the Amundsen Sea Embayment (ASE). Close to the coast in ASE, thinning rates are more than 1 metre per year."
(Current to at least Jan 17, 2014)
Of course, that does not support Vonnegut's claim.
-
grindupBaker at 14:20 PM on 3 February 2014Corrections to Curry's Erroneous Comments on Ocean Heating
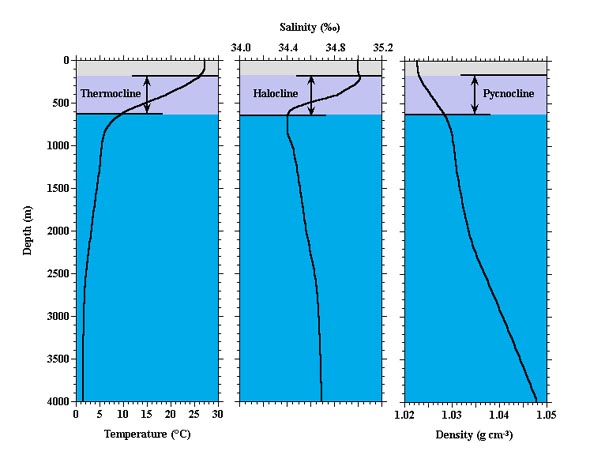
chriskoz #13 The tentative info I've found is that salt water freeze point at a pressure of, say, 4,000m depth is -15C (it's -1.9C at surface) so no freezing down there (someone please confirm that -15C number). Yes to the dynamic equilibrium sweet spot. It's an Oreo cookie with ice cream instead of fake cream. The balance temperature point depends on the ocean current flow rate of the below-zero water from the poles, as you say, the mixing rate from warm waters above (except at high latitudes) by way of mixing currents and octopi, and the average thermal conductivity of the Earth crust beneath down to the 5,000C zone (as from MA Rodger #9). I suggest taking the ocean thermocline shown by MA Rodger #9 and take it's 4,000m depth as the sea bed for illustrative example, then continue the thermocline down to the 5,000C zone based on that thermal conductivity of the Earth crust and if you get accurate data that will show you the heat flow from below (estimated at 0.08 wm**-2 globally geothermal heat, but not known precisely with much certainty). You can't deduce anything using heat conduction from warm waters above because you'll find it's so tiny that would take ~125,000 years to warm/cool the depths to same as surface following a surface MST anomaly if there were no currents bringing cold water through, so obviously the actual warming from waters above is 99%+ by fluid mixing.
-
Larry E at 12:44 PM on 3 February 2014Warming oceans consistent with rising sea level & global energy imbalance
It would be interesting to overlay the first chart with average global air temperatures (putting the scale on the right hand side). I think this would help explain the flat-spot from 1993 to 2001, as well as showing the relationship of where growing heat is being manifested at present.
-
chriskoz at 11:33 AM on 3 February 2014Corrections to Curry's Erroneous Comments on Ocean Heating
MA Rodger@9,
[Ask them, 'skeptics':] could they explain why the oceans are so cold? The air above has an average temperature of about 14ºC and the rocks beneath sit on the planet's core with a temperature of 5,000ºC. So why are the oceans only 1ºC?
I'm not an expert oceanographer, so before I ask, I'd like to know the detailed asnwer. My current knowledge is as shallow as freshwater reservoirs (small lakes), where water stratification is determined by its density:

with the consequence that bottom water never falls below 4C (most dense water sinks to the bottom) allowing e.g. fish to survive in winter because the lake freezes from the top only.
In slatwater however, the playground determining stratification is different:

which means saltwater becomes heavier all the way to the freezing point. That can mean for example that in cold ocean, i.e. in the arctics, water can freeze from the bottom (and then lighter ice shunks float up to the surface) but haven't I heard of such phenomenon yet? That's perhaps because bottom ocean water does not go all the way to freezing point but just to 1C, as you said...
I understand that bottom ocean does not equilibrate with 5000C of Earth crust because of slow mixing with colder water coming from arctic, as explained by michael sweet@11, thanks!. I presume siad mixing is the slow deep ocean mixing with an overturning rate of ~1-2ky, according to my current knowledge, please confirm or correct me. So, is 1C temp of bottom ocean a "sweet equilibrium spot" of sinking and mixing processes involved?
-
Bert from Eltham at 11:27 AM on 3 February 20142014 SkS Weekly News Roundup #5
The Anti Vaccine protagonists are just as deluded as the anti Global Warming protagonists. Both have no scientific evidence to back up their very internally contradictory claims.
The claim that 'secret' compounds cause the multiplicity of syndromes that these nutters assert, is completely laughable.
Next they will assert that the lack of a compound has an effect just like that of Homeopathy. Bert
-
grindupBaker at 10:18 AM on 3 February 2014Global warming is being caused by humans, not the sun, and is highly sensitive to CO2, new research shows
The NOAA NCDC site lists 2013 monthly GMST as 12.54, 12.67, 12.88, 14.22, 15.46, 16.14, 16.41, 16.22, 15.64, 14.63, 13.68 & 12.84 which averages 14.44 by equal monthly weighting or 14.45 weighting by the number of days in each month, but the 2013 annual GMST is given as 14.52. I don't see how that difference can be reconciled.
-
Daniel Bailey at 08:03 AM on 3 February 2014Models are unreliable
First of all, copying the work of others (as you do) without the usage of quotes is considered plagiarism, FYI. The only remaining question is whether you copied it from Wiki or one of the many denier sites parroting that phrase.
Further, I see no mention in the BAS site of the phrase you use. Feel free to look yourself.
-
davidsanger at 07:53 AM on 3 February 2014Warming oceans consistent with rising sea level & global energy imbalance
@SimplyConcerned. thanks that's really very clear now. And I also agree with you and JH about the overall civility of this site, at least in my experience and from what I've read so far.
-
Vonnegut at 07:30 AM on 3 February 2014Models are unreliable
Climate models predict more snowfall than ice melting during the next 50 years, but models are not good enough for them to be confident about the prediction.
The British Antarctic survey team confirm this but their site is down at the moment
Moderator Response:[TD] Part of the answer is that the smaller the geographic region, the more difficult it is to project its climate. The whole globe is easier than any subregion of the globe. That's because difficult-to-predict factors regionally, tend to cancel out those same factors in other regions. This difficulty of projecting at short geographic scales is similar to the difficulty of projecting at short time scales--even when the "region" is the whole globe. See the post The Difference Between Weather and Climate. See also the National Academy of Sciences' excellent series of short videos, Climate Modeling 101.
For a given size of region, naturally some regions are more difficult to project than others are, but I don't know about the difficulty of Antarctica versus other regions of similar size.
-
SimplyConcerned at 06:34 AM on 3 February 2014Warming oceans consistent with rising sea level & global energy imbalance
@DavidSanger and others.... part of the discussion/questions about thermal expansion at low temperatures in the deep ocean is missing the key point that saltwater behaves very differently from freshwater. Freshwater has a maximum density at c. 4 C. Seawater does not: its density increases right down to the freezing point which is typically c. -1.8 C.
So even though the thermal expansion coefficient for saltwater does decrease slightly as seawater approaches its freezing point, there is absolutely no doubt that adding heat to ocean deepwater will result in thermal expansion.
I've just joined this blog and I really like the fact that people debate and ask reasonable, critical questions but without calling each other names. The contrast with Judith Curry's blog is very evident.
Moderator Response:[JH] Welcome aboard and thank you for the kind words about the civility of our dsicussion threads. We take great pride in that. We also work very hard to ensure that all commenters strictly adhere to the SkS Comments Policy.
-
Vonnegut at 05:12 AM on 3 February 2014Models are unreliable
Could anyone explain why Antarctic climate models would be harder to get right than full global climate models?
Moderator Response:[DB] Please support your assertion with a link to a credible source establishing that claim.
-
william5331 at 05:04 AM on 3 February 20142014 SkS Weekly News Roundup #5
Does anyone out there have the patience to make up a chart. Down the left side would be the names of all the prominent climate change deniers including politicians. Across the top would be labels for columns such as "Was a tobacco advocate", "is anti-vaccine", "Is a creationist* and so forth. A little star would be put in the appropriate boxes. It would be interesting to have this sketch of the previous history of the CCD's
Moderator Response:[JH] Your concern is duly noted.
-
michael sweet at 02:44 AM on 3 February 2014Warming oceans consistent with rising sea level & global energy imbalance
David Sanger,
Some of the behaviour of the ocean is not intuitive because the immense size of the ocean dwarfs peoples normal sense of how things behave. If a two liter soda bottle expands 1/10,000 of its volume from a change in temperature, you would be hard pressed to measure it. If the deep ocean (over 4,000 meters) expands a similar amount, that is 40+ cm of sea level rise. Even very small changes in ocean volume add up to a lot of sea level rise. When the ocean shifts, even a little, people next to the ocean must be wary.
-
davidsanger at 01:59 AM on 3 February 2014Warming oceans consistent with rising sea level & global energy imbalance
grindupBaker@35 Rob Painting@37 Thanks. So it sounds like even though at sea level freshwater at 4º or less does not expand when heated, that with the salinity and higher pressure, the deep ocean below 700m is actually expanding as it heats and thus adding a little to searise.
-
Vonnegut at 01:51 AM on 3 February 2014There is no consensus
Is there any hope of getting the true facts bout the mythical 97% like just how many climate scientists there are and which way they voted?
Moderator Response:[JH] Read Skeptical Science Study Finds 97% Consensus on Human-Caused Global Warming in the Peer-Reviewed Literature. if you have further questions on this topic, post them there.
-
DavidFaubion at 01:30 AM on 3 February 20142014 SkS Weekly News Roundup #5
> Climate and vaccine deniers are the same: beyond persuasion, by Clive Hamilton
The author's argument compares apples and cauliflower. The site proctor ought to remove the piece for that reason and others. The piece uses the same old divisive us and them mentality. It attacks what the author of it has to rely upon his own source to prove; thus, the piece has a gratuitous sense implied onto it. The piece distracts us as it reduces the site to a tabloid or at best a newspaper opinion column. In fact, the site would do well to leave out all mention and attention to the climate denying minuscule minority and their personality disorders.
-
Vonnegut at 01:25 AM on 3 February 2014CO2 is coming from the ocean
But Oceans outgas co2 also where does this fit in the equation?
Moderator Response:[TD] The exchange rates of CO2 going in and coming out of the oceans are known, along with the factors that influence those two rates. The net effect currently still is much more going in that coming out. See installment 9 of the OA is Not OK series.
-
michael sweet at 00:21 AM on 3 February 2014Corrections to Curry's Erroneous Comments on Ocean Heating
The argument that the warming of the deep ocean is heat removed from the system is obviously bunkum. Where do you think the energy that is currently melting the bottom of Antarctic Ice cap and Greenland is coming from? Warmer water at depths of 500-2000 meters. Upwelling water in various locations, including the west coast of North America (thats the USA) will be warmed from this absorbtion of energy. If the upwelling water is warmer, that will result in more warming of the adjacent land. It may be decades or centuries before the final effect is felt from this warming, but the upwelling water is warmer now than it was 50 years ago from this effect. It is simply false to claim that the heat is gone.
-
michael sweet at 00:20 AM on 3 February 2014Corrections to Curry's Erroneous Comments on Ocean Heating
Vonnegut:
The ocean is cold because cold water is denser than warm water. Cold water forms in the Arctic and Antarctic regions and sinks to the bottom. More warm water from the tropics flows at the surfce to the poles where it cools and sinks. This cold polar water eventually returns to the surface in a variety of different ways. The density difference between cold, salty bottom water and the warm surface prevent effective mixing. This is basic High School Science, no need to ask the experts.
-
Vonnegut at 23:03 PM on 2 February 2014Corrections to Curry's Erroneous Comments on Ocean Heating
Nobody is arguing that the heat sequestered in the deep ocean will suddenly return to the surface. Some fraction of it, from the upper ocean, may reappear as an El Niño event, but some is irreversibly mixed and forms part of the inevitable warming and equilibration of the ocean to a warming climate.
So what is the big issue?
I would suggest the best approach would be to ask that, given these folk are so well informed about how the oceans operate, could they explain why the oceans are so cold? The air above has an average temperature of about 14ºC and the rocks beneath sit on the planet's core with a temperature of 5,000ºC. So why are the oceans only 1ºC?If the experts dont know why, why should anyone else?
Moderator Response:[JH] Please lose the sarcastic tone.
-
chriskoz at 20:41 PM on 2 February 2014Warming oceans consistent with rising sea level & global energy imbalance
grindupBaker@36,
Which lecture by Dan Lubin are you referring to? Is it related to the latest dark snow project by Jason Box? Is Dan's research indeed new, not considered by AR5?
In any case, I disagree it would have 'deserved its own line'. Perhaps it is already factored in 'cloud adjustment' component, because I see that component changed from -0.7 in AR4 to -0.55 in AR5...
However this can be OT here so I if you want further discussion maybe it should be moved to another thread.
-
MA Rodger at 20:25 PM on 2 February 2014Corrections to Curry's Erroneous Comments on Ocean Heating
I reckon that invoking the 2nd Law of Thermodynamics within climatology is aboutas daft as invoking Newton's 3rd Law within road safety. I assume Judy Curry considers herself an 'expert' on thermodynamics becasue she understands it beter than the Skydragon Slayers, a bunch of grade-A air-heads who make a great deal of the 2nd Law & who Curry has crossed swords with in the past.
Curry usually adds the 'if it's well mixed' caveat to her assertion which is strange because the deep ocean isn't well mixed. I understand this is mostly due to the isostatic pressure being the major factor in the ocean's density profile resulting in a lot of stratification. (Note that inlike the one here, a lot of 'density v depth' graphs ignore the isostatic element.)
 It is also strange that Curry, a strong believer in big natural variation, is here dismissing the role of the deep oceans in such variation.
mgardner @7.
The denialist argument that deep ocean warming is harmless - Beyond ENSO as per @8, I would suggest the best approach would be to ask that, given these folk are so well informed about how the oceans operate, could they explain why the oceans are so cold? The air above has an average temperature of about 14ºC and the rocks beneath sit on the planet's core with a temperature of 5,000ºC. So why are the oceans only 1ºC?
-
chriskoz at 20:07 PM on 2 February 2014Warming oceans consistent with rising sea level & global energy imbalance
Tom@33,
You convinced me that the number we've looked at (0.3W/m2/decade) can be overestimated: the data we've considered confirms your conclusion. Indeed, using the Foster and Rahmstorf figures is more appropriate in my method @29 and leads to a lower value, thanks for pointing that.
Re my integrity: thanks. All I care about is the correctness of science. That's an obvious bottom line all users of this blog should follow.
-
Rob Painting at 16:55 PM on 2 February 2014Warming oceans consistent with rising sea level & global energy imbalance
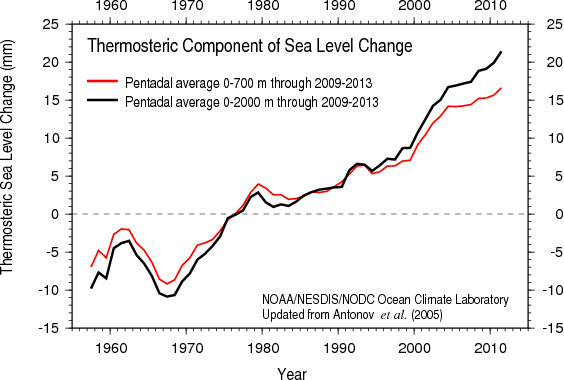
David Sanger @ 34 - though not negligible, only a small amount of warming is occurring below the 2000 metre depth. For the effects of warming on the expansion of seawater for 0-700 & 0-2000 metre depth ranges, see the image below from the National Oceanographic Data Center (NODC).
-
rajeshagarwal at 15:48 PM on 2 February 2014There is no consensus
Following on 581 Steve B, I would like to know how many of the abstracts explicitly endorse that humans caused most of the global warming? From what I understand of the data, there were only 75 such abstracts. Correct me if I am wrong. I am a newbie and not terribly scientific, but I understand numbers. Would someone care to explain?
-
grindupBaker at 15:41 PM on 2 February 2014Warming oceans consistent with rising sea level & global energy imbalance
KR #22 chriskoz #29 I see histogram graphs show net aerosol -ve forcing. I found Dr. Dan Lubin lecture interesting. He says aerosols constrained in Arctic through winter by Polar Night Jet alter clouds to give a forcing of +3.4 w/m**2. If he means from latitude 70N (he doesn't say) at 6% of Earth surface that would be +0.20 w/m**2 of aerosol forcing which I would have thought deserved its own line because of its contrary effect to aerosols elsewhere.
-
grindupBaker at 15:13 PM on 2 February 2014Warming oceans consistent with rising sea level & global energy imbalance
davidsanger #34 I made the same mistake 4 weeks ago because I just assumed salt water and pressure have negligible effect, but they have important effect. I found variation in quoted numbers and not a full set, but roughly I found like:
Volumetric thermal expansion coefficient of sea water (various salinities) at atmospheric pressure
Pure 20 25 30 35 40
H2O ---- grams salt / kg -----
Volumetric coefficient γ at 25 °C (*10**−6/K) 264 270 278 282 288 **
Volumetric coefficient γ at 20 °C (*10**−6/K) 207 241 248 256 263 270
At 4,000m depth pressure at 20 °C 280
Volumetric coefficient γ at 15 °C (*10**−6/K) 192 201 211 221 230
Volumetric coefficient γ at 10 °C (*10**−6/K) 88 136 148 160 171 182
Volumetric coefficient γ at 5 °C (*10**−6/K) 15 73 88 101 115 128
Volumetric coefficient γ at 0 °C (*10**−6/K) -67 40 56 70 84/52 100 **
At 4,000m depth pressure at 0 °C 130
** Very approximate because do not have values above/below. At a depth of 4000 m the bottom water (about 0 °C, salinity 35 g kg−1)My table format didn't align in this post. Bottom line is that thermal expansion coefficient is +ve, even below 0C.
-
davidsanger at 14:00 PM on 2 February 2014Warming oceans consistent with rising sea level & global energy imbalance
This may be elementary physics, but I have seen one argument that the thermal coefficent of water is close to zero for water nearo freezing, and can even be negative for water between 0 and 4ºC. Can someone clarify if heating of the deep ocean volume contributes much to sea level rise? Does it relate to the pressure?
-
Jonas at 12:39 PM on 2 February 20142014 SkS Weekly News Roundup #5
>Climate and vaccine deniers are the same
No, they are not: science depends on who pays, because those who pay determine the questions asked.
In case of climate science, it's world wide govenrments with no interest in promoting a problem which potentially cuts their energy supply. Deniers are the money makers (world wide oil bill is 365 d/y * 90 million barrels / d * 100 $/barrel = 3 285 000 million $ / y = 3285 billion $/y = 3,285 Trillion $/y. Research money and renewable energy is peanuts. There is way more conflict of interest to take care of on the denier side than on the science side.
In case of medical science, basic physical facts like immunization are clear, but enhancements via aluminium and other (secret) ingredients and their side effects are not (in my opinion, I am just a lay person). And here (as opposed to climate science), research questions are payed for more by the money makers, i.e. the ones who are interested in not getting any critical results.
I believe in the scientific method, but I do not beleive in humans, especially if they make money from a thing and if they are talking about it. I am a skeptic and I will remain so: I think climate change is happening, man made and has bad (even very bad) consequences, because I tried to study evidence and skeptic arguments, but I am not convinced that the medical industry is researching everything it should research in the general interest, nor do I think genetic engineering industry does: too much money at stakes ... (they might come to the conclusion that vaccine amplifications like aluminium only harm a low percentage of the population, but this should be openly discussed/researched and the costs have to be assumed (via developing other enhancement methods): health is not a good like any other good, just as water, food, shelter and other basic goods are not: freedom is not the freedom to harm others for ones own profit).
-
chriskoz at 11:37 AM on 2 February 20142014 SkS Weekly News Roundup #5
I note two different pieces in this roundup reporting on the same news: Mike Mann's lawsuit against CEI & NRO. First by Newsweek (A change in the legal climate) and second by Al Jazeera (Prominent scientist suing climate change deniers for libel). It's revieling to compare them.
Newsweek text is somewhat bloated (twice as long as Al Jazeera text) and full of spurious in-line comments (like 'this is ugly stuff', etc). Al Jezeera reports only the facts & who said what, leaving all interpretation to the reader; their minimal use of spurious words makes text streamlined and easy/fast to read/understand.
But more notably, Newsweek's article title is just meaningless: it sound like random word rambling rather than a careful sentence drawing reader's attention to the contents as a good title should be. Al Jazeera's title is good in that respect.
Further, and most apaulingly, Newsweek's photo shows Mann applauding former President Bill Clinton during a rally for Democratic gubanatorial candidate Terry McAuliffe. Excuse me, what that photo has to do with the topic at hand? IMO, the author was extremely careless (if not biased by some hidden agenda) in showing something he should not have shown in that context. Al Jazeera's photo is neutral and apropriate.
In summary, Newsweek has lot to learn from Al Jazeera about good, accurate journalism to deliver simple and unbiased news to the reader. Meanwhile, if given a choice I'm about to turn to Al Jazeera as my future news source.
Moderator Response:[JH] Thanks for the feedback.
-
paisiello at 10:38 AM on 2 February 20144 Hiroshima bombs worth of heat per second
Nevermind, I worked it out. I realize that, obviously, if you know the energy rate then multipyling it by the time gives you the total energy directly. The area under the curve would give you the Joule*years of the system which I am not sure if that can be interpreted as anything significant.
-
paisiello at 10:19 AM on 2 February 20144 Hiroshima bombs worth of heat per second
Thanks for this informative website.
I was trying to derive the 2 billion atomic bombs number. I can see where the rate comes from the slope of the global heat accumulation graph:
8x10^22 J / 10 years = 8 x 10^21 Joules per year
=2.5 x 10^14 Joules per second
Now over a 17 year period this should be equal to:
(8 x 10^21 Joules per year )(17 years) x 1/2 = 6.8x10^22 J total
= 1.08 billion atomic bombs
or 1/2 of the 2 billion number since we are trying to determine the area under the curve to determine the total heat energy.
What mistake am I making?
of global heat accumulation is equivalent to about 4 Hiroshima bomb detonations per second. That's nearly 2 billion atomic bomb detonations worth of heat accumulating in the Earth's climate system since 1998, when we're told global warming supposedly 'paused'.
-
grindupBaker at 09:08 AM on 2 February 2014The Oceans Warmed up Sharply in 2013: We're Going to Need a Bigger Graph
I did some sample numbers for a "cool skin" post comment 18 October 2011 by Rob Painting but since there's some OHC numbers questions & answers here, I'm using it as an excuse to re-post my thoughts.
Minnett & Kaiser-Weiss GHRSST 12-Jan-2012 has a graph of ocean skin temperature variation. Here are my sample or average global ocean numbers, derived backwards to give the Sun's 161 w/m**2 exiting but nonetheless illustrative and legitimate as nearly as matters (because I trust the competency of ORAS4).
temperature:
1,000m depth temperature = 5C
thermal conductivity of seawater 0.58 W/mK
ocean-air interface = 17.000C
1.441mm depth temperature = 17.400C (the warmest spot in the ocean depth though the "few metres" of depth below it is only a miniscule bit colder, all warmed by Sun SWR)
this top 1.441mm depth is the "skin" and "sub-skin"
100m depth temperature certain in range 16.090C to 17.400C but virtually certain >17C because of mixing top ~90m
temperature gradient of top 1.441mm of ocean is 277.6 Celsius/metre
By conductivity, temperature gradient pushes 161.00 w/m**2 up from 1.441mm depth to ocean-air interface which precisely removes the Sun's 161 w/m**2 going into the top few metres depth and leads to no ocean warming.AGW increases downward LWR and air temperature directly above ocean with extreme rapidity of a few decades, which warms ocean-air interface by 0.700C, so:
ocean-air interface = 17.700C
1.441mm depth temperature = 18.097C
temperature gradient of top 1.441mm of ocean is 275.5 Celsius/metre
By conductivity, temperature gradient pushes 159.79 w/m**2 up from 1.441mm depth to ocean-air interface which leaves 1.21 w/m**2 of the Sun's 161 w/m**2 going down into the ocean below and leads to ocean warming of 13.8 ZettaJoules / year (the billions of atomic bombs in sks widget). So, the difference of 0.003C in the warming over the top 1.441mm of ocean causes ocean warming that is 7.5 times as fast as the average post-glaciation ocean heat gain that moved the ecosphere from an ice age with glaciers down to New York State and today's climate and ecosphere warming that is 4.5 times as fast including all the "ice-age" glacier melt that happened.If the 1.441mm depth had warmed by 0.700C same as the ocean-air interface then oceans would gain no heat, but the massive colder oceans below will only let 1.441mm to <several tens-to-hundreds of metres> depth warm by 0.697C and only when the entire ocean has warmed by 0.700C in a few thousand years will it let that 1.441mm depth warm the final 0.003C and stop heat gain with 4,100 ZettaJoules of heat having been added to the oceans, enough to melt 13,666,666 cubic kilometres of ice. Of course, that will never happen because the ocean-air interface is going to keep warming with the +CO2 that will keep happening and it's all going to accelerate.
Temperature gradient from 1.441mm (18.097C) to 1,000m (5C) depth is 0.01310 Celsius/metre
By conductivity, temperature gradient pushes 0.0076 w/m**2 down from 1.441mm depth to 1,000m depth.
This is only 0.6% of the actual heat transport of 1.21 w/m**2 because 99.4% is transported down by water circulation, mostly natural with shark & whales & krill helping a bit.Year 2013: surface skin has wamed a tiny fraction of 1C (not shown for comparison simplicity) and ocean mixing will not permit it to balance within 0.003C at the sub-skin (maybe also ocean happens to mix heat down a tad faster due to a natural variation), now will only let 1.441mm to <several tens-to-hundreds of metres> depth warm by 0.69462C instead of prior 0.697C (ocean-air interface at 0.70000C). Repeat above computation gives 158.834 w/m**2 up from 1.441mm depth to ocean-air interface which leaves 2.166 w/m**2 of the Sun's 161 w/m**2 going down into the ocean, giving increased warming rate of 24.65 ZettaJoules / year.
Values such as 0.70000C are not known with this precision but precision is irrelevant because it is the residual of the 0.7C anomaly (computed here as 0.003C per 1.441mm of near-surface depth for 2000-2010, 0.00538C for 2013) that is adding the ocean heat, so if actual at ocean-air interface were, say, 0.726C then it must be 0.723C at 1.441mm depth to reduce upward flux by 1.21 w/m**2 and cause the measured +138 ZettaJoules / decade. It's illustrative, you have to modify with the best data you can find.
-
BBD at 08:08 AM on 2 February 2014The Oceans Warmed up Sharply in 2013: We're Going to Need a Bigger Graph
Rob Painting
Thanks for this and I very much look forward to your forthcoming series of posts on this topic. It seems little known and ripe for a wider audience. -
tcflood at 07:28 AM on 2 February 2014The Oceans Warmed up Sharply in 2013: We're Going to Need a Bigger Graph
Thanks Rob. I'll read the two posts you reference.
-
Rob Painting at 07:14 AM on 2 February 2014The Oceans Warmed up Sharply in 2013: We're Going to Need a Bigger Graph
tcflood - See these SkS posts:
1. New Research Confirms Global Warming Has Accelerated
2. Warming oceans consistent with rising sea level & global energy imbalance
The acceleration in ocean warming is matched by an acceleration in sea level rise, even when taking into account the increased loss of land-based ice over the recent decade. The trend is complicated though, with slowing in heat uptake after about 2005 - as can be seen in the Hiroshima widget.
Of course, the amusing part is that the fake-skeptics were proclaiming the ocean heat content data were the greatest thing since sliced bread about 4-5 years ago. That probably stemmed from the fact that only the upper 700 metre layer data was available, and that seemed to show ocean cooling - in contradiction to our understanding of Earth's energy imbalance. Of course we now know that much of the heat from above 700 metres was being pumped down into deeper layers below (Ekman pumping), and that the Earth was indeed still warming.
With the addition of 4-5 years more data the fake-skeptics are now proclaiming we don't have enough data. This is only because they don't like the implications, and simply demonstrates their pseudo-scientific approach to the issue.
-
tcflood at 06:46 AM on 2 February 2014The Oceans Warmed up Sharply in 2013: We're Going to Need a Bigger Graph
I don’t understand how it can be said so authoritatively that the rate of ocean heating has been rapidly accelerating recently. If you look at the table of ocean heating rates at various depths as a function of time given in the posting directly below this post, it seems that from 0-700 m the rate of heating since 2004 has slowed compared to 1983-2004, and we don’t have any good data below 700m until the Argo data started flowing in (2005-2008?).
With so little data, where does the confidence of the heating acceleration claim come from?
-
Rob Painting at 06:28 AM on 2 February 2014Corrections to Curry's Erroneous Comments on Ocean Heating
mgardner - the heat returns from the oceans (so-to-speak) virtually everytime El Nino occurs. Are they denying that that happens too?
One way of looking at this is to consider that we will eventually return to a period dominated by El Nino. During El Nino heat stored in the upper layers of the ocean (mainly the western tropical Pacific) surfaces and then is exchanged with the atmosphere, thereby making it (global surface temperatures) warmer-than-average.
The graphic below (Roemmich & Gilson [2011] - The Global Ocean Imprint of ENSO) is derived from ARGO subsurface temperature observations for the region 60°N-60°S, the red line denotes the positive/negative phases of ENSO, and the black line is the sea surface temperature anomaly. Note the change from 2007-2008 (La Nina) to 2009-2010 (El Nino) - sure looks like heat coming back to the surface.
-
Rob Painting at 05:59 AM on 2 February 2014The Oceans Warmed up Sharply in 2013: We're Going to Need a Bigger Graph
BBD - I am working on a series of posts explaining the wind-driven ocean circulation, whose mean state is characterised by the sea surface temperatures evident in the Interdecadal Pacific Oscillation Index, but I'm kind of stuck on illustrating the Coriolis Effect. Hope to have that finished within a couple of weeks.
I can direct you toward scores of research papers on the subject, but I'm not sure how much sense they would make without understanding of the Coriolis force, particularly the east-west component, and Ekman pumping. The textbook; Atmosphere, Ocean and Climate Dynamics an Introductory Text by John Marshall & Alan Plumb is useful, as is the MIT GFD lab - where the 'weird properties' of rotating fluids is demonstrated in simple lab experiments.
The Zhang & McPhadden papers do indeed highlight the spin-down and then spin-up of the wind-driven ocean circulation, but one place to start is: Interaction between the Subtropical and Equatorial Ocean Circulations: The Subtropical Cell - (McCreary & Lu 1994). Typing either 'subtropical cell' or 'Pacific decadal variability' into Google Scholar will yield lots of papers on the subject.
-
BBD at 03:34 AM on 2 February 2014The Oceans Warmed up Sharply in 2013: We're Going to Need a Bigger Graph
@ Rob Painting
WRT your comment here can you provide some suggested reading? It sounds like you may be basing some of this on McPhadden & Zhang (2002) and (2004)? Is there more?
This is a particularly fascinating phenomenon and I find myself completely (ahem) at sea. Any and all pointers welcome. -
Matt Fitzpatrick at 01:30 AM on 2 February 2014The Oceans Warmed up Sharply in 2013: We're Going to Need a Bigger Graph
@14
It'd be better to say the oceans gained about 50 ZJ (zettajoules) of heat from 1980 to 1998, then about an additional 150 ZJ of heat from 1998 to 2013.
I'll admit I had to look up the "zetta-" prefix. Big numbers.
-
JCSmith0007 at 00:50 AM on 2 February 2014The Oceans Warmed up Sharply in 2013: We're Going to Need a Bigger Graph
Is it correct to say that the amount of heat absorbed into the oceans since 1998 until now....is more than 4 times what it was in 1998? (ie 5 joules to 20 joules).
Moderator Response:(Rob P - all caps removed)
-
mgardner at 23:20 PM on 1 February 2014Corrections to Curry's Erroneous Comments on Ocean Heating
I registered with SKS (great blog) specifically to request that you guys do a piece (in precise, simple language, with graphics,) on this crazy meme about "the heat can't return from the oceans". It isn't just Curry, and every time I see it it grates like fingernails on a chalkboard.
Phil and chriskoz, It doesn't even rise to the level of misunderstanding the Second Law. In fact, the language used (even by some trying to debunk) smacks of the 19th century concept of heat as a mysterious fluid flowing through hypothetical pores in all materials.
Although the ocean systems are complex, and time scales are a confounding factor in visualizing effects, I think a simple diagram or animation would show that of course mechanical transfer of warmer water to a lower stratum is going to eventually result in warmer upper layers.
Thanks to anyone who takes this on-- I don't have the graphic skills myself. I will do my best to constructively critique any effort in the language department, although I doubt it will be necessary. -
Tom Curtis at 21:13 PM on 1 February 2014Warming oceans consistent with rising sea level & global energy imbalance
My apologies, I made the same mistake that Chriskoz corrected for @31. Correcting, and using the Foster and Rahmstorf figures leads to an energy imbalance increase of 0.12 W/m^2 per decade. (Calculated as 0.35 - (0.17/0.75) W/m^2 per decade.)
Chriskoz, thanks for your integrity in reporting corrections regardless of their impact on the argument you are trying to make. That sort of integrity is too rare, and I greatly appreciate it.
-
Tom Curtis at 21:05 PM on 1 February 2014Warming oceans consistent with rising sea level & global energy imbalance
chriskoz:
1) My post was primarily to illustrate that a growing energy imbalance is consistent with, and indeed required (on average) with a constantly growing forcing. Pluging realistic figures into the equations, however, reveals a probable discrepancy in the OP which had been commented on, and which therefore I also reported. I did not claim that my estimate was accurate. Only that the discrepancy was sufficiently large that a 0.3 W/m^2 figure was dubious.
In general, to have a mean decadal increase in energy imbalance of 0.3 W/m^2, it must be the case that the growth in forcing times (1-TCR/ECS) = 0.3 Even with ECS and TCR at, respectively the upper and lower end of the likely range from AR5, that requires a decadal growth of forcing of 0.39 W/m^2, significantly more than the figure you derived from the AR5 chart. Alternatively, with a decadal increase in forcing of 0.35 W/m^2, you need a ratio of TCR/ECS = 0.14, ie, that the ECS by 7 times the TCR. Neither of these conditions is plausible. Therefore I can be confident that the increase is not 0.3 W/m^2, without pretending to know how much less than 0.3 W/m^2 it is.
I note with interest your calculation using GISTEMP data, but unless you are committing to the belief that the current low temperatures relative to trend represent an actual reduction in the trend rather than the effects of transient features such as ENSO fluctuations, using the actual temperature value will lead to a poor estimate of the further evolution of the energy imbalance. Using the Foster and Rahmstorf adjusted GISTEMP trend of 0.17 C/decade, we get a temperature increase over three decades of 0.51 C, with short term fluctuations eliminated. That drops your figure to 0.22 W/m^2 per decade, which is certainly reasonable, but not definitive.
2) Rather than Fig 1, which only shows model outputs, I will show Fig 7, which shows emperical (reanalysis) estimates along with the model outputs from Fig 1:

I note two things. First, the energy imbalance according to the model has been declining since 1995. Over that period, with a decadal increase of 0.3 W/m^2, it should have risen to about 1.5 W/m^2, which is noticably outside the montly standard deviation. That strongly suggests that a trend rate of 0.3 W/m^2 is inconsistent with the model over the last two decades.
Second, the reanalysis values are very eratic on both monthly and 1-3 year time scales. That means estimating the decadal trend from that data will be very hard. However, overall it follows the models quite will, which does not support a 0.3 W/m^2 per decade increase.
To summarize, energy imbalance will increase on average with constantly increasing forcing. With current forcing changes, the increase is likely less than 2.5 W/m^2, and possibly much less. Consequently, it is a mistake to say it is 0.3 W/m^2. I remain interested to see if Rob Painting or Kevin Trenberth (in particular) can give us a more accurate estimate.
Prev 770 771 772 773 774 775 776 777 778 779 780 781 782 783 784 785 Next


