


 Arguments


Corrections to Curry's Erroneous Comments on Ocean Heating
Posted on 30 January 2014 by dana1981, Rob Painting
Committed to the Cause Pause
Recently, Georgia Tech climate scientist Judith Curry, along with Texas A&M climate scientist Andrew Dessler, testified before a US Senate committee on the subject of climate change. While Dessler's testimony was excellent and well-supported by the body of scientific evidence, Curry's contained a number of errors (i.e. see the Guardian on global warming attribution, Eli Rabett on Antarctic sea ice, and Tamino on Arctic warming and sea level rise, for starters).
Curry's main and most flawed argument was that information in the latest IPCC report should decrease our confidence in human-caused global warming; an argument she based in large part on the supposed global warming 'pause', which is itself a fictional creation. While the warming of average global surface temperatures has slowed (though not nearly as much as previously believed), the overall amount of heat accumulated by the global climate has not, with over 90 percent being absorbed by the oceans.
A few days after her Senate testimony, Curry took to her blog to dispute these data, essentially arguing that the amount of heat absorbed by the oceans has also 'paused', which would then support her arguments. However, in evaluating the ocean heat content data and scientific literature, Curry made a number of mistakes. This gives us an excellent opportunity to properly evaluate the science on rising ocean heat content and see what it tells us. The key points are:
- The deep oceans are warming rapidly in every data set that measures them (including those referenced by Curry).
- Sea levels are rising consistent with rapid ocean warming.
- The rate of ocean warming is consistent with the global energy imbalance.
- The geographic distribution of ocean warming is consistent with natural variability superimposed on a warming background state forced by the increased greenhouse effect.
- The global warming 'pause' is a fictional product of wishful thinking.
Deep Ocean Warming is a Reality
The following quote from her blog articulates Curry's primary misunderstanding on the subject of rising ocean heat content.
"The only data set that appears to provide support for ocean sequestration is the ocean reanalysis ... All in all, I don’t see a very convincing case for deep ocean sequestration of heat."
The ocean reanalysis Curry refers to is Balmaseda et al. (2013). A ‘reanalysis’ is a climate, ocean or weather model simulation of the past that incorporates data from historical observations. However, as we recently discussed, the increase in deep ocean heat content is a robust result in data sets that do not include reanalysis. In fact, in her blog post Curry discusses a new paper by Lyman & Johnson (2013) that directly contradicts her assertion. The paper relies on observational, not reanalysis data, and concludes,
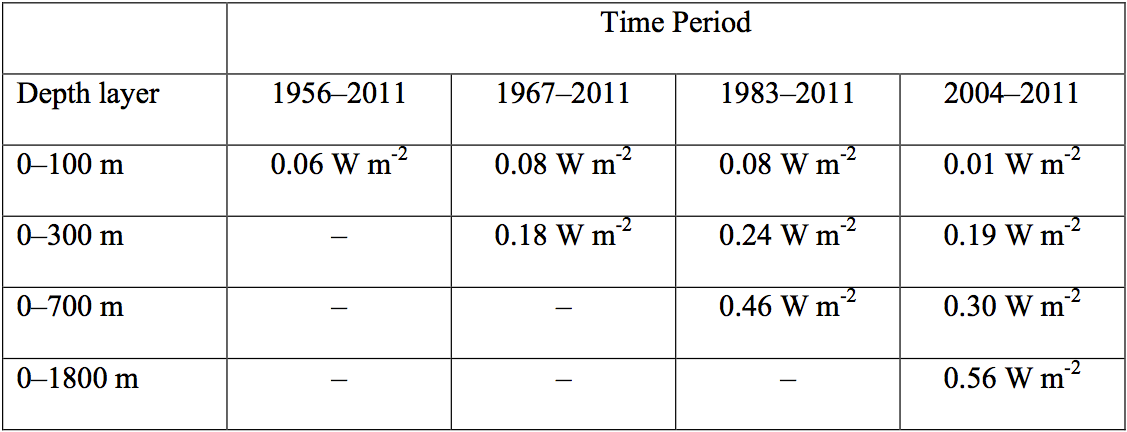
"In recent years, from 2004 to 2011, while the upper ocean is not warming, the ocean continues to absorb heat at depth (e.g., Levitus et al. 2012; von Schuckman and Le Traon 2011), here estimated at a rate of 0.56 W m-2 when integrating over 0–1800 m."
The paper also includes this useful table illustrating that according to observational data, ocean heat content has indeed accumulated rapidly in the deep oceans in recent years. Of the heat accumulating in the upper 1,800 meters of oceans for 2004–2011, 46 percent was sequestered in the deep oceans (below 700 meters).
To be clear, there's nothing wrong with using reanalysis data. In fact, the Balmaseda et al. (2013) fills in gaps in observations most comprehensively by utilizing all kinds of data as well as using ocean models. The fact that they're able to resolve volcanic eruptions and El Niño events suggests that the reanalysis may be more accurate than purely observational data sets that cannot resolve these events. However, the key point here is that the observational data, including Curry's own reference, contradict her point by finding substantial deep ocean heat sequestration over the past decade.
Science Isn't Done by Eyeball
Another problem with Curry's analysis is that she simply eyeballs the ocean heat content graph in Lyman & Johnson (2013) and concludes that since 2003, the data look flat.
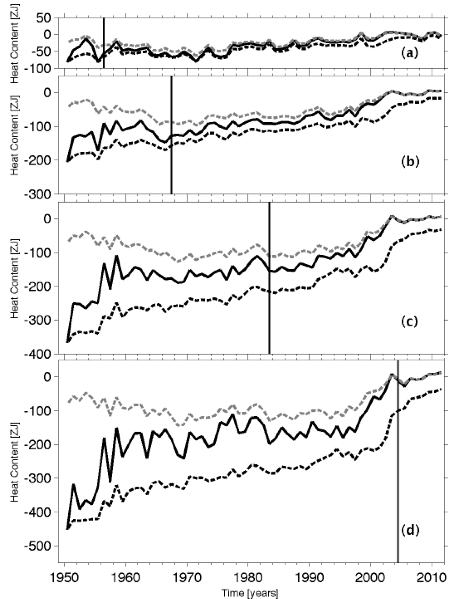
Time series of annual average global integrals of upper ocean heat content anomaly (1021 J, or ZJ) for (a) 0–100 m, (b) 0–300 m, (c) 0–700 m, and (d) 0–1800 m. Thin vertical lines denote when the coverage (Fig. 3) reaches 50% for (a) 0–100 m, (b) 100–300 m, (c) 300–700 m, and (d) 900–1800 m. From Lyman & Johnson (2013)
Scientists don't rely on their eyeballs because our senses can introduce bias and deceive us. The data in the figure above may look relatively flat after 2003, but as the table above shows, they are not. For 2004–2011, the data show the oceans accumulating heat at a rate of 0.19 W/m2 (3x10²¹ J/yr) in the upper 300 meters, 0.30 W/m2 (5x10²¹ J/yr) in the upper 700 meters, and 0.56 W/m2 (9x10²¹ J/yr) in the upper 1,800 meters. The latter number is equivalent to 4.5 Hiroshima atomic bomb detonations per second – a far cry from a global warming 'pause'.
Ocean Heat Accumulation Consistent with Satellite Observations
We also know from satellite observations that the planet is accumulating heat due to a global energy imbalance (measured at the top of the atmosphere). A new paper by Trenberth et al. (2014) notes that the amount of heat accumulating in the global climate (most of which is absorbed by the oceans) is generally consistent with the observed global energy imbalance (see the previous post for further details). If the ocean were to stop warming as Curry suggests, it would require an explanation of where the energy from the global imbalance is going.
Curry also suggests that because they're not globally uniform, recent changes in ocean heat content "most likely reflects natural internal variability. It doesn’t look like an AGW signal." Again, if heat were simply shifting between ocean basins naturally, it would require an explanation of where the energy from the global imbalance is going. The problem with breaking the data out into individual ocean basis as Curry does is that it's easy to then lose sight of the global picture. The oceans as a whole are building up a lot of heat. That long-term global ocean heat buildup has to be caused by an external forcing like the increased greenhouse effect. The oceans aren't just going to naturally start accumulating zetajoules of heat – that heat has to come from somewhere.
As for the variation in heat content gain in each basin; this is no great surprise, as there is an exchange of water masses between the ocean basins. Most of the deep ocean warming is occurring in the subtropical ocean gyres - vast rotating masses of water in each ocean basin where near-surface currents converge and are forced downward into the ocean interior. When the tropical easterly trade winds strengthen, as they have from the year 2000 onwards, this whole wind-driven ocean circulation becomes more vigorous, the South Pacific subtropical gyre spins up, and the western arm of the gyre exports more tropical water through the Indonesian archipelago into the Indian Ocean. Likewise, the more vigorous ocean circulation forced by stronger trade winds forces more heat to be exported from the Indian Ocean, around the southern tip of Africa, into the South Atlantic.
Although it cannot be discounted that long-term warming is affecting this circulation in some way, a large part of this recent behavior is likely to be natural variation associated with the vigorous or sluggish phases of the ocean circulation. Whenever the wind-driven ocean circulation switches phase in the future, the current basin-scale warming pattern will change. Weak export of tropical water out of the Pacific during that phase should see a build-up of heat in the Pacific basin. In other words, what we are seeing is probably natural variability in this circulation against a warming background ocean state forced by the increased greenhouse effect.
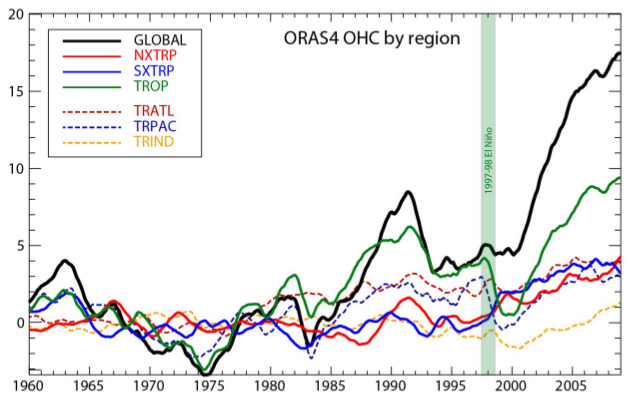
Ocean heat content by region in the ORAS4 reanalysis by Balmaseda et al (2013). NXTRP=northern extratropics, SXTRP=southern extratropics, TROP=+/-30° latitude, TRATL=tropical Atlantic, TRPAC=tropical Pacific & TRIND=tropical Indian ocean. Units are in 10 22 Joules. Despite short-term variability in ocean heat content storage, each region has experienced long-term warming.
Early-Mid 20th Century Ocean Heat Content and Sea Level Rise
Curry also argues that the rate of sea level rise during 1930–1950 was similar to that in recent years, according to the IPCC, which suggests that ocean heat content was increasing at a similar rate to today. She then argues that this can't be attributed to human-caused global warming, which presumably implies something about the current rise in ocean heat content.
First, while the early 20th century warming was likely predominantly naturally-caused (i.e. low volcanic activity and increasing solar activity), there was also a significant human contribution as greenhouse gas emissions began to ramp up. Second, according to most estimates, the rate of sea level rise today is higher than the rate during 1930–1950 as shown in the IPCC report and Rahmstorf et al. (2012). Third, tide gauge coverage 70 years ago was not as good as today's, and much of the variability is simply due to noise and factors like coverage bias, as discussed by Rahmstorf et al. (2012) and Tamino.
Fourth and most importantly, the argument is a non sequitur – the conclusion doesn't follow from the premise of the argument. Yes, global warming events have occurred naturally in the past, and sea level rose as a consequence, but that doesn't tell us anything about the causes of the current global warming. This is akin to seeing a dead body with a knife sticking out the back and arguing that it must have been a natural death because people have died naturally in the past.
The Pause is Imaginary, Real Heat Will Come Back to Haunt Us
The bottom line is that all available ocean heat content data show that the oceans and global climate continue to build up heat at a rapid pace, consistent with the global energy imbalance observed by satellites. In recent years, much of that heat has accumulated in the deep oceans. Curry misunderstands the importance of this fact.
"even if the heat from surface heating of the ocean did make it into the deep ocean, presumably the only way for this to happen involves mixing (rather than adiabatic processes), so it is very difficult to imagine how this heat could reappear at the surface in light of the 2nd law of thermodynamics."
Nobody is arguing that the heat sequestered in the deep ocean will suddenly return to the surface. Some fraction of it, from the upper ocean, may reappear as an El Niño event, but some is irreversibly mixed and forms part of the inevitable warming and equilibration of the ocean to a warming climate.
While the warming of global surface temperatures in recent years has slowed in large part due to the more efficient heat transfer to the deep oceans, that can't last forever. When that trend reverses, as past observations suggest it will, we'll experience an acceleration of warming at the Earth's surface.


Tamino has a new and unusually good--even by his high standards--post on why there is no 'hiatus' even in atmospheric global temperatures.
http://tamino.wordpress.com/2014/01/30/global-temperature-the-post-1998-surprise/#more-6942
I've often used the analogy to wildfires when somebody says that "climate's changed before, I guess it was the dinosaurs driving their SUVs?" or something to that effect. The reply is that wildfires happened before any of the first humans were born, then ask if this implies that no wildfires are casued by people today.
For people who aren't prepared to accept that there actually is a knife in the victim's back (that we KNOW the Greenhouse Effect is playing the principal role right now), this is a subtler way to undermind their confidence in the myth of "just natural warming."
Tamino's post (noted by Wili) would be good here at SkS. I am sure he would agree to cross post it.
Is it just me, or does anyone else think that Curry's comment about the 2nd Law of Thermodynamics make an unreasonable assumption about what is going on ?
As I understand it, areas of the Planet such as the atmosphere, upper ocean, deep ocean etc. should, in a perfect(ly mixed) world increase in temperature uniformily (i.e. in step with each other). However kinetic processes can imped heat flows between these different areas, allowing localised heat gradients to temporarily occur. Presumably, eventually the gradient gets so steep that a tipping point occurs and the Planet shifts into another phase where another area of the Earth warms preferentially to the others.
However the 2nd law of thermodynamics would only be relevant if we knew the rate at which the deep ocean was warming (or whatever area of the Earth was relevant at the time) was still below the "uniform" rate. If it wasn't then we would expect the 2nd law to "encourage" heat to be released.
Curry's statement therefore implies to me that she knows the deep oceans are still "playing catchup". Is she justified in this ? Or am I misunderstanding something ?
Phil@4,
Curry's nonsense statement involving 2nd law of thermodynamics appears to be the result of misunderstanding (or intentional misleading given her expertise) of the processes involved.
"Heat" does not come from the ocean. It comes from the sun. The GHG influence is to retain the incoming sun heat (due to TOA radiative imbalance), not procude it. Where in the OA system said retained heat goes, depends on local variations in insolation, weather etc. Those variations exists now and will always be. And they are unpredictable (weather), i.e. the energy flows between parts of the system may go back and forth depending on the differing amounts of heat said parts recieve, eg. due to variations in isolations. 2nd law of thermodynamics does not aply here. It applies to an isolated system in terms of energy flow. OA system is not isolated in that respect as everybody enjoying bathing in sunshine knows.
I'm sure Curry (climate scientist) understands the basics of OA system and 2nd law of thermodynamics better than I do (my degree is in unrelated discipline) so I think she applies said basic law of physics bogusly to intentionally mislead the listener. It is far less likely that she screws the science up because she does not understands it.
While it is good to sea evidence that heat is indeed being taken up by the oceans, the “pause” in atmospheric temperatures is indeed a myth based on a poor understanding of statistics. Permit me to reproduce part of argument I posted at Jo Nova’s blog.
LINK
The first rule of statistics is make sure your sample size is big enough for your result to be meaningful.
"That is where end points come in. It’s not really the end points that matter as such, but the number of years between the endpoints, or how big the data set. That is why I harp on about short data sets. Because of the “noise”, relatively minor variations in temperatures between different data bases can lead to significant differences between linear fits for short time frames. With longer time frames the signal to noise ratio improves and there is good agreement between the linear fits.
When comparing the two satellite data bases UAH and RSS which began in 1979, the regression lines are quite different for 15 years but very similar since 1979.
LINK
But the real problem is not apparent from just looking at the regression lines. They do not show how the error margins blow out for short data sets.
http://www.skepticalscience.com/trend.php
For both the RSS and UAH data from 1979, there is a statistically significant warming trend.
UAH Trend: 0.138 ±0.070 °C/decade (2σ)
RSS Trend: 0.125 ±0.069 °C/decade (2σ)
For data since 1999, the error margins are so large that it cannot be said with any confidence that the data shows warming, cooling or a pause.
UAH Trend: 0.146 ±0.212 °C/decade (2σ)
RSS Trend: 0.027 ±0.211 °C/decade (2σ)
Although the linear regression line values are quite different, the error margins mean that there is considerable overlap between the 95% confidence limits so the two data sets are in fact in statistical agreement.
Returning to the matter of end points. If moving an end point by a single year makes a large difference to the trend line, it is a sure sign that your data set is too short and the results not statistically meaningful.
LINK
From 1999 UAH Trend: 0.146 ±0.212 °C/decade (2σ)
From 1998 UAH Trend: 0.060 ±0.223 °C/decade (2σ)
Note again that the large error margins means the trends are statistically in agreement, but cannot tell whether the data shows a warming or cooling trend."
[RH] Fixed links that were breaking page format.
I registered with SKS (great blog) specifically to request that you guys do a piece (in precise, simple language, with graphics,) on this crazy meme about "the heat can't return from the oceans". It isn't just Curry, and every time I see it it grates like fingernails on a chalkboard.
Phil and chriskoz, It doesn't even rise to the level of misunderstanding the Second Law. In fact, the language used (even by some trying to debunk) smacks of the 19th century concept of heat as a mysterious fluid flowing through hypothetical pores in all materials.
Although the ocean systems are complex, and time scales are a confounding factor in visualizing effects, I think a simple diagram or animation would show that of course mechanical transfer of warmer water to a lower stratum is going to eventually result in warmer upper layers.
Thanks to anyone who takes this on-- I don't have the graphic skills myself. I will do my best to constructively critique any effort in the language department, although I doubt it will be necessary.
mgardner - the heat returns from the oceans (so-to-speak) virtually everytime El Nino occurs. Are they denying that that happens too?
One way of looking at this is to consider that we will eventually return to a period dominated by El Nino. During El Nino heat stored in the upper layers of the ocean (mainly the western tropical Pacific) surfaces and then is exchanged with the atmosphere, thereby making it (global surface temperatures) warmer-than-average.
The graphic below (Roemmich & Gilson [2011] - The Global Ocean Imprint of ENSO) is derived from ARGO subsurface temperature observations for the region 60°N-60°S, the red line denotes the positive/negative phases of ENSO, and the black line is the sea surface temperature anomaly. Note the change from 2007-2008 (La Nina) to 2009-2010 (El Nino) - sure looks like heat coming back to the surface.
I reckon that invoking the 2nd Law of Thermodynamics within climatology is aboutas daft as invoking Newton's 3rd Law within road safety. I assume Judy Curry considers herself an 'expert' on thermodynamics becasue she understands it beter than the Skydragon Slayers, a bunch of grade-A air-heads who make a great deal of the 2nd Law & who Curry has crossed swords with in the past.
Curry usually adds the 'if it's well mixed' caveat to her assertion which is strange because the deep ocean isn't well mixed. I understand this is mostly due to the isostatic pressure being the major factor in the ocean's density profile resulting in a lot of stratification. (Note that inlike the one here, a lot of 'density v depth' graphs ignore the isostatic element.)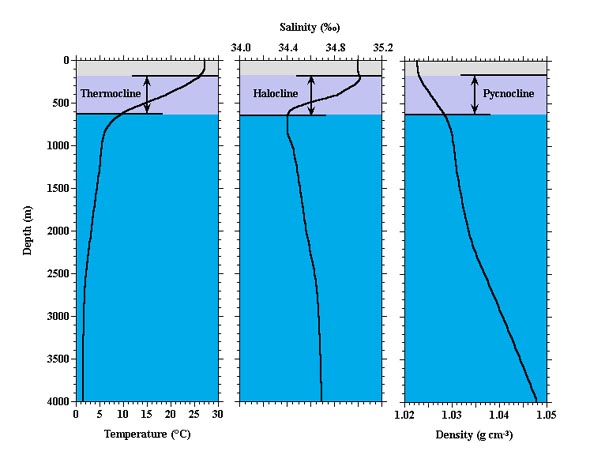 It is also strange that Curry, a strong believer in big natural variation, is here dismissing the role of the deep oceans in such variation.
mgardner @7.
The denialist argument that deep ocean warming is harmless - Beyond ENSO as per @8, I would suggest the best approach would be to ask that, given these folk are so well informed about how the oceans operate, could they explain why the oceans are so cold? The air above has an average temperature of about 14ºC and the rocks beneath sit on the planet's core with a temperature of 5,000ºC. So why are the oceans only 1ºC?
I would suggest the best approach would be to ask that, given these folk are so well informed about how the oceans operate, could they explain why the oceans are so cold? The air above has an average temperature of about 14ºC and the rocks beneath sit on the planet's core with a temperature of 5,000ºC. So why are the oceans only 1ºC?
If the experts dont know why, why should anyone else?
[JH] Please lose the sarcastic tone.
Vonnegut:
The ocean is cold because cold water is denser than warm water. Cold water forms in the Arctic and Antarctic regions and sinks to the bottom. More warm water from the tropics flows at the surfce to the poles where it cools and sinks. This cold polar water eventually returns to the surface in a variety of different ways. The density difference between cold, salty bottom water and the warm surface prevent effective mixing. This is basic High School Science, no need to ask the experts.
The argument that the warming of the deep ocean is heat removed from the system is obviously bunkum. Where do you think the energy that is currently melting the bottom of Antarctic Ice cap and Greenland is coming from? Warmer water at depths of 500-2000 meters. Upwelling water in various locations, including the west coast of North America (thats the USA) will be warmed from this absorbtion of energy. If the upwelling water is warmer, that will result in more warming of the adjacent land. It may be decades or centuries before the final effect is felt from this warming, but the upwelling water is warmer now than it was 50 years ago from this effect. It is simply false to claim that the heat is gone.
MA Rodger@9,
I'm not an expert oceanographer, so before I ask, I'd like to know the detailed asnwer. My current knowledge is as shallow as freshwater reservoirs (small lakes), where water stratification is determined by its density:
with the consequence that bottom water never falls below 4C (most dense water sinks to the bottom) allowing e.g. fish to survive in winter because the lake freezes from the top only.
In slatwater however, the playground determining stratification is different:
which means saltwater becomes heavier all the way to the freezing point. That can mean for example that in cold ocean, i.e. in the arctics, water can freeze from the bottom (and then lighter ice shunks float up to the surface) but haven't I heard of such phenomenon yet? That's perhaps because bottom ocean water does not go all the way to freezing point but just to 1C, as you said...
I understand that bottom ocean does not equilibrate with 5000C of Earth crust because of slow mixing with colder water coming from arctic, as explained by michael sweet@11, thanks!. I presume siad mixing is the slow deep ocean mixing with an overturning rate of ~1-2ky, according to my current knowledge, please confirm or correct me. So, is 1C temp of bottom ocean a "sweet equilibrium spot" of sinking and mixing processes involved?
chriskoz #13 The tentative info I've found is that salt water freeze point at a pressure of, say, 4,000m depth is -15C (it's -1.9C at surface) so no freezing down there (someone please confirm that -15C number). Yes to the dynamic equilibrium sweet spot. It's an Oreo cookie with ice cream instead of fake cream. The balance temperature point depends on the ocean current flow rate of the below-zero water from the poles, as you say, the mixing rate from warm waters above (except at high latitudes) by way of mixing currents and octopi, and the average thermal conductivity of the Earth crust beneath down to the 5,000C zone (as from MA Rodger #9). I suggest taking the ocean thermocline shown by MA Rodger #9 and take it's 4,000m depth as the sea bed for illustrative example, then continue the thermocline down to the 5,000C zone based on that thermal conductivity of the Earth crust and if you get accurate data that will show you the heat flow from below (estimated at 0.08 wm**-2 globally geothermal heat, but not known precisely with much certainty). You can't deduce anything using heat conduction from warm waters above because you'll find it's so tiny that would take ~125,000 years to warm/cool the depths to same as surface following a surface MST anomaly if there were no currents bringing cold water through, so obviously the actual warming from waters above is 99%+ by fluid mixing.
Rob Painting (and others who responded).
After my comment @7, I did an eye-watering search of images to be sure I wasn't missing the obvious-- no luck, so let me elaborate on what I'm looking for.
The myth about 'trapped' or 'excluded' heat energy in the ocean relies on confusing people about the most basic facts and physics principles.
What I would like to see is a series of illustrations or animation that emphasize
1) That what is being transported is water at some temperature T1(not 'heat')
2) That when it is mechanically forced by your gyres to a lower stratum, which is above water at T3, it displaces the water at that stratum upward, which is at some T2, <T1 but >T3.
3) That this is a continuous process, so we are really seeing a vertical circulation, where the original surface water is going to reach an equilibrium T2a (dependent on turbulence), but which is >T2, and it will eventuall be diplaced upwards as well.
Now, that's my non-specialist understanding, which I'm happy to have corrected in the main (I know it's simplistic). But for this (and other) mechanisms, for the hypothetical naive but open-minded reader, a clear picture should do a much better job than all my words.
The problem is, all the pictures I can find tend to support the mythological position; in attempting to portray the various vertical changes in a single, static, image, they create this illusion that the temperature changes but the water remains in place. Hence my reference to "caloric theory"-- that's what the pictures remind me of.
grindupBaker @14.
Your -15ºC figure sounds about right for fresh water, so is probably okay for salt water as well. Ice changes its structure at about 200 bar so fresh water freezing would be coldest at about 2,000m, something below -20ºC.
Such values for freezing remain entirely academic outside an 'ice cube' earth which would be when the ocean waters become a part of geology.
chriskoz @13.
I hope you agree that it is quite simple to establish that the deep ocean is cold because of the cold polar winter atmospheres. Once people know this reason for cold oceans they should be less inclined to say:-
"Ha, ha. Idiot! If AGW causes deep ocean warming, so what? It's too cold down there. It can't come back and warm anything once its mixed in. Don't you know anything? Haven't you ever heard of the 2nd Law of Thermodynamics?"
This becomes silly because, evidently, the warmer deep ocean water is not too cold to provide warming in a polar winter, an environment that doesn't just cool water down, it freezes it solid.
And that warmer deep ocean water doesn't even have to get back up to the Arctic/Antarctic to do so. If deep waters are warmer, they will be less dense than before. To cool the oceans, the cold polar waters drop into the depths because they are more dense. An increase in that relative density can only strengthen that ocan cooling process. By thus creating cooler oceans, the atmsphere will experience a warming. Or haven't you head of the 1st Law of Thermodynamics, ha ha.
Of course this is ridiculously simplisitic. But it is being aimed at simpletons.
MA Rodger #16 Yes, it's the fallacious argument that a mass cannot warm a warmer mass, used in both atmosphere (radiation) and ocean comments (the fallacy that heat cannot increase at depth with also increasing shallower, and this "heat gone forever" one). It ignores the underpinning of the entire topic, that the system has heat transfer dynamic near-balance on kiloyear time scales, with a warming system and a cooling system near-balanced to keep it their. If part of the cooling system is warmed (deep cold waters that well up various places) then the whole system eventually warms to a new higher near-balanced temperature. I think the skeptic position on that is actually philosophical, even if not stated, because it's really saying it'll not be our grandchildren when it's (deep heat) moved from nuisance to catastrophe so we shouldn't consider it (OT for this post so I'm not commenting).
MA rodger and grindup baker @16,17:
I'm looking for better images to clarify these concepts because words can be ambiguous, and used to the advantage of those trying to confuse and obfuscate.
1) "deep" But there is circulation in the 700m to say 1500m range, and there is much deeper, polar thermohaline, as well as some polar thermohaline in the upper range, if I understand correctly. The mechanisms are different, as well as the magnitudes (like temp differences) and consequently time scales.
2) "fallacious argument that a mass cannot warm a warmer mass" Well, that's actually not a fallacy, if you are using conventional language. Which is what the mythologizers count on. You correctly point out the result of juxtaposing such masses, but it is a matter of the cooler mass cooling the warmer mass less than a cooler cooler mass would.
So, with that bit of confusing verbiage, I renew my request: Does anyone know of or could you create some kind of illustrations/animation that show masses (water) being displaced vertically when there is e.g. Eckman pumping, and something that shows net conventional heat transfer, but applied to this particular subject?
The idea being to preclude the obfuscation about both the qualitative aspects and the magnitudes.
[PW] Unnecessary white space removed.
mgardner@18,
I found these slides (Lecture on Thermohaline circulation (THC) with several pictures that maybe of interest to you. For example:
Page 5 'simpleton' overview
Page7 explanation of circumpolar currents and gyres
Pages 16+ (Sandstrom Theorem) explain the mechanisms and structure of ocean circulation
Page 24 upwelling
chriskoz@19
Thanks. I did come across one of those images in my image search, but there is some other good stuff in there.
Regarding Judith Curry's comments, NASA researchers recently published a study which appears to support Dr. Curry's contentions:
A separate study in August (2014) in the journal Science said the apparent slowdown in the Earth's surface warming in the last 15 years could be due to that heat being trapped in the deep Atlantic and Southern Ocean.
But the NASA researchers said their approach, described in the journal Nature Climate Change, is the first to test the idea using satellite observations, as well as direct temperature measurements of the upper ocean.
"The deep parts of the ocean are harder to measure," said researcher William Llovel of NASA JPL.
"The combination of satellite and direct temperature data gives us a glimpse of how much sea level rise is due to deep warming. The answer is — not much."
NASA Study Finds Earth’s Ocean Abyss Has Not Warmed
http://www.nasa.gov/press/2014/october/nasa-study-finds-earth-s-ocean-abyss-has-not-warmed/
[TD] There is a post here on SkS about that paper.