


 Arguments


Evidence for global warming
What the science says...
| Select a level... |
 Basic
Basic
|
 Intermediate
| |||
|
There are many lines of evidence indicating global warming is unequivocal. |
|||||
Climate Myth...
It's not happening
"...these global warming studies that now we're seeing (are) a bunch of snake oil science." (Sarah Palin)
At a glance:
It's now 14 years since Sarah Palin was on the record as having provided the above quote, at a logging conference in California. In that time, much has happened in the world of climate change. We can have a quick catch-up, by examining the 2022 State of the Climate report, published in the Bulletin of the American Meteorological Society in 2023.
In 2022, the carbon dioxide concentration in the atmosphere rose to 417 ppm. That's 50% greater than the pre-industrial level. Global mean methane abundance was 165% higher than its pre-industrial level, Nitrous oxide was 24% higher.
Record or near-record heat was widespread in 2022 and even more so in 2023. In 2022, Europe observed its second-warmest year on record, with sixteen individual countries observing record warmth at the national scale. Records tumbled, many with huge increases as summer heatwaves plagued the region. On 18 July, 104 weather-stations in France broke their all-time temperature records in a single day. On the 19th, England recorded a temperature of 40°C for the first time. China experienced its second-warmest year and warmest summer on record. In the Southern Hemisphere, the average temperature across New Zealand reached a record high for the second year in a row. Western Australia reached 50.7°C on 13 January, equaling Australia's highest temperature on record.
Sea-surface temperature patterns in the tropical Pacific were characteristic of La Niña, a phenomenon that should have mitigated against atmospheric heat gain at the global scale. However, the annual global surface temperature across land and oceans was among the six highest in records dating as far back as the mid-1800s. 2022 was the warmest La Niña year on record.
At the time of writing, there is still about a month of 2023 to run. Yet once again we have record-breaking temperatures, with some records smashed by huge margins, so that 2023 looks as though it may well go down as the hottest on record.
'Snake oil science'? No, these are records of things actually happening, right now. Not only are they being recorded, they are being witnessed by countless people worldwide. They add to the growing mountain of scientific evidence, showing without any doubt that Earth's climate system is overheating, as predicted by the laws of physics from more than a century ago. If some politician or other insists to the contrary, just ask yourself what particular expertise entitles them to make such utterances? Are they really smarter than all the tens of thousands of scientists who work hard to collect and analyse the data?
Beware. Politicians tend to be good at talking politics on most topics and they are especially adept at telling people what they want to hear. But in cases like this, we can clearly see that events have a tendency to catch up with them in the longer term. Beware.
Please use this form to provide feedback about this new "At a glance" section. Read a more technical version below or dig deeper via the tabs above!
Further details
The original version of this rebuttal was based on the 2009 State of the Climate report of the US National Oceanic and Atmospheric Administration (NOAA), released in mid-2010. The report had a 10-page summary (PDF) examining the trends for 10 key climate indicators using a total of 47 different sets of data. The current 2022 State of the Climate report, published in September 2023, has its highlights on this web page.
It's now fourteen years on from 2009. Even the IPCC's Sixth Assessment Report is already dated, due to the phenomenal record-busting events of 2022 and 2023. Within a year or two of this rebuttal's publication, it will almost certainly need updating again. That's what happens when we are caught in a massive problem that is moving erratically - but progressively - in one direction. Let's see what has happened in various areas of the climate system since 2009.
Global surface temperature:
All of the ten warmest years on record occurred in the post-2010 period in a record going back into the 19th Century (fig. 1). A particular distinction of 2022 was that it was the warmest La Nina year on record, surpassing the previous record - set in 2021. La Nina, roughly the opposite to El Nino, is an oceanic current phenomenon that dampens global temperatures. At the time of writing, El Nino is in progress and it's highly likely that its effect - amplifying global temperatures, will nudge us towards another record warm year.
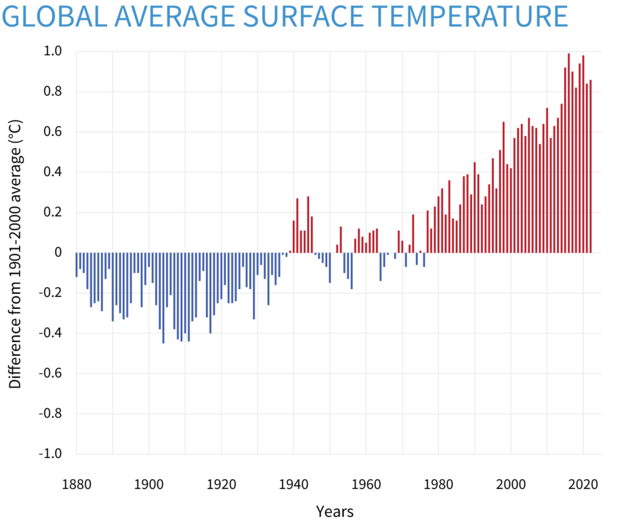
Fig. 1: Yearly surface temperature compared to the 20th-century average from 1880–2022. Blue bars indicate cooler-than-average years; red bars show warmer-than-average years. NOAA Climate.gov graph, based on data from the National Centers for Environmental Information.
Ocean heat content and sea levels
The oceans are a huge heat-sink. We know that over the past half-century, they have stored more than 90% of the excess energy trapped in Earth’s system by greenhouse gases. That global ocean heat content (fig. 2), measured from the ocean’s surface to a depth of 2,000 meters, continues to increase as we continue to pollute. Mostly as a consequence of thermal expansion, so far, global mean sea level has broken records 11 years in a row to 2022. In 2022 it reached 101.2 mm - or 4 inches - above the 1993 average - when satellite altimetry measurements began.
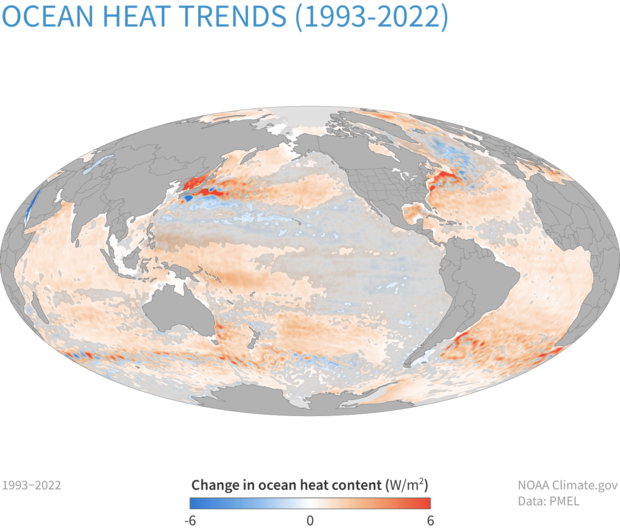
Fig. 2: Change in heat content in the upper 2,300 feet (700 meters) of the ocean from 1993-2022. Overall, the ocean gained more heat than it lost. Graphic: NOAA Climate.gov image, based on data from NCEI.
Marine heatwaves have become commonplace. Some 58% of the ocean surface experienced at least one period of heatwave conditions in 2022 (fig. 3). A marine heat wave is detected when ocean surface temperatures are above the 90th percentile for five or more consecutive days. They are classified as follows. When the temperature difference from average (or anomaly) during such an event is less than double the 90th percentile for the seasonal anomaly, the heat wave is classified as moderate. When the anomaly is more than double, triple, or quadruple the 90th percentile for the seasonal anomaly, the heatwave is categorized as strong, severe, or extreme, respectively.
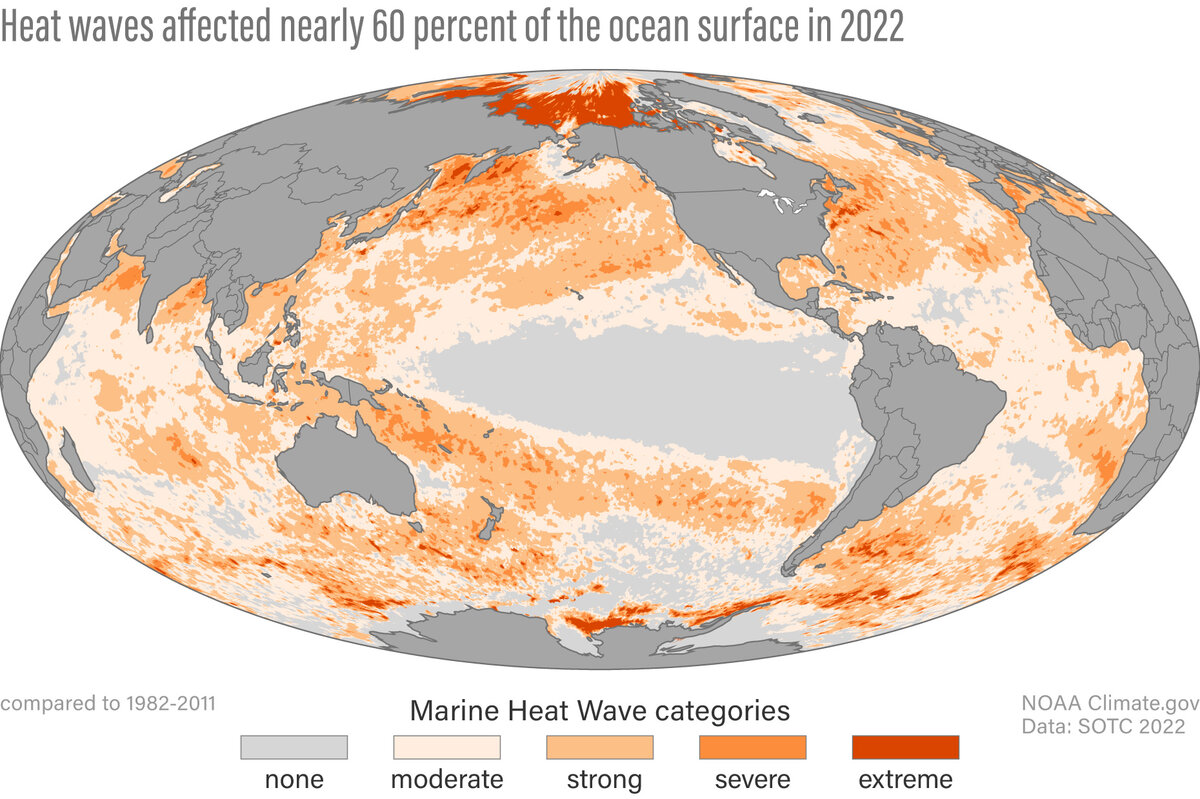
Fig. 3: Global map showing the distribution of marine heatwave conditions in the oceans during 2022, based on analysis of NOAA ocean temperature measurements (OISST). Graphic: NOAA Climate.gov, based on analysis and data from Robert Schlegel.
Heatwaves on land
Recent years have featured record-shattering heatwaves. Just to give one example, in July 2022 a 14-day heatwave swept through western Europe. A weather station in England recorded a temperature of 40 degrees Celsius (104F). That was a first in the UK temperature record. On July 18th, over 100 weather-stations in France broke all-time temperature records in just a single day. Such extreme European heat resulted in unprecedented melting of glaciers in the Alps, with over 6% of their volume – a record loss - recorded in Switzerland alone.
With prolonged, record breaking hot dry weather there comes the increasing risk of wildfire and 2022 was no exception to the rule - nor 2023 for that matter. Attribution studies, already done for 2022 (e.g. Rodrigues et al. 2023), have suggested this is something we are going to have to get used to.
In the Polar regions:
In 2022, the Arctic saw its fifth-warmest year in the 123-year record and the ninth-consecutive year that Arctic temperature anomalies were higher than the global mean, providing clear evidence of the phenomenon known as Arctic amplification. With Arctic amplification there comes sharp reductions in ice, both on land and at sea. Eight of the ten lowest Arctic sea-ice minima have occurred since 2010 (source: National Snow and Ice Data Center). State of the Climate 2022 additionally points out that multiyear ice - ice that has survived at least one summer melt season - continued to decline. Since 2012 in particular, the Arctic has been nearly devoid of ice that is more than four years old.
At the other end of the world, Antarctic sea-ice has behaved more erratically but this year its extent has nosedived, often being some two million square kilometres less than the 1981-2010 average. This massive meltdown has shocked people whose business it is to study that part of the world and it is currently fair to say that the mechanisms involved are a hot research topic.
Droughts
Drought is a huge problem and not only for those who live where it occurs. In the globalised world we have created, near-instant knock-on effects occur, such as food shortages. Just in 2022 alone, August saw record high areas of land across the globe (6.2%) experiencing extreme drought. Overall, 29% of land experienced moderate or worse categories of drought during that year. The record-breaking megadrought of central Chile continued in its 13th consecutive year, and in northern Argentina and Paraguay, 80-year record-low river levels occurred. The Yangtze River in China also reached record-low values. Much of eastern Africa had seen five consecutive below-normal rainy seasons by the end of 2022, with some areas receiving record-low precipitation totals for the year.
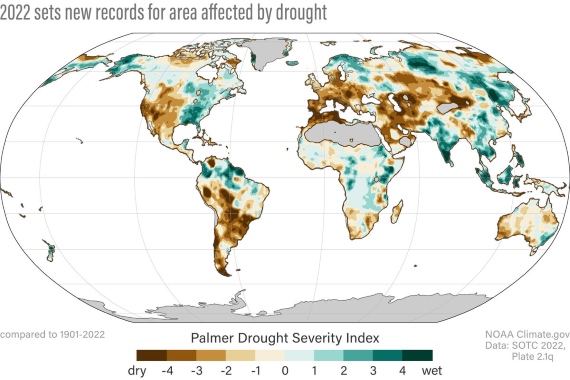
Fig. 4: Global drought area has been increasing since mid-2019, and it reached a new historical peak in October 2022. Graphic: NOAA Climate.gov image, adapted from the BAMS State of the Climate 2022, Plate 2.1q.
Drought conditions are made more prolonged when weather-systems move around the planet more sluggishly, so we end up with a greater frequency of quasi-stationary anticyclones - the so-called heat-domes. And indeed, another hot topic of research concerns how Arctic Amplification has reduced the Equator-Pole temperature gradient - the consequence of which has seemingly been to slow down the speed at which waves in the jet stream propagate around the world. The result is more 'stuck' weather systems. A recent paper in Nature (Preece et al. 2023 and references within) explores these issues and is discussed in an article at phys.org.
Fig. 5: more indicators of a warming world. This has only been a quick tour around a warming world. There are many other indicators, as fig. 5 (above) shows.
More or less: conclusion
The things that were expected to become more frequent and extreme on a warmer planet have become more frequent and extreme. The things that were expected to diminish on a warmer planet have diminished. And so on it goes, until our course is changed.
Last updated on 20 November 2023 by John Mason. View Archives


On the comment stream at Alex Knapp's Forbes blog:
Daniel Fisher (Forbes staff): "I am not sure the debate is over whether the climate is warming – obviously it has been getting warmer since the last Ice Age, which was a very short time ago. The question is whether that increase is accelerating in a non-random way, and the acceleration is caused by the measured increase in atmospheric CO2. Does this new method help unravel that?"
Bob Tisdale: "That would be difficult to show for a couple of reasons. First, the hypothesis of manmade global warming is only supported by general circulation models, which are known to be imperfect representations of the Earth’s climate systems. Second, that hypothesis is not supported by NOAA’s satellite-era sea surface temperature data or by NOAA’s ocean heat content data since 1955."
Is Tisdale paid?
I think this answer ought to be updated with the more detailed graphic over here:
http://www.skepticalscience.com/graphics.php?g=8
59F tomorrow for Buffalo. 15F above the daily average. Should they now think that temperatures have risen >10 times faster than IPCC thinks? Fact is, winter is coming, and it gets cold and snows a lot in Buffalo in the winter almost every year. Sometimes it gets warm again.
Ironically, though, the large amounts of lake effect snow have been linked to the warming of the lake, resulting in more evaporation, convective lift and, therefore, snow than previously seen. It interacted with a large actic air mass, of the sort we've been seeing that last few years. That pattern has also been attributed to global warming, though the jury is still out.
I would like it very much is this type of article, or at least this one in specific, were updated with the latest numbers. In this new age of Trumpism, we need the best ammo available, please.
Dennis, NOAA maintain a "State of Climate". For global view, updated Oct 2016, see https://www.ncdc.noaa.gov/sotc/global/201610
I like that you devide and explain each indicator clearly. Every evidences are really make sense follow your claim, but I just wondering how can it happen because the weather is become really hot nowadays and seems going to be hotter and hotter? Also ice ages are become smaller than what it was. How can the result be the opposite with the indicators? Is it because of there areb still many factors going on?
Thank you XD
Please note: the basic version of this rebuttal has been updated on November 19, 2023 and now includes an "at a glance“ section at the top. To learn more about these updates and how you can help with evaluating their effectiveness, please check out the accompanying blog post @ https://sks.to/at-a-glance