Climate Science Glossary

Term Lookup

Enter a term in the search box to find its definition.

Settings

Use the controls in the far right panel to increase or decrease the number of terms automatically displayed (or to completely turn that feature off).

Term Lookup

Settings


All IPCC definitions taken from Climate Change 2007: The Physical Science Basis. Working Group I Contribution to the Fourth Assessment Report of the Intergovernmental Panel on Climate Change, Annex I, Glossary, pp. 941-954. Cambridge University Press.

Home Arguments Software Resources Comments The Consensus Project Translations About Support

Twitter Facebook YouTube Mastodon MeWe

RSS Posts RSS Comments Email Subscribe


Climate's changed before
It's the sun
It's not bad
There is no consensus
It's cooling
Models are unreliable
Temp record is unreliable
Animals and plants can adapt
It hasn't warmed since 1998
Antarctica is gaining ice
View All Arguments...


Username
Password
New? Register here
Forgot your password?

Latest Posts

Archives

Why did climate cool in the mid-20th Century?

What the science says...

Select a level... Basic Intermediate Advanced

There are a number of forcings which affect climate (eg - stratospheric aerosols, solar variations). When all forcings are combined, they show good correlation to global temperature throughout the 20th century including the mid-century cooling period. However, for the last 35 years, the dominant forcing has been CO2.

Climate Myth...

It cooled mid-century

"It was the post war industrialization that caused the rapid rise in global CO2 emissions, but by 1945 when this began, the Earth was already in a cooling phase that continued until 1975. With 32 years of rapidly increasing global temperatures and only a minor increase in global CO2 emissions, followed by 33 years of slowly cooling global temperatures with rapid increases in global CO2 emissions, it was deceitful for the IPCC to make any claim that CO2 emissions were primarily responsible for observed 20th century global warming." (Norm Kalmanovitch)

Figure 1 compares CO2 to global temperatures over the past century. While CO2 is rising from 1940 to 1970, global temperatures show a cooling trend. This is a 30 year period, longer than can be explained by internal variability from ENSO and solar cycles. If CO2 causes warming, why isn't global temperature rising over this period?


Figure 1: CO2 green line derived from ice cores obtained at Law Dome, East Antarctica (CDIAC). CO2 blue line measured at Mauna Loa (NOAA). Global temperature anomaly (GISS)

The broader picture in this scenario is to recognise that CO2 is not the only factor that influences climate. There are a number of forcings which affect the net energy flux into our climate. Stratospheric aerosols (eg - from volcanic eruptions) reflect sunlight back into space, causing net cooling. When solar activity increases, the net energy flux increases. Figure 2 shows a composite of the various radiative forcings that affect climate.


Figure 2: Separate global climate forcings relative to their 1880 values (image courtesy NASA GISS).

When all the forcings are combined, the net forcing shows good correlation to global temperature. There is still internal variability superimposed on the temperature record due to short term cycles like ENSO. The main discrepancy is a decade centered around 1940. This is thought to be due to a warming bias introduced by US ships measuring engine intake temperature.


Figure 3: Net forcing (Blue - NASA GISS) versus global land ocean temperature anomaly (Red - GISS Temp).

So we see that climate isn't controlled by a single factor - there are a number of influences that can change the planet's radiative balance. However, for the last 35 years, the dominant forcing has been CO2.

Evidence of greenhouse warming in the mid-20th century

Additional insight into mid-century cooling comes from Impact of Global brightening and dimming on global warming (Wild et al 2007). The paper looks at trends in the amount of sunlight reaching the ground over the latter 20th century. Various factors can affect how much sunlight gets through to the Earth's surface, with the amount of aerosols in the atmosphere being the main contributor. And of course, the amount of sunlight reaching the surface will have an effect on global temperatures. Wild 2007 attempts to disentangle just how much contribution this surface dimming and brightening has on global temperature.

They start by looking at measurements of surface radiation from 1958 (when widespread measurements began). They find a period of "global dimming" from 1958 to 1990 where surface radiation fell. Afterwards, the dimming levels off and transitions to slight brightening from 1985 to 2002. While the warming during the period of solar dimming is moderate, the warming is more rapid in the last two decades where dimming was no more present.


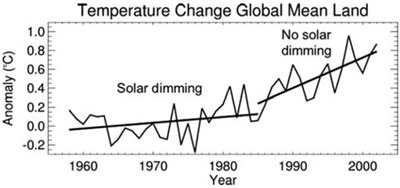
Figure 4: Temperature change over global land surfaces from 1958 to 2002 (Wild et al 2007).

How much does global dimming and brightening contribute to the temperature trends. To disentangle the effects of dimming and brightening from greenhouse warming, Wild digs a little deeper into the temperature record by looking at the daily temperature cycle. Sunlight affects the daily maximum temperature more than the nightly minimum, which is affected more by the greenhouse effect. What they find is from 1958 to 1985, during global dimming, the maximum daytime temperature falls. This makes sense as less sunlight is reaching and warming the Earth's surface. The interesting result is that over this period, the nighttime minimum temperature increases. While global dimming was cooling temperatures in the daytime, the increased greenhouse effect was warming in the nighttime.

From 1985 to 2002, the warming trend during the daytime increases significantly and almost catches up to the nighttime warming trend (almost but not quite). This is consistent with the surface radiation measurements which find global dimming levels off or transitions to brightening in the mid 1980s. Global dimming masked greenhouse warming until the 1980s. Once the atmosphere cleared and the dimming was removed, global warming came into its own.

Where did CO2 warming go during mid-century cooling? Global dimming caused by pollution masked the increased greenhouse effect. Nevertheless, the CO2 warming was still percolating away while we were sleeping.

Intermediate rebuttal written by John Cook


Update July 2015:

Here is a related lecture-video from Denial101x - Making Sense of Climate Science Denial

Last updated on 9 July 2015 by pattimer. View Archives

Printable Version  |  Offline PDF Version  |  Link to this page

Argument Feedback

Please use this form to let us know about suggested updates to this rebuttal.

Further reading

Open Mind has an interesting post Hemispheres that compares temperature records for both hemispheres over the past century and the significance for mid-century cooling.

Comments

Comments 1 to 23:

  1. John, recently on Irregular Climate you mentioned that in the mid-20th century, although the daily maximum temperature decreased, the daily minimum temperature increased. Can you add links to that evidence here? Thank you.
    Response: Always making work for me, aren't you James? Here's the original blog post about daily minimum temperatures increasing during mid-century cooling. I've integrated the blog post into the above info. Thanks for the suggestion (your ideas while making work for me are always good ideas).
  2. How does this relate to this recent article? http://www.physorg.com/news204381778.html The story suggests that sea temperatures actually did decrease sharply around this period of time, if I'm reading it right. I haven't read the details in Nature, so I haven't seen the details. It seems to contrast with some of what you have here.
  3. GSwift7, that paper may add something to the mechanism illustrated here, they're not mutually exclusive.
  4. from this site, above: "As a final point, it should be noted that in 1945, the way in which sea temperatures were measured changed, leading to a substantial drop in apparent temperatures. Once the data are corrected, it is expected that the cooling trend in the middle of the century will be less pronounced." From the other, newer story: "The international team of scientists discovered an unexpectedly abrupt cooling event that occurred between roughly 1968 and 1972 in Northern Hemisphere ocean temperatures. The research indicates that the cooling played a key role in the different rates of warming seen in the Northern and Southern Hemispheres in the middle 20th century" That seems prety much mutually exclusive to me.
  5. These both seem to be pro-global warming stories, so it doesn't really matter which one is right as far as I'm concerned. The matter of increased night-time temperatures also seems to be inconsistent with an actual drop in sea temperature. I actually wonder if the guys in the new story are serious. The theory here on this site seems to make more sense and seems to be more supported by known facts.
  6. GSwift7, if you're looking for pre-cooked anti-AGW informations, you're in the wrong place. If you're not interested in the science, again you're in the wrong place. And given that you definitely are in the wrong place, I do not understand why you ask questions.
  7. The temperature variations according to NOAA/NCDC dataset from 1880-2010 vs rising CO2 levels indicate no significant impact from CO2. However, the day/night variations explained above appear to be legitimate science and I applaud them for their work. The real worry may not be so much CO2 but a possible sudden release of Methane Hydrate from the sea bottoms and tundra bogs of Siberia.
  8. #7: "show no significant impact from CO2" That's absolutely incorrect, as the graph below (from NOAA/NCDC clearly shows). Where do you come up with such silliness? And of course, you're off topic. Find the appropriate threads using the search function.
  9. muoncounter : I would call this figure an unconvincing correlation, since the slope in the 1900-1940 period is quite comparable to the modern one, although CO2 was very different.
    Response: [Dikran Marsupial] yes, indeed, but CO2 is not the only forcing, not all warming is caaused by CO2 and nobody claims it is.
  10. Correlation isn't what it is about. The question is whether modelled temperatures using estimated forcing match the actual record. See IPCC WG1 for the answer.
  11. I agree , that's the point. And if I look at the comparison between models and data, I'm not convinced again that the agreement during the first half is so good Of course at first glance it seems that the match is almost perfect. But if you look carefully at the first half of the century, and if you look also carefully at the methodology used to produce these curves, you will notice that a) curves are generated by a variety of different models, which is really strange, since it means that different modelling can produce the same kind of visual output - this really means that observations are only LOOSELY constraining models - which is the opposite of a scientific validation. b) the models contain parameters , especially for clouds, so there is an obvious selection bias due to the fact that bad models are simply not selected here. In other words, adding a superposition of approximate models with a selection of parameters giving results close to the data, will ALAWAYS produce an interval, a corridor , containing these data - it's almost certain and doesn't prove much. Note how curiously the black observed curve travels throughout the corridor and never crosses the border : is it not surprising that a unbiased set of models just reproduces exactly the range of natural variability, without any "lost space" in the yellow interval or without the black curve goint out of it? this cannot for sure be obtained without a selection of the sample. c) models produce temperature that are not precisely matching the reality in absolute. What is displayed here is ANOMALIES. Anomalies with respect to which baseline ? you have to read carefully the report to find the answer : with respect to the 1900-1950 period. So the agreement at least on the central point of the first half is automatically insured - no surprise here. So the real test of the preanthropic period is not the average value, but the details of the shape around this value. Is it well reproduced ? not so much. The break around 1940 is NOT reproduced in models - it just the width of the interval that blurs out the comparison. The only break in the models are in major volcanic eruptions - first Agung in 1963. Note also that volcanic eruptions are NOT so conspicuous in data. Actually if you look only at data, you couldn't say when these eruptions occured, contrary to the models. So it seems that models "play" with eruptions to try to reproduce breaks that are not really at the right place - playing with a whole interval of parameters to blur out the disagreement. That is not, by far, what I would call an accurate fit of data.
  12. Giles@11: (a) No, the use of multiple models is not "really strage", it is not even unusual. There is uncertainty in the details of the physic is involved and in the parameters, the use of multiple models captures some of that uncertainty. Secondly if different models give similar results, that indicates that the uncertainty in the physics is small and the climate projections are not greatly sensitive to them. That is a good thing from the modelling point of view, not a bad one. If anything it actually means the data do constrain the models relatively tightly as it constrains them all to say the same basic thing. As to scientific validation, you obviously don't understand there is no such thing as scientific validation, only scientific invalidation. You can't prove a theory right, only disprove it. (b) Complaining that bad models are not selected is pretty daft, if the model is inconsistent with reality it means the assumptions underpinning that model are incorrect, so why should we look at it. The CMIP ensemble were not selected in that way, it is an ensemble of models from leading modelling groups, so your objection is incorrect anyway. Complaining that the black line doesn't go out of the corridor is basically saying "the models must be wrong because they give the right answer"! (c) The models should not expect to produce temperatures that precisely match the observations, that comment shows a complete lack of understanding of Monte Carlo simulation methods. We can't predict the chaotic weather, so the model runs will always be different. The model mean won't match the observations either as it is an estimate of only the forced component of climate, not the unforced response - the observed climate has both components so there is no reason to expect that close a match. "That is not, by far, what I would call an accurate fit of data" well possibly that is because you don't understand the effects of the major sources of uncertainty. Given internal climate variability (which models cannot be expected to be able to model), the hindcast is pretty impressive. However, I suspect this should be discussed further on another thread.
  13. 12: Dikran Marsupial
    However, I suspect this should be discussed further on another thread.
    and, indeed, was touched on previously in the Climate Sensitivity: The Skeptic Endgame where Giles didn't understand it either. Someone might do an intro to modeling, simulation, log-likelihoods and MC methods...
    Response: (Daniel Bailey) Are you offering...?
  14. And try comparing vs something else than GISS which is showing less cooling in mid 1900's and also less warming pre 1940. Like Hadcrut which has not been so heavily adjusted by the modelers. For example, look at the Model E outputs. Aerosols clearly do not explain the mid century cooling. GISS vs ModelE vs Hadcrut: http://i.picasion.com/pic38/0f6666b2060569d680da06c477670f9b.gif
  15. Between 1944 and 1980 there were more than 1800 nuclear explosions were conducted - many above ground - including the biggest H-bombs. This time period was a mini-nuclear winter.
  16. Hmm, I'm skeptical. Any evidence that aerosol loading from tests and large enough and continuous enough to have a significant effect on aerosol loading compared to industrial emissions?
  17. "Any evidence that aerosol loading from tests and large enough and continuous enough to have a significant effect..." Not much. It takes a yield of at least 50 ktons to make a cloud tall enough to reach the stratosphere. Large yield testing didn't begin until 1952; mid-century cooling started several years prior to that (there's a lag problem). And the USGS shows that it is not dust as much as sulfate aerosol that causes detectable multi-year cooling. About the only significant climate-scale result from nuclear testing is the C14 spike. And that doesn't make a blip in the older cosmic ray records.
  18. I have heard it said that the Pacific decadal oscillation superimposes a sine wave of variation onto the underlying warming trend line, http://en.wikipedia.org/wiki/File:PDO.svg and that this correlates to the multidecadal variation of the rate of rise.  Is there research that supports this?

  19. Here's an updated version of the 'Radiative Forcing since 1750' chart. There is even a section that shows the forcing in 1950 relative to 1750. It is NOT negative. Though I strongly suspect that since reconstruction of past aerosol concentrations and their effects on radiative forcing going back to 1750 is highly controversial and involves a lot of errors.

    Either way, the IPCC's AR5 version of that chart does not seem to support the notion that aerosols exerted enoguh negative forcing to contribute to a slight cooling trend.

  20. So NOW cfs's are going to COOL the planet?  This is the FIRST time I've ever heard anyone make that claim.  CFS's area  greenhouse gas and were linked to warming not cooling.  Make up your mind.

  21. LowneWolfe,

    Please read the OP again.  I believe you mean CFC's not CFS's.  As you claim, CFC's warm the planet.  The OP does not mention CFC's.

    Sulfate aerosols cool the planet.  These aerosols were emitted in large quantities during the mid centuary industrialization due primarily to coal burning.  When the USA and Europe got tired of toxic air pollution in the 1970's and controlled aerosols the underlying warming became evident.  

    China and India currently emit large amounts of aerosols which cool the planet and mask part of the CO2 caused warming.  Unfortunately, these aerosols are poorly measured and the exact magnitude of the effect is poorly bounded.

    If you want to learn more post again, we are happy to help you increase your AGW knowledge.

  22. Somebody should answer Chuck's question about PDO. I'd like to know too.

  23. Qwertie, well it is hardly a "sine wave", but yes it does contribute to variability about the trend in surface temperature in decadal scale. A couple of important points to note:

    1/ PDO does not appear to be  a single ocean dynamic feature but rather the expression of the sum of multiple underlying dynamics.

    2/ The PDO is inherently detrended. ie global average SST is substacted from the Pacific SST in calculating the index.

Post a Comment

Political, off-topic or ad hominem comments will be deleted. Comments Policy...

You need to be logged in to post a comment. Login via the left margin or if you're new, register here.

Link to this page


The Consensus Project Website

THE ESCALATOR

(free to republish)


© Copyright 2024 John Cook
Home | Translations | About Us | Privacy | Contact Us