


 Arguments


The Big Picture
Posted on 15 March 2023 by John Mason, BaerbelW, dana1981
As part of our Rebuttal Update Project, this version of The Big Picture article has been updated with more current data in February 2024. You can access the previous version here.
Note: clicking on the images will open a larger version in a separate tab.
It's easy to get bogged down discussing one of the many pieces of evidence behind human-caused global warming, to the extent that we can't see the forest for the trees. Here, we take a step back and see how all of those trees comprise the forest as a whole. Skeptical Science provides extensive resources that examine each individual piece of climate misinformation and rebuts them with hard evidence, so let's make use of these individual pieces to see how they form the big picture.
The Earth is Warming
We know the planet is warming from surface temperature stations and satellites measuring the temperature of the Earth's surface and lower atmosphere. We also have various tools which have measured the warming of the Earth's oceans. Satellites have measured an energy imbalance at the top of the Earth's atmosphere. Glaciers, sea ice, and ice sheets are all receding. Sea levels are rising. Spring is arriving sooner each year. There's simply no doubt - the planet is warming. Everything to do with temperatures is going up. Everything to do with snow and ice is decreasing. Species are migrating polewards and to higher altitudes (Figure 1).
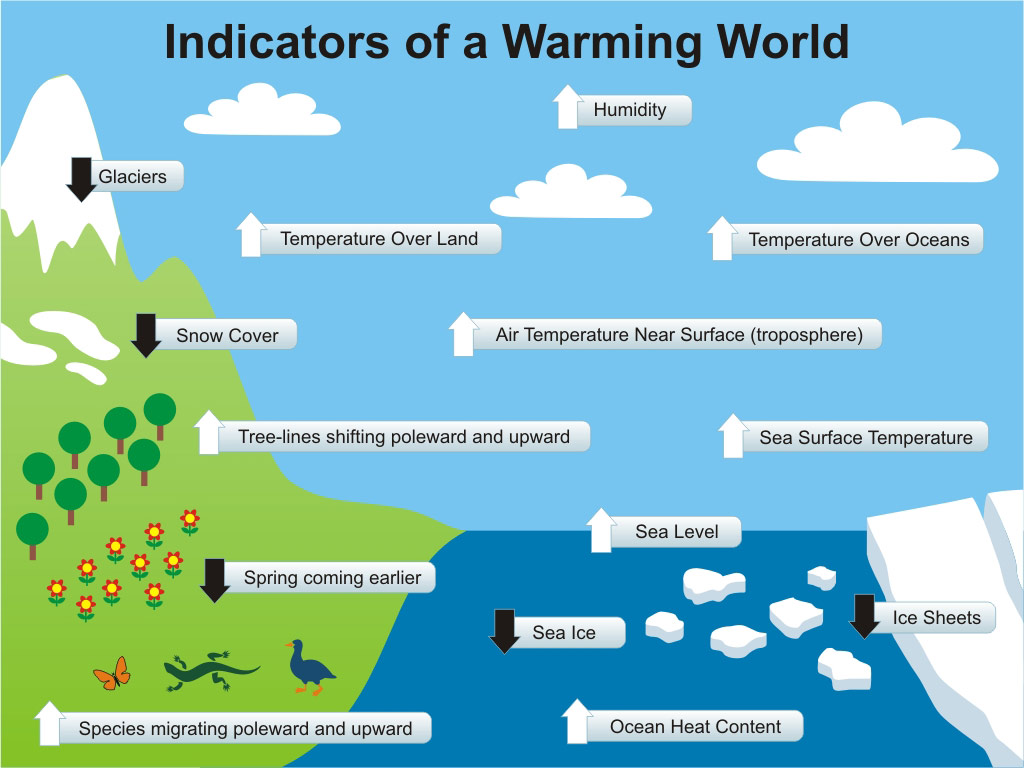
Figure 1: Indicators of a warming world (click for larger image)
Global Warming Continues
And yes, the warming is continuing. The 2010s were warmer than the 2000s, which were hotter than the 1990s, which were hotter than the 1980s, which were hotter than the 1970s. 2023 was the hottest year on record (Figure 2). Temperature datasets are in excellent agreement on this matter. Sea levels are still rising, ice is still receding, spring is still coming earlier and that planetary energy imbalance continues apace.
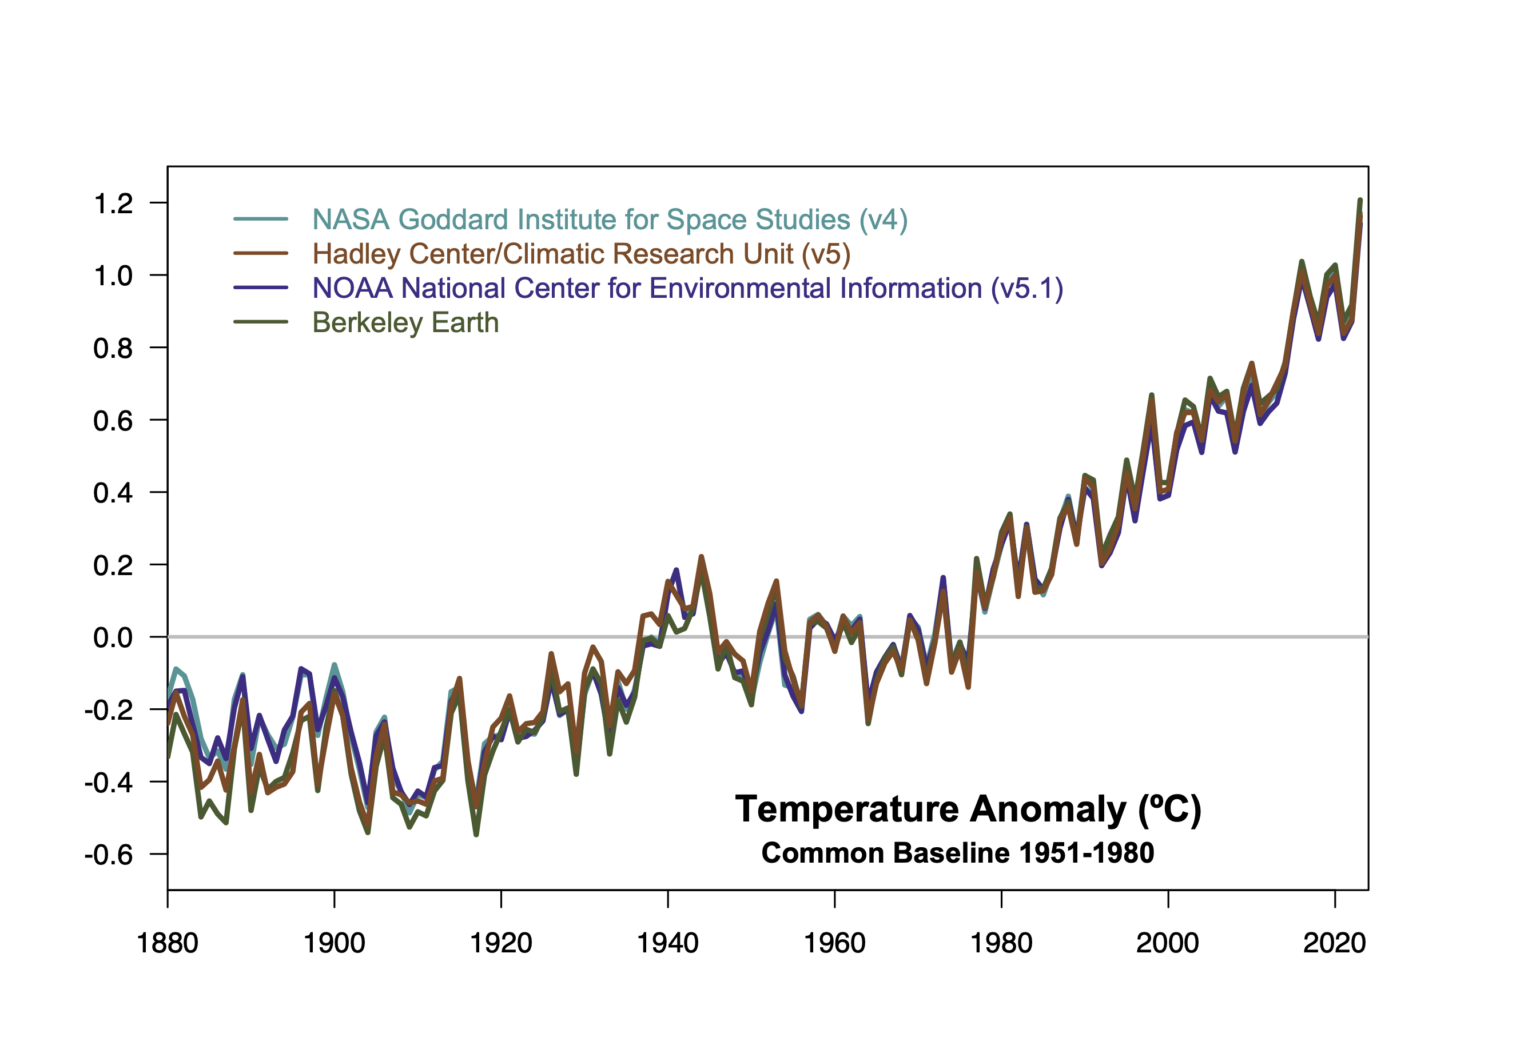
Figure 2: Four surface-station based estimates of global warming since 1880 (courtesy RealClimate)
Contrary to what the Merchants of Doubt would like us to believe, and they have tried this one more than once, the planet has not magically stopped warming. Those who argue otherwise are confusing short-term noise with long-term global warming (Figure 3).
Figure 3: This version of the Escalator graphic is based on data including the year 2022. The previous versions are still available here with data including 2015 or as a video including 2016. When Robert Rohde updated the escalator and produced a staircase of denial in January 2023, it motivated us to follow suit and to update our escalator with the latest available data as well. (click for a larger version)
El Niño-Southern Oscillation (ENSO)
Foster and Rahmstorf (2011) showed that when we filter out the short-term effects of the sun, volcanoes, and El Niño cycles, the underlying man-made global warming trend becomes even more clear (Figure 4).
Figure 4: Temperature data (with a 12-month running average) before and after the short-term factor removal, from Foster & Rahmstorf (2011).
Although such influences are sources of climate variability, the following plot of ENSO shows that El Nino (warm) and La Nina (cool) years, plus ENSO-neutral years (Figure 5), are all steadily getting warmer: they are simply noise on an upwards trend:
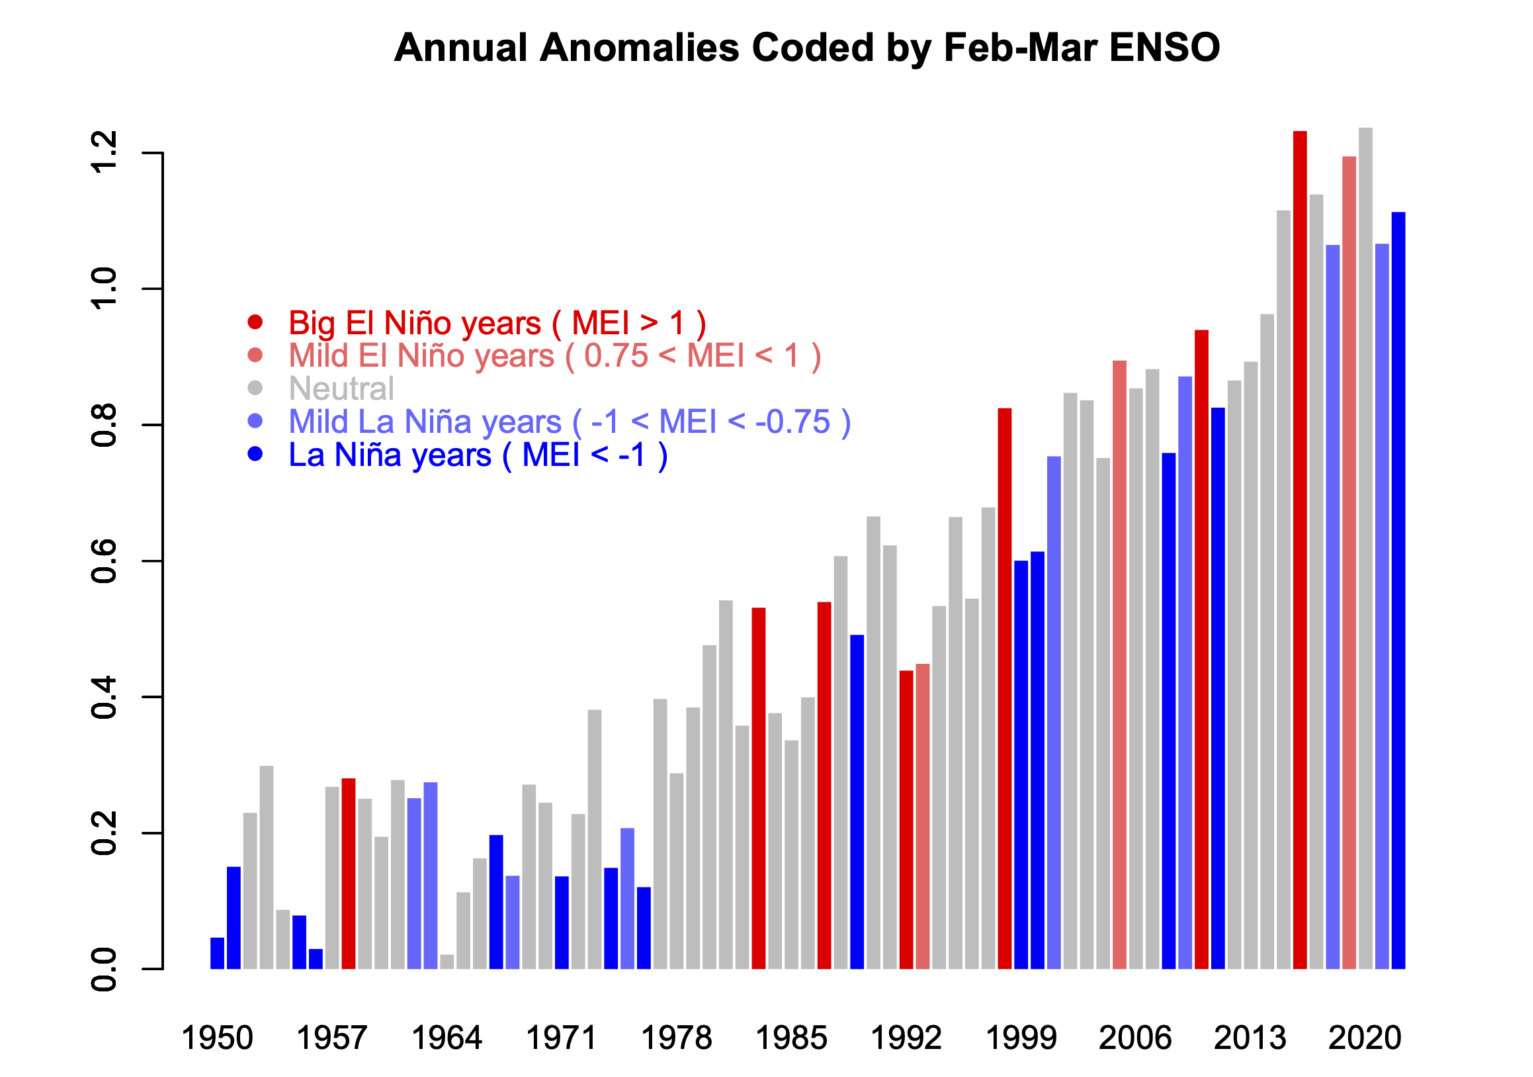
Figure 5: GISTEMP anomalies (with regard to the late 19th Century, colour-coded according to the status of ENSO in the early spring. Reds are El Nino years, blues La Nina and greys neutral. (courtesy RealClimate)
Global energy inventory
For as much as atmospheric temperatures are rising, the amount of energy being absorbed by the planet is even more striking when one looks into the deep oceans and the change in the global heat content (Figure 6).
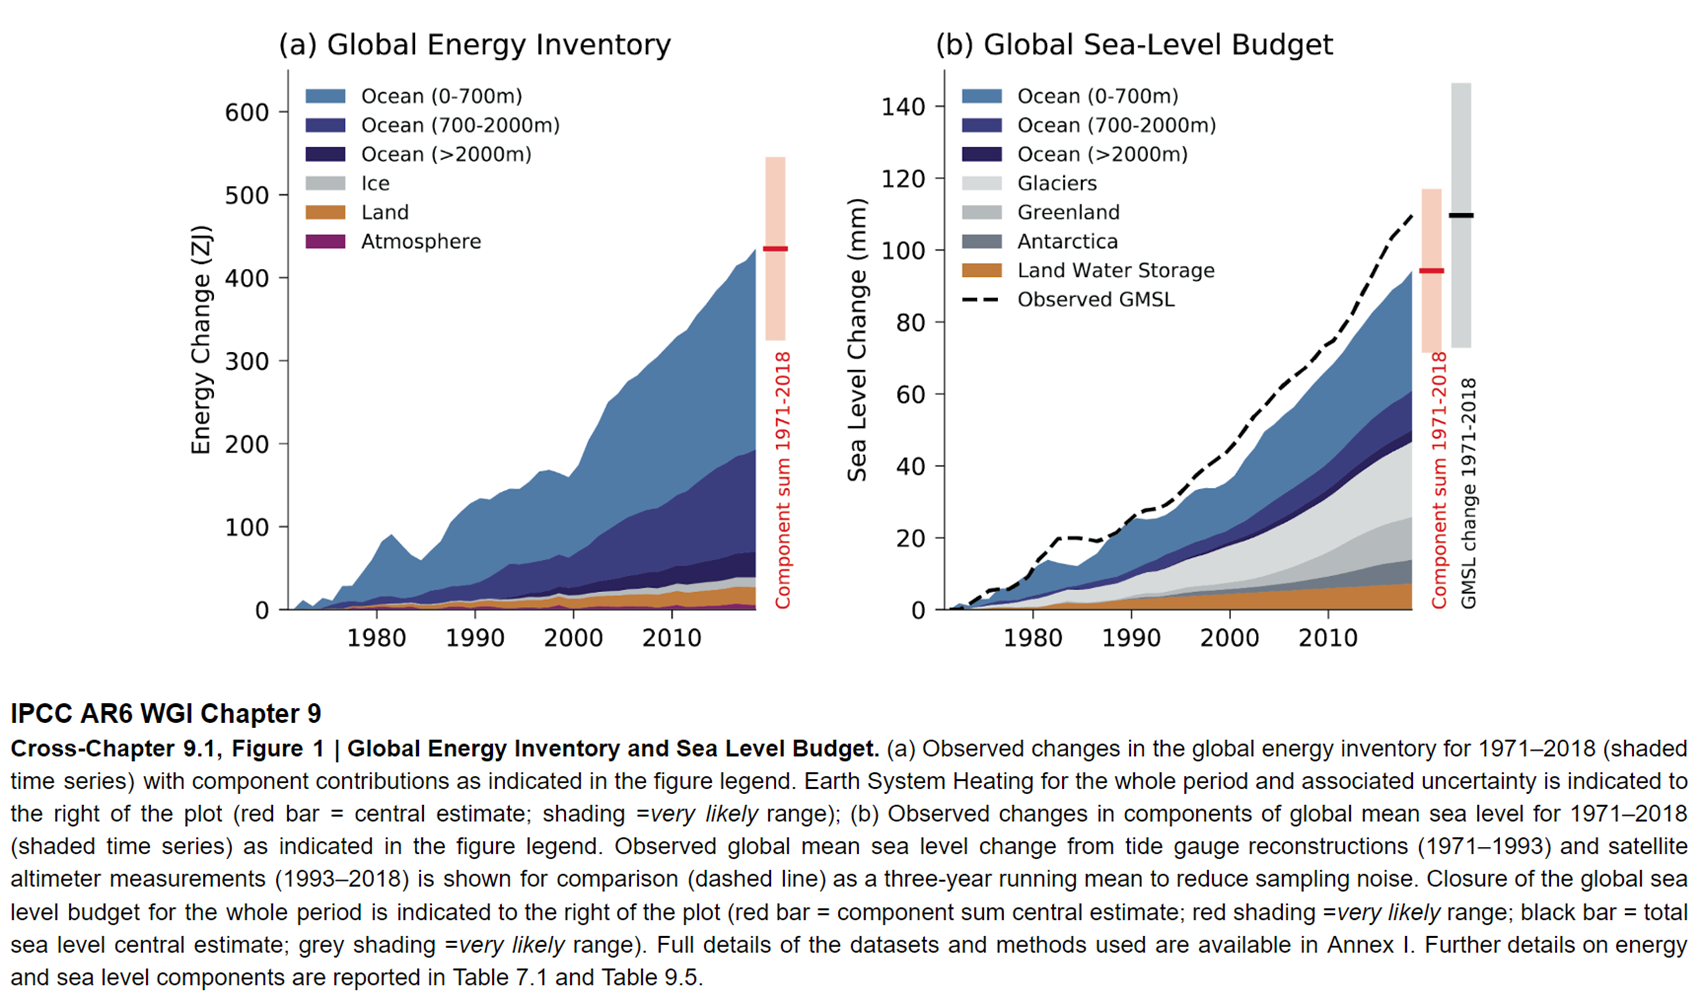
Figure 6: Global energy inventory, 1971-2018, showing the breakdown of components, as indicated in the legend. Graphic from IPCC AR6 Working Group 1, Box 7.2 fig.1.
Over 90% of global warming goes into heating the oceans. When taking the heating of the entire climate system into account, the planet has warmed at a rate equivalent to 4 Hiroshima atomic bomb detonations per second over the past 15 years (Figure 7).
Figure 7 - Heat Widget from 4Hiroshimas
Humans are Increasing Atmospheric Greenhouse Gases
The amount of greenhouse gases in the atmosphere - particularly carbon dioxide (CO2) - has been rising steadily over the past 150 years. There are a number of lines of evidence which clearly demonstrate that this increase is due to human activities, primarily burning fossil fuels.
The most direct of evidence involves simple accounting. Humans are currently emitting approximately 44 billion tons of CO2 per year. That CO2 doesn't simply vanish. Half of it stays in the atmosphere, while the other half is absorbed by the oceans (which is causing another major problem - ocean acidification).
We also know the atmospheric increase is from burning fossil fuels because of the isotopic signature of the carbon in the atmosphere. Carbon comes in three different isotopes, and plants have a preference for the lightest one, carbon 12. Anything that eats plants, or eats things that eat plants, inherits that light carbon signature. So do the colossal tonnages of geological deposits made from ancient life - in other words the fossil fuels. So if the fraction of carbon 12 in the atmosphere is increasing, which it is, we know the increase is due to burning fossil fuels.
The fact that humans are responsible for the increase in atmospheric CO2 is settled science. The evidence is clear-cut.
Human Greenhouse Gases are Causing Global Warming
There is overwhelming evidence that humans are the dominant cause of the recent global warming, mainly due to our greenhouse gas emissions. Based on fundamental physics and math, we can quantify the amount of warming human activity is causing, and verify that we're responsible for essentially all of the global warming over the past 3 decades. The aforementioned Foster and Rahmstorf (2011) found a 0.16°C per decade warming trend since 1979 after filtering out the short-term noise.
In fact we expect human greenhouse gas emissions to cause more warming than we've thus far seen, due to the thermal inertia of the oceans (the time it takes to heat them). Human aerosol emissions are also offsetting a significant amount of the warming by causing global dimming. Huber and Knutti (2011) found that human greenhouse gas emissions have caused 66% more global warming than has been observed since the 1950s, because the cooling effect of human aerosol emissions have offset about 44% of that warming. Figure 8 shows a more recent assessment (from IPCC AR6) of the components of the overall temperature forcing.
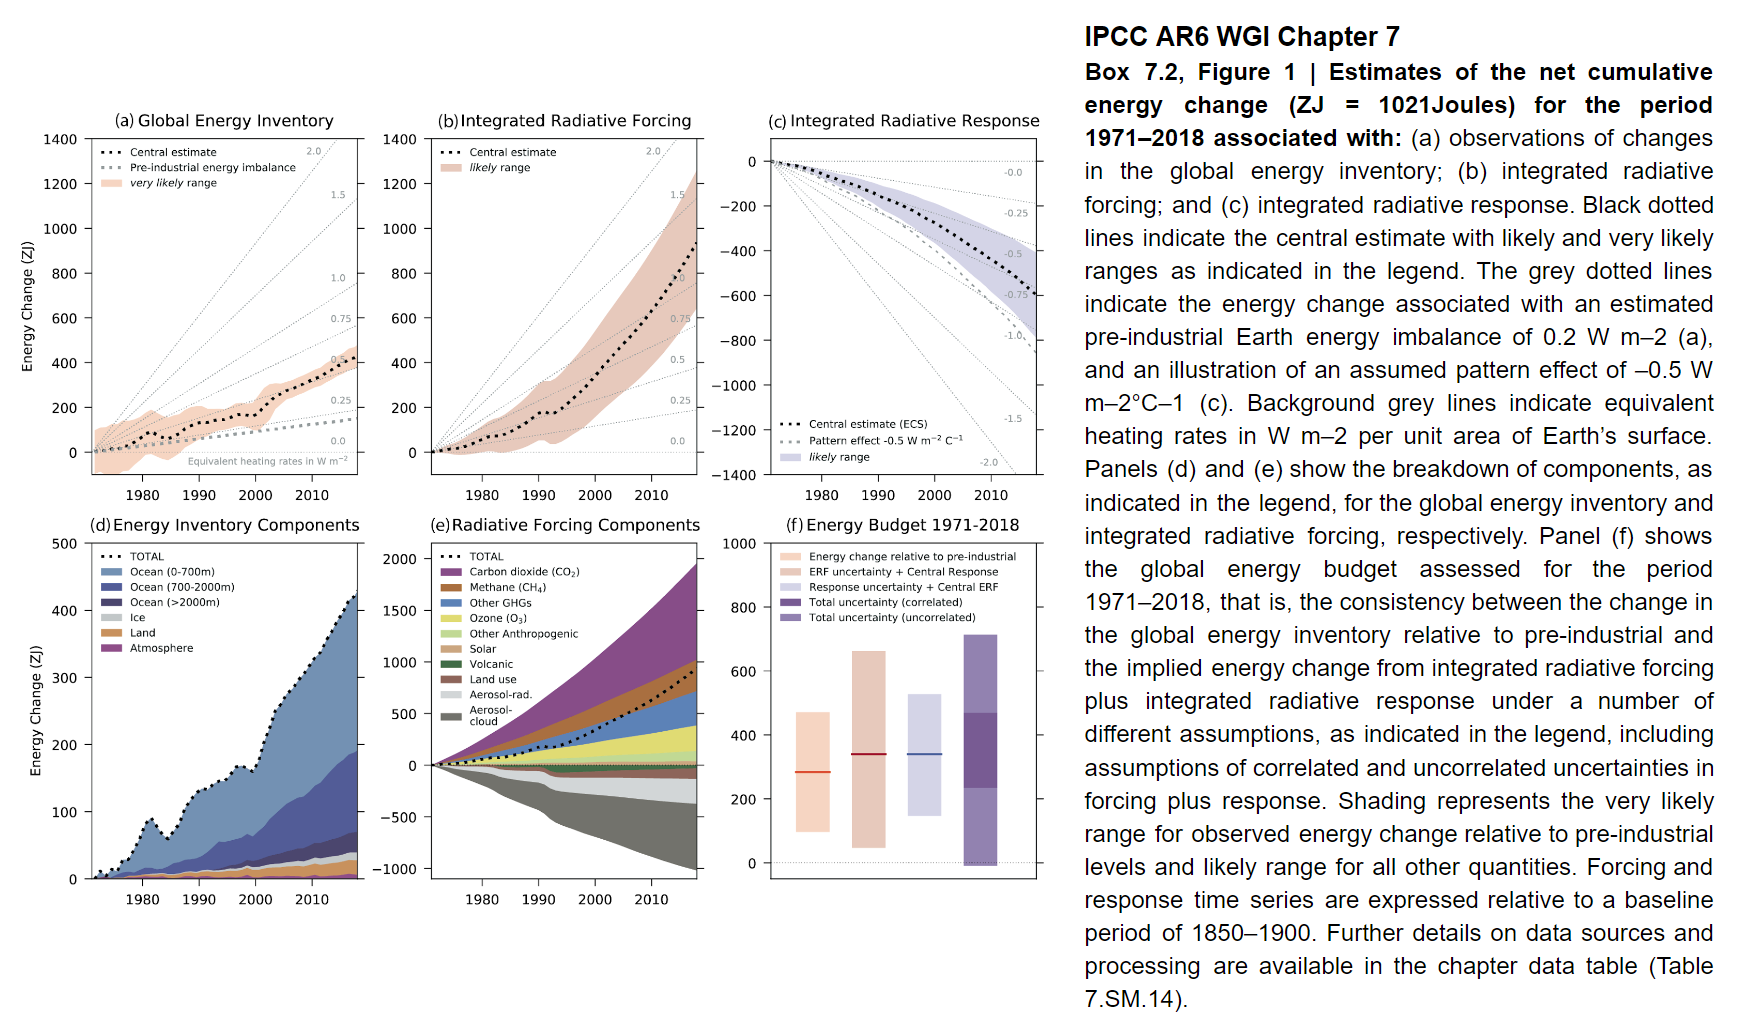
Figure 8: Contributions of individual forcing agents to the total change in the decadal average temperature for the period 1971-2018. Graphic from IPCC AR6 Working Group 1, Box 7.2 fig.1 panel (e). LH scale is energy change in ZJ. Click image to see the full graphic.
Fingerprints in the climate system
There are also numerous 'fingerprints' which we would expect to see from an increased greenhouse effect (i.e. more warming at night, at higher latitudes, upper atmosphere cooling) that we have indeed observed (Figure 9).
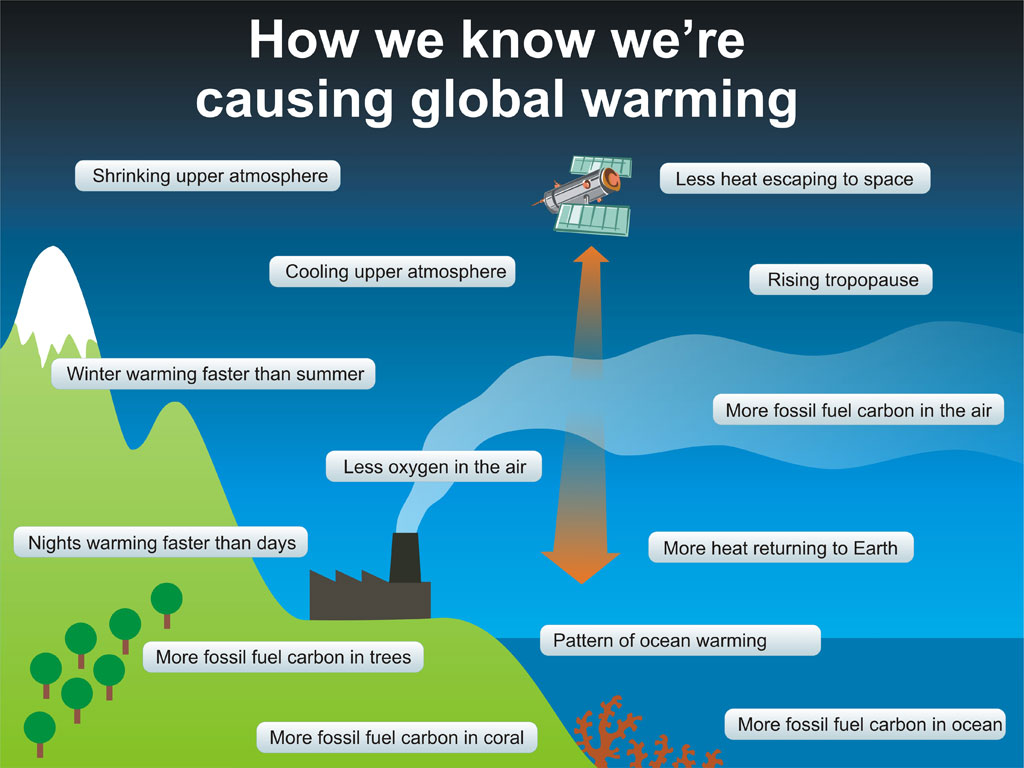
Figure 9: Observed 'fingperprints' of man-made global warming (described here and here).
Climate models have projected the ensuing global warming to a high level of accuracy, verifying that we have a good understanding of the fundamental physics behind climate change.
Sometimes people ask "what would it take to falsify the man-made global warming theory?". Well, basically it would require that our fundamental understanding of physics be wrong, because that's what the theory is based on. This fundamental physics has been scrutinized through scientific experiments for decades to centuries.
The Warming will Continue
We also know that if we continue to emit large amounts of greenhouse gases, the planet will continue to warm. We know that the climate sensitivity to a doubling of atmospheric CO2 from the pre-industrial level of 280 parts per million by volume (ppmv) to 560 ppmv (at the beginning of 2023 we were at 420 ppmv) will cause 2–4.5°C of warming. And we're headed for 560 ppmv in the mid-to-late 21st century if we continue business-as-usual emissions.
The precise sensitivity of the climate to increasing CO2 is still fairly uncertain: 2–4.5°C is a rather wide range of likely values. However, even if we're lucky and the climate sensitivity is just 2°C for doubled atmospheric CO2, if we continue on our current emissions path, we will commit ourselves to that amount of warming (2°C above pre-industrial levels) within the next 75 years.
The Net Result will be Bad
There will be some positive results of this continued warming. For example, an open Northwest Passage, enhanced growth for some plants and improved agriculture at high latitudes (though this will require use of more fertilizers), etc. However, the negatives will almost certainly outweigh the positives, by a long shot. We're talking decreased biodiversity, water shortages, increasing heat waves (both in frequency and intensity), decreased crop yields due to these impacts, damage to infrastructure, displacement of millions of people, etc. (Figure 10).
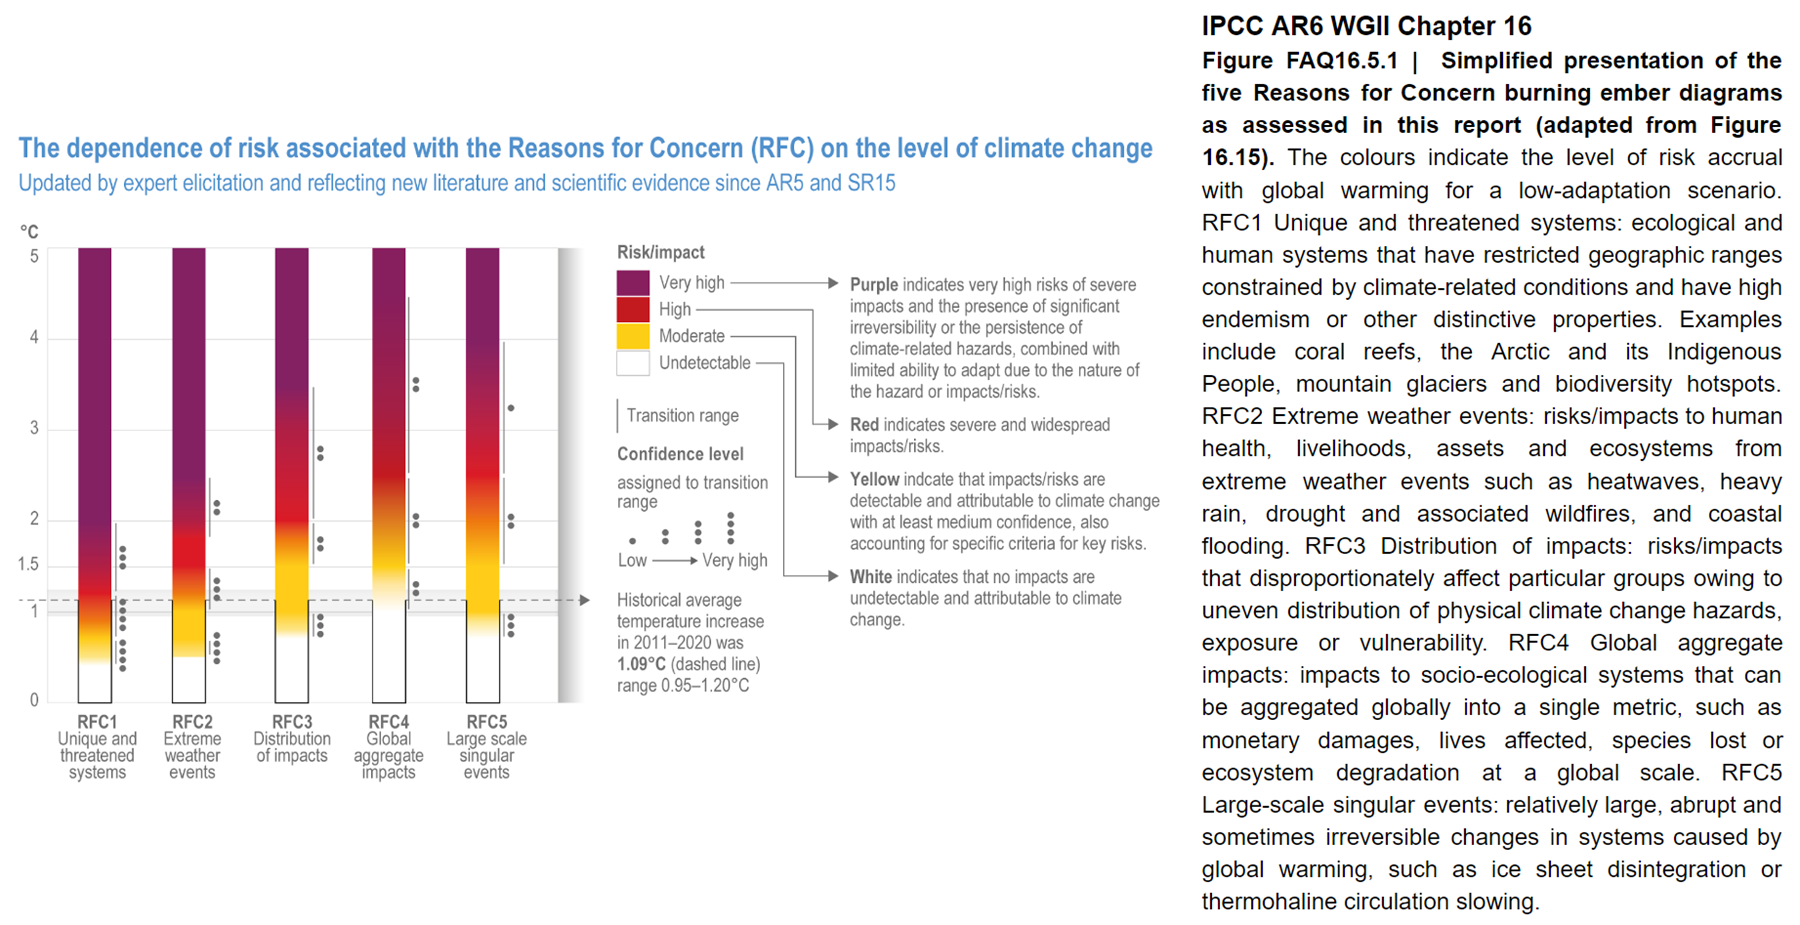
Figure 10: Simplified presentation of the five Reasons for Concern burning ember diagrams as assessed in IPCC AR6 Working Group 2 Chapter 16 (adapted from Figure 16.15, Figure FAQ 16.5.1).
Arguments to the contrary are superficial
If there's one theme we've found in studying politically-motivated criticisms of climate science, it's that they're consistently superficial. For example, the criticisms of James Hansen's 1988 global warming projections never go beyond "he was wrong," when in reality it's important to evaluate and learn from such projections and their outcome i.e.what actually happens. Then again, those who argue that "it's the Sun" ignore the fact that we understand the major mechanisms by which the Sun influences the global climate: furthermore we study and monitor them on a continual basis. We know it's not the Sun because the data say so. Finally, those who argue "it's just a natural cycle" can never seem to identify exactly which natural cycle can explain the current warming, nor can they explain how our understanding of the fundamental climate physics is wrong.
There are legitimate unresolved questions
Much ado is made out of the expression "the science is settled." The science is settled in terms of knowing that the planet is warming rapidly, and that humans are the dominant cause.
There are certainly unresolved issues. As noted above, there's a big difference between a 2°C and a 4.5°C warming for a doubling of atmospheric CO2, and it's an important question to resolve, because we need to know how fast the planet will warm in order to know how fast we need to reduce our greenhouse gas emissions. There are significant uncertainties in some feedbacks which play into this question. For example, will clouds act as a net positive feedback (by trapping more heat, causing more warming) or negative feedback (by reflecting more sunlight, causing a cooling effect) as the planet continues to warm? And exactly how much global warming is being offset by human aerosol emissions?
These are the sorts of questions we should be debating, and the issues that many climate scientists are investigating. Unfortunately there is a very vocal contingent of people determined to continue arguing the resolved questions for which the science has already been settled. And when climate scientists are forced to respond to the constant propagation of misinformation on these settled issues, it just detracts from our investigation of the legitimate, unresolved, important questions.
Smart Risk Management Means Taking Action
People are usually very conservative when it comes to risk management. Some of us buy fire insurance for our homes when the risk of a house fire is less than 1%, for example. When it comes to important objects like cars and homes, we would rather be safe than sorry.
But there is arguably no more important object than the global climate. We rely on the climate for our basic requirements, like having enough accessible food and water. Prudent risk management in this case is clear. The scientific evidence discussed above shows indisputably that there is a risk that we are headed towards very harmful climate change. There are uncertainties as to how harmful the consequences will be, but uncertainty is not a valid reason for inaction. There's very high uncertainty whether I'll ever be in a car accident, but it would be foolish of me not to prepare for that possibility by purchasing auto insurance. Moreover, uncertainty cuts both ways, and it's just as likely that the consequences will be worse than we expect as it is that the consequences won't be very bad.
We Can Solve the Problem
The good news is that we have the tools we need to mitigate the risk posed by climate change. A number of plans have been put forth to achieve the necessary greenhouse gas emissions cuts (i.e. here and here and here). We already have all the technology we need.
Opponents often argue that mitigating global warming will hurt the economy, but the opposite is true. Those who argue that reducing emissions will be too expensive ignore the costs of climate change - economic studies have consistently shown that mitigation is several times less costly than trying to adapt to climate change (Figure 11).
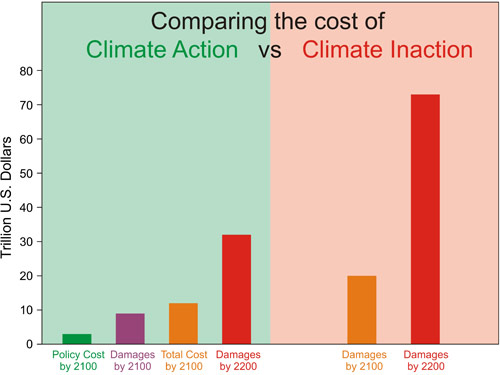
Figure 11: Approximate costs of climate action (green) and inaction (red) in 2100 and 2200. Sources: German Institute for Economic Research and Watkiss et al. 2005
This is why there is a consensus among economists with expertise in climate that we should put a price on carbon emissions (Figure 12).
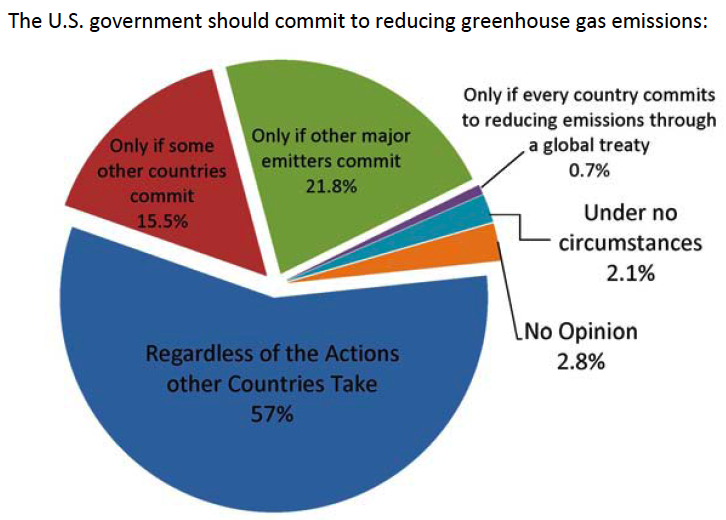
Figure 12: New York University survey results of economists with climate expertise when asked under what circumstances the USA should reduce its emissions (Policy Brief: Economists and Climate Change. Consensus and Open Questions, Holladay et al. 2009)
The Big Picture
The big picture is that we know the planet is warming, humans are causing it, there is a substantial risk to continuing on our current path, but we don't know exactly how large the risk is. However, uncertainty regarding the magnitude of the risk is not an excuse to ignore it. We also know that if we continue on a business-as-usual path, the risk of catastrophic consequences is very high. In fact, the larger the uncertainty, the greater the potential for the exceptionally high risk scenario to become reality. We need to continue to decrease the uncertainty, but it's also critical to acknowledge what we know and what questions have been resolved, and that taking no action is not an option. Th good news is that we know how to solve the problem, and that doing so will minimize the impact not only on the climate, but also on the economy.
The bottom line is that from every perspective - scientific, risk management, economic, etc. - there is no reason not to immeditately take serious action to mitigate climate change. Failing to do so would be exceptionally foolish. Or, as the late Nobel Prize-winning scientist Sherwood Rowland (1927-2012), who made the 1970s discovery that chlorofluorocarbons (CFCs) in our atmosphere cause major damage to Earth's ozone layer, put it many years ago:
"What's the use of having developed a science well enough to make predictions if, in the end, all we're willing to do is stand around and wait for them to come true?"


Rob @ 49: [questioning Bart]:
That's not an either-or question, Rob. It's quite possible that Bart read the paper and still doesn't understand the full context of the meaning of the charts.
Bob Loblaw @50
"let's start with you explaining what you think makes The Netherlands any different from any other part of the globe that is a long way away from Greenland?"
Why should I explain it when you know allready know the answer? Back to @35. There we see the projection of the sea level rise for the Netherlands, according to IPCC.
Also according to IPCC the addition to the global sealevel rise by Greenland in the SSP5-8.5 scenario in 2100 is 13cm. 12,5% of this comes to the Netherlands, that's 1,6 cm. Not very much to be worried about.
Bart @ 52:
Really? I don't see anything in your figure in #35 that indicates 13cm in 2100. In the diagram you provided, in 2100, the lowest coloured zone is closer to 25cm, and the red ones (SSP5-8.5) range from 55cm to 120cm. The last time anything in that diagram was below 13cm was before 2050.
You can't even read your own graphs properly.
Of course, maybe you're still using 13cm from some bogus extrapolation of historical data.
Actually, I see that Bart's 13cm is the proportion of the overall total of sea level rise that is due to Greenland. That's not in the figure he refers to. He must be getting that from a different source - one he has not provided a reference to.
On top of that, he's said "12.5% of this comes to the Netherlands, that's 1,6 cm." That is a claim that appears to be a figment of his imagination.
Where does this magical 12.5% figure come from, Bart?
Bob Loblaw, the magical 12,5% figure comes from this message:
www.knmi.nl/over-het-knmi/nieuws/de-groenlandse-ijskap-smelt-steeds-sneller
In Figuur 2 we see the influence of the melting of different parts of Greenland to the sea level rise in the Netherlands. As we see, melting at the east coast of Greenland gives a sea level decline in the Netherlands becourse it's at a short distance. The mean value of the southern half of Greenland is someting like 12,5%. My assumption is that the mass loss in this century will come from the southern part.
Well that source is in Dutch (I presume).
Please prove a translation of the caption in figure 2.
Hi Bob, with Google Translate you can read the text in English. Here's a screenshot of the translation:
Bart:
I do not see the graph you posted at 35 in your paper. You have a graph at 52 that shows considerably more sea level rise than your graph at 35, but still much less than the KNMI report.
The KNMI report that I linked was put out after the IPCC updated their sea level rise projections in 2021. Apparently the paper you link was written before the IPCC updated their projections.
The Netherlands National Weather Institute's (KNMI) most recent projections, made after the publication of the paper you linked, are 1.2 - 2.0 meters of sea level rise in Holland by 2100. If you prefer to look at outdated projections by lesser authorities that is your business. Every time sea level projections are updated they are increased. I suggest you try to keep more up to date.
At 35 you said " I don't see many projections between 1-2 meters here." That is incorrect, the Dutch National Weather service best estimate is 1.2-2.0 meters.
Rob at 42: The link to Tamino (copy of link) that I posted at 30 shows the sea level data and explains why you cannot use the average of 1900-2020 to project to the future with a straight line. He used the data from 1970-2020 and a quadratic fit for the most accurate projection.
Peppers: Tamino explains how to project future sea level rise. He only projects to 2050 because the uncertainty bars become too big after that.
Bart... Do you understand the meaning of "disproportionately affected"?
Bart @ 57:
Yes, I could use Google Translate, but why should I? You are the one trying to make a case here, and if you can't be bothered to provide proper references, proper indications of what you expect people to see in those references or diagrams, then why should we make the effort to guess at what you are trying to show us?
Now that you have provided a translation of the caption and some of the text for the figure that shows "the magical 12.5% figure", I see that the main text says "the rise in the Netherlands could amount to 60% of the global average sea level rise". No 12.5% there, and a direct refutation of your 12.5% claim.
What about the caption? It says that the map is showing "the consequences on the Dutch coast of the disappearance of ice in different parts of the Greenland ice sheet".
The values on that map range from maybe -30% to over +45%. You stated "The mean value of the southern half of Greenland is someting like 12,5%. My assumption is that the mass loss in this century will come from the southern part."
So, that diagram does not demonstrate that sea level rise in The Netherlands from Greenland ice melt will be 12.5% of the global average. The 12.5% value is a value you picked out of the figure purely on the basis of that's what you want to believe. You have assumed your conclusion.
Once again, you have no scientific basis for your claim. You have no justification for saying that the mass loss will come from the southern part of Greenland.
It is obvious that you are just making stuff up, with a smattering of out-of-context quotes or diagrams, with no real understanding of any of the processes.
@ Michael sweet,
Unfortunately you didn't give a link to the KNMI site, but to some Turkish site. Here's a proper link (please use Google translate):
www.knmi.nl/over-het-knmi/nieuws/nu-ook-zeespiegelstijging-te-zien-in-het-klimaatdashboard
@60
"You have no justification for saying that the mass loss will come from the southern part of Greenland."
When we look at the anomaly of the Surface Mass Balance of Greenland of this moment then I think that it gives a good idea of how the Greenland Icesheet reshapes at the moment. The lower parts and the southern parts are losing ice, and the higher part can gain ice due to more precipitation.
Bart Vreeken,
My link at 39 appears to be the KNMI climate change report published at the end of 2021. It contains the new sea level rise projections. On the cover it gives 1.2-2.0 meters as projected sea level rise. It was widely reported in the newspapers at the time. My link at 38 was to a newspaper summary of the KNMI report.
Bart... (sigh) That is surface mass balance. Not total mass balance. The two are very different. Surface mass balance is a subset of total mass balance.
Peppers @36
"I disagree, but if population is the cause (of global warming) we may be better oriented to aid in adaptation to the changes.
'Population' is not the cause of global warming. The cause is largely the fossil fuel energy we elect to use because it causes a warming effect. If 8 billion people had been using carbon neutral fuel source we would not have global warming to anything like the extent we have, all other things being equal. So population is not a primary cause of warming.
That fossil fuel energy choice has at most lead to a particularly large population, in a positive feedback loop - but it is still not the cause in any fundamental sense. And your comments are wrong for another reason. We have alternative sources of energy that would eliminate the problem, if we can find a will to develop them more quickly. How can you say population is the cause when we can fix the problem with alternative energy sources? It doesnt make sense logically.
You can behave like a stubborn, over confident egotistical crank if you want - or you can accept sensible explanations.
Michael sweet, are you playing games? In your link at 39 I see the town of Hindeloopen on the cover, behind a dike. The figure I posted comes from this report, it's on page 30. Please have a look. No 1-2 m sea level rise there.
Rob Honeycutt, offcourse SMB is different from the total mass balance. But not very different. The negative anomaly along the coast comes from high temperatures, not from shortage of precipitation. So the discharge will also have a negative anomaly there.
Yes, Bart, they are different for important reasons. Once again, you're trying to cherry pick information to support your position without fully (or even partially) understanding what you're talking about.
Once again, your own citations are saying The Netherlands are at greater risk of sea level rise, not less.
The comments have improved my understanding of sea level rise.
Thank you Rob, Bob and Michael.
Though I lack detailed background knowledge regarding sea level rise I feel confident about pointing out that the 'peak sea level rise', not 'sea level rise by 2100', is what the future of humanity will have to deal with.
From an ethical and moral perspective, the people who benefit(ed) most from causing the harmful result should be responsible for paying for the required mitigation and adaptation. The more that they suffer because of the 'mitigation actions to rapidly end the harmful impact' the less they will have to pay in advance for the required adaptations. This avoids the problem of 'benefiting from harm done while evading the consequences of the harm done'.
What is happening today is serious unethical and immoral attempts to make the future impacts worse and avoid paying for the required repairs and adaptations. The 'highest harming' portion of the global population is not building CO2 removal devices now required to bring harmful impacts back down to 1.5 C levels of warming. And that group is also not planning to pay for the required adaptation in places like Bangladesh (or the island nations being submerged).
I will go one step further on the point of the real problem being the peak impact that has to be adapted to. There is uncertainty regarding how much adaptation is 'enough'. As a structural engineer I am very familiar with the requirements for all load resisting aspects of a structure to have a very low probability (less than 2%) that very severe potential future impacts would exceed the performance capability of the aspects of the structure. And aspects of the structure that are Primary, where their failure would cause significant overall structure failures, would have redundant mechanisms that would keep the structure system from collapsing due to the failure of a Primary element.
Sea level rise impacts would be equivalent to impacts on Primary Structure elements. So the sea level rise that the biggest beneficiaries of fossil fuel use in the current generation are ethically obligated to build globally, for all of the inhabited areas affected by the future sea level rise that they benefited from causing, would be the 'peak sea level increase' that has far less than 2% chance of being exceeded.
The big question is not the different evaluations (uncertainty) regarding the ways that Greenland and Antarctica will respond to human caused global warming. The big question is: What level of warming is almost certain to be the maximum level of the harmful human impacts.
Hi One Planet,
We are not so far apart, as a growing human presence is bringing more co2 to the surface.
I depart with the vilification of part of the population as being most harmful-per person. Every segment has grown, and the greatest contributors are not the highest per person emitters. China is 4 times the population of the USA, and they are at 7.5 per capita to the USA's15.5pc, and therefore emits twice as much as the USA. If the USA were to halve thier emissions to match China's pc the USA would be at 7% of the worlds emisions. Its just not going to do anything against the new emitters being born and growing.
Great interactive chart: https://www.worldometers.info/co2-emissions/co2-emissions-by-country/
There are 15 nations as higher emitters pc than USA, including Canada and Australia. They are 1/3 in population total (of the USA) yet emit 1/2 that again of the USA. Blaming nieghbors so can scold them is what needs to be lost, when you realize it was population that has caused more co2 to be emitted.
I would be in a camp for any and all aid in helping people adapt to the forseable new environment. No one could forsee a rise in Co2 being a side effect to solving almost ever ailment of mankind, except cancer pretty much. More live to adulthood, and they live much longer too. Conquering infant mortality and pennicillin has take us from 1 to 8B and rising. There are no villians is my point. We need to be of help, not blaming. Co2 is going to continue to rise for a while.
Thanks, tons, David
Peppers @69... "No one could forsee a rise in Co2 being a side effect to solving almost ever ailment of mankind..."
Give it a rest (rolls eyes). You're presenting fossil fuels as if they were the messiah.
Fossil fuels have merely been one form of energy in a long line of sources of energy through human history. They are not the "reason" for humanity solving problems nor have we solved "almost ever[y] ailment of mankind."
As pointed out before, without acknowledgement, we now have access to cheaper, more abundant forms of energy than fossil fuels and those sources are cleaner, safer, and do not emit CO2. And eventually even those forms of renewable energy will be replaced with fusion energy.
Peppers, I will also note that you never responded to my corrections to your C-P extinction statement that "Everything died, except the microorganizms around the rim of the oceans, around the world."
Here is a map of surface height change in Greenland. That includes snowfall, melt runoff, ocean melting and iceberg calving.
The caption reads:
Maps of elevation change from satellite altimetry reveal where the Greenland Ice Sheet is changing mass. Map created using data acquired by the CryoSat-2 satellite radar altimeter. Credit: CPOM
source
I note that the major areas of ice loss are on the west and northwest side of the island, the opposite of Holland.
Bart Vreeken,
I am sorry, the summary page showing 1.2-2.0 meters of sea level rise is page 2 of the document I linked. This was widely reported in newspapers like here, here and here. When a number is in the summary page at the start of a report many people do not read the rest of the report. I have difficulty reading the report, my computer does not translate PDF's.
Hang on. Am I missing something or is Bart actually thinking that the gravitational mass of Greenland is going to pull sea level away from The Netherlands, when it's 3000km away, making their impacts of SLR nominal?
Surely not.
Bart @ 62:
In addition to pointing out what Rob said to you at comment 64 about the error in using Surface Mass Balance, I note that you have also given a map of SMB for a single winter season. Do you not bother looking at the ful captions of the figures you pick up? This one does not need translation from Dutch - it is dated March 16, 2023, and states "Accumulated anomaly since Sep 1, 2022".
You're back to the same basic error that you made in your very first post here at SkS on March 9, regarding Antarctic ice. Treating a single year of data as if it represents a long term trend.
At least you honestly say "...how the Greenland Icesheet reshapes at the moment..." Now all you need to figure out is that "the moment" is not enough to make predictions about the future.
Another clue for you: losing ice at lower altitudes around the perimeter of the ice sheet, and gaining ice at the higher altitude is Business As Usual for continental ice sheets. There is this thing called "glacial flow" that moves ice from the accumulation zone to the ablation zone. You should read about it some time.
Rob @ 74:
Yes the horizontal gravitational pull is indeed a factor that will affect regional sea level around Greenland.
Less mass in Greenland should mean less gravitational pull towards Greenland, so more sea water to spread elsewhere. I'll leave it to Bart to try to explain why less water around Greenland would lead to less sea water in The Netherlands. (I don't expect it to be a logical or rational explanation.)
peppers @69,
I will offer the following response to your departure.
Claiming that a person who is twice as harmful as all other individuals is acceptable because thetotal imp[act of 3 of those others would be more harmful is ... so many applicable terms, none of them compliments.
I will add that the 'more harmful' are not discovered by evaluating the total impacts of a group. Identifying the most harmfully impacting people within any group is the proper action. The problem for any group is when its leadership is taken over by the most harmful and misleading members of the group. And that is more likely to happen in a group with a higher per capita level of harmfulness.
It is a real phenomenom that when the great ice sheets in Greenland and Antarctia melt that means there is less gravity there and the sea flows away. I remember that around Greenland itself that could be tens of meters less water and more around Antarctia. There are papers describing where in the globe there will be less water and where there will be more water (ths article describes the affect). By looking at the pattern of sea level rise (upthread I posted a map of sea level rise) and seeiing where it is higher and where it is lower scientists can get an idea of where the water is coming from.
Bart Vreeken posted a map upthread, it is probably accurate. They suggested that melting in the Antarctic will result in higher sea level rise than the global average but melting in Greenland will result in less sea level rise than the global average in Holland. Different parts of Greenland affect Holland differently.
There are other effects on sea level rise that are not intuative. The Gulf Stream carries water from North America to Europe. Sea level in Europe is about 1 meter (!!!) hgher than off North America. If the Gulf Stream stopped, sea level in Europe would decrease substantially while the East coast of the USA would flood. Who wudda thunk.
michael sweet @78
Good summary of the gravity point. I hope that it's clear for everyone now.
About the KNMI-report: the 2 meter sea level rise is not in the summary on page 2. Mayby you were confused by the european notation of the number? "de zeespiegel kan tot 1,2 meter stijgen" means: "the sea level can rise up to one point two meter.
An other thing is that the report has changed from the original version. We don't know what was in the original version now.
Thank you michael sweet @72 for the map of Greenland, based on altimetry. I didn't know this one, it's different from what I expected. I was too quick with my map of the SMB anomaly of only this year, it turns out to be untypical. Never the less we don't expect so much contribution from Greenland here. From the KNMI-report we discussed before:
"Many factors have been taken into account in the calculation of sea level rise on the Dutch coast, including the expansion of the oceans due to warming, self-gravitation, the changes in salinity, and the mass loss of glaciers and ice sheets in Greenland and Antarctica. Because the melting of the Greenland Ice Sheet hardly contributes to the sea level rise off the Dutch coast, we expect that the increase here will lag slightly behind the world average."
Bob Loblow @75 you said:
"Another clue for you: losing ice at lower altitudes around the perimeter of the ice sheet, and gaining ice at the higher altitude is Business As Usual for continental ice sheets. There is this thing called "glacial flow" that moves ice from the accumulation zone to the ablation zone"
Well, that's great. Do you really think I would write about Greenland when I didn't know how it works?
My turn then. The mass change of Greenland by year. Cherry-picking? Maybe, but I use all the available data of GRACE. Over a longer period (altimetry data) there is an increase of mass loss. Don't pay too much attention to the trendline, for the data have a lot of noice. But there is a similarity with Antarctica: more snowfall in the last years, caused by less sea ice.
Bart Vreeken @80,
That is a curious quote about the Greenland contribution to Netherland SLR given the KNMI Report also says on P22:-
The idea that the melt water from Greenland, part of the largest contribution to SLR, should somehow choose to avoid the seas off the Netherlands is somewhat silly. I think the idea being expressed is that (as explained within the KNMI Report) SLR is not appearing so much off Netherlands due to altered weather in the North Sea and so the 'Greenland melt' is being used in your quote synonymously for SLR.
Bart @ 81: "Well, that's great. Do you really think I would write about Greenland when I didn't know how it works? "
I only know as much about you as I have read in your comments here. Based on what you have written here, my overwhelming impression is that yes, you would write about Greenland when you don't know how it works.
MA Rodger @82 your quote is about the global sea level rise, not the local SLR.
This is how it works. The Greenland Ice Sheet has a lot of mass, so it attracts sea water. Due to that, the sea level in a large area around Greenland is higher then it should be without the mass of the ice. When the ice starts to melt a part of this effect disappears. So, around Greenland the sea level will drop, not rise. Netherlands are close enough to Greenland to take profit of this effect, but not enough to avoid sea level rise from Greenland completely.
Bart @ 84: "but not enough to avoid sea level rise from Greenland completely."
....and none of these diagrams or papers you refer to support your original claim that The Netherlands would only see 12.5% of the global mean sea level rise.
In fact, looking closely at the upper right diagram of Bart's comment # 84, we see that The Netherlands falls pretty close to the 0.0 relative sea level change boundary in the colour code (light blue vs. light yellow).
So, now michael sweet @72 says my 12.5% was too low, and Bob Loblaw @86 says it was too high. Who is right? One thing is for sure, it can't be me.
Speaking of Greenland, what is described in the following news article does not bode well for the future of the Greenland ice sheet...
Greenland temperatures surge up to 50 degrees above normal, setting records by Ian Livingston & Kasha Patel, Weather, Washington Post, Mar 8, 2023
The lede for this article:
The record-breaking warmth is raising concerns about melting summer ice.
Bob @76... I'm very aware of the gravitational effects of the ice sheet. I'm just curious is Bart actually believes it has a substantive effect on The Netherlands 3000km away.
Bart @84... You were doing so well in your explanation up to the point you started making up stuff on your own, like: "Netherlands are close enough to Greenland to take profit of this effect..."
The Netherlands are 3000km away.
Here is a map from NASA, created through the JASON and TOPEX satellite missions to measure SLR over the past 23 years. This map represents the change in SLR over that period. Blue/white areas are where SL has fallen or stayed the same. Orange/red are SLR.
Now, look close at the area between Greenland and The Netherlands.
Bart @84... If you were to actually read the paper you got those images from (like I just did) you would find the authors state, "There is a negligible impact on the rest of northern Europe including the Netherlands, Atlantic coastline of Germany and along theArctic coastline of Russia (Fig. 2a)." [emphasis added]
That's very different from what you're claiming. You're claiming, "Netherlands are close enough to Greenland to take profit of this effect..."
"Negligible impact" and "close enough to take profit" are very different conclusions, the former being the conclusions of the researchers and the latter being something you're making up on your own without the benefit of a full understanding.
Negligible means "so small or unimportant as to be not worth considering; insignificant."
Rob @ 89:
Sorry, yes, I'm sure you understand the process. The way you'd worded it left it open to others thinking you questioned the gravitational effects, rather than just questioning the effect on The Netherlands, 3000km away.
Bart @ 87:
Thank you for your clarification of your position, and for providing such an excellent example of your complete incompetency in this matter.
Yes, 12.5 is larger than zero.
The problem is that your 12.5 magic number is a percent. As in "1 is 12.5% of 8", or "25 is 12.5% of 200".
In my comment 86, I am looking at the figure you provided in comment 84. The zero value in that figure has units of mm/yr. A value of zero means no difference from the global mean. If you want to convert any of those numbers to a percent, you need to know what the global mean value is, in mm/yr.
...except for one of those values. Regardless of what the global mean value is, a location where the relative sea level change differs from the global mean by 0.00 mm/yr will have a sea level rise that is 100% of the global mean.
So, the skill-testing question is:
Remember, you've already claimed that 12.5% is higher.
Hi Bob Loblaw, I'm afraid you don't understand the figure well.
Above a) you see the mass loss of Greenland where the calculation is based on. It says -166 Gt/yr. This causes a global sea level rise of something like 0,46 mm/yr. Due to the gravitation effect there are places on earth where the sea level rise is less then that, and places where it's more then that. The border between these two area's is the green line on the map between Africa and South America and in the Pacific. So, the Netherlands are in the area with less then 0,46 mm/yr sea level from Greenland, but it's more then zero. Then there is an other line, between yellow en blue. In the blue area there is no sea level rise by Greenland at all. Instead there is a drop of the sea level.
The following article may contain updated data pertinent to the ongoing discussion of sea level rise on this comment thread.
NASA Uses 30-Year Satellite Record to Track and Project Rising Seas, Staff, NASA's Global Climate Change, Mar 17, 2023
Bart @ 94:
Please explain how you make comparisons between numbers in % and numbers in mm/yr.
And please provide a reference for your interpretation of the "relative sea level change" - e.g. the source of the figure. Your interpretation of other figures and numbers in this discussion has been exceedingly unreliable.
Bob @96 here's the source of the figure:
LINK
I don't understand your problem with % and numbers in mm/yr.
Again: In the example on the map there is a mass loss of 166 Gt/yr. 361.8 Gt of ice will raise global sea levels by 1 mm. So, in this example the sea level rise will be 166/361.8 = 0,46 mm. 12.5% of this is 0,0575 mm/yr.
[RH] Shortened link so it didn't scroll off-page
Bart @94... It's strange that you claim Bob doesn't understand the figures when you are the one directly contradicting what the authors of the figure are stating when they clearly say, "There is a negligible impact on the rest of northern Europe including the Netherlands..." Negligible, as in, "unimportant" and "not worth considering."
Avoiding responding to my posts doesn't make them go away.
I find Bart Vreeken’s comments interesting, but not in the same way that Bart appears to be interested.
My interest is the Big Picture of the future of humanity and the development of sustainable ways for humans to share the limited capacity of this planet to be lived on sustainably, to not be compromised by the impacts of human activity. A significant part of that interest is understanding the possible peak effects of the harmful accumulating impacts of continued fossil fuel use.
Bart @84, starts with: “MA Rodger @82 your quote is about the global sea level rise, not the local SLR.” The set of images Bart presents are about ‘global sea level impacts’ of the loss of ice due to global warming. But Bart’s interest is limited to the impact on the Netherlands of ice loss from Greenland. The other presented ice loss evaluations do not ‘interest’ Bart as much. This selective regional, rather than Big Picture, interest can be observed in many of Bart’s comments.
Bart’s comments @533 and @537 on the recently updated SkS Climate Myth “Is Antarctica losing or gaining ice?” appear to be their first presentation (March 9, 2023) of what they find ‘interesting’. It is essentially the following: The most recent heavy snow fall on Antarctica, rather than all the other history of events on Antarctica, may be indicating the future of Antarctica. Why would that be ‘interesting’? Maybe because of what happens to the Netherlands due to ice loss from Antarctica as shown in the image set of Barts’s comment @84 referred to above.
And in Bart’s comment @560 indicates they live in the Netherlands and are concerned about sea level rise but “We have to monitor Antarctica very well, try to understand how it works, try to predict what will happen. But not with panic, that won't help us.” Their ‘interest’ in the potential that the most recent year of heavy snowfall on Antarctica indicating a very different future is like the claims that the lack of warming after 1998 indicated a very different future than the ‘panic about ending the harmful impacts of fossil fuel use, especially the global warming impacts. Many people tried to claim that post 1998 temperatures indicated ‘the end of the warming that some people were panicking about’. And Bart appears to be doing a similar thing by trying to claim that this recent year in Antarctica is a turning point of behaviour in Antarctica (as Bob Loblaw tried to point out in his comment @534 in response to Bart’s comment @533).
There is a wealth of evidence in Bart’s comment history that appears to indicate that their interests are not Big Picture. Their interests appear to be much smaller/narrower. They appear to be seeking ‘positive perceptions from the perspective of short-term regional interests’.
They may be correct about the interpretation of the Green lines of the images in their comment @84 and @87 ... but their lack of interest regarding the potential peak impacts (way beyond 2100 levels) on places like Bangladesh is what I find “Interesting” (and not in a Good Way). See My comment @68.
This article starts off strong with the first five sections.
Sections 6 (Human GG are causing global warming) and 8 (warming will continue) overstate the case. We know those to be true not from a simple application of "fundamental physics" but from elaborate computer models trying to approximate physics too complex for us to grapple with any other way.
To substantiate the statements, the article needs to show those models are rock solid and do reproduce all the relevant physics. But section 11 (legitimate unresolved questions) acknowledges the opposite.
The subsequent sections on net benefits and risks are therefore even shakier, because they rely on another layer of computer models. Like many of us post pandemic, I've become much more skeptical of pronouncements attributed to unnamed "experts" bearing computer models. Even on their own, state of the art economics models can predict next quarter's GDP only two quarters after it ends. For the article to persuade effectively, these model dependencies need buttressing.
The risk discussion needs to be brought up to date in light of the European energy crisis, which has shown "better safe than sorry" has a faulty premise. Shutting down cheap, reliable power sources is not safe at all but introduces massive hazards including economic collapse and war.