


 Arguments


The Big Picture
Posted on 15 March 2023 by John Mason, BaerbelW, dana1981
As part of our Rebuttal Update Project, this version of The Big Picture article has been updated with more current data in February 2024. You can access the previous version here.
Note: clicking on the images will open a larger version in a separate tab.
It's easy to get bogged down discussing one of the many pieces of evidence behind human-caused global warming, to the extent that we can't see the forest for the trees. Here, we take a step back and see how all of those trees comprise the forest as a whole. Skeptical Science provides extensive resources that examine each individual piece of climate misinformation and rebuts them with hard evidence, so let's make use of these individual pieces to see how they form the big picture.
The Earth is Warming
We know the planet is warming from surface temperature stations and satellites measuring the temperature of the Earth's surface and lower atmosphere. We also have various tools which have measured the warming of the Earth's oceans. Satellites have measured an energy imbalance at the top of the Earth's atmosphere. Glaciers, sea ice, and ice sheets are all receding. Sea levels are rising. Spring is arriving sooner each year. There's simply no doubt - the planet is warming. Everything to do with temperatures is going up. Everything to do with snow and ice is decreasing. Species are migrating polewards and to higher altitudes (Figure 1).
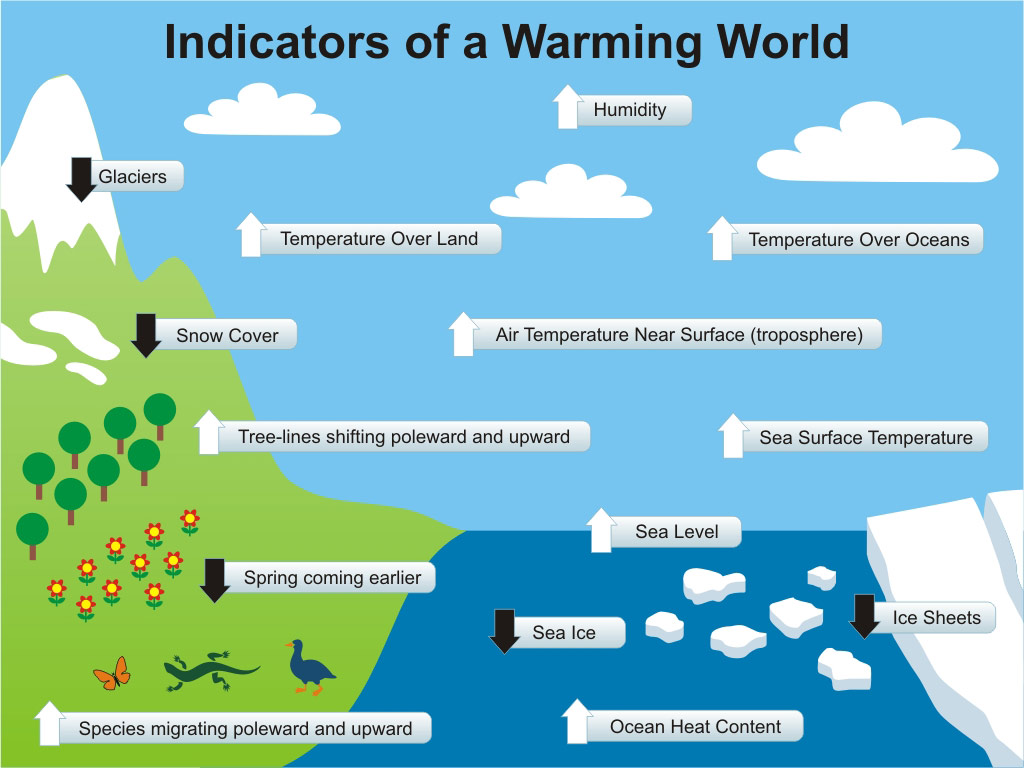
Figure 1: Indicators of a warming world (click for larger image)
Global Warming Continues
And yes, the warming is continuing. The 2010s were warmer than the 2000s, which were hotter than the 1990s, which were hotter than the 1980s, which were hotter than the 1970s. 2023 was the hottest year on record (Figure 2). Temperature datasets are in excellent agreement on this matter. Sea levels are still rising, ice is still receding, spring is still coming earlier and that planetary energy imbalance continues apace.
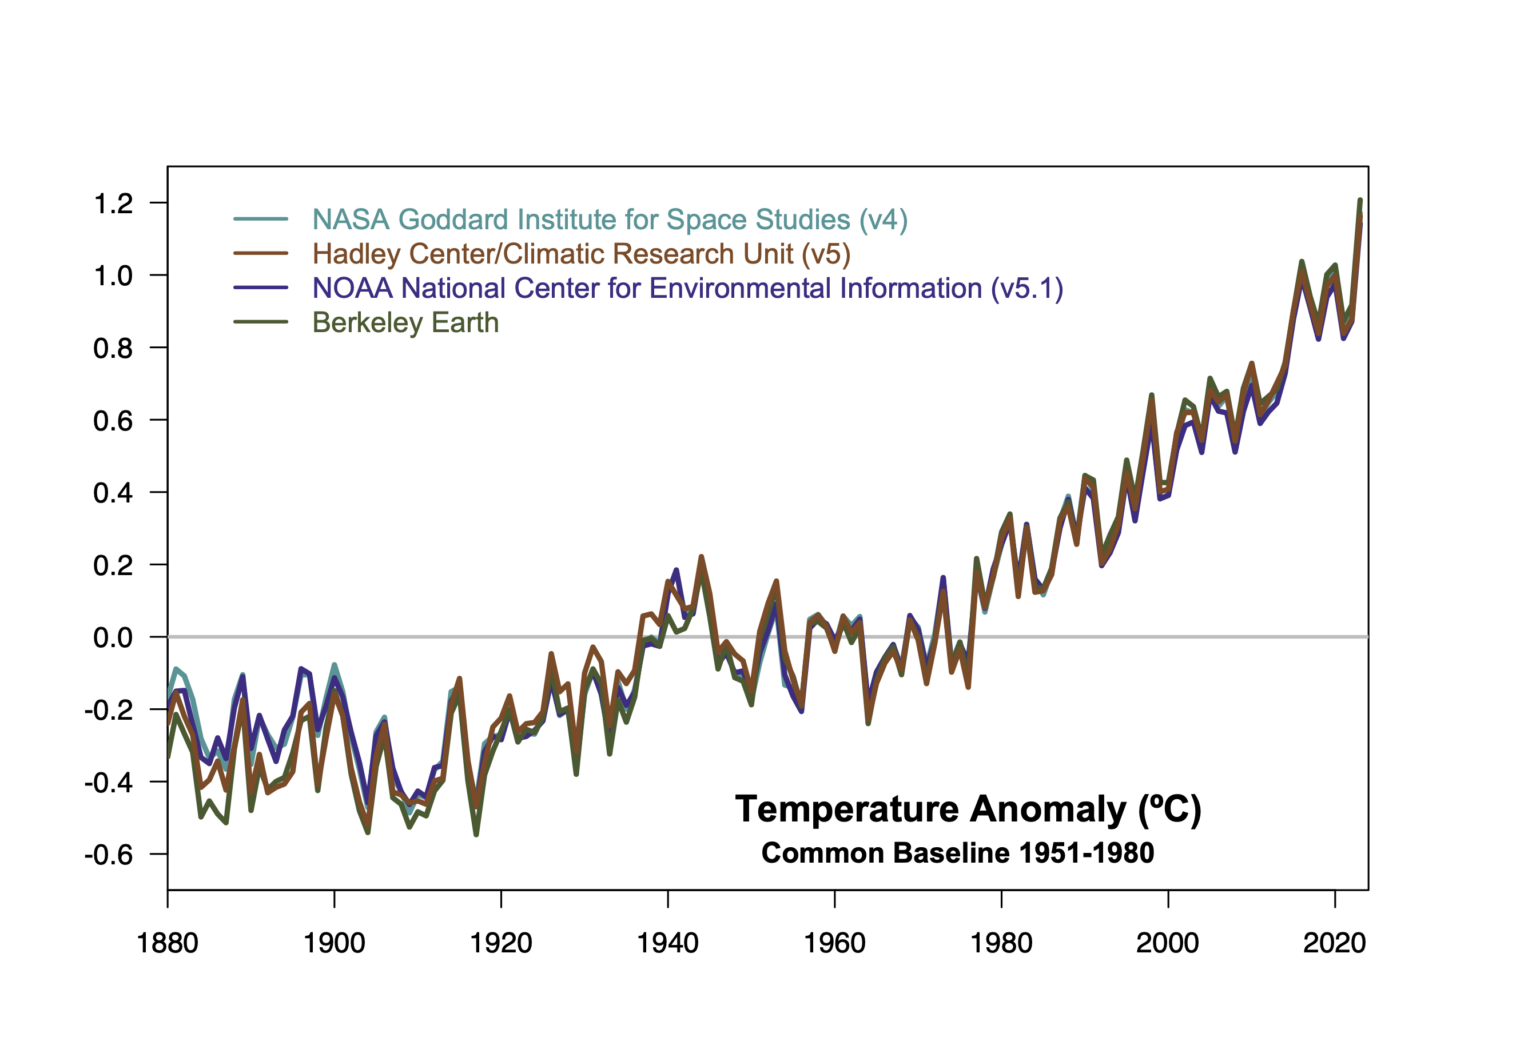
Figure 2: Four surface-station based estimates of global warming since 1880 (courtesy RealClimate)
Contrary to what the Merchants of Doubt would like us to believe, and they have tried this one more than once, the planet has not magically stopped warming. Those who argue otherwise are confusing short-term noise with long-term global warming (Figure 3).
Figure 3: This version of the Escalator graphic is based on data including the year 2022. The previous versions are still available here with data including 2015 or as a video including 2016. When Robert Rohde updated the escalator and produced a staircase of denial in January 2023, it motivated us to follow suit and to update our escalator with the latest available data as well. (click for a larger version)
El Niño-Southern Oscillation (ENSO)
Foster and Rahmstorf (2011) showed that when we filter out the short-term effects of the sun, volcanoes, and El Niño cycles, the underlying man-made global warming trend becomes even more clear (Figure 4).
Figure 4: Temperature data (with a 12-month running average) before and after the short-term factor removal, from Foster & Rahmstorf (2011).
Although such influences are sources of climate variability, the following plot of ENSO shows that El Nino (warm) and La Nina (cool) years, plus ENSO-neutral years (Figure 5), are all steadily getting warmer: they are simply noise on an upwards trend:
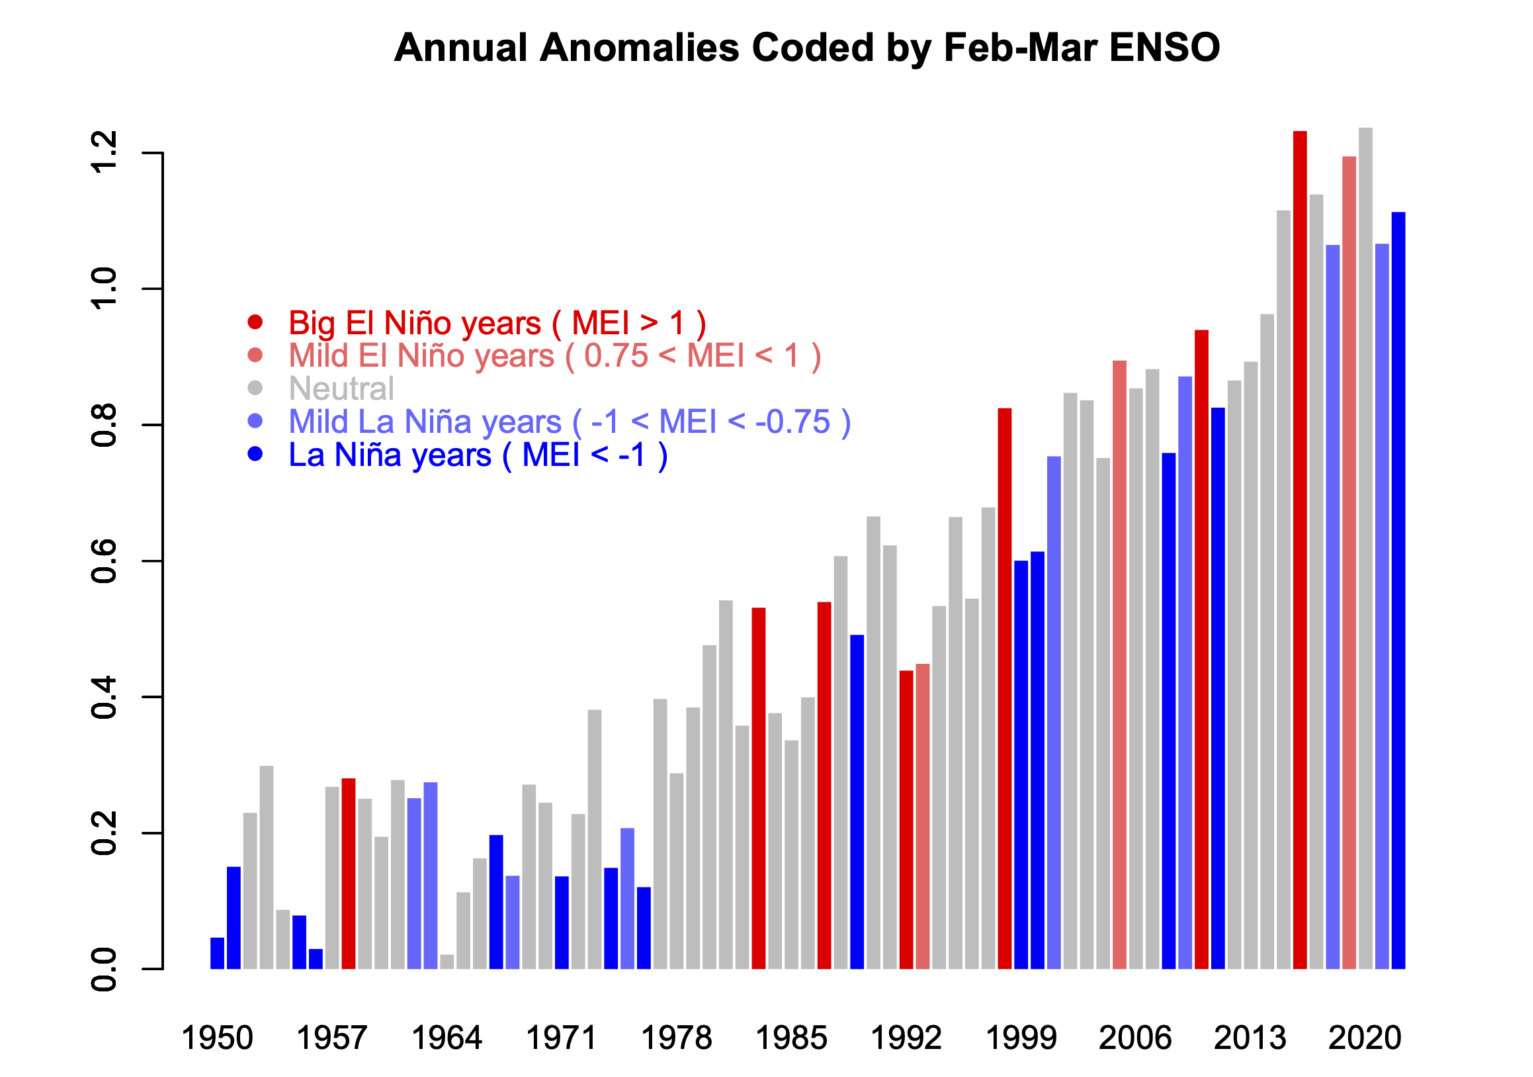
Figure 5: GISTEMP anomalies (with regard to the late 19th Century, colour-coded according to the status of ENSO in the early spring. Reds are El Nino years, blues La Nina and greys neutral. (courtesy RealClimate)
Global energy inventory
For as much as atmospheric temperatures are rising, the amount of energy being absorbed by the planet is even more striking when one looks into the deep oceans and the change in the global heat content (Figure 6).
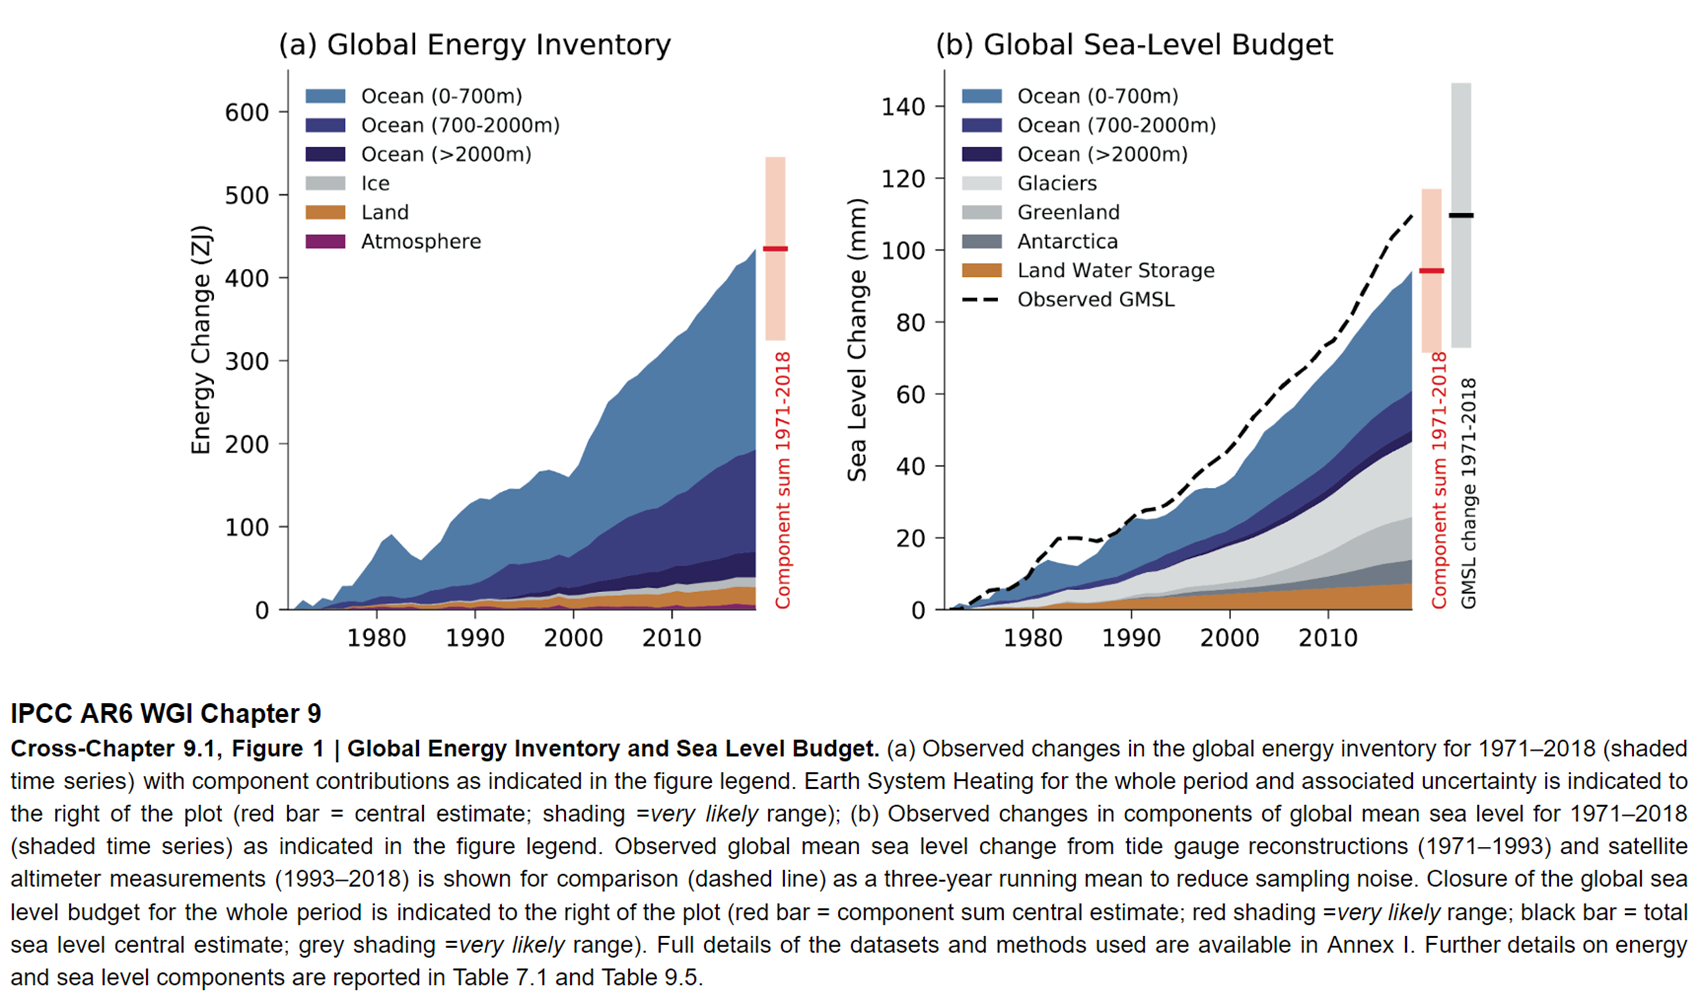
Figure 6: Global energy inventory, 1971-2018, showing the breakdown of components, as indicated in the legend. Graphic from IPCC AR6 Working Group 1, Box 7.2 fig.1.
Over 90% of global warming goes into heating the oceans. When taking the heating of the entire climate system into account, the planet has warmed at a rate equivalent to 4 Hiroshima atomic bomb detonations per second over the past 15 years (Figure 7).
Figure 7 - Heat Widget from 4Hiroshimas
Humans are Increasing Atmospheric Greenhouse Gases
The amount of greenhouse gases in the atmosphere - particularly carbon dioxide (CO2) - has been rising steadily over the past 150 years. There are a number of lines of evidence which clearly demonstrate that this increase is due to human activities, primarily burning fossil fuels.
The most direct of evidence involves simple accounting. Humans are currently emitting approximately 44 billion tons of CO2 per year. That CO2 doesn't simply vanish. Half of it stays in the atmosphere, while the other half is absorbed by the oceans (which is causing another major problem - ocean acidification).
We also know the atmospheric increase is from burning fossil fuels because of the isotopic signature of the carbon in the atmosphere. Carbon comes in three different isotopes, and plants have a preference for the lightest one, carbon 12. Anything that eats plants, or eats things that eat plants, inherits that light carbon signature. So do the colossal tonnages of geological deposits made from ancient life - in other words the fossil fuels. So if the fraction of carbon 12 in the atmosphere is increasing, which it is, we know the increase is due to burning fossil fuels.
The fact that humans are responsible for the increase in atmospheric CO2 is settled science. The evidence is clear-cut.
Human Greenhouse Gases are Causing Global Warming
There is overwhelming evidence that humans are the dominant cause of the recent global warming, mainly due to our greenhouse gas emissions. Based on fundamental physics and math, we can quantify the amount of warming human activity is causing, and verify that we're responsible for essentially all of the global warming over the past 3 decades. The aforementioned Foster and Rahmstorf (2011) found a 0.16°C per decade warming trend since 1979 after filtering out the short-term noise.
In fact we expect human greenhouse gas emissions to cause more warming than we've thus far seen, due to the thermal inertia of the oceans (the time it takes to heat them). Human aerosol emissions are also offsetting a significant amount of the warming by causing global dimming. Huber and Knutti (2011) found that human greenhouse gas emissions have caused 66% more global warming than has been observed since the 1950s, because the cooling effect of human aerosol emissions have offset about 44% of that warming. Figure 8 shows a more recent assessment (from IPCC AR6) of the components of the overall temperature forcing.
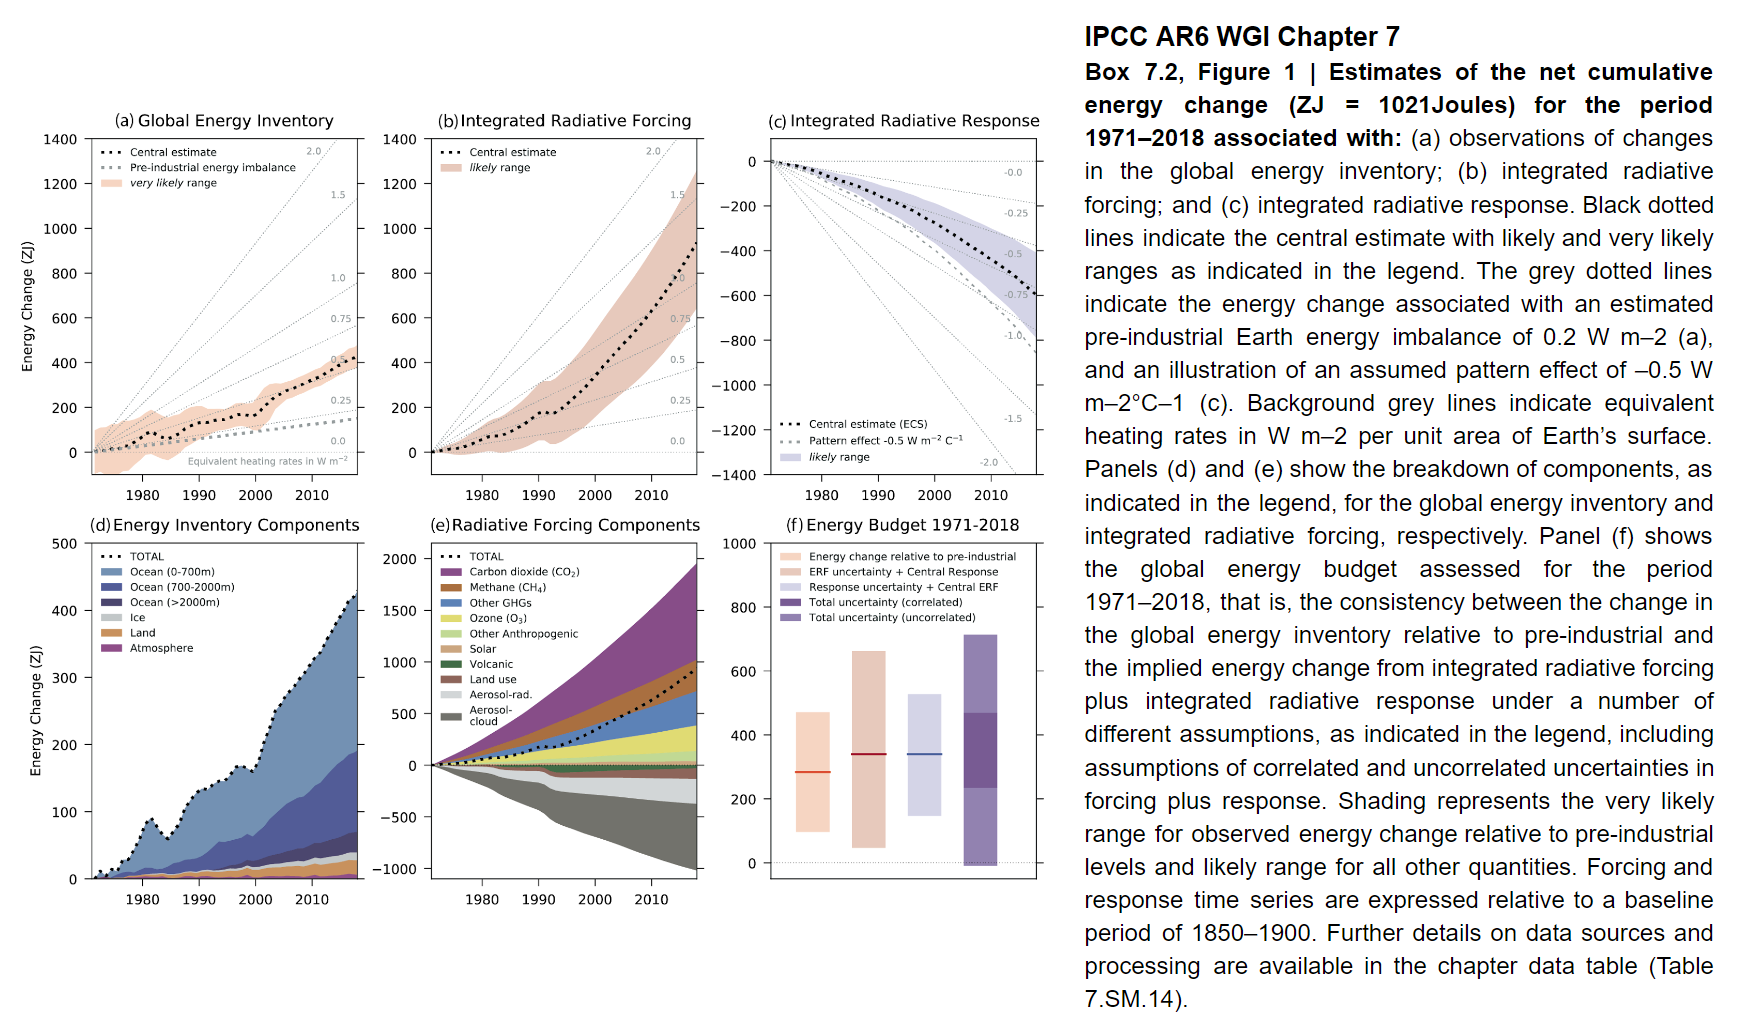
Figure 8: Contributions of individual forcing agents to the total change in the decadal average temperature for the period 1971-2018. Graphic from IPCC AR6 Working Group 1, Box 7.2 fig.1 panel (e). LH scale is energy change in ZJ. Click image to see the full graphic.
Fingerprints in the climate system
There are also numerous 'fingerprints' which we would expect to see from an increased greenhouse effect (i.e. more warming at night, at higher latitudes, upper atmosphere cooling) that we have indeed observed (Figure 9).
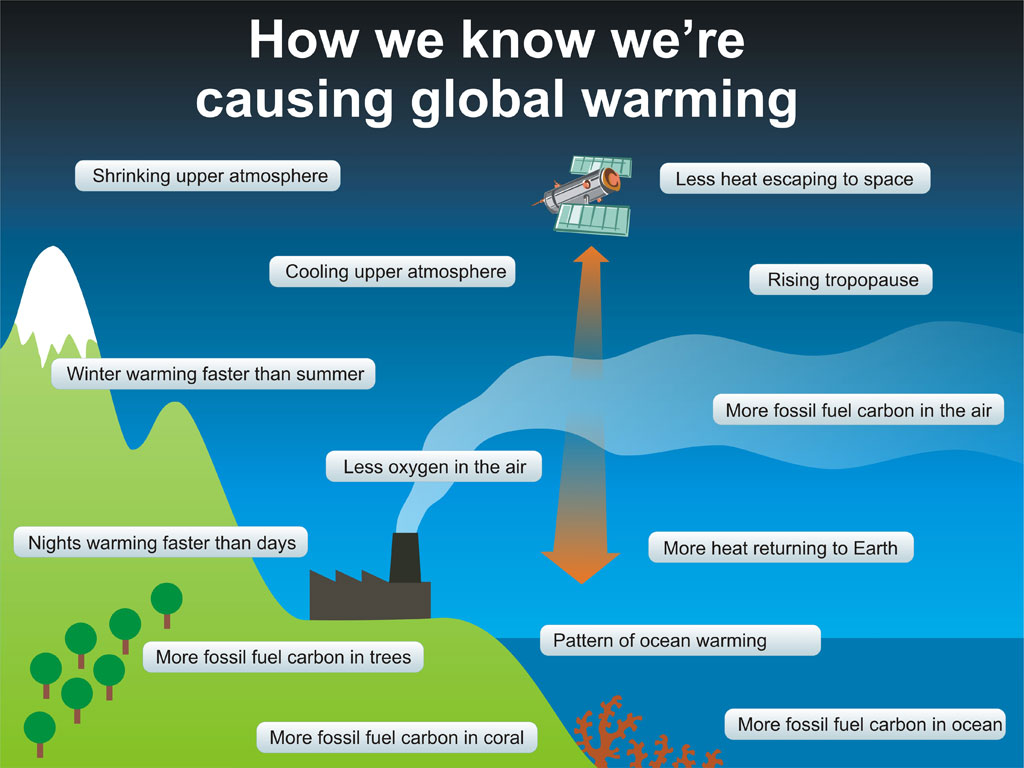
Figure 9: Observed 'fingperprints' of man-made global warming (described here and here).
Climate models have projected the ensuing global warming to a high level of accuracy, verifying that we have a good understanding of the fundamental physics behind climate change.
Sometimes people ask "what would it take to falsify the man-made global warming theory?". Well, basically it would require that our fundamental understanding of physics be wrong, because that's what the theory is based on. This fundamental physics has been scrutinized through scientific experiments for decades to centuries.
The Warming will Continue
We also know that if we continue to emit large amounts of greenhouse gases, the planet will continue to warm. We know that the climate sensitivity to a doubling of atmospheric CO2 from the pre-industrial level of 280 parts per million by volume (ppmv) to 560 ppmv (at the beginning of 2023 we were at 420 ppmv) will cause 2–4.5°C of warming. And we're headed for 560 ppmv in the mid-to-late 21st century if we continue business-as-usual emissions.
The precise sensitivity of the climate to increasing CO2 is still fairly uncertain: 2–4.5°C is a rather wide range of likely values. However, even if we're lucky and the climate sensitivity is just 2°C for doubled atmospheric CO2, if we continue on our current emissions path, we will commit ourselves to that amount of warming (2°C above pre-industrial levels) within the next 75 years.
The Net Result will be Bad
There will be some positive results of this continued warming. For example, an open Northwest Passage, enhanced growth for some plants and improved agriculture at high latitudes (though this will require use of more fertilizers), etc. However, the negatives will almost certainly outweigh the positives, by a long shot. We're talking decreased biodiversity, water shortages, increasing heat waves (both in frequency and intensity), decreased crop yields due to these impacts, damage to infrastructure, displacement of millions of people, etc. (Figure 10).
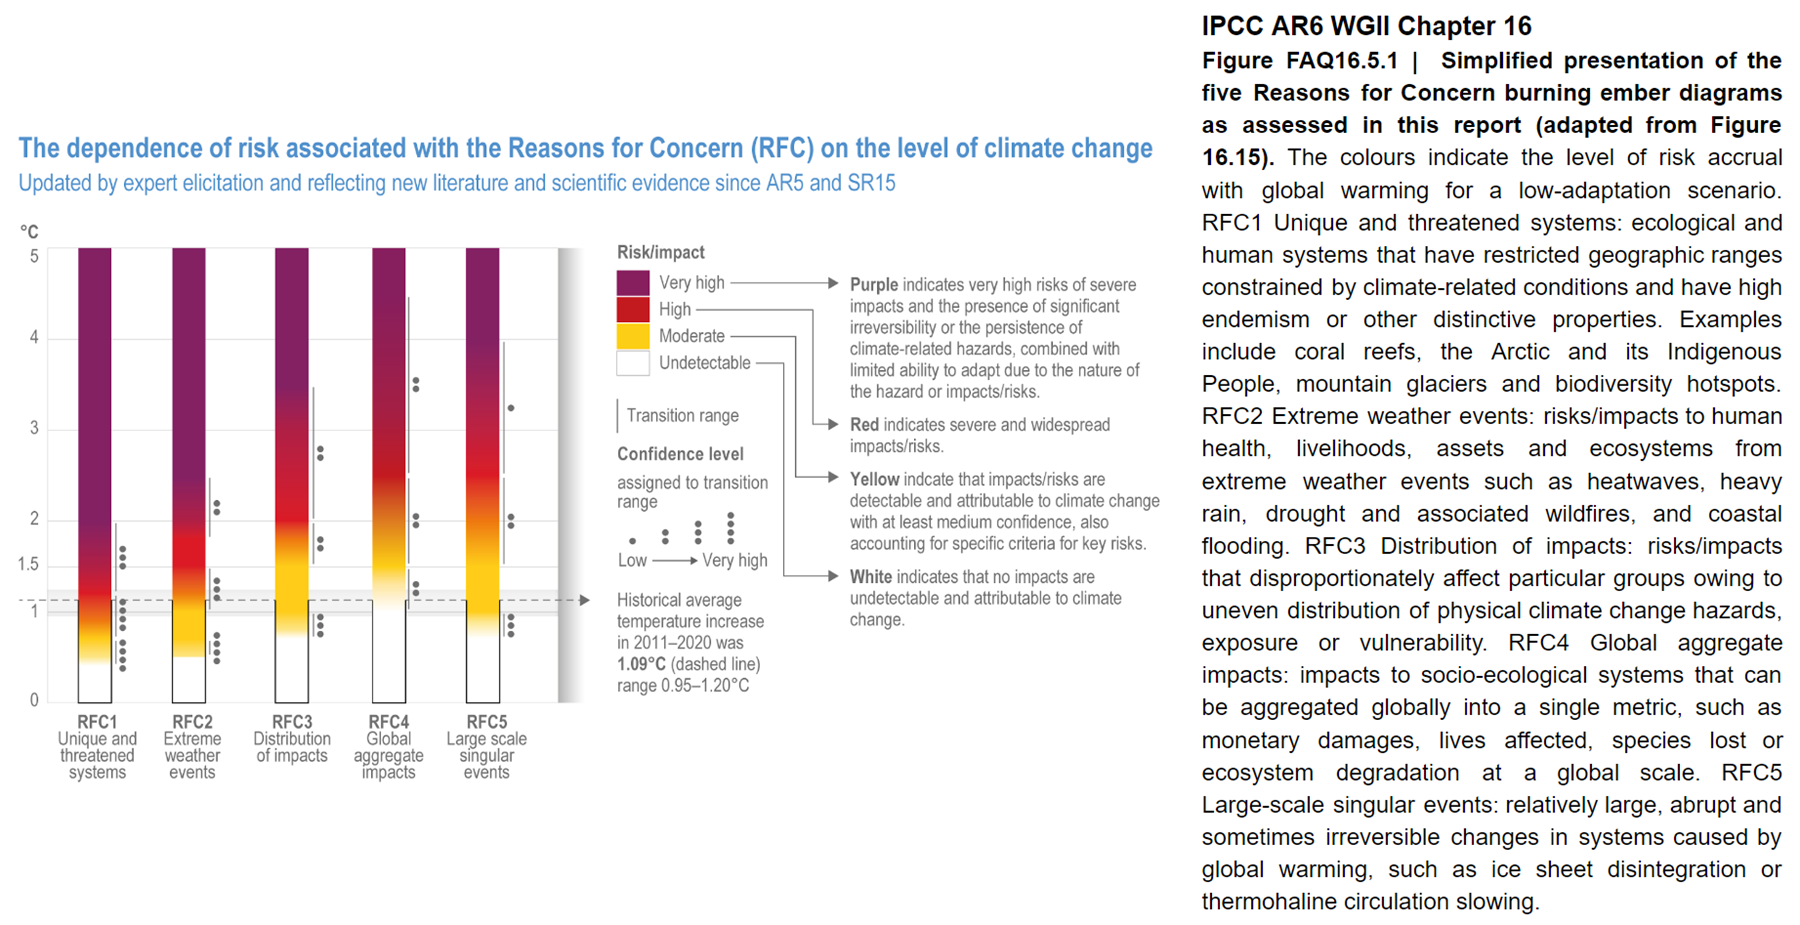
Figure 10: Simplified presentation of the five Reasons for Concern burning ember diagrams as assessed in IPCC AR6 Working Group 2 Chapter 16 (adapted from Figure 16.15, Figure FAQ 16.5.1).
Arguments to the contrary are superficial
If there's one theme we've found in studying politically-motivated criticisms of climate science, it's that they're consistently superficial. For example, the criticisms of James Hansen's 1988 global warming projections never go beyond "he was wrong," when in reality it's important to evaluate and learn from such projections and their outcome i.e.what actually happens. Then again, those who argue that "it's the Sun" ignore the fact that we understand the major mechanisms by which the Sun influences the global climate: furthermore we study and monitor them on a continual basis. We know it's not the Sun because the data say so. Finally, those who argue "it's just a natural cycle" can never seem to identify exactly which natural cycle can explain the current warming, nor can they explain how our understanding of the fundamental climate physics is wrong.
There are legitimate unresolved questions
Much ado is made out of the expression "the science is settled." The science is settled in terms of knowing that the planet is warming rapidly, and that humans are the dominant cause.
There are certainly unresolved issues. As noted above, there's a big difference between a 2°C and a 4.5°C warming for a doubling of atmospheric CO2, and it's an important question to resolve, because we need to know how fast the planet will warm in order to know how fast we need to reduce our greenhouse gas emissions. There are significant uncertainties in some feedbacks which play into this question. For example, will clouds act as a net positive feedback (by trapping more heat, causing more warming) or negative feedback (by reflecting more sunlight, causing a cooling effect) as the planet continues to warm? And exactly how much global warming is being offset by human aerosol emissions?
These are the sorts of questions we should be debating, and the issues that many climate scientists are investigating. Unfortunately there is a very vocal contingent of people determined to continue arguing the resolved questions for which the science has already been settled. And when climate scientists are forced to respond to the constant propagation of misinformation on these settled issues, it just detracts from our investigation of the legitimate, unresolved, important questions.
Smart Risk Management Means Taking Action
People are usually very conservative when it comes to risk management. Some of us buy fire insurance for our homes when the risk of a house fire is less than 1%, for example. When it comes to important objects like cars and homes, we would rather be safe than sorry.
But there is arguably no more important object than the global climate. We rely on the climate for our basic requirements, like having enough accessible food and water. Prudent risk management in this case is clear. The scientific evidence discussed above shows indisputably that there is a risk that we are headed towards very harmful climate change. There are uncertainties as to how harmful the consequences will be, but uncertainty is not a valid reason for inaction. There's very high uncertainty whether I'll ever be in a car accident, but it would be foolish of me not to prepare for that possibility by purchasing auto insurance. Moreover, uncertainty cuts both ways, and it's just as likely that the consequences will be worse than we expect as it is that the consequences won't be very bad.
We Can Solve the Problem
The good news is that we have the tools we need to mitigate the risk posed by climate change. A number of plans have been put forth to achieve the necessary greenhouse gas emissions cuts (i.e. here and here and here). We already have all the technology we need.
Opponents often argue that mitigating global warming will hurt the economy, but the opposite is true. Those who argue that reducing emissions will be too expensive ignore the costs of climate change - economic studies have consistently shown that mitigation is several times less costly than trying to adapt to climate change (Figure 11).
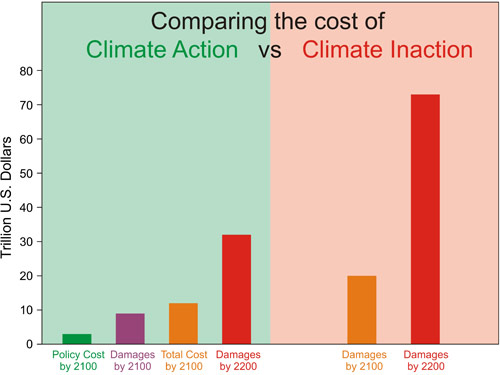
Figure 11: Approximate costs of climate action (green) and inaction (red) in 2100 and 2200. Sources: German Institute for Economic Research and Watkiss et al. 2005
This is why there is a consensus among economists with expertise in climate that we should put a price on carbon emissions (Figure 12).
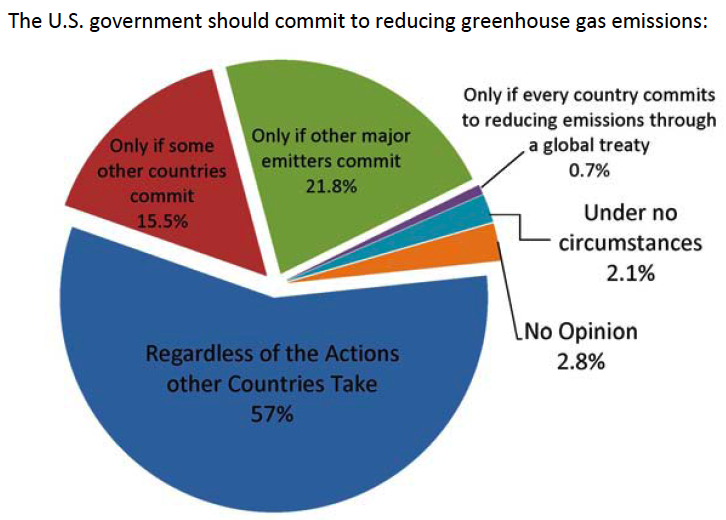
Figure 12: New York University survey results of economists with climate expertise when asked under what circumstances the USA should reduce its emissions (Policy Brief: Economists and Climate Change. Consensus and Open Questions, Holladay et al. 2009)
The Big Picture
The big picture is that we know the planet is warming, humans are causing it, there is a substantial risk to continuing on our current path, but we don't know exactly how large the risk is. However, uncertainty regarding the magnitude of the risk is not an excuse to ignore it. We also know that if we continue on a business-as-usual path, the risk of catastrophic consequences is very high. In fact, the larger the uncertainty, the greater the potential for the exceptionally high risk scenario to become reality. We need to continue to decrease the uncertainty, but it's also critical to acknowledge what we know and what questions have been resolved, and that taking no action is not an option. Th good news is that we know how to solve the problem, and that doing so will minimize the impact not only on the climate, but also on the economy.
The bottom line is that from every perspective - scientific, risk management, economic, etc. - there is no reason not to immeditately take serious action to mitigate climate change. Failing to do so would be exceptionally foolish. Or, as the late Nobel Prize-winning scientist Sherwood Rowland (1927-2012), who made the 1970s discovery that chlorofluorocarbons (CFCs) in our atmosphere cause major damage to Earth's ozone layer, put it many years ago:
"What's the use of having developed a science well enough to make predictions if, in the end, all we're willing to do is stand around and wait for them to come true?"


Gootmud @100 ,
you are right that shutting down the old reliable (fossil fuel) power sources is premature, pending the establishment of a fully resilient new renewables and/or nuclear power system. That's simply common sense. Just as it's simply common sense to press ahead rapidly to achieve "Zero Nett Carbon", even though that will take decades to complete the transition.
But you are in the wrong, to think that "models" are vital (or even mildly important) in making a sensible pragmatic assessment of the climate situation. For example, back in the 1890's [not a misprint] a scientist was able to make a reasonable assessment of what happens as CO2 atmospheric level increases. All he needed to use was a pencil & paper [not a model or a computer in sight]. Granted, he had a better brain than me (and possibly than you, too). He was not in any way dependent on complex "models". Nor, using common sense, do the conclusions of climate scientist of today need more than basic physics ~ helped along by paleontological knowledge of Earth's climate history.
Economics ~ yeah, not really much of a science. Too much Friedman and freedom from common sense.
Eclectic @101,
Yes, everyone agrees with Arrhenius that more CO2 means warmer temperatures, all other things being equal.
Which is fine as a thought experiment, but in real life other things are nowhere close to equal. Questions like what the temperature will be in 2050, or how much CO2 matters versus other climate drivers, require a much more detailed understanding of climate dynamics. Which is why researchers have spent decades developing elaborate computer simulations. These models are indeed vital to many of the article's claims.
Gootmud @102 ,
Quite agree, if you want some fine-tuning of predictions of future conditions ~ then go do your best with some complex math workings & models. Not an easy task to be very "fine".
But if you need pragmatic guidance as to what policies & actions are needed right now in the present day ~ then models are not necessary. Common sense is the necessary ingredient . . . and if you are interested in fine-tuning, then you can reassess the situation in 10 years regularly.
The climate scientists already have a sufficiently good idea of the relative importance of CO2 forcings in the overall Big Picture. Unlike the delightfully vague insinuations made by Dr Judith Curry & Co., there are no hidden Martians mysteriously manipulating Earth's climate (or if there are, then they are tragically ineffective at it).
Just having first coffee of the day so will deal with comment #100 in a piecemeal fashion.
"Sections 6 (Human GG are causing global warming) and 8 (warming will continue) overstate the case. We know those to be true not from a simple application of "fundamental physics" but from elaborate computer models trying to approximate physics too complex for us to grapple with any other way."
Assuming the first principles of this topic are correct (they are) then how can that statement be inaccurate? We've known for over 150 years that if GHG concentrations are driven upwards, then a warmer climate will be the eventual result and that the warming will take decades to develop to its fullest extent. Now that may be a blunt object approach, but remember that set of conclusions was reached long, long before computers were around.
Models are not perfect but nevertheless extremely useful. They help us interrogate complex and highly variable systems to see how they respond to changes in those variables. Think of them as tools in the tool-kit, alongside observations, human resources, basic principles and so on. For we don't need models to tell us it will carry on warming the more CO2 emissions grow. We;ve known that all along.
Eclectic @21,
Knowing about a greenhouse effect in principle gives us no guidance at all about what to do in practice, since a thousand other effects are also at work.
In principle sun exposure causes skin cancer. Does it follow we should remain indoors at all times? Of course not, because a thousand other principles also apply. We need to do things. We need vitamin D. We have evolved defenses against skin cancer. And so on.
Gootmud @106 , I've no argument against vitamin D, in moderation.
But when you apply common sense to the situation, it is evident that the "thousand other effects" must be so exquisitely balanced against each other as to be in toto largely insignificant in comparison to the well-known Usual Suspects [insolation, albedo, aerosols, and of course the biggies of the Greenhouse gasses group].
As a follower of (but not disciple of) the vague hand-wavey arguments put forward by Dr Curry, that forces unknown to human science are steering our planet's climate . . . I must say that Dr Curry is a disappointment, for she has provided no worthwhile evidence to back her statements.
I will say two points in Dr Curry's favor :-
(A) She has not actually mentioned Martians in her testimony to Congressional Committees ;
(B) She is not a science-denier of the Greenhouse Effect.
Rob Honeycutt @91
Unfortunately, you made a wrong interpretation of the text. The 'neglectable' is about the influence of meltwater from Greenland in western Europe. On global scale this meltwater isn't neglectable, and on locale scale (western Europe) the gravity effect isn't neglectable. The last two things can neutralize each other. I hope it's clear now.
Eclectic and John Mason @104
We do need models to predict whether it will keep on warming. As CO2's absorption spectrum saturates, it can't trap more heat. Negative feedback effects like clouds might nullify any warming. Temperatures might drop due to independent effects like magnetic field changes much more influential than the greenhouse effect. We might be at 600ppm, freezing, and looking for ways to warm the Earth and slow the advancing ice.
Without models that account for all these effects, we.know nothing about future temperatures. We don't know ranges of likely changes. We don't even know the sign. A model need not be perfect--no model is ever perfect--but it must be representative of all the relevant physics if we are to trust its output.
Gootmud @109,
CO2 will not "saturate" prior to the planet warming to ridiculously high levels. The potential for some magic negative feedbacks to counteract further GHG warming or for some magnetic field effect to appear is lower enough to be ignorable. And I don't see why you need complex models to tell you that.
Bart @108... No, I have not made the wrong interpretation of the text. I'm reading it correctly. The word is not "neglectable," it is "negligible." And "negligible" means it's so small that it can be ignored. The word "neglectable" in the context of this discussion is nonsensical.
Bart... At this point I would highly suggest you thoroughly read the paper you're citing because you're just not grasping what they're discussing. In particular take note of the scale of the maps. They're talking about fractions of a millimeter per year. So, at maximum, they're saying the effect around Greenland (deep blue) over the course of the next century would be on the scale of 5 cm, out of a potential of 1-2 meters of SLR.
The region they refer to (northern Europe including the Netherlands, Atlantic coastline of Germany and along theArctic coastline of Russia [Fig. 2a]) would have a negligible effect, meaning neither net positive nor net negative. In other words, no effect.
Here is a link to the paper so you don't have to look it up again. Please read it thoroughly and carefully.
For purposes of clarity...
Bart, @108 you stated, "On global scale this meltwater isn't neglectable (sic), and on locale (sic) scale (western Europe) the gravity effect isn't neglectable (sic). The last two things can neutralize each other. I hope it's clear now."
On a global scale there is clearly an important effect.
On a local scale (western Europe) the effect is negligible, meaning almost no effect at all, positive or negative.
The part where you say, "[t]he last two things can neutralize each other" is completely wrong. This is what I'm trying to explain to you.
You have made a very specific claim about the science. You have provided a citation to research in support of that claim (both good), but your interpretation of the citation is in error.
This is the time where it would be rational to carefully think about this, admit your error, and move on.
Gootmud @102... One correction there. Arrhenius' work wasn't a thought experiment. It was actually based in what was mathematically understood at the time about radiative absorption spectra and the product of extensive calculations, all done without benefit of computers. Just lots of laborious pencil and paper calculations, I'm sure with the help of a small army of lab assistants.
MA Rodger @110, saturation is already here. More CO2 can't make the sky much darker than it already is within its absorption bands.
Negative feedback effects and magnetic fields are likewise neither magic nor speculative. They're demonstrably real physical phenomena, just like the greenhouse effect. Figuring out how all these factors interact to create warming or cooling climate is a dizzyingly complex job that can only be attempted with computer models.
[BL] Frankly, Gootmud, you are very badly misinformed.
If you want to talk about saturation, the place to learn where you are wrong is on this thread:
At a guess, your "magnetic fields" probably has something to do with cosmic rays. Here is where you can find out you are wrong:
For computer models, you need to go here:
And please read the Comments Policy.
Rob Heneycutt, back to your original remark @74. There you say
"Hang on. Am I missing something or is Bart actually thinking that the gravitational mass of Greenland is going to pull sea level away from The Netherlands, when it's 3000km away, making their impacts of SLR nominal? Surely not."
Yes, I am actually thinking something like that. But it's a little different. At the moment the gravitational mass of the ice is attracting mass. 3000km is no problem, the influence goes much further. So, because of the ice mass the sea level here is higher then it should be without the ice. When the ice melts a part of this effect is gone, and because of that the sea level will drop here. On the other hand, there's the meltwater that distributes over the ocean. That aspect makes the sea level rise. The sum of these to is slightly positive.
And now you say:
"They're talking about fractions of a millimeter per year. So, at maximum, they're saying the effect around Greenland (deep blue) over the course of the next century would be on the scale of 5 cm, out of a potential of 1-2 meters of SLR."
Yes I do agree with most of that, so whats the point? The 2 m SLR is a bit to wild, KNMI talks about max 1.2 m in 2100.
Gootmud @109 ,
you seem very alarmed at the imminent prospect of Earth's oceans freezing over or becoming boiling hot. Have you been reading alarmist blogs such as Dr Judith Curry's ? . . . or the even less scientific WattsUpWithThat ? Warning ~ those "contrarian" sources are lacking in common sense.
And there is no need for you to be alarmed about climate scientists using "models". The scientists are not clueless about Earth's future climate ~ they are guided by a good knowledge of basic physics plus knowledge of Earth's climate responses to altered Greenhouse Gas levels in the past millions of years. And also by recent responses to volcanic aerosol events and minor fluctuations in solar output.
No models are required to get a straightforward understanding of how climate changes occur. Please feel more relaxed, and take the time to educate yourself from genuinely scientific sources.
But you need to be careful not to be fooled by the many BS sources (such as Curry's or the WUWT mentioned above).
Eclectic @117,
So...trust the experts?
Bart @ various posts...
You don't see the problem with comparing numbers in % and mm/yr? You do understand the importance of units in geophysical measurements, don't you? 32°F is not warmer than 15°C. A person walking at 6km/hr is not moving faster than an airplane doing mach 0.8.
% is a ratio between two values that use the same units. It has a numerator and a denominator. The mm/yr in your figure in comment 84 are a "relative sea level change" - they are a difference from some unspecified base. They need context to become meaningful, and comparison is only possible if you can resolve differences in context and produce numbers with the same units.
Repeatedly in this forum, you fail to give context to quotes, diagrams, papers, etc. You change contexts at a whim, making your comments hard to follow and difficult to perceive. If you think people are misunderstanding you, then spend more time preparing your comments.
Now, back to your diagram posting in #84 (and repeated in #94). You failed to give context - in particular, you failed to given any indication of what those values are relative to. You also failed to give any source, until I asked. You didn't even include the caption that goes with the figure. Here is the figure, with caption:
Note that the caption says "relative sea level variations due to the gravitational and Earth rotational effects of ice mass loss". [Emphasis added]
Do we have any other things to consider as context? How about the last paragraph of the paper's introduction?
So, figure 2 in their paper has a lot of context that you have left out. What do they say about their analysis? At the bottom of page 623, they say:
And here is their figure 4:
Things aren't looking so rosy for The Netherlands in that image. It certainly is not going to escape the effects of rising sea levels.
What else do Bamber and Riva have to say about their work?
The paper clearly indicates that this regional fingerprinting (as displayed in their figure 2) is only one small part of a Big Picture (to get back to the topic of this blog post).
One more aspect of the paper you link to: it is doing an analysis base on Grace and other data up to 2008 - it is not a projection into the future. They even put a caveat in their Methods section (p622):
In short, you are frequently leaving out context of the information you provide - and as a result you are way over-stating the significance of what you present. Whether this in intentional or not, we cannot know.
All of this comes back to my very first question to you after your first comment here:
You would be much better off with a small number of well-thought-out, reasoned, well-referenced posts than the scatter-blast that you've been doing.
Bart @116... The paper you're citing to making this claim says the opposite. It's saying there is virtually no effect on SLR in the Netherlands. The maps you keep posting from that paper confirm exactly this, that there is virtually no effect. It's at the zero point on the scale, so it is not taking away anything and not contributing anything.
Gootmud @118 ,
I recommend you trust common sense. Give it a try !
No need to follow the alarmist contrarians at WUWT & similar. You have allowed yourself to be seriously misled. (But why did you choose that?)
Bart @116... You asked, "Yes I do agree with most of that, so whats the point?"
My point is, you're claiming that the Netherlands would see some level of benefit from the gravitational effects of the Greenland ice sheet melting, and that is demonstrably incorrect. Again, as your own citation states, the effect on the Netherlands is negligible. In other words, there would be little or no effect at all.
Gootmud @115... I think you might benefit from a better understanding of how the greenhouse effect operates to warm the surface. In one sense, you are correct that the "saturated" in the sense that from the surface IR is going to interact with CO2 molecules. But the effect continues up through the vertical profile of the atmosphere, and since CO2 is a well-mixed gas, this is occurring at every level. The effect continues until IR reaches "emission altitude."
We know the earth emits at 255K (-18°C). The point in the atmosphere where it cools to that temperature is the effective emission altitude for IR leaving the earth. Lower altitudes can be "saturated" but what matters is the thermal gradient. As you add more CO2 that effective emission altitude rises, and when it rises the surface warm.
And that is all a very critical part of the Big Picture, here.
[PS] Any further discussion of the saturation myth belongs here which also deals with the misconceptions in detail.
Gootmod - I would ask you to please use the "search" function, (top left) or the Arguments menu option to find frequently discussed points rather than here.
Bart Vreeken,
Your post at 87 claims that "michael sweet @72 says my 12.5% was too low,"
Looking at post 72, I make no claims at all. I show a copy of ice lost on Greenland. I do not mention your claim at 12.5% at all. I believe htat I have never mentioned your claim at all.
It is poor argumentation to make obviously false claims.
michael sweet @124, it's a discussion about nothing.
I made an estimation of the part of the meltwater of Greenland that makes te sea level rise in the Netherlands. I showed a map where this estimation was based on. You showed a map with more melting on the westcoast of Greenland, so according to that my estimation was wrong.
In fact, this 12.5 percent was a wild guess, to show that only a minor part of the meltwater will influence the Netherlands. But the number kept coming back; Bob Loblaw wanted to know exactly where it came from and called it a 'magical number'.
The first time I saw a graphic depicting " TEN SIGNS OF A WARMING WORLD" was in 2010, with this NOAA page. It still remains relevant.
NOAA - 10 Signs of a Warming World
Ah, I see that Bart continues to do revisionist history on the discussions in this thread.
To start, Bart, the next time you make a "wild guess", please identify it as a wild guess.
Your 12.5% wild guess first appeared in comment 44, where you said:
No qualifications there - Bart expressed this as a pretty definitive statement. The context (there is that awful word again) was with respect to Bart's attempts to justify his use of a simple extrapolation of current trends to predict sea level rise by 2100, introduced in comment # 27. He doubled-down on that extrapolation in comment #35., where he also mentioned Greenland.
Bart refines the "10-15%" to "12.5%" in comment # 52, where he says:
At this point, he is making it appear as if the 12.5% value is "according to the IPCC". Again, no qualifications to the statement, no indication that the context is changing from "according to the IPCC" to "according to a wild guess by Bart Vreeken".
When challenged for a source, Bart posts a link to a diagram (in Dutch) that gives an incomplete explanation. Then in comment #84, he provide another figure with no caption and no source. Eventually he provides more diagrams and (after a request) the original source of the diagram.
And now he finally admits that his 12.5% value was "a wild guess", after spending days trying to make it look like it was a definitive value supported by various sources.
Do you understand, Bart, that by leading these wild goose chases - as other try to understand where your wild guesses come from - you have largely lost credibility here?
Bart Vreeken,
In addition to Bob Loblaw's helpful comments (and the helpful cmments of many others), my comments, particularly my comment @99, may help people understand what is going on.
And again the discussion isn't closed yet. It's a bit boring now.
I posted the figure of how the melting water from Greenland works out in the Netherlands. That's quite clear. The only question is the more exacte place on Greenland where the melting water comes from. There are differences in that from year to year, and between the sources (gravimetry, altimetry). But looking at the map below, I think my guess was not so very bad. It's the line through the middle of Greenland. And I never said that the number came from the IPCC, that's what Bob Loblaw makes of it.
[DB] Tedium and argumentative snipped.
This new BBC report on the "UN climate report: Scientists release 'survival guide' to avert climate disaster" helps understand what is going on.
Tragically, it appears that the most obvious 'immediately available ways to reduce harmful emissions' are still not being discussed and prioritized.
Reducing unnecessary energy consumption, and other consumption, along with focusing on rapidly transitioning the remaining 'essential consumption' to less harmful ways of living, has always been an available option. Reduced consumption by the people who have developed a liking for harmful over-consumption reduces how much energy system transition is required.
The problem is when personal interests lead to regional leadership interests being governed by the pursuit of positive perceptions (harmful misunderstandings or distractions from learning about what is harmful) that excuse or dismiss the undeniable evidence-based need for people to learn to be less harmful and more helpful to Others (and the future of humanity is a massive number of 'Others deserving consideration').
One planet etc. @ 128
What exactly is youre question? Looks like you think that I'm only interested in climate change in The Netherlands. Well, not at all.
Years ago I posted an overview of the temperature data of many American and European stations on an American climate forum. When you click on the name of a city you find a whole range of temperature data, presented in stripes. Some month later Ed Hawkins presented his 'warming stripes'. Where did he get the idea....? Hmmmm.
logboekweer.nl/International/EuropeTemperatureHistory.htm
https://logboekweer.nl/International/UnitedStatesTemperatureHistory.htm
Unfortunately, the data of the US are not very up-to-date. I should make an update, but it's a lot of work. Europe is better (not everywhere)
[BL] Link fixed, as per comment 133.
Link to the American temperature data (retry)
logboekweer.nl/International/UnitedStatesTemperatureHistory.htm
Bart @ 129:
Once again, as you did in your first series of comments on the Antarctic thread, after a series of posts you are resorting to "I never said that", even though it is clear that what you did say left that impression. I stand by my statements in comment # 127.
You are getting boring and predictable. If you want to avoid having people get the wrong impression, learn to write clearly.
HI One World, and also Rob made some sea level comments as well.
Im sorry I don’t have more time, and some of you commit large swaths of time here and I appreciate that.
Using NASA data, presuming they have the best resources and equipment, satellites and those argo sea probes et al. to gather original data, they show sea level rising since 1993 to be 3.8 inches.
https://sealevel.nasa.gov/
But what I think you are trying to indicate, and what the graphs show mostly, are that the rate of sea rise increases as the warming continues higher and higher. An exponential effect is presented. So taking past temperature increases will not explain future expected gains. It is either an exponential increase or the suggestion is that the increase is delayed so that as we go up in temperature, the rise happens decades later and there is a build.
I think we have finished with the run away suggestions for nature. The train bearing down on a child and all that. I see that as tactics to get people to listen and pay attention, but nothing true in our environment. Nature balances. She reacts. This Co2 rise is a reaction and right now she is reacting to this human population boom, which is unprecedented in history. And all the energy use associated with all these new counts of people on earth, living longer and healthier than ever, this is increasing Co2 counts and enriching our surface world in all the ways Co2 can do that.
Nasa used 4-5 scales to predict sea rise, 1. tracking if nothing is done, 2. some is done and 3. complete zero new emissions is achieved ( which cannot happen until the population levels out in 60 or so years ).
By 2100 there is Nasa modeling of .4 to .8 meter rise, using the data set of 2. some is being done. Doing what we can will be instrumental in keeping high tide from being higher than usual in that future time. I’ve tries to stay with the median predictions, so this is not discrepancy conversation of the outer 5%’s.
Science American believes no new storms are made but the severity of moisture based storms may increase by 2-4 miles per hour. The threat of sea rise is about the most serious threat.
I understand better where you are coming from. I still have the higher philosophical orientation to grapple with.
If mankind has finally achieved the goal of conquering the mission of dreams pondered throughout the pain filled ages, of solving misery and pain and finding medical success beyond any expectations. Is this worth it? A sea level rise?
The highest gain has been with infant mortality, which has plummeted from the high middle ages at 400-500 per thousand to 5.5 infants per thousand today. Think of all the occasions of birth deaths which also took the mother too, to quantify misery. That and antibiotics alone have caused this phenomenon of Co2 rise. Life spans have increased 61%, living conditions have soared, medicine is in a wonderland of abilities and birth to adulthood stats are beyond anyone’s wildest dreams. The question is; is that worth a side effect of sea level rising a foot and a half, maybe 2 feet at high tide.
This endeavor appears to goad and cajole and shame people using fossil fuel and I suppose that is the fastest way to get attention. But I do not believe it to be honest. This appears to be unwittingly human caused and one must decide if it is worth the subsequent consequences ahead. It is not from derelict and wanton people, it is from the results of scientific achievement, sought after for ages and finally achieved within the science that coincided with the industrial revolution. The origin of this is important to be able to consider context to this issue. If I were there and had the choice in my hands, I’d have us standing exactly where we were today. Reducing Co2 is still important, but I wouldn’t be bullying any brothers from any mothers over this. It is important, but not that important all things considered.
[BL] You have made this comment on two different threads. Here, and on the "It's not bad" thread.
This is considered bad form. Pick one location. You can create a link to your comment on another thread (as I have here) if you want to call attention to it, but do not post the original content multiple times.
I read: "peppers at 02:50 AM on 21 March, 2023"
There's something strange going on. In Europe it's still March 20. Do you read the same over there?
Has the world started turning the other way round? Or is the internet mixing up times and dates? I didn't notice this before but is started earlier.
SkS is originally an Australian site, still based in Australia as far as I know, despite John Cook now pursuing higher achievements in the US.
Ah thank you Philippe, I didn't know that.
Philippe @ 136 & Bart @ 137
John Cook created SkS in 2007 in Australia which is why it's running on Australian time. After 4 years in the U.S. at George Mason University, John moved back to Australia 2 years ago and is now at the University of Melbourne.
Bart @132/132... a) Your map graphics are pretty darned useless without temperature scales, plus clicking on the map does nothing for me. b) That's a pretty outrageous insinuation that Ed Hawkins, a well-known and respected climate scientist, stole the warming stripes idea from you.
Peppers @134... (sigh) Not even gonna read it, in either place you posted.
Hi Rob @139
Thank you for your comment. What do you mean "clicking on the map does nothing for me"? You should see things like this:
logboekweer.nl/International/America/NYC%20(CENTRAL%20PARK)_Temp.pdf
Where does it go wrong? Is it both US and Europe?
How can you say that there is no temperature scale when the links don't work? As you can see the temperature scale is on the bottom of the page.
I didn't say that Ed Hawkins stole the warming stripes idea from me. Of course, he may have come up with the idea himself. He declares that it came from seeing a painting. But for me it was very coincidental.
Rob @ 139:
In spite of Bart's map stating (on the US one):
...you actually need to click on the place names on the map to get a page showing data for that city. Clicking anywhere else on the map does nothing.
Another case of Bart saying one thing, but meaning something else.
On Bart's European map, he says:
"Here" is not the map you're looking at - it's in the images you will see if you figure out that "clicking on the map" means "clicking on the city names on the map". Likewise, the colours on what you see "here" (the map) are not temperatures - it's just elevation shading.
You need to find a Bart-->English, English-->Bart dictionary.
Bart and Bob... Okay, I see now that you have to carefully select a small area on the map to get the temperature link to show.
Bart... When you say, "Some month later Ed Hawkins presented his 'warming stripes'. Where did he get the idea....? Hmmmm" ...that implies that he took the idea from you.
If I'm not mistaken this is just a tool used when coding with R. All Hawkins did was apply the tool to global temperature.
Rob Honeycutt @143
"...that implies that he took the idea from you."
That implies that that was my thought. My site had a lot of visits from the US then.
"If I'm not mistaken this is just a tool used when coding with R. All Hawkins did was apply the tool to global temperature."
Of course it's an easy thing to do but when I started with it nowbody did, as far as I know. But it's OK for me, it's a good way to show climate change.
Bart... "...when I started with it nowbody did, as far as I know." Is this going to be like the paper you cited but hadn't read?
So far, without much effort, I've found similar techniques applied going back to 2016.
Ah, look! Graphical heat mapping has been a tool in R since at least 2010.
https://flowingdata.com/2010/01/21/how-to-make-a-heatmap-a-quick-and-easy-solution/
Well, that's great, Rob Honeycutt @ 146. That makes it even more remarkable that nobody made graphs with temperature stripes before I did in 2011 (NL), 2012 (D) and 2015 (USA). As far as I know.
I was wrong with the publication date of het Climate strips. It seems to be in 2018, not 2016. It's a good commercial concept anyway, you can buy socks, cups, sweaters etc. with the pattern now.
www.climate-lab-book.ac.uk/2018/warming-stripes/
That's a really cynical response, Bart. The point is, you are not the first. Heat mapping is a common graphing technique and you can't claim to have invented it. Ed Hawkins merely popularized it by applying it to global temperature with a particular color scale. In fact, climate scientist, Elie Highwood, crocheted warming stripes in 2017 inspired by a technique done by other crocheters called "sky blankets" where they crochet colors as they go based on the color of the sky that day.
I still haven't seen an example from before 2015, Rob Honeycutt.
I have shown you this is a standard method of presenting data in a graph. So, people have been doing this well before 2015. Thinking of something and not bothering to see if anyone else has done the same doesn't mean you are the first to do it.