



 Arguments
Software
Resources
Comments
The Consensus Project
Translations
About
Support
Arguments
Software
Resources
Comments
The Consensus Project
Translations
About
Support







Latest Posts
- Raw Data, Wrong Answers
- 2026 SkS Weekly Climate Change & Global Warming News Roundup #33
- Skeptical Science New Research for Week #33 2026
- The real energy use of agentic AI
- Fact brief - Are there enough minerals for solar power expansion to help mitigate climate change?
- The floods of the future won’t come one at a time
- 2026 SkS Weekly Climate Change & Global Warming News Roundup #32
- Skeptical Science New Research for Week #32 2026
- New Mexico’s clean energy success story
- Is Europe having a bad wildfire year?
- Why Hansen may end up being right about 2026
- 2026 SkS Weekly Climate Change & Global Warming News Roundup #31
- Skeptical Science New Research for Week #31 2026
- The government canceled this nature study. Scientists finished it anyway.
- Fact brief - Do solar plants require backup from fossil fuels?
- Hot days, cold thermometers
- 2026 SkS Weekly Climate Change & Global Warming News Roundup #30
- Skeptical Science New Research for Week #30 2026
- Canada's boreal wildfires aren't just bad forest management
- Dangerous and historic wildfire smoke pollution event engulfs the U.S. and Canada
- The Strongest El Niño Ever
- 2026 SkS Weekly Climate Change & Global Warming News Roundup #29
- Skeptical Science New Research for Week #29 2026
- Home batteries could become the next must-have household appliance
- Fact brief - Do electric vehicles stop working in extreme heat?
- Deadly heat wave in France shows the future of climate risk
- 2026 SkS Weekly Climate Change & Global Warming News Roundup #28
- Skeptical Science New Research for Week #28 2028
- Six charts show how clean power was world’s largest source of new energy in 2025
- Eastern U.S. broils after heat wave kills over 1,300 in Europe

Comment Search Results
Search for 0PPM
Comments matching the search 0PPM:
- CO2 is not increasing
Richz at 02:24 AM on 26 April, 2026Looking at the ice core samples shows CO2 that was being absorbed by ice. We have no clue how much CO2 was remaining in the atmosphere going back the 100k years. So isn't comparing that to the current atmospheric CO2 levels like comparing apples and oranges. And overlaying the atmospheric levels onto the ice core samples misleading. It would seem we have no idea if the atmospheric CO2 levels during each of the peaks over 400 000 years were also in the 400ppm
- Human-caused climate change is unmistakably distinct from Earth’s natural climate variability
MA Rodger at 22:44 PM on 23 April, 2026Eric (skeptic) @7,
I was a little taken aback in your comment by you saying in the context of 'slow feedbacks' that "feedback increases CO2." That is not the normal understanding of 'slow feedbacks' which are the main difference between ECS & ESS.
Folk are usually rather vague about the nature of the things dividing ESS from ECS but carbon feedbacks isn't what I find mentioned (as per here). It's usually the changing vegetation & ice cover that gets the mention, along with deep ocean warming. Melting ice/permafrost and oceans will have an associated thermal-lag element but I can't see that aspect being very great. This suggests the big part of Δforcing remaining out-of-equilibrium after ECS arrives is albedo changes.
I see two points of note - (1) The value of ESS & (2) Its relevance to the AGW situation.
(1) The main evidence supporting a significant ESS is of course the temperature and the CO2 records. And those don't come with labels showing the Δforcing involved in ESS. However, they do show ESS significantly above the usual range of ECS values (ECS =+2.0ºC to +4.5ºC) although there remains the "fat tail" in ECS analyses which sits yet higher.
The accounts of ESS have in the past put ESS = 1.5 x ECS or ESS = 2 x ECS, whatever that means number-wise. The analysis is usually applied to pre-ice age data although the OP above has also used mainly ice-age data-points and spliced them onto Judd et al (2024). (The OP figures show the Cenozoic data points of Judd et al below 700ppm CO2. So not shown is the seven Cenozoic points at higher CO2 levels. If these high points were missing also from the OP's analysis, it may explain the discrepancy between the Judd ESS [+7.7ºC] and the OP ESS [+8.2ºC].)
Judd et al (2024) Fig 4b
Of course, the ESS analyses are dependent on these temperature and CO2 reconstructions. And there is significant variation here as Judd et al Fig 4a below and Rae et al (2021) fig 7 below-again demonstrate. (At 50My bp, Judd et al have CO2 at 1,200ppm & Temp at 33ºC while Rae et al have CO2 at 1,500ppm & Temp at 27ºC which would make a significant difference in caculating ESS.)
Judd et al (2024) Fig 4a
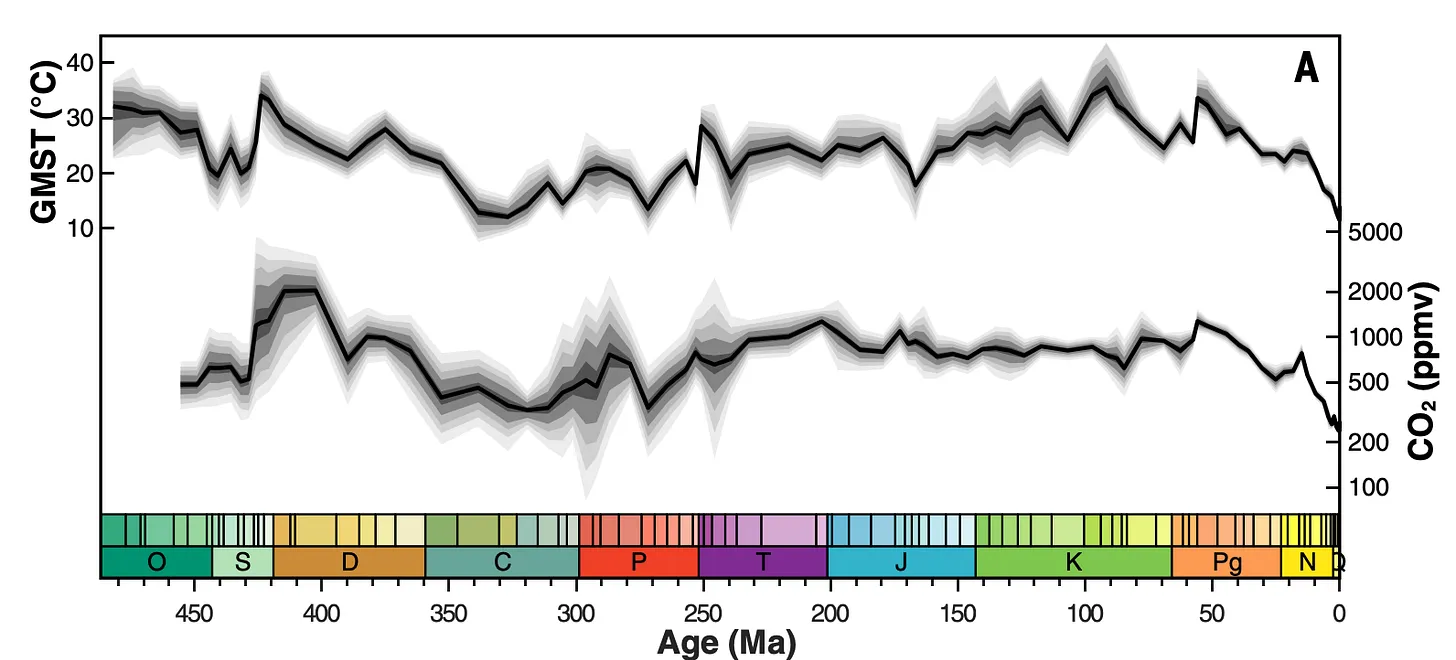
Rae et al (2021) Fig 6

So what value ESS? Presumably somewhere +5ºC to +9ºC.
But does it matter?
(2) Both ECS and ESS warming assumes the CO2 levels (or equivalent) are maintained until the respective equilibrium is reached. Give the draw-down of CO2 over the millennium will amount to roughly half the CO2 level increase of today, that maintenance of CO2 levels over the millennium would require a lot of CO2 coming from somewhere. The carbon feedbacks aren't that big. (See this CarbonBrief article which suggests natural feedbacks could amount to perhaps 15% or so.) If CO2 levels will not be maintained over centuries post-net-zero, that suggests that even ECS lacks relevance, although beyond the millennium and into ESS-territory there is no significant CO2 draw-down.
Of course, with AGW rapidly approaching +1.5ºC and the emissions still up where they shouldn't be, I don't think any reassurance given about AGW not reaching ESS levels or ECS levels (ECS levels which still may be higher than the 'usual range' due to the "fat tail"): any such perceived reassurance should not be allowed to lessen the efforts to rapidly cut emissions and reduce the bad effects of AGW we are creating for the future. (And note that the less-dreadful IPCC scenarios also include net-negative anthropogenic emissions post-net-zero to add to the natural draw-down.) - Fact brief - Does clearing trees for solar panels release more CO2 than the solar panels would prevent?
Bob Loblaw at 06:53 AM on 15 January, 2026For readers that are not as dug in to a position as David-acct, there are several posts here at SkS that cover changing levels of CO2 and O2. It's a well-covered aspect of climate science. In general, one of the pieces of evidence in support of the argument that burning fossil carbon is the primary source of increasing atmospheric CO2 is the correlated decrease in atmospheric O2.
Here are posts that discuss this:
What-is-causing-the-increase-in-atmospheric-CO2
How-we-know-human-CO2-emissions-have-disrupted-carbon-cycle
10-Indicators-of-a-Human-Fingerprint-on-Climate-Change
Several of those posts contain graphs of observed atmospheric O2 levels. Here is one, from the second link:
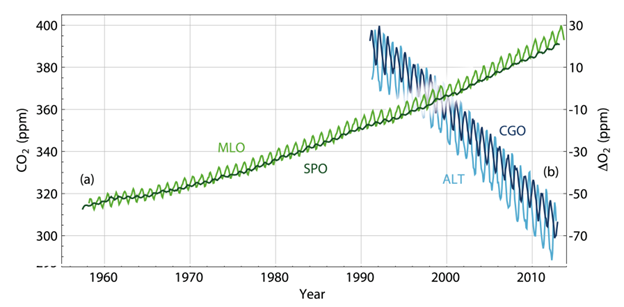
Note that a drop of 70ppm in O2 levels is not particularly worrisome from a human health standpoint. We're at 21%, and OHS warnings don't kick in until O2 drops to about 18%.
...but if David-acct is really worried that we're going to run out of oxygen because science is hiding something, he might want to get on to a path that helps stop burning fossil fuels.
- Climate skeptics have new favorite graph; it shows the opposite of what they claim
MA Rodger at 05:03 AM on 29 November, 2025RegalNose@26,
In the context of Judd et al (2024)'s graph below (Fig4a in the OP above),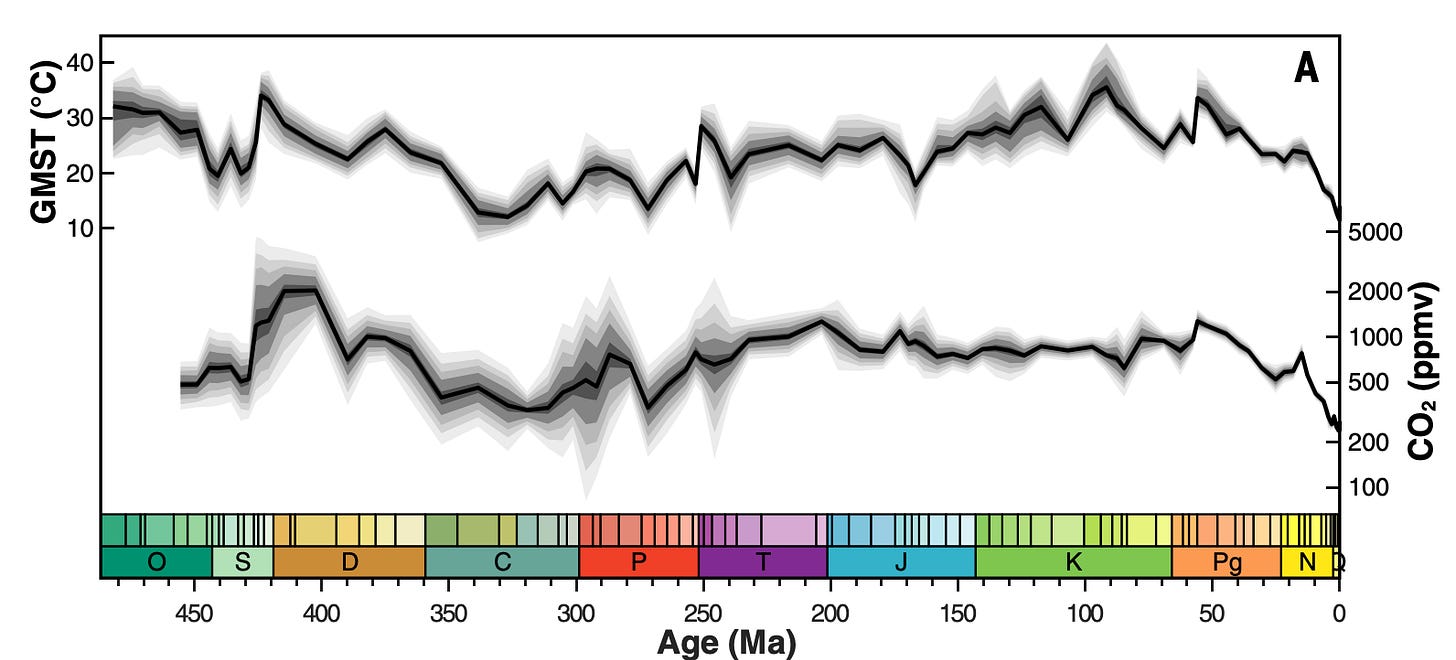
you ask - Isn't the NASA graph (below)
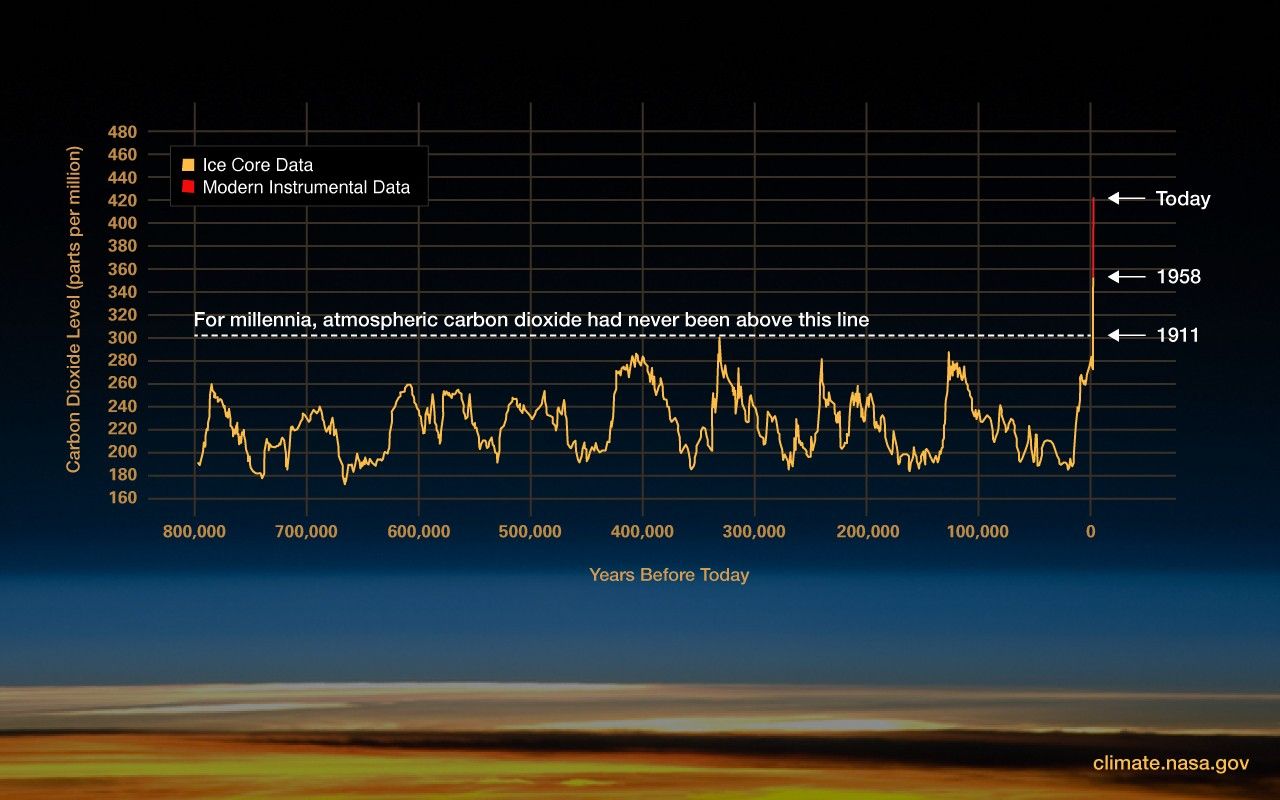
just pure scaremongring?
You ask "What am I missing? Why the panic and crisis mode?"
The OP above does not really answer your question of why CO2 should put us humans into a panic mode.
❶ The OP is firstly addressing the misuse of the Judd et al findings, being converted into total nonsense. It is, of course, difficult to nail down 'total nonsense'. ❷ Secondly, the OP chats about the threat of our CO2 to natural life on Earth rathert than the treat to humanity. ❸ That is not to say we humans should not be panicking.
❶ That first point, the OP presents an exemplar piece of 'total nonsense' which says "There's always this rise and fall." The context here implies it is the global temperatures they are saying "always ... rise and fall."
They continue:-
"This idea that the whole thing is based on carbon emissions from human beings is total bullshit. It's not true. Right. We might be having an effect, but we're having a small effect, a very small effect.”
This quote is 'total nonsense' as the findings of Judd et al, the evidence they are presumably presenting, says the exact opposite. Judd et al say it is CO2 on which the "whole thing is based". From their abstract:-
"There is a strong correlation between atmospheric carbon dioxide (CO2) concentrations and GMST, identifying CO2 as the dominant control on variations in Phanerozoic global climate and suggesting an apparent Earth system sensitivity of ~8°C." [My bold]
And the present-day big actor driving the 'whole thing', the startling rise in CO2 NASA graph above, that is the 'human beings'. This 'whole thing' is not "very small".
Additionally, Judd et al finding "an apparent Earth system sensitivity of ~8°C" suggests the effect is far from "very small" in terms of global temperature.
❷ The threat to nature from to the CO2-rise being so rapid is a major part of the above OP. Perhaps to add a little colour, 56 million years ago the Paleocene–Eocene Thermal Maximum (PETM) was caused by CO2 rising from ~800ppm to ~2,000ppm. The climatic forcing would be the same if we today allow CO2 to rise to 690ppm (and no other GHG increases - accounting for other GHGs, the equivalent would be perhaps 520ppm).
The PETM was not a massive event in historical climate or ecology but it did have pretty big impacts. Consider horses - they shrank to the size of large dogs to cope with the heat. The PETM is often held up as the nearest example of what we are stoking with our man-made climate change. But there is one stark difference. The PETM warming took something like 25,000 years. Our warming is happening 100-times quicker. The sixth mass extinction event which humanity is already threatening with other activities will be a certainty if our warming gets anywhere close to rivalling the PETM's +6ºC.
❸ But we humans are an adaptable species. However the problems are this.
(1) We a very numerous species that relies on a lot of real-estate. Loss of big portions of that real-estate (or even just the projected loss of it) will have big big geo-political consequences. If we could all pull together and address the problems, that may not be so disastrous. But we won't. And I'd imagine climate-change-mitigation measures will not be such a high priority when the world economy collapses and wars of national survival break out.
(2) The climatology cannot tell us how long we can keep melting Greenland to prevent 20ft of sea level rise becoming inevitable, or when the AMOC will disappear plumging Europe into the deep freeze, or when the cloud feedbacks over the Pacific will add another +3ºC to the warming, etc. The +2ºC limit to the warming was dropped in favour of +1.5ºC because tipping-points such as these could potentially be triggered below +2ºC.
I hope that goes some way to explaining "the panic and crisis mode."
- Climate skeptics have new favorite graph; it shows the opposite of what they claim
Philippe Chantreau at 04:06 AM on 28 November, 2025The planet was lush and green very shortly after the end of the last ice age, when CO2 was less than 300ppm. In every region where the avilability of water made their existence possible, forests grew. They covered an immense area of the globe before humans started cutting them down and slashing/burning. Megafauna existed also and was in fact richer than now, even during the ice age: Mammoths, whooly rhinos, dire wolves, cave lions, megacerops, smilodon, cave bears, etc, etc.
Humans are an enormously powerful factor constraining the existence, abundance and diversity of life. Humans precipitated the disappearance of the megafauna of the late quaternary. Currently, life is subjected to all the "normal" natural stressors and all the human made ones as well. Without humans, it is very likely that after a few tens of thousands of years, life would be green and lush, rife with megafauna, under the future climatic conditions afforded by 500ppm of CO2. There is absolutely no chance of that happening with 8 to 10 billions of humans inhabiting the planet. None whatsoever.
- Climate skeptics have new favorite graph; it shows the opposite of what they claim
RegalNose at 22:46 PM on 27 November, 2025Hi all,
I am absolute green when it comes to topic of Climate research (which is obviously not my field) and trying to make sense of some information presented to general public. I am writing here as I'd like your help with navigating this as it seems to me a bit contradictive with presented "news of the day".
If you navigate to the https://science.nasa.gov/climate-change/, there are two data points that are interesting to me:
1. current CO2 ppm = 430
2. increase of GMST of 1.5 degree C since pre-industry era.
What puzzles me, why is this so important to call for crisis mode?
When I look at the Judd's graph no. 2 I am reading that the planet was operating during The Mesozoic Era, which we know was lush, green and supported living of megafauna, on levels of CO2 between 500-2000ppm and with temperature s significantly higher comparing to current time. I am reading the graph as a path from local minimum and not as a path to glabal maximum, when it comes to GMST. I do understand the problem of how rapid is the incremental temperature increase, but don't see the issue of the increase itself.
In the context of Judd's graph, isn't the graphe used at https://science.nasa.gov/climate-change/evidence/ just pure scaremongring?
If you take 800,000 years, the CO2 ppm looks like massive spike, in the graph. But when you take the context of millions of years as Judd does, this increase is well.. insignificant.
What am I missing? Why the panic and crisis mode?
Thanks!
- At a glance - Is the CO2 effect saturated?
sychodefender at 11:50 AM on 31 January, 2025Hi MA Rodger, thanks for your reply.
Please can you just clarify one thing from your paragraph below, are you saying that the temperature rise attributable to anthropological co2 at 800ppm would be insufficient to trigger a significant H2O feedback, or am I misinterpreting?
"As you say, the climate forcing from mankind's CO2 emissions does cause feedbacks, these most evident in the water cycle, humidity, cloud cover, cloud height (this last the least understood). But there is no "self-sustaining loop" or even any significant CO2 emissions consequent from mankind's emissions as a feedback. There is thus no need for a natural mechanism to prevent run-away global warming"
- At a glance - Is the CO2 effect saturated?
MA Rodger at 02:42 AM on 29 January, 2025sychodefender @30,
Another take on answering you questioning....
As you say, the climate forcing from mankind's CO2 emissions does cause feedbacks, these most evident in the water cycle, humidity, cloud cover, cloud height (this last the least understood). But there is no "self-sustaining loop" or even any significant CO2 emissions consequent from mankind's emissions as a feedback. There is thus no need for a natural mechanism to prevent run-away global warming.
You mention CO2 in this "natural mechanism" and CO2 has operated naturally as the major control knob for the climate through the eons. (Calling CO2 the 'control knob' should not be in any way controiversial.) The ancient Earth's climate is a bit of a mystery as the sun was less energetic in the early solar system (and from its weak beginning will continue to strengthen) and with no means of knowing the ancient atmospheric composition the 'faint sun paradox' remains unexplained. More recently, over the last 500 million years the temperature record is reasonably well known. (Through that time the sun has brightened by about 5% which is a climate forcing equivalent to roughly a quadrupling of CO2.)
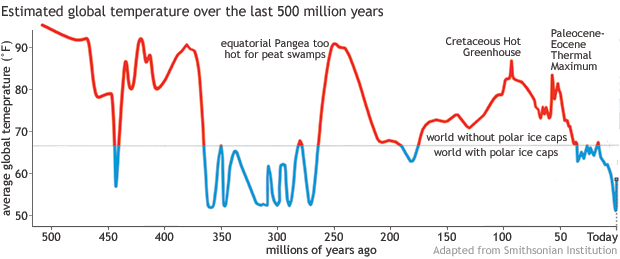
There are a few very-long-term mechanisms at work altering the carbon available for the carbon cycle (in the atmosphere, bliosphere and ocean waters, these being in equilibrium for multi-millenial periods).
Taking CO2 from the atmosphere into rocks as coal was a major process in warm climates for early parts of this 500My period as back then fungi were not well developed enough to decompose plants which could thus be buried and turned to coal. Modern fungi prevents such significant coal formation.
A second mechanism is the water-weathering of mountain rocks which allows the formation of carboniferous rock in sea water. When the 700Gt(C) humanity has emitted so far has reachen equilibrium between biosphere, ocean and atmosphere (which takes abut a millenium), the remaining 25% of our emissions in the atmosphere (assuming only natural processes) will require rock-weathering to be extracted, this taking tens of millenia to complete. At a similar rate of action, the formation of the Himalayas and associated increase in rock-weathering has seen the atmospheric CO2 content drop over the last 50 million years and with it the cooling of the planet.
Once this deposit of carbon into the geology occurs, it is volcanism that works to return it to the carbon cycle. Thus when the planet is so cold that there is no rain to weather rocks and no significant biosphere at work, the volcanic activity will slowly pump CO2 back into the atmosphere restoring the level of greenhouse effect. The emissions are very small relative to mankind's emissions (perhaps about 1%).
You mention Milankovitch cycles which have been waggling the planet's temperature for the past 3 million years (initially as a 40ky cycle, then 100ky).
The Milankovitch cycles are not so strong in themselves but are amplified by positive feedbacks. Within these cycles, CO2 is part of that positive feedback (increasing the size of the wobbles) with carbon being locked away under frozen land and in cooling oceans under increased sea ice. However the big driver of recent ice ages is albedo not CO2.
You mention the logarithmic relationship between CO2 levels and climate forcing. This is an empirical relationship for concentrations in the range 150ppm to 1300ppm. As Zhong & Haig (2013) fig 6 shows, beyond 1300ppm the forcings increase faster than logarithmic. By then, of course, an increase in the CO2 consentrations would need to be four-times an increase to add the same extra forcing. But we don't want to be creating a world with 1300ppm. It would have already been under a forcing of 8.4Wm^-2 from the extra CO2, perhaps global warming of +7ºC.
- At a glance - Is the CO2 effect saturated?
Bob Loblaw at 06:54 AM on 18 January, 2025Now for the question posed in #22, about the logarithmic effect of CO2.
There is more than one place in the CO2/climate system where we see logarithmic relationships.
The first place is in the fundamental aspect of the absorption of IR radiation by CO2 (or other greenhouse gases, such as methane). This is described mathematically by Beer's Law, which you can read about on Wikipedia, or by reading this post I made here at SkS about three years ago.
- In non-mathematical terms, the absorption of radiation by a given thickness of air occurs as a proportion of the radiation. If that thickness of air absorbs 10% of the radiation, it will absorb 100W/m2 out of 1000W/m2, but only 10W/m2 out of 100W/m2.
- So, if you start out with 1000W/m2, and absorb 100W/m2, you're left with 900 W/m2.
- But when that 900W/m2 passes through the next identical layer, only 90W/m2 is absorbed, and 810W/m2 is passed on.
- ...and in the next layer, 81W/m2 is absorbed, and 729 W/m2 is passed on.
- ...and so on.
- And this sequence is a logarithmic relationship.
- Although you never get to 0W/m2, after enough layers you do get to the point where it is essentially 0 for all practical purposes. At this point, you can say "with all those layers, absorption has reached a saturation point".
Those "skeptical" of the CO2 effect on climate focus on this "many layers already absorb all the IR" case and then argue "adding more CO2 will not absorb any more". They are wrong.
The catch is that this "saturation" idea only applies when you look at IR radiation that started in the beginning and passed through all those layers. There are two issues with this:
- Even if all the radiation is absorbed by many layers, adding CO2 will change how much was absorbed in layer 1, or layer 2, etc. Thus we are still changing where in the atmosphere the radiation is absorbed.
- This will alter the energy flows in the diagram I posted in the previous comment.
- This diagram shows how changing the absorption rate changes the amount absorbed in the earlier layers. (The diagram comes from this post, which I mentioned earlier.)
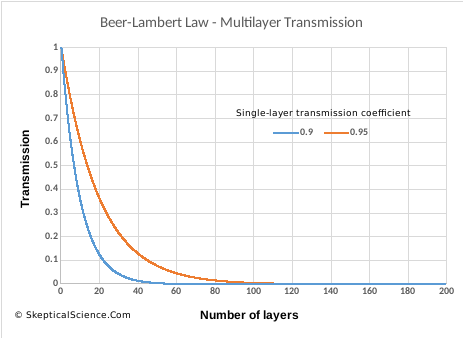
- The second issue related to what other commenters have said, that "skeptics" seem to ignore: that the atmosphere itself is emitting more IR radiation.
- Even though less and less of the original radiation entering layer 1 (closest to the surface, if we are thinking of our earth-atmosphere system) reaches the upper layers, constant emission of IR radiation locally (i.e., at that height) is replacing at least some of the IR radiation that was absorbed.
- The local emission depends on local temperature (the kinetic energy source)
- The local emission will be half upwards, and half-downwards, which means that it is now harder for that energy to reach a point where it can be lost to space (greenhouse effect discussion in previous comment).
There is another important place where a logarithmic relationship is seen. In Beer's Law, we talked about a layer containing something that absorbs IR radiation. What happens to the absorption ratio if we double the amount of CO2?
- We might think it doubles the amount of absorption, but this is only the case for low concentrations.
- At higher concentrations, the amount of absorption will not quite double
- ...and at yet higher concentrations, the absorption will not quite not quite double, etc.
- ...so we see a "law of diminishing returns".
- Eventually, at very high concentrations, there will be very little additional absorption. Again, we can call this "saturation".
- ...but current atmospheric CO2 concentrations are a loooong way from reaching this "saturation" point. We're a little over 400ppm now, and we'd need to get to concentrations several times higher before "saturation" is reached.
- From our starting point at 300ppm, we'll see 2-5C rise when we double to 600ppm, and then another 2-5C rise if we double again to 1200ppm, so we can see the logarithmic relationship.
- ...but a climate with 1200ppm of CO2 will not be a pleasant place compared to what we have now. The logarithmic decreasing effect will not save us from a very different world.
Whenever you see a "saturation" or "logarithmic" argument, you need to try to understand which version someone is claiming. The key error in all of them is that they are isolating one small part of a complex system and ignoring other parts that are affected by increasing CO2. Only by including the complex relationships among all the parts of the system can you determine the warming effects of CO2.
- At a glance - Is the CO2 effect saturated?
sychodefender at 09:59 AM on 17 January, 2025The Kubicki paper seems much the same as those from Happer, Van Wijngaarden, Lindzen, Schildknect and others who all centre their conclusions around the ability of co2 above 300ppm to absorb infrared radiation only at a diminishing logarithmic rate, not comlete but near saturation. I assume the IPCC models include this information as it was mentioned on their website about 20 years ago so they are aware.
I'm guessing that there has been some more recent finding or mechanism by which co2 is declared culpable of creating warming, could someone bring me up to speed please?
- CO2 effect is saturated
MA Rodger at 20:16 PM on 5 January, 2025Schroeder/CallItAsItIs @874
You are fooling no-one here. How can the Beer and Schwartzschild solutions be the same? Beer concerns only absorption and Schwartzschild considers both absorption and emission. If they were the same, it could only be through emission being zero, but that is not the case.
dIλ/ds = -μIλ ≠ dIλ/ds = nσλ[Bλ(t)-Iλ]
excepting Bλ(t) = 0
And it is because of this emission from CO2 that we see 15-micron IR upward (and downward) throughout the atmosphere. It is not "attenuated to near zero at an altitude of 10 meters." And your attempt to explain the existence of 15-micron IR emissiions from CO2 are nothing but garbled nonsense. Consider the MODRTAN model (which you appear to accept but perhaps don't understand), the IR emissions for a doubling of CO2 from the default values (400ppm to 800ppm) are calculated as falling from 298.52Wm^-2 to 295.191Wm^-2, a global forcing of +3.3Wm^-2. So MODTRAN is showing that the CO2 effect is not saturated.
- Models are unreliable
Bob Loblaw at 06:48 AM on 13 November, 2024A further follow-up to Syme_Minitrue's post @ 1332, where (s)he finishes with the statement:
A climate model probably contains hundreds of model parameters. Can you adjust them so that you get a good fit with historical data, and good predictive capability at a significantly lower, or even completely excluded CO2-dependency?
Let's say we wanted to run a climate model over the historical period (the last century) in a manner that "excluded CO2-dependency". How on earth (pun intended) would we do that, with a physically-based climate model?
- We could decide to remove the part of the model that says CO2 absorbs (and emits) IR radiation.
- Unfortunately, that would make our model run far too cold for the entire period, since the 19th century CO2 level of 280-300ppm is a significant source of heating that helps keep us in a stable climate of roughly 15C (as opposed to -18C that we'd expect with no atmosphere)
- This would defy the physics of IR absorption by CO2 that is easily demonstrated in a laboratory.
- We could arbitrarily decide that CO2 remain at 300ppm.
- This would be a useful experiment, and is probably what was done for the graph I included in comment 1334...
- ...but this defies the actual physical measurements of rising CO2, so it can hardly be argued that this model experiment can explain actual temperature observations.
- We could run the model so that the first 300ppm of CO2 absorbs IR radiation, but the CO2 content above 300ppm does not.
- This makes no physical sense, since all CO2 molecules act the same. We can't use "special pleading" for some.
- And once we remove the effects of rising CO2, how would we change other model calculations to compensate for the lack of CO2 warming? i.e., what would "fit" the model to the observed increase in temperatures?
- We could arbitrarily increase solar input...
- ...but this defies our physical measurements of solar irradiance.
- We could arbitrarily change cloud cover
- but we have no physical measurements that would support this.
- We could arbitrarily change surface albedo, vegetation, etc...
- but we run into the same problem: we have physical measurements of the properties of these factors, and it's hard to justify using values that are different from the known measured values.
In comment 1334, I linked to a review I did of a paper that claimed to be able to fit recent temperature trends with a model that showed a small CO2 effect. I said it was badly flawed.
- The paper in question did pretty much what Syme_Minitrue expressed concern about: doing a statistical fit to a large number of parameters, many of which defied any plausible physical meaning.
- As long as your parameters can perform all sorts of non-physical gymnastics in an effort to fit the data, you can easily come up with some rather odd results.
- When your model parameters are limited to physically-measurable values, "fitting" gets a lot harder.
Physically-based models in climate science generally get "fit" by trying to get the physics right.
- On Hens, Eggs, Temperature and CO2
MA Rodger at 19:27 PM on 4 September, 2024rkcannon @16.
Assuming Mark Johnson @18 is correct and you do refer to the graphic posted @6 (which seems entirely sensible), your question has still not been properly addressed.
And that presumably is to ask why the CO2 fluctuations through recent ice ages (180ppm to 280ppm) are associated with large temperature fluctuations (10ºC peak-to-peak) but the larger recent anthropogenic CO2 (280ppm to 420ppm) doesn't result in any commensurate temperature increase in the graph.
There are a number of factors to consider.
(1) The forcing from changes in CO2 is logarithmic, so the recent CO2 forcing would be slightly smaller than the ice age forcing (2.2Wm^-2 as opposed to 2.4Wm^-2).
(2) It takes time for the temperature to react to an imposed forcing so only about two-thirds of any CO2-forced increase would have occurred in the decades of man-made warming so far.
(3) The ice age CO2 forcing was not the major forcing through ice ages. The change in albedo due to the shrinking ice sheets and the rising oceans would be double the CO2 forcing. Other factors like methane and dust were also in play. (The orbital forcing that triggers ice ages is very minor.) Increasing CO2 contributed perhaps a third of the ice age forcings.
(4) The temperatures being plotted are from the EPIC ice core data and thus Antarctic temperatures which wobbled tiwce as much as global temperatures through the ice ages. (Note the modern CO2 value has been added, marked with an asterisk. Grafting on the modern EPIC temperature record would be difficult, and would not show much as the instrument record is more wobble than rise.)
So taking (1) to (4) into account, the 10ºC ice age cycle in the graphic @6 would be a little smaller, say 90% (1) then a third off (2) then two-thirds off (3) and finally halved (4). So the global temperature should be very roughly something like [10ºC x 0.9 x 0.67 x 0.33 x 0.5 =] +1ºC which is pretty-much what we see globally today. - On Hens, Eggs, Temperature and CO2
MA Rodger at 22:43 PM on 8 August, 2024Keith R @14,
You are correct that the Koutsoyiannis paper does not assess the on-going +2ppm/yr of CO2 resulting from fossil fuel use (less the ocean and biosphere draw-down).
But your comment has goaded me into a back-of-fag-packet assessment of how much out-gasing the wobbles in the global temperature record would actually achieve. (I'd reckon beforehand it would be exceedingly tiny.)
If the last ice age saw CO2 rise by about 100ppm and global temperature rise about +4ºC, that would suggest a big El Niño-induced temperature rise of +0.4ºC would see CO2 rise 10ppm but only if equilibrium was achieved (which would take about a millenium).
An El Niño temperature wobble is up-&-down in a single year so there is of course no equilibrium. The out-gasing would be greater earlier and quickly tail off: say 50% happening in the first century, so 5% in the first decade and 0.5% in the first year? That would suggest an out-gasing CO2-rise resulting from a +0.4ºC temperature rise in temperature following a big El Niño of just 0.05ppm.
The actual CO2 wobbles the Koutsoyiannis paper relies on being temperature-induced out-gasing (and not drought-induced reductions in forest growth) are about 1ppm. So "exceedingly tiny" is a good description. - There's no correlation between CO2 and temperature
MA Rodger at 20:58 PM on 14 May, 2024Martin Watson @ 184,
As you say, the graphic appears in a Science article CenCO2PIP Consortium (2023) 'Toward a Cenozoic history of atmospheric CO2', although more correctly it was in the 'commentary' of the paper and it also then sported a scale for the GMST (which in my eyes isn't so helpful).
The paper itself does provide a more conventional graphic (Fig2) which does show 20-odd Mya CO2 levels of perhaps 300ppm and GMST of some +3ºC above pre-indusrial.
While CO2 is the major control knob of Earth's GMST, other factors can make a big difference. The closure of the Panama Isthmus certainly is one of these 'other factors'. The timing is not so well defined (with some even suggesting a date as ancient as 23Mya, this a seriously controversial suggestion), and the changes at work in the climate system which resulted are far from straightforward. The conventional version is that the inital result of the closure was a warmer Earth but that kicked-off the Norhern glaciations which tipped the Earth into a colder phase leading to the recent ice-age cycles (as per for instance Bartoli et al (2005) 'Final closure of Panama and the onset of northern hemisphere glaciation'.)
- CO2 is just a trace gas
scaddenp at 10:26 AM on 4 May, 2024JJones - despite the examples in main article of very small amounts capable of having large effect, you seem to be clinging to idea that the concentration cant be important. Can we unpack this please? I want to see how you understand this?
From the basics, the sun warms the earth and heat is radiated out to space through the atmosphere as photons with wavelengths in the infrared part of the spectra.
Now as I understand it, you believe because the concentration is low, then there are not enough CO2 molecules to catch all the photons leaving the surface? Is that a reasonable summary of your position?
One way to check that sort of question is consider how far, on average, a photon at say 15microns wavelength might travel before hitting a CO2 molecule if the concentration of CO2 is 400ppm. If you want to think about it a very crude approximate way, then think of cylinder 15microns wide going to top of atmosphere. Now then what is chance of it encountering a CO2 molecule? Doing it properly is quite complicated because density of molecules varies with pressure as you go up the atmosphere, but can start with simple sealevel values and the gas equation.
If you start the calculation, eg how many CO2 molecules in a meter of that tube, then you immediately realise that while 400 molecules in a millions seems rather small, Avagadro's number is extremely large. There are a lot of CO2 molecules in the way.
In short, the photon will likely get only a metre or so before being captured. 400pm can easily trap all the photons in appropriate wavelength leaving the surface. To really understand the greenhouse effect though you have to know what happens next.
PS - you wouldnt walk into a room with 400ppm of cyanide gas would you? - Climate - the Movie: a hot mess of (c)old myths!
scaddenp at 06:38 AM on 3 April, 2024Two dog. The OHC content data in red comes from the Argo array. You can find reasonable description here. The old pentadecadal data is ship-based and has much bigger error bars. I cant immediately find the paper that determined the accuracy of the Argo data but if interested I am sure I dig it out.
On interannual and to some extent the decadal scales, variations in surface temperature are strongly influenced by ocean-atmosphere heat exchange, but I think you would agree that the increasing OHC rules that out as cause of global warming?
"I did also read that the warming effect of CO2 decreases as its concentration increases so the warming is expected to reduce over time. Is there any truth in that?"
Sort of - there is a square law. If radiation increase from 200-400 is say 4W/m2, then you have to increase from CO2 from 400 to 800ppm to get 8W/m2. However, that doesnt translate directly into "warming" because of feedbacks. Water vapour is powerful greenhouse gas and its concentration in the atmosphere is directly related to temperature. Also as temperature rises, albedo from ice decreases so less radiation is reflected back. Worse, over century level scales, all that ocean heat reduces the ability of the ocean to absorb CO2. From memory, half of emissions are currently being absorbed there. Hot enough and the oceans de-gas. These are the calculation which have to go into those climate models.
Which brings us to natural sources. Geothermal heat and waste heat are insignificant so would you agree that the only natural source of that extra heat would be the sun? Now impact of sun on temperature has multiple components that climate models take into account. These are:
1/ variations in energy emitted from the sun.
2/ screening by aerosols (natural or manmade). Important in 20th century variations you see.
3/ changes in albedo (especially ice and high cloud)
4/ The concentration of greenhouse gases in the atmosphere.
Now climate scientist would say that changes to all of those can account for all past natural climate change using known physics. They would also say very high confidence that 1/ to 3/ are not a significant part of current climate change (you can see the exact amount for each calculated in the IPCC report). Why are they confident? If you were climate scientist investigating those factors, what would you want to measure to investigate there effects? Seriously, think about that and how you might do such investigations.
Is it possible there is something we dont understand at play? Of course, but there is no evidence for other factors. You can explain past and present climate change with known figures so trying to invoke the unknown seems to be clutching at straws.
- Just how ‘Sapiens’ in the world of high CO2 concentrations?
Eclectic at 23:15 PM on 30 March, 2024On reflection, I believe my @47 comments (on Dr Bierwirth's paper) were lacking the bluntness that our readers deserve.
His 2024 Abstract shows a notable Red Flag, in his mention of the phrase "existential threat" ~ a phrase which is not only rather panicky, but is fashionably overused nowadays for subjects ranging from imminent nuclear holocaust . . . through to a possible world shortage of cocoa.
A second Red Flag is his lengthy laundry list of "potential" threats of a wide range of nasty diseases ~ cancer; calcification in the kidneys; diabetes; etcetera.
A third Red Flag is his attribution of all these diseases to a combination of elevated CO2 in association with low pH. Actually, such a combination is a brief/transitory situation when CO2 is high ~ for (as I and others have pointed out, earlier in this thread) the body's kidney function does correct the low pH in the medium & long term.
Which leaves us with his dubious claim about "protein malfunctions".
In short, it seems Dr Bierwirth paints with a very broad brush and also draws a very long bow. Not only that ~ but some of his other papers seem to have a similar flavor.
All well and good if Dr Bierwirth has supportive evidence ~ but for the meantime, I think we should all remain most skeptical.
# Obviously, we cannot expect controlled experiments in humans with exposure to years of elevated ambient CO2. The mouse experiment (mentioned above) was a controlled study using mice in 890ppm CO2 versus mice living in half that level. The gestation & first 3 months of life might perhaps equal 5 - 10 years of human equivalence. Still, it is only about 110 days in absolute terms ~ and that might explain the absence of adverse findings in the "high CO2" mice, despite the rapid pace of mouse physiology.
And that fits with other evidence, of mice and men . . . and dinosaurs.
- Increasing CO2 has little to no effect
Dominic68 at 00:09 AM on 3 February, 2024I have had this publication and this one cited against me in argument. Has anyone come across them? Essentially they are being used to argue that C02 > 400ppm concentration will not trigger further heating.
- Just how ‘Sapiens’ in the world of high CO2 concentrations?
Eclectic at 22:40 PM on 12 November, 2023A modest suggestion [ not Modest Proposal ] :-
In the absence of any information to the contrary during the past 8 days in this thread, I would like to suggest that this O.P. from 2014 be marked with a prominent note of Warning or Caution for readers.
The O.P. starts well, by evidencing mild impairment of human intellectual function at an ambient (air) level of 1000 ppm of CO2. Fortunately, a reversible impairment.
But in the final 4 paragraphs, the O.P. implies that we humans should be alarmed, medically, at the prospect of a terrestrial atmospheric CO2 level of even 426ppm - 900ppm. (The O.P. also links to the [bookish] D.Zappullo~2013 , wherein is discussed major health problems from air CO2 of 5,000ppm - 30,000ppm.)
However, in actuality, an ambient CO2 426ppm-900ppm level would be swiftly compensated inside the body (within hours to days) through the activity of the kidneys which possess routine mechanisms to normalize total body acidity. The adverse planetary effects of high CO2 are an entirely separate matter.
SkS staff may wish to consider adding an up-front note, such as :-
CAUTION : parts of this 2014 post are very misleading.
.
- Just how ‘Sapiens’ in the world of high CO2 concentrations?
res01 at 11:38 AM on 3 November, 2023Not to detract from the general argument, but as noted by other posts, Figure 1from D. Robertson is a little off. What D. Robertson overlooks in his calculations is that arterial CO2 partial pressure in the human bloodstream, as it is in most mammals, is a significantly higher than what it is in ambient atmosphere. That means a percentage rise in CO2 in the atmosphere makes for a much smaller percentage rise of CO2 concentration in the bloodstream. In short at low CO2 levels the effect is a whole lot less. Not until CO2 levels reach about 1000ppm in the does the change become notable in the bloodstream. That means the effects of CO2 will not be notable in the human body until around 1000ppm (ok, maybe around 600ppm for a few canaries among us.) Nevertheless, direct impact of CO2 on the human body should still be a big concern because 1000ppm CO2 in the atmosphere will be what we see by the end of this century if the world keeps on the course that it is presently on. Now consider fish whose arterial CO2 pressures are generally an order of magnitude less than that of mammals. They will see the effects much earlier, and most likely by the end of the century will die off significantly. Also, while plants do thrive on a little extra CO2, with atmospheric CO2 concentrations over 1000ppm they tend to die off. So, what we may see is that fish and plants will die back first leaving humans without sufficient means for sustainment. For a more concise treatment of the subject please refer to, “ Carbon Dioxide’s Direct Impact on Down-Regulating the Human Species”, by R.E. Stumm, published in Science of the Total Environment, 19 September 2023.* *https://pubmed.ncbi.nlm.nih.gov/37734619/
Also check out the video short “The Die Back” on Rumble** **https://rumble.com/v23ofba-the-die-back-2.1.html
- New report has terrific news for the climate
MA Rodger at 18:28 PM on 20 October, 2023Fred Torssander @3,
That's not so easy to fathom.
You presumably** ask about atmospheric CO2 levels.
They should theoretically begin to stop increasing at an accelerating rate when we stop pumping CO2 into the air at increasing rates. So far, our emissions are leveling off but not yet levelled off.
And if we could actually begin to drop the rate of emissions (and we need to do this quickly), the rate of increase in atmospheric CO2 levels would begin to slow and helpfully they would level off roughly when we have halved emissions***.
So a long way to go, theoretically.
As for when we should see the good news, the increase in annual CO2 levels is impacted by El Niño (which changes many rainfall patterns across the globe and wobbles annual CO2 increases by some +/-0.5ppm). These resulting wobbles seen in the CO2 increase make it difficult to be precise as to the actual state-of-play. So we can see that the decadal increases**** since 1960 have been accelerating strongly (+0.9ppm/y, +1.2ppm/y, +1.6ppm/y, +1.5ppm/y, +1.9ppm/y, +2.4ppm/y) but being more precise is difficult. While the beginning of the present decade 2020-22 does show the lowest 3-year average increase (+2.2ppm/y) since 2012-14 and Covid would have not made a big change to that, the strong La Niña impacting 2020-22 will have made a big difference.
(** The word "fraction" is not so useful here as its usual use is in the 'Airborne Fraction' which is the ratio of [increase-in-atmospheric-burden] to [the-emissions]. It takes 2.16Gt(C) to raise atmspheric CO2 by 1ppm. So our emissions of ~10ppm would have seen atmospheric levels rise by +4.6ppm if Af=100% & all the emissions remained in the atmosphere.)
(*** The 'Airborne Fraction' is running at about 50% but this is not all because of a single year's emissions. Only a few percent would be due to the immediate annual emissions. The 50% is the sum of the decreasing 'few percents' from years running back many decades.)
(**** The 'trend' numbers given by NOAA on their 'trend'page are a bit odd as they compare only the months at the start/end of the years, not the whole 12 months which I use in this comment. The NOAA method actually adds a bit more wobbliness to their numbers.)
- At a glance - How do human CO2 emissions compare to natural CO2 emissions?
scaddenp at 14:40 PM on 2 October, 2023A single photon of IR of right wavelength leaving earths surface doesnt travel very far at all. I think mean path length before absorption is less than 10m at 400ppm (too lazy to calculate). As the Dessler video shows, what matters is the height where IR can escape to space.
I am fond of Chris Colose explanation. - At a glance - How do human CO2 emissions compare to natural CO2 emissions?
rip71749 at 05:16 AM on 28 September, 2023Look at human-added CO2 as borrowing debt on a fossil fuel credit card. When we were young (>200 years ago), we had 280ppm CO2 in the bank and life was good. We had just received a fossil fuels credit card (which created debt in CO2) with seemingly no limit. Our family started to grow and we needed more energy so we borrowed a little fossil fuel. It seemed like we were borrowing almost nothing and thought there was almost no CO2 to worry about.
But as the years went by and the balance, grew we became shocked at how much it had grown. At first there was only about 1 billion of us and we had 280 ppm CO2 in the bank. We needed a little extra and started borrowing, just a little, less than 1ppm per year. But as our family grew (population), we borrowed more and more fossil fuels because suddenly we needed the extra energy to support our growing family (population) using our fossil fuels credit card (fossil fuels from 300 million years ago, and our 100 million CO2 account credit limit of stored solar energy).
By the time we reached 1960 our family (population) had grown to about 3 billion and our fossil fuel credit borrowing had increased to about (315-280= 35ppm) of CO2 debt, still not too bad. But then things started going crazy and our family was increasing by another billion every 12-13 years. All of a sudden in 2023 our family was 8 billion and we had borrowed so much fossil fuel our CO2 debt reached (421-280=141 ppm). We owed more than half of our entire starting bank account of 280ppm, and were borrowing more than ever at 3ppm with no end in sight. Instead of retiring in comfort in our old age, we are going to have to work until our dying day.
It all seemed like such a small amount of borrowing at the start, but now, we are in big trouble! We will never be able to pay off that CO2 credit card debt?
- Climate Confusion
Eclectic at 23:21 PM on 1 September, 2023Markp @23 , to respond is simple. Name the person you are addressing, and preferably add in the # post number, for greater precision. Occasionally that # goes "wrong" if the Moderator has altered some post numbers ~ but usually posts go onto the thread in the chronological order they were received.
Again, I am not sure why you are bothered by "models and scenarios". As you say, the social/political/technological response to CO2-derived global warming is rather tardier than ideal, in slowing and eventually halting the current rapid warming. Yes, decades.
Simply apply common sense, and remember the first step needed is the reducing of human-caused CO2 emissions. Eventually, the CO2 level stops rising (and if you are curious, you can observe how much more warming occurs after that . . . so no actual need for "models"). Then you can observe the speed of subsequent CO2 level fall . . . and take further high-tech action if that seems warranted, in order to accelerate the CO2 decline. If not going the high-tech route immediately to begin with!
Probably best to ensure the CO2 does not drop below about 350ppm (since eventually the natural Milankovitch-cycle cooling will start to show). That "natural cooling" has been estimated to become problematic in roughly 15,000 years . . . so not an urgent problem! Plus humans will then have the option of warming the planet by burning small amounts of coal (assuming we have been wise enough to keep a goodly amount of coal available for such future need . . . although by that stage presumably we will have the option of heating limestone per fusion-powered electricity).
Markp, your idea of mirrors (ground-based, not space-based) seems reasonable in theory . . . but what about the practicalities? Please go ahead and "show your workings" for areas needed / desirable locations / dollar cost per sq. meter / CO2-cost of building & installing mirrors / and so on.
Remember the old axiom : Politics is the art of the possible.
Stop worrying yourself about models ~ leave the models to the scientists. Your personal responsibility (to yourself and others) means taking practical action with what you can do now .
- How big is the “carbon fertilization effect”?
Rob Honeycutt at 11:23 AM on 13 July, 2023Dave... The fundamental fact that you disputed is that oceans take up about half of our emissions. It's a fact that has been clearly stated in the citations both of us have presented.
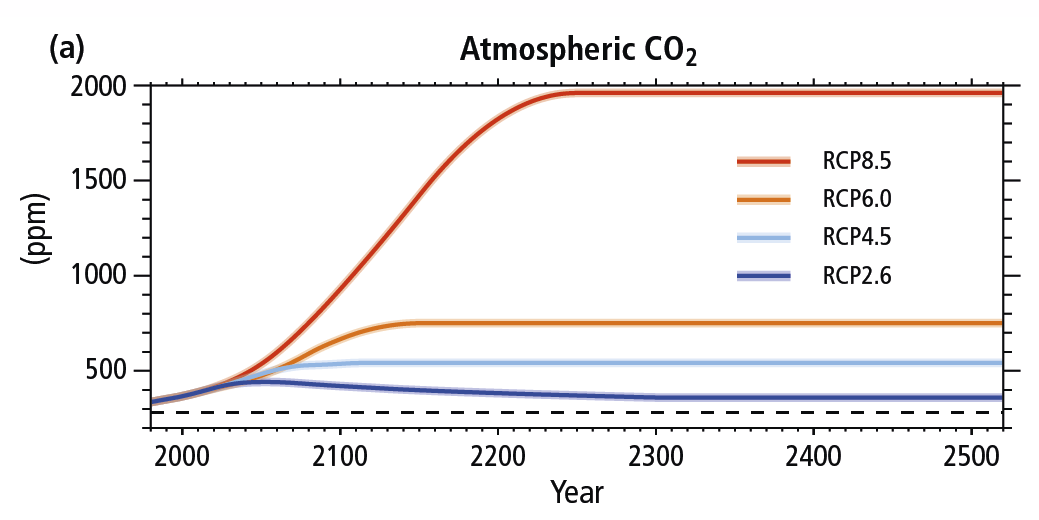
You also claimed CO2 concentrations would quickly come down (normalize) once we stop emitting it. This is also not correct unless you're using "normalize" to mean "stabilize at a new higher level". But they're not going to stabilize back to 300ppm.
- Increasing CO2 has little to no effect
MA Rodger at 04:10 AM on 6 July, 2023manuel2001nyc @444,
You are very dedicated. It is a super-human task attempting to learn from the comments in a long comments-thread such as this.
I would guess the term "saturation" you used concerns more the saturation as in laser intensity** rather than any climatological/atmospheric consideration. (**That is, an excited CO2 molecule cannot absorb IR until it has returned to its unexcited state. Such consideration doesn't really apply here.)
As other commenters have explained, 15μm IR can be absorbed by CO2 and the resulting excited CO2 molecules would almost always then be in collision with other atmospheric molecules and lose its excitation in that manner. Thus the absorbed IR energy is converted into thermal energy in the atmosphere. This process is because these collisions with molecules in the atmosphere will occur within microseconds while the relaxation period allowing the CO2 to emit IR is on average in the tenths of seconds.
But that does not mean there is little 15μm IR emitted by CO2 or that such emissions are rare. As well as taking-away the excitation from a CO2 molecule, these numerous collisions can also impart excitation into CO2 molecules. Thus the vast majority of the excited CO2 is because of these impacts. And if the Earth's surface is at the same temperature as the local atmosphere, the CO2 will be shooting off the same amount of 15μm IR back down at the surface as the surface is shooting upwards. (Note the surface only shoots upwards while the CO2 will shoot both up and down)
So, to answer yor first question.
It is a rough rule in physics that the absorption and emission of photons balance, usually. If they don't there will be a net flow of energy, with more/less emissions cooling/heating the substance and thus reducing/increasing emissions. Thus the absorption-emission balance would be achieved.
The 8μm-14μm waveband is often called the Infrared Window because in a dry atmosphere the IR from Earth's surface has a clear path out into space. Clouds would block that clear path and water vapour acts as a weak absorber.
There is other IR absorbtion in the 8μm-14μm waveband. There is a strong ozone absorption band at 9.6μm. Also, if we do let CO2 concentrations rise far enough, CO2 absorption bands will appear close to 10μm, these starting to become significant for CO2 concentrations above 1,000ppm.
- 2nd law of thermodynamics contradicts greenhouse theory
Rob Honeycutt at 13:53 PM on 12 June, 2023Likeitwarm... On the 0.04% topic, looking from space to the surface, a concentration of 0.04% is essentially opaque.
You can think of it this way... a square of 1000x1000 molecules = 1 million molecules. Right? At 0.04% that means 400 will be CO2 randomly distributed. Add the next layer of 1M molecules, and 400 more randomly distributed CO2 molecules. And so on.
It doesn't take very long before there is a near 100% chance that every one of the positions in that 1000x1000 grid will end up being a CO2 molecule.
When you're talking about the full vertical profile of the atmosphere, 400ppm is a very significant concentration, significant because of the specific radiative properties of CO2.
- CO2 effect is saturated
Bob Loblaw at 04:29 AM on 25 March, 2023Gootmud @ 689:
Think about what Eclectic says @ 690, and ask yourself "what does 'saturation' mean exactly". It's very hard to define "no saturation" unless "saturation" is defined first.
..but to try to answer your question, nearly any time someone comes up with the argument "CO2 is saturated", it is usually in the context of a claim that adding more CO2 to the pre-industrial levels will have no effect. That is, any IR absorption effect that exists for CO2 below 280-300ppm has already "saturated", so raising CO2 to 400, 500, or 600ppm wil not cause any warming. As you are discovering with your reading, this simply is not true.
It is often difficult to get climate contrarians to define what they mean by "saturation". A common "argument" is that any IR radiation emitted from the surface will be absorbed by CO2 close to the surface in the wavelengths that CO2 absorbs strongly. They will then argue that since none of this IR ecapes directly to space already, adding more CO2 doesn't affect this. This argument totally ignores the fact that CO2 will also emit IR radiation - so you still see IR radiation at greater heights (that did not originate at the surface) - and that what happens between the surface and the height where absorption reaches "effectively zero" still matters and will change as CO2 is added.
This post on CO2 absorption and Beer's Law may help.
Although there are a lot of comments on this thread, you might benefit from taking a few pages and looking at them to see what arguments are made, and explanations of what is wrong with them. You will find that new people come and go, making the same wrong arguments over, and over, and over (and over, and over)...
- CO2 effect is saturated
MA Rodger at 18:41 PM on 24 March, 2023Gootmud @680,
Responding to the individual detail of your post not addressed so far:-
☻ The blanket analogy is not useful when the detailed mechanism of AGW is considered. The temperature of the air against the outer blanket will remain effectively constant when extra blankets are added. The emission-to-space altitude of the planet at the CO2 IR-emitting frequencies (and thus the temperature which dictates the level of emission-to-space) varies with the level of CO2 in the atmosphere. CO2 is well-mixed up to 50km and more.
☻ Convection is not a great player in cooling the planet. The atmospheric cells of the troposphere are responsible for the trade winds and if convection were significant, these would be premanently of super hurricane strength. It takes about two weeks for a packet of air to rise to the tropopause in these cells and potentially half the convection is seen in cyclones which are relatively rare events.
☻ Pretty-much all CO2 molecules excited by IR lose their excitation through collision. There are many many more CO2 molecules excited by collision and the level of IR-emission is thus determined by air temperature which sets the level of collision.
☻ Sympathetic emission from an excited CO2 molecule (your laser effect) occurs at all altitudes.
☻ The greenhouse effect from increased CO2 is not linear except when CO2 levels are very small. For higher levels, the relationship is rougly logarithmic. This the forcing resulting from CO2 levels increasing 200ppm to 400ppm would roughly equal that of 2,000ppm to 4,000ppm. There is actually a boost above that logarithmic relationship for high levels of CO2, beginning at ~1,500ppm, as an emissions frequency at around 10 microns begins to be significant. In this, you may find Zhong & Haig (2013) 'The Greenhouse Effect & Carbon Dioxide' a useful read.
- The Big Picture
Gootmud at 01:05 AM on 20 March, 2023Eclectic and John Mason @104
We do need models to predict whether it will keep on warming. As CO2's absorption spectrum saturates, it can't trap more heat. Negative feedback effects like clouds might nullify any warming. Temperatures might drop due to independent effects like magnetic field changes much more influential than the greenhouse effect. We might be at 600ppm, freezing, and looking for ways to warm the Earth and slow the advancing ice.
Without models that account for all these effects, we.know nothing about future temperatures. We don't know ranges of likely changes. We don't even know the sign. A model need not be perfect--no model is ever perfect--but it must be representative of all the relevant physics if we are to trust its output.
- The Big Picture
Bart Vreeken at 08:45 AM on 17 March, 2023Hi peppers,
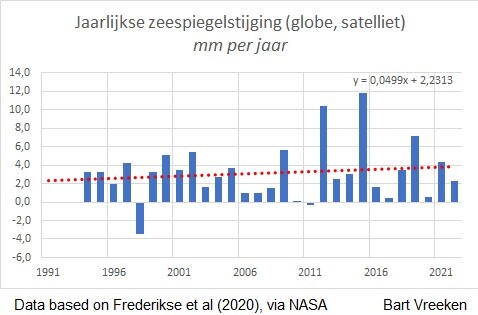
Here you see the sea level rise for every single year. As you can see, the sea level rise goes faster and faster. When we make a simple extrapolation of this the sea level in 2100 will be 53 cm higher then in 2000. But we can't predict it very well, due to the unpredictable behaviour of Antarctica and Greenland.
"at 66M years ago we were at 1000ppm and 14+ degrees C higher"
You can't simply compare 66M years ago with the present situation. 66M years ago the sun had less power. Like all stars, the power of the sun increases during the time. And 66M years ago the position of the continents was very diferent, resulting in different ocean currents and a different temperature balance of the earth.
- The Big Picture
peppers at 08:11 AM on 17 March, 2023Hi Rob,
Apologies for not including my reference points. sealevel.nasa.gov has the sea level rise 2mm a year historically and as their projections. That is what I used for the 3-5 inch final rise until our population levels out.
And at 66M years ago we were at 1000ppm and 14+ degrees C higher, and there are hundreds of sites with charts showing the same data. Some wanting to have the ppm look extreme just use an 800k year graph, which is the basis of the hockey stick chart.
But, our recent increase is extreme, matching our wild conquering of the human condition and the 800-1000 % increase in our numbers. I have no idea of our wisdom as a species around all this, except lengthening our lives and solving misery, pain and premature death was hugely addressed in a wildly successful way.
One might weigh all these factors and decide if our current state is worth it. I would not take all of that for granted however and only complain about the weather now. Should we go back or should we have skipped all that advancement?
For me, I want to consider all of this when thinking of it.
Thx Rob, D
- The Big Picture
Rob Honeycutt at 01:50 AM on 17 March, 2023Peppers @19... "Which will top out in about 3-5 more inches to correlate it with sea leveling."
And your citations to the research that supports this statement are... where?
Currently the projections suggest over 1 meter of SLR by 2100 and more to come in the centuries to follow.
Remember, the last time the earth had over 400ppm CO2 we had an ice-free planet. We are in uncharted territory stretching back a few million years.
- 2023 SkS Weekly Climate Change & Global Warming News Roundup #8
scaddenp at 10:58 AM on 27 February, 2023The milkankovich cycles are only able to force ice ages (and sea level) when GHGs levels are so low that summer insolation at high latitudes doesnt not melt snow. (The milankovich cycles operated long before the Pleistocene ice ages). The simple geoengineering to prevent an ice age is to increase GHG to such a level (around 400ppm) that they dont have an effect. Whoops! we have just done that.
We definitely agree with Wally Broecker that climate is an angry beast and that we shouldnt be poking it with a stick.
- 2023 SkS Weekly Climate Change & Global Warming News Roundup #2
Rob Honeycutt at 03:02 AM on 17 January, 2023Eddie... @1: Human extinction is highly unlikely in any scenario. Extinctions (plural) of a broad range of wild species is ongoing and likely to worsen. Those extinctions have impacts on humanity. High emissions scenarios could produce a collapse of modern society as we know it. That would entail a great deal of human suffering. But actual human extinction isn't likely.
@3: The recent research on "warming in the pipeline" is suggesting this is incorrect. Once we get carbon emissions down to "net zero" (to the point where atmospheric concentrations stabilize) warming is expected to stop. Currently, with renewables scaling exponentially, we could get to net zero by mid-century. (Haufather)
Climate related impacts are certainly going to keep getting worse until we can get our emissions stabilized. Bringing them back down to, say 350ppm, isn't in the cards any time in the foreseeable future. Thus, I think the climate we have for quite a while is the one where we stabilize emissions. That's a very different world than the one most of us were born into.
...but, again, human extinction? No.
- IPCC overestimate temperature rise
MA Rodger at 04:44 AM on 10 January, 2023pbarcelog @67,
That appears to leave only Feldman et al (2015).
This was always an odd paper. Note on google scholar it is showing with 206 citations but if you look, most of these are not real citations of the paper's findings.
The question is: much extra downward surface IR you would expect from increasing CO2 from 370ppm to 385ppm (which is what Feldman et al attempt to measure)? MODTRAN gives a rise of 0.188Wm^-2 when modelling a mid-latitude winter and 0.314Wm^-2 when modelling mid-latitude summer. That these values are even the same order of magnitude of the climate forcing from such an increase in CO2 (which would be 5.35 x In(385/370) = 0.21Wm^-2) is entirely coincidental.
Your "retired engineer" appears to be dismissing this +0.21Wm^-2 CO2 forcing over the decade 2000-2010 because he says there is some cloud effect that is an "order of mangitude more relevant." So is there an increase in cloud forcing of +2Wm^-2 through that decade? Or is it perhaps a decrease of that size he talks of? Whichever, he does need to demonstrate this massive cloud effect that appeared through that decade to show he is not talking codswallop.
- CO2 effect is saturated
MA Rodger at 20:48 PM on 29 December, 2022Charlie_Brown @676,
The logarithmic relationship between CO2 and climate forcing is an empirical one and somewhere there is set out a ruling that it can be used for CO2 levels between (if I remember correctly) 150ppm up to 1,300ppm.
A good reference for the CO2-Forcing relationship is Zhong & Haig (2013) which shows the wavelengths of the CO2 forcing up to 12,000ppm and in their Fig6b the total forcing up to levels above 100,000ppm. Note that a logarithmic relationship would appear as a straight line in Fig6b, and the CO2 forcing does climb above that 'straightness' for concentrations above 1,300ppm.
You also mention CH4. At today's concentrations, the total forcing (from zero CH4) is something like 1Wm^-2. Note on that Fig6b, the forcing for CO2 with a similar concentration (I think it is 1,500ppb) is shown at something like 5.5Wm^-2. Like-for-like, CO2 is by far the more powerful GHG.
- From the eMail Bag: the Beer-Lambert Law and CO2 Concentrations
Scruffy Scirocco at 23:24 PM on 25 December, 2022Useful article, but the example doesn't accurately reflect CO2 absorption. The example states that if you lost 1% of your energy through absorption in each cylinder, you would still have 37% of your ebergy after 100 cylinders. This is correct. But CO2 absorbs energy far more efficiently than that. Using the NIST data, the transmittance is only 30% through a 10cm path at 200mmHg. It's losing 70% of its energy, not 1%.
Granted, 200mmHg is far more CO2 than the atmospheric .300 mmHG of CO2 we're dealing with, but this means that an equivalent "cell" of absorption at 1 atmosphere with 400ppm CO2 would be 65.8m. After only 5 such "cells" you would have lost 99.76% of your energy to absorption.
We can discount re-radiation passing energy forward, as that's accounted for in the NIST measurements. The lost energy will be converted to heat, which will then conductively transfer to the other 99.96% of the gasses in the atmosphere, which will pass the energy upwards in their own spectral lines.
NO energy will be radiated into space in the CO2 absorption spectra - that atmosphereis completely opaque at those frequencies. Adding more CO2 won't change that. The idea that adding CO2 will change the characteristics of the re-radiation as it goes up the atmospheric column assumes that CO2 is the only gas, and that other gasses won't be conductively robbing the CO2 of the heat it's absorbed.
What WILL happen as CO2 levels increase is that the heat absorption will occur closer to the surface, causing an apparent increase in temperature, but this is offset by cooler temperatures at altitude, not accounting for convection and increased oceanic evaporation, which, while increasing the water vapor in the atmosphere (Major greenhouse gas) will also increase cloud cover and thus surface albedo, lowering the surface temperature of the ocean. - 2022 SkS Weekly Climate Change & Global Warming News Roundup #45
Bob Loblaw at 11:11 AM on 14 November, 2022Wayne @11:
I have no idea where you get 70ppm leading to 1.2C warming. I have no idea what the "following 70 ppm" refers to.
Here are a few hints that might help:
- Give a specific reference to the article you are talking about. In your first comment, I had to guess that it was the Carbon Brief article.
- Give specific quotes or descriptions of the part of the article you want to discuss.
- Give an explicit indication, in your own words, of the part that you either do not understand or disagree with.
- Give an indication of what your current understanding is (or lack thereof), and explain how it differs from the article you are looking at.
- Pose clear questions, based on the above.
Without this information, you are leaving the readers guessing. The SkS web site is rather old in design, and has not yet implemented a "read commenter's mind" function. (We don't expect to have such a function any time soon.)
Leaving things vague is inviting misunderstanding. Brevity is not your friend.
- 2022 SkS Weekly Climate Change & Global Warming News Roundup #45
wayne19608 at 10:39 AM on 14 November, 2022Bob @9 Im referring to 70ppm resulting in an increase of 1.2C(or1.1C following One Planet) versus the following 70 ppm increase being limited to 0.3C(or0.4C). Not where the misunderstanding is coming from so not sure how to fix it
- 2022 SkS Weekly Climate Change & Global Warming News Roundup #45
wayne19608 at 05:43 AM on 14 November, 2022Nigelj I just cant reconcile those numbers with a 1.2C increase over 70ppm up to 1990 and another 70ppm in the last 30 years is going to somehow be under 0.3C and this is without further emissions or the removal of negative forcings with reduced natural capital to fall back on. I need help to square that circle
- From the eMail bag: A Review of a paper by Ellis and Palmer
Bob Loblaw at 23:37 PM on 6 October, 2022ubrew12:
The mechanism that Ellis and Palmer argue for their low CO2=low vegetation (cover, not height), is rather convoluted and you need to read their paper to see what they say. It's covered in their section 5.
Part of what they do is summarized in table 4 of their paper, where they list reductions in CO2 affecting treeline. They use CO2 values of 150 for alpine treeline (2000m altitude), and 115 for tropical treeline (4000m altitude)....
...but you need to carefully read the table to notice that they are using CO2 values in μbar, not ppm. How do they get these numbers? Well, at sea level (1 bar, or 1000 mb pressure), an interglacial CO2 concentration of 300ppm equates to 300 μbar, and a glacial CO2 concentration of 190 ppm translates to 190 μbar. They then use the standard decrease in pressure with height - at 4000m, pressure drops to about 620 mb - and 190 ppm translates to a partial pressure of CO2 of only 115 μbar.
When I read the Gerhard and Wort paper Ellsi and Palmer cite, it does not support using CO2 values in μbar. It does discuss plant response vs. altitude, and plant response at low CO2 levels, but nearly all the discussion focuses on units of ppm.
So, like the flying bee example, Ellis and Palmer choose to do a unit conversion and calculation that favours the conclusion they want to support, without really justifying the logic. Perhaps someone who knows plant physiology better than I can provide a solid argument why partial pressure rather than concentration is important for plant uptake of CO2, but Ellis and Palmer do not convince me.
- From the eMail bag: A Review of a paper by Ellis and Palmer
ubrew12 at 11:59 AM on 6 October, 2022"the paper...[argues] that low CO2 leads to low vegetation, which leads to increased dust" How does this comport with general knowledge? Vegetation requires sunlight, soil, and water, primarily. In what ecosystem is CO2 the limiting factor... deserts? In deserts, low CO2 should shrink the Hadley Cell, shrinking the desert, i.e. more vegetation, not less. I can't think of another ecosystem for which 'low CO2 leads to low vegetation' sufficient to rob the surface of all vegetation, i.e. create dust. As long as there is sunlight, soil, and water, you're going to grow stuff. And, as we've seen with hydroponics, you don't even need soil. Perhaps below 200ppm of CO2, the authors have a case. But, if so, do they prove it? And do they prove it for CO2 above 200ppm? It seems to me that for most vegetative areas, a CO2 above 200ppm precludes it as a limiting factor in vegetative growth.
"low CO2 leads to low vegetation... increased dust... reduce[d]... ice sheet albedo... end of a glacial period...[= higher temperature]." Condensed, the claim is "low CO2... = higher temperature". This demonstrably hasn't been true at any time in the last 400,000 years. If these guys think low CO2 leads to higher Earth temperature, it seems they should have to demonstrate that.
- How not to solve the climate change problem
Eclectic at 11:55 AM on 29 August, 2022Scvblwxq1 , your assertions [not-quite-arguments] are going off all over the place ~ and are missing the target. And missing the more appropriate threads, too.
The 20% figure you mention is cherrypicked from the Environmental Defense Fund ~ other reports/studies point to figures like 8% and 10% . . . and even those are based on short-term periods, and do not look at the bigger picture. Does it not occur to you that the Environmental Defense Fund has an advocacy role and might be doing its own cherrypicking? You yourself should be taking a more skeptical view, and be examining evidence/data in a more thorough and nuanced manner.
Your CO2 growth figures of 2ppm and 80ppm demonstrate your wildly inaccurate arithmetic, and your lack of understanding the basics.
Your "migration" argument is unscientific. What can we really conclude about rich elderly Noo Yorkers retiring to Florida? Or some Wisconsinites & Michiganders moving south to the warmer Texas . . . while Mexicans & others are moving north to the cooler Texas ;-)
Sun energy and cloud feedbacks are issues again pointing to your needing to educate yourself about these basics.
I suggest it would be logical for you to study the practicalities of reducing the 75% bulk of fossil-derived CO2.
- How not to solve the climate change problem
Eclectic at 10:20 AM on 24 August, 2022Scvblwxq1 , may I offer a couple of points to save you time (and you may wish to check them against the record of published scientific papers & expert views).
A / The length of interglacials varies considerably. You are correct in saying that an interglacial length does average somewhere around 10,000 years. Yet the present Milankovitch cycle has an unusually low level of ellipticity ~ which likely results in a long interglacial . . . thought to extend for 20-30,000 years (as best as can be judged from prior effects of the Milankovitch cycles during the past million years). In other words, the deep glaciation will next occur in something around 15,000 years from now.
So there is no need to hurry to warm our planet. And it has been estimated that the current (420ppm) level of atmospheric CO2 has already exceeded the level required to make a major postponement in the next glaciation that you were worried about. A postponement of some tens of thousands of years. And so the present-day concern is the adverse effects of the current rapid global warming.
B / Will the proposed Grand Solar Minimum have a (beneficial) cooling effect on planetary temperatures? Evidently not ~ for a GSM typically will produce a global warming of 0.5 degrees or less : and that effect will be insufficient to counter our ongoing AGW of approx 0.18 degrees per decade. Sorry, but there is more warming ahead (even if Prof. Zharkova's very uncertain predictions of GSM turn out to be mostly correct).
- CO2 effect is saturated
Eclectic at 18:41 PM on 6 August, 2022OldHickory @648 : thank you for expanding on the matter ~ but there is still a major shortfall in your comment. Not only miscommunication - which may partly be a verbal/semantic problem - but it appears even more certain that you have not grasped the essence of how "greenhouse" warms the lower atmosphere.
Once you have truly grasped how H2O , CO2 , etcetera operate in the atmosphere, you will see why all the climate scientists (including the famous contrarian Professor Lindzen) are in agreement on the actual mechanism of planetary "greenhouse". It seems you have confused yourself about the question of "near the surface of the earth ... is highly saturated". [your quote]
As I mentioned earlier, the "saturation" question is not really relevant. It is not the "saturation" which is important, but the concentration (as in greenhouse gas molecules per cubic millimeter . . . or cubic meter . . . or what-have-you ). Any level of concentration will produce some greenhouse, and as you increase the concentration, there comes an increase in warming effect. The effective increase is not exactly logarithmic, but for (just) CO2 in the recorded range of recent times [say 180 - 420ppm] the surface warming effect works out to be approx 1.2 degreesC for a doubling of CO2 concentration. On top of that, must be added the feedback warming from the consequent rise in atmospheric H2O vapor (a figure somewhat greater than 1.2C) .
OldHickory, you will understand that I am not wishing to write a large number of paragraphs to explain all this in greater detail personally to you. This SkS website exists for the express purpose of providing a wealth of climate science information. It is your duty to yourself, to go and really read the original article at the head of this thread, at the Basic & Intermediate & Advanced levels. And to read other related articles here at SkS and elsewhere. When you have done that, it will become obvious why all the scientists are right.
- CO2 effect is saturated
Eclectic at 12:55 PM on 6 August, 2022My apologies, OldHickory @646 and prior ~ but I am having difficulty understanding exactly where you think the climate scientists are wrong about the physics of climate. And it's likely that other readers are sharing my difficulty.
Please explain yourself more clearly. You seem to be ignoring the effect of the atmospheric Lapse Rate, which is so crucial to the mechanism of "greenhouse".
And infra-red photons from the planetary surface can only go a short distance before being absorbed by a CO2 or H2O molecule. Most of those photons would not even reach the rooftop of your house. So in that sense you can say that the lower atmosphere is "saturated" for CO2 , H2O etcetera ~ and it would be "saturated" whether the CO2 level were 200ppm or 400ppm or 800ppm or 1600ppm.
But the concentration level of greenhouse gasses at the bottom of our atmosphere will directly affect the concentration level near the TOA, and the TOA (for each specific gas) is the level where the infra-red is radiated out into space. The lower levels of air have a colossal re-cycling of IR photon energy . . . but what ultimately matters is the temperature of the TOA level. Because that is the level from which our planet loses (to space) the heat energy being gained from the sun. (Here I am disregarding the directly reflected sunlight from Earth's surface; and also the small portion being the IR "window" where IR of that wavelength that can pass directly through the air & clouds).
And the TOA temperature is dependent on the Lapse Rate. Conversely, the Lapse Rate determines the surface temperature, if you care to think about it in that way.
- CO2 is just a trace gas
scaddenp at 07:44 AM on 4 August, 2022Fixitsan, your instinct that 400 ppm is a small number is not helping you understand it's actual effect. Perhaps you need to also need realize that avagadro's number is very large.
Without looking it up, what does your instinct tell you about how far an infrared photon of appropriate wavelength would travel on average before interacting with a CO2 molecule (mean path length) for an atmosphere with 400ppm?
Now you can look it up...
You do not form accurate beliefs about the nature of reality from handwavy arguments that suit what you would like to believe. Scientists make as precise as possible predictions from theory and then make observations to check. The observed spectrum of infrared, whether measured at top of atmosphere by satellite or on earth surface match the predictions of greenhouse gas theory to a very high degree.
- Clouds provide negative feedback
Bob Loblaw at 10:51 AM on 14 July, 2022Likeitwarm: what exactly do you mean by "runaway heating"? Unless you are willing to define your term, you are playing word games.
If CO2 content stabilizes at any point (450, 500, 600ppm, take your pick) then temperature will stablize at some new value (2, 3, 4 or more degrees warmer than it was at 300ppm CO2), and it will not continue to increase indefinitely. It will not "run away". But that new, stable temperature will have plenty of bad consequences.
Even if we were to manage to burn every gram of fossil fuel we can find, and raise CO2 to 1200ppm or more, we still won't see a perpetually-increasing temperature. No "runaway". A new equilibrium will be found. There is no reason to expect anything like Venus.
After all, body temperature is only 37C (98.6F), and if you get a fever and your temperature goes up to 41C and stabilizes at that point, you still run a pretty large risk of death. Your body temperature does not need to keep rising more ("runaway") to be a serious problem.
Unless you have some other (odd) definition of "runaway".
Should you wish to discuss "runaway greenhouse effect" myths, there are two possible threads here:
https://skepticalscience.com/Venus-runaway-greenhouse-effect.htm
https://skepticalscience.com/positive-feedback-runaway-warming.htm
It would be worth your time to read those posts (and possibly the comments) in full.
- Skeptical Science New Research for Week #26 2022
Doug Bostrom at 08:10 AM on 4 July, 2022"It is physically impossible that the balance is not there."
Yes, and here in the context of CO2 added to the atmosphere that balance is to do with radiative equilibrium. Equilibrium will happen— accompanied by many changes, mostly of an awkward nature as can be seen if one bothers to check research findings. One can easily calculate a ratio of good/bad by following NR, here. The ratio isn't good.
"That meteor 66 millions years ago ( killed dinosaurs and 3- of every 4 living things on earth) lowered the world 5 degrees overnight and darkened the earth completely sunless for 6 years. 30 degree F drop in 6 years, then swinging higher than previous normal and climbing to 2000-2500ppm once the sun returned. It all came back."
After enough death and dying (aka "evolutionary pressure"), everything was fine— right, got it. And the human species is collectively behaving like a brainless rock, yes. How is this good news, consolation, or reassurance? Meanwhile, thinking in geologic time isn't our nature and as well isn't really helpful in terms of dealing with changes happening right now.
The irony kicker:
"More co2 increases foliage (detected by Nasa's MOTIS), more transpiration, more moisture in the air, more low clouds with higher albedo."
If one bothered to follow NR and rather than instantly singing a comforting cantata of vague hopes instead read only titles and abstracts of papers listed here, one wouldn't make such a glib, facilely optimistic remark. One would know that neither of those claims pencil out as salvation.
- Skeptical Science New Research for Week #26 2022
peppers at 00:53 AM on 4 July, 2022I see this as a sort of misplaced approach to this issue, as all this data does little to folks passing by your stand at the swap meet. You are addressing people who may be saying there is no changing happening, and I dont think that remains logical. But some may be saying that to be obstinant or antagonistic. For myself, I dont think that change is happening is hard to see. The crisis stated by all this refers to the hockey puc being a precident in history, and the world will now be ending shortly by a runaway cycle. The train barreling down on a next generations child was the fearsome icon. But the world has experienced this before. That meteor 66 millions years ago ( killed dinosaurs and 3- of every 4 living things on earth) lowered the world 5 degrees overnight and darkened the earth completely sunless for 6 years. 30 degree F drop in 6 years, then swinging higher than previous normal and climbing to 2000-2500ppm once the sun returned. It all came back. My point is that, no matter it happening or the source, the world ( the universe ) balances. More co2 increases foliage (detected by Nasa's MOTIS), more transpiration, more moisture in the air, more low clouds with higher albedo. You will find even more paths of balance if you turn your capable eye to the cycling of nature, meaning the inescapable balance of all cycles. It is physically impossible that the balance is not there, I assure you. I am happy to elaborate more if there is interest. Thanks and best, David
- Climate Confusion
wayne19608 at 06:53 AM on 2 July, 2022Evan @ 5
If we stabilize at 420ppm. At .2C per decade and a 3 decade lag we end up with 1.2 + 0.6 = 1.8C but the change from 280 to 350 resulted in 1.2C so there is still another 0.6C to consider which would bring it to 2.4C. I know its not a linear relationship but I doubt its going to break in our favour. The numbers just dont seem to match up in my mind. Land use is obviously a big factor but that doesnt seem likely to go our way in the near future either
- Climate Confusion
wayne19608 at 14:35 PM on 28 June, 2022I don't know the graphs above are meant to be or if I am reading them right. But..
The ocean time lag is 30 yrs?
The current temperature anomaly is 1.2C?
The current CO2 concentration is 420ppm?
30 yrs ago the CO2 concentration was 350ppm?
pre industrial CO2 concentration was 280ppm?
So 350-280 is a 70ppm rise has resulted in a 1.2C increase in temperature?
420-350 is also a 70ppm rise so what temperature anomaly are we expecting in 2050?
Is the ECS of 3C for 280ppm rise overly optimistic?
I know I am being extremely simplistic here, but?
- There is no consensus
Bob Loblaw at 11:27 AM on 5 April, 2022Sun:
There is a lot in between the two extremes of "catasrophe" and "no need to do anything". It is not a binary system or "right or wrong" - it is a range of likely outcomes and risks.
We know with pretty much 100% certainty that adding CO2 causes some warming. For doubling of CO2 (from 300 to 600ppm) it is very unlikely that it will be less than 1.5-2.0C. It will also be very unlikely that it will be more than 4.5-5.0C. But that leaves a lot of range of likely temperature effects that will cause serious changes in climate and very likely serious (and expensive) impacts on society. The larger the temperature change and the impact, the more important it is that we take additional action.
The idea that CO2 limits will harm the economy is discussed in this thread at Skeptical Science.
- Climate's changed before
Bob Loblaw at 11:18 AM on 5 April, 2022Welcome to Skeptical Science, hmmyes and Fya.
hmmyes: you ask about how much CO2 the climate can handle? The earth-atmosphere system can handle a lot, and climate will always be there - it is simply what is observed, however cold or hot things are. From a human perspective, though, there are an awful lot of climates that earth can tolerate that humans cannot. 18,000 years ago was 4-6 C cooler than now, and cie covered huge areas of current land. Running today's modern civilation in that earth would be very difficult. On the flip side, a 4-6C warming would also be very expensive for humans, if not intolerable. The past changes in climate tell us that 4-6C of change is a big change.
Fya: mass extinctions from things like meteor impacts are indeed a very abrupt and severe form of change, and CO2 wll not have that rapid effect. But the effects of a 4-6C rise in temperatures (the high end of esitmates for a doubling of CO2 from 300 to 600ppm) will not be gentle.
- The Climate Shell Game
MA Rodger at 10:58 AM on 22 March, 2022I cannot agree with the notion set out by the OP that "accelerating" AGW is being driven by the rise in global population.
Firstly, yes, the global population is increasing, presently at 80 millions per year, and the population & CO2 emissions rises are very similar, but the societies with rising population are not the major contributors to the emissions rises. There is thus no viable connection between population & CO2 emissions.
Secondly, what is meant by the idea that AGW is "accelerating" does need to be nailed down before it is presented in such an analogy.
I do agree with the general view that there is a disconnect between the science and the real-world policies to mitigate AGW.
There certainly is a "don't scare the horses" agenda being propagated by politicians. (Or perhaps it is the civil servants that advise dumb politicians who are doing the propagating.) The idea that we can scale up renewables to achieve a 50% cut in GHGs by 2030 and 100% cut in CO2 by 2050 is not practical given the present efforts to achieve it.
I am from UK whose ruling politicians are not-so-long-ago climate-change-deniers. They delight in telling the world how we have cut our emissions by a world-beating 40% since 1990. Ignoring the significant exporting of emissions through the period since 1990 that allowed the 40% cut to be achieved, we are still (2020 data) at 32M toe non-fossil-fuels primary energy production, a value that hasn't moved since 2017. (See DUKES 2021 datasets) So no sign of any actions to address any looming climate emergency. Instead we get bonkers Boris and his world-beating nonsense.
So I generally agree with the message the OP is hoping to provide, but am not at all happy with the analogies.
I would also point to errors in the portrayal of "net zero". The zero is about CO2 emissions and not about atmospheric concentrations. The scenario SSP1-1.9 hits net zero emissions by 2050 but atmospheric ppms peak and begin the drop from 2040 (at 440ppm according to Meinshausen et al 2020).
- Models are unreliable
Philippe Chantreau at 03:47 AM on 16 March, 2022Oldengine,
I very much understand how you feel. I used to teach the weather and weather data sessions in the groundschool part of a pilot training program. Back then, CO2 content was still around 300ppm. The fact that it increased to 400 is a geological scale event that happened in a geological blink of an eye. There is no natural explanation for this whatsoever.
The reason why this thread is so long and convoluted is the never-ending insistence of some to protect the power of certain industries. In that effort, they deploy an infinity of vacuous arguments, all of which have to be dismissed meticulously by the reality based crowd. Meanwhile, they have no problem remaining free of the very strict standards they demand of others, with arguments ranging from grotesque as shown by basic physics, to downright mendacious. They seldom, if ever, argue in good faith.
I actually trend to agree on many of your points. I hope the reactor being built in Wyoming will pan out and show itself as a viable tool. The efforts toward fusion energy should increased tenfold. Coal burning on an industrial scale should be phased out as quickly as possible. Terrestrial transportation should be electrified to the best extent possible. All possible avenues to minimize emissions in agriculture practices should be explored and implemented. Buildings should undergo retrofitting work, new ones should have appropriate certification standards. Fossil fuels use should be reserved to situations where alternatives are not possible or practical, like aviation, which presents unique challenges in terms of weight and energy density, but where efforts to find ways for the future have increased significantly in the past 15 years.
- 2022 SkS Weekly Climate Change & Global Warming News Roundup #7
MA Rodger at 22:43 PM on 27 February, 2022Santalives @28,
You now present a third pile of nonsense here at SkS. At least you show a level of consistency. Coe et al (2021) 'The Impact of CO2, H2O and Other “Greenhouse Gases” on Equilibrium Earth Temperatures' is as ridiculous as the other two you presented.
Coe et al (2012) claims that it addresses the issue of Equilibrium Climate Sensitivity (ECS) which, as is well known, has not been well-nailed-down by science for four decades now. So it would be quite a feat if there was even a smidgeon of promise in this paper to some contribution to the asssessment of ECS.
I could set out why this is an entirely non-scientific paper that well deserves its place in the trash can but in your ignorance you would likely see this as "one side" being disrespectful to "the other side".
So instead let me address what these numpties Coe, Fabinski & Wiegleb are doing that is so badly wrong.
The crux of the ignorance presented within Coe et al (2012) begins to congeal in their Section 1.4. Here they derive entirely on their own** a value called “n” the “energy retention factor” given "a" the "atmospheric absorptivity" (or the proportion of surface radiation gets to space through a clear atmosphere. By using HITRAN to derive "a" (the calculated percentage of surface radiation that reaches space through that clear atmosphere), they derive "n" by balancing "a" against the radiation that has to reach space to balance the incoming solar warming.
(**Note the one citation presented by the numpties for this grand work, Wilson & Gea-Banacloche [2012], is a total misrepresentation.)
The process they use runs as follows.
If a black body of 288K (representing the surface temperature) was in equilibrium with today's absorbed solar energy which equates to a 255K black body, they calculate that the energy out into space would be just 61.5% of the 288K black body radiation.
Thus, they derive for today's atmosphere (with a=a0) n.a0 = 38.5% of the surface radiation will be absorbed by the atmosphere. However, they also calculate using the grown-up HITRAN database, that the transmission through today's clear atmosphere of such 288K black body radiation would be a0 = 73.0% allowing them to derive in their Section 2.7 a value for "n"; n = 52.7%.
And this incredibly simplistic method allows all the sceintific effort over the last four decades attempting to derive accurate ECS values to be sidestepped. Even the complex impact of clouds on this finding is sweetly side-stepped because, as they tell us in their Section 5.1, clouds are already accounted for in the derivation of "n".
And all this is their own work. No supporting evidence. What clever numpties are these Coe, Fabinski & Wiegleb.
Of course, there are feedback mechanisms to be negotiated and the numpties calculate (using simplistic assumptins) feedback values for water vapour (+18%) and the wavelength change in the radiation from a warmer world (-5%) with a net result feedback of (1.18 x 0.95 =) +12%.
They then calculate the impact of differing levels of CO2 GHGs on the absorption of surface radiation through a clear atmosphere to calculate direct warming from a doubling of CO2 (400ppm to 800ppm) of +0.45ºC (when the science is irrefutably sure the value is +1.0ºC) and thus with a feedback of +12%, they can derive ECS = +0.5ºC (when the science says +1.5ºC to +4.5ºC).
Of course, the GH-effect doesn't work in anything like the manner assumed by Coe et al (2012) so all these numpties Coe, Fabinski & Wiegleb are doing is advertising their own stupidity.
- 2022 SkS Weekly Climate Change & Global Warming News Roundup #7
Philippe Chantreau at 09:37 AM on 27 February, 2022The "article in point" claims this: "In fact, the
climate sensitivity to a doubling of CO2 from 400ppm to
800ppm is calculated to be 0.45 Kelvin."
However, there has already been over 1 degree of temperature increase compared to pre-industrial, with the concentration going from 290 ppm to 400 ppm and we are nowhere near equilibrium for 400, which would take some time.
I did not see in the paper a competing explanation for the measured increase. I also did not see why exactly they believe that all the rest of the litterature that concludes the equilibrium sensitivity for a doubling of pre-industrial concentration is around 3 degrees is wrong.
The argument against feedbacks is not very detailed and amounts to little more than hand-waving. It flies in the face of an extensive body of research into the glacial/interglacial transitions associated with Milankovitch cycles.
At first glance, I am not very impressed. Hopefully, more qualified commenters will look into it. I am also not sure about the publication where this piece appeared.
- The 1.5 degrees goal: Beware of unintended consequences
swampfoxh at 03:07 AM on 13 January, 2022The authors point to "...existing energy producing systems and capital stock", which are only half the problem. The other half of the TWO LEADING PROBLEMS of GHG emissions is Industrial Animal Agriculture. These authors are silent on this topic (?) Further, GGEs should occupy only a small space alloted to the topic of environmental/ecological damage. Deforestation, desertification, excess fresh water useage, wildlife habitat destruction/extinction, widespread land use conversions for the support of animal agriculture, eutrophication of fresh and saltwaters, human diseases connected to domestic livestock, herbicides, pesticides, chemical fertilizers...overfishing...an exceedingly long list of eco-distructive activities and behaviors that may not materially affect the quantity of GGEs in the atmosphere, but even at 270 or 350ppm, (now long gone) would dangerously affect the future welfare of living things...especially humans.
- SkS Analogy 25 - Emissions vs Accumulation
MA Rodger at 09:35 AM on 31 October, 2021swampfoxh @3,
The 15 million years since the planet saw CO2 at today's level is what I would say as we are surely now well past the levels of 3 million years bp which likely didn't even reach 400ppm.
I would suggest your minimum of 240ppm over this 15 million year period to be too high. The usual value bandied about is 180ppm during an ice age while co2levels webpage gives a minimum value on its 800ky record of 172ppm back 670ky ago.
- SkS Analogy 25 - Emissions vs Accumulation
swampfoxh at 02:45 AM on 31 October, 2021Further, I think there is general agreement that CO2 in the atmosphere is the highest it has been in 15 million years, and for that matter, even the lowest it has ever been in that same 15 million years, it hovered around 240ppm. Does anyone, here, have better numbers?
- CO2 effect is saturated
MA Rodger at 01:12 AM on 13 September, 2021Hari-Seldon @616,
(I assume you have adopted the name of the character Hari Sheldon from Asimov's Foundation trilogy but claim nothing of his prescience.)
Picking up on michael sweet @617 description of the mechanism of CO2 forcing and its logarithmic nature....
Chicago University's MODTRAN which you employ is a very useful on-line resource. But I don't think it is correct to suggest that CO2 levels are "in a condition similar to saturation" because the forcing is logarithmic.
You show the climate forcing incrementing due to 2x/4x/8x the pre-industrial CO2 280ppm level as being (& I correct your arithmetic) +3.30, +3.36 & +3.52Wm^-2. A further increase to 16x to 4,480ppm again yields an additional +3.74Wm^-2 with 32x incrementing +4.11Wm^-2 & 64X incrementing +4.68Wm^-2.
And a halving of the pre-industrial level to 140ppm from 280ppm yields -3.36Wm^-2. And this 'halving' sequence can be contimued down to roughly that 1ppm you mention, halvings running down from 140ppm -3.42, -3.52, -3.48, -3.45, -3.14, -2.51, -1.88Wm^-2. And these halvings from 280ppm down to 1.094ppm total to -24.8Wm^-2.
While I am not sure how well MODTRAN works at CO2 levels well beyond today's atmospheric levels (I assume the well-established 3.7Wm^-2 value does not appear in the doubling 280ppm-560ppm as the model is set for the clear-sky tropics), it is plain that CO2 creates a reasonably constant climate forcing for each doubling from roughly 20ppm up to 2000ppm. This logarithmic relationship is well-known. Al levels of CO2 above 800ppm, Zhong & Haig (2013) found the forcing from these higher CO2 levels begin to exceed the logarithmic relationship due to significant additional radiative effects appearing at 10μm which provide extra forcing as the 15μm effects diminish.
So the relationship is stronger than logarithmic and thus describing such a relationship as "in a condition similar to saturation" is neither applicable nor (given the dismissive connotations of calling it 'saturated') helpful.
- CO2 effect is saturated
Hari-Seldon at 22:17 PM on 12 September, 2021As a theoretical physicist I have learnt to be very carefull with my words and to closely exam the available data. Using the link I found here
(http://climatemodels.uchicago.edu/modtran/) I understand that:
Is the CO2 saturated? No it is not.
Is it in a condition similar to saturation? Yes it is. The reason is that with 1ppm of CO2 there is an upward IR flux of 325.304 W/m^2.
With 280ppm of CO2 there is an upward IR flux of 300.215 W/m^2 (lost 25 W/m^2)
With 2*280 =560 ppm of CO2 there is an upward IR flux of 296.918 W/m^2 (lost 3.7 W/m^2)
With 4*280 =1120 ppm of CO2 there is an upward IR flux of 293.559 W/m^2 (lost 3.36 W/m^2)
With 8*280 =2240 ppm of CO2 there is an upward IR flux of 290.042 W/m^2 (lost 3.5 W/m^2).
In order to have an upward IR flux of 275 W/m^2, i.e. to have a decrease similar to the one from 1ppm-280 ppm (we should reach a concentration of 25000 ppm). This means that we are near the plateau of the curve which means we are in a condition similar to saturation (because I am not convinced that a real saturation exists).
- Key takeaways from the new IPCC report
MA Rodger at 16:44 PM on 13 August, 2021ilfark2 @10,
I would not be so definite about the speed of CO2 draw-down as to put a value on it but the 3ppm you give is not unreasonable, but only as the initial value.
If we stopped emitting CO2 tomorrow, with 45% of our emissions now in the atmosphere, perhaps half of that will be drawn down into the oceans. (Note this also involves an additional transfer into the oceans, out from the biosphere which is more advanced along the path to equilibrium.) So +45% of our emissions, or that atmospheric increase of +140ppm, would roughly halve suggesting a drop of 70ppm, back to ~350ppm, this taking some 1,000 years although most would occur through the firat 100 years.
- How Increasing Carbon Dioxide Heats The Ocean
MA Rodger at 18:42 PM on 7 August, 2021steve37341 @73,
The 20ft difference in sea level suggests you are envisioning the melt-out of Greenland in the 300ppm/27°C scenario but not (or not yet) in the 400ppm/25°C scenario. This has profound implications as the absence of an icy Arctic in the first scenario is a situation requiring millennia for the second scenario to accomplish. Can you confirm this Greenland melt-out is what you intend to confirm with this 20ft SLR?
And can we be clear that the 5,000y "steadily warming" in scenario one has now stopped?
Finally, if the 400ppm CO2 level in scenario two is continuing to increase, the rate of increase is required, as is the history of this increase - when did it begin and from what level?
- How Increasing Carbon Dioxide Heats The Ocean
Eclectic at 14:51 PM on 7 August, 2021Steve @#37 ,
I must beg you for more details & more background to your questions. Are you basing your questions on real-world situations? If so, then the 25C or 27C are global average Surface Air Temperatures which have not been existent during the past 10 million years or so.
If you are talking of recent millennia, then coming from the latest "ice age" glaciation, the global SAT rose by around 5C and stayed at that Maximum (or "Optimum") for about 5000 years. Then during the past 4000 years, the SAT has gradually cooled by about 0.7C . (As you are likely aware, the PAGES12k studies indicate that the current [2020] temperature is nearly 0.5C higher than the Holocene Maximum.) During this time, the atmospheric CO2 level hovered around 280 ppm during the Holocene, and started rising during the past 2 centuries.
So your 300ppm and 400ppm scenarios are quite disconnected from the Earth's surface conditions during the past 10k , 100k , or million years.
Ocean warming is very slow, and it is the oceans which put a brake on SAT rise ~ more so than the other way around. The oceans take in more than 90% of the heat energy gained during total global warming periods, and the air itself represents only a few percentage points of the total. Which makes it difficult to get a good picture of what would happen in the abstract hypothetical situations that you pose.
- How Increasing Carbon Dioxide Heats The Ocean
steve37341 at 12:38 PM on 7 August, 2021Eclectic @70, MA Rodger @71, & Bob Loblaw @72 thanks for each of your replies. I realized that I did not really give enough information about my scenario. The 25°/27° comparison was for atmosphere temperatures. Not average ocean temperatures. The average ocean temperature is the same in each situation. The only difference in the ocean variables is that in the example with the 300ppm CO2 and 27° atmosohere temperature, the sea level is 20 feet higher.
Also, the to get at the suggestion of where each situation is based on it's state, the example with the 300ppm has been steadily warming about 5000 years.
In the example of the 400ppm has been warming for about 8000 years and is still warming and the CO2 levels are continuing to increase, with the upper limit unknown.
I assume that the extra CO2 in the second example would eventually, is it stays higher long enough, would cause greater atmospheric temperatures and greater warming of the oceans. Or is this an incorrect assumption or could other variables come into play to alter that result(s)?
Another question. Assuming the mixing of the ocean waters in deep and shallow areas is relatively the same in each example, which is more important in heating more shallow areas? Higher atmosphere temperature, or higher CO2 level?
- How Increasing Carbon Dioxide Heats The Ocean
MA Rodger at 02:47 AM on 6 August, 2021steve37341 @69,
As Elcectic @70 suggests, the question you pose concerns a complex and dynamic situation.
But if what you ask is reduced to the question of whether a +2°C in global surface temperature is a bigger kick to the climate (and thus the ocean temperature) than a 33% increase in CO2 (from 300ppm to 400ppm), the very basic response would be the +2°C is the strongest. A simple 33% incease in CO2 would result in a forcing of +1.54Wm^-2 which for an Equilibrium Climate Sensitivity of +3.2°C per 3.7Wm^-2 (the central estimate of ECS) would result in a surface warming of +1.33°C.
Adding more realistic assumptions would quickly impact that result. Thus, for instance, one early added consideration is that a surface temperature increase would be greater over land than ocean raising the question of whether your +2°C is a global figure or a surface (atmosphere) increase measured over the ocean.
- How Increasing Carbon Dioxide Heats The Ocean
Eclectic at 14:34 PM on 5 August, 2021Steve37341 :
Your question re 300ppm/27C versus 400ppm/25C cannot (IMO) have a short answer.
In rough figures : the oceans (which have average depth of 4000m) have a bottom temperature of 4C and a near-surface temperature of 15C. And the 15C is only an average ~ higher in the tropics, lower near the poles. Different temperatures above and below the thermocline. Dozens of years to dozens of centuries, for surface warming/cooling to mix into deeper layers.
So the question becomes modified to: Which parts of the oceans warm up, and by how much, and over what time span? . . . a year, or a thousand years (or inbetween). And do subsequent changes in CO2 solubility cause an alteration of the 300ppm or 400ppm levels . . . or will other climate variables come into play?
300ppm CO2 and 400ppm CO2 are figures which are now entirely in the past ~ and so your question is extremely hypothetical; as are the ocean temperatures you mention.
Perhaps you could express the thoughts and ideas that led you to compose your original question. That may lead to a better way forward in thinking about these sorts of climate aspects.
- How Increasing Carbon Dioxide Heats The Ocean
steve37341 at 07:53 AM on 5 August, 2021I have a query. In which case would the oceans likely warm more (most). If you have an atmosphere that has 300ppm CO2 and is 27°C. Or a situation where the atmosphere has 400ppm CO2 but 25°C? Or is it impossible to tell without knowing other variables?
- CO2 effect is saturated
MA Rodger at 20:38 PM on 25 July, 2021Philippe Chantreau @608,
I'm not too sure that fig 5 from Clough & Iacono (1995) is particularly useful at "Chart(ing) the incremental temperature insulation from different thicknesses of co2." as Ingrahammark7 @599 requests.
Looking back @381, I note within-thread much use of output from Chicago Uni's MODTRAN. Running that model for the planet with only CO2 as a GHG for different ppm yields the following reductions in OLR for (as Ingrahammark7 puts it) "different thicknesses of co2" with no sign that "a doubling does nothing."
0ppm(v) ... ... ... ... 0 Wm^-2
0.375ppm(v)... ... 3.45 Wm^-2
0.75ppm(v) ... ... 5.02 Wm^-2
1.5ppm(v) . ... ... 7.22 Wm^-2
3ppm(v) .. ... ... 10.05 Wm^-2
6ppm(v) .. ... ... 13.19 Wm^-2
12ppm(v) . ... ... 16.64 Wm^-2
25ppm(v) . ... ... 20.41 Wm^-2
50ppm(v) . ... ... 24.18 Wm^-2
100ppm(v)... ... 27.63 Wm^-2
150ppm(v)... ... 29.83 Wm^-2
200ppm(v)... ... 31.40 Wm^-2
250ppm(v)... ... 32.34 Wm^-2
300ppm(v)... ... 33.28 Wm^-2
350ppm(v)... ... 34.23 Wm^-2
400ppm(v)... ... 34.85 Wm^-2
450ppm(v)... ... 35.48 Wm^-2
500ppm(v)... ... 36.11 Wm^-2
550ppm(v)... ... 36.74 Wm^-2 - The New Climate War by Michael E. Mann - our reviews
Nick Palmer at 02:41 AM on 22 June, 2021Yet again there are too many, in my view flawed, responses to give answers to all. I still think none of you are fully getting what I am saying. Nigel J is closest to 'getting it', MAR is (waaay) furthest away (his comment #72 in particular is a mirror inage of the sort of toxic denialist misrepresentation of someone's position that we see too often when fighting said denialists).
I'll try and restate things later, if I get time, and will try to clarify the bits where peoples' defences are causing then to bounce off. In the meantime, remember that all this sponsoring of think tanks, who used denialist rhetoric as part of their lobbying for corporate clients, took place quite a long time ago when carbon capture and sequestration seemed a lot more promising than it has proved to be (until recently) a couple of decades later. Back then it was an entirely reasonable position for a corporation to take to assume technological progress would be delivering the CCS magic machines in time to do the job of nullifying emissions to atmosphere. The coal industry, for obvious reasons, were most hoping for this get-out-of-jail-free card. I think it was BP or Shell Oil that first had their accountants put a notional 'carbon price' into their financial reports, thus hedging their bets. Should CCS prove economic, any carbon sequestered would not be taxed; should it not, then their financial planning would already be taking a carbon price into account.
As it happens, just about the only thing preventing the uptake of existing CCS tech is money - the lack of a suitable global carbon price. The actual technology/chemistry, which is pretty simple, works just fine, and has done for some considerable time, it's only the economics of running it which have been dodgy. However, that's likely to change rapidly as Carbon Engineering's system of direct air capture https://carbonengineering.com/ is expected to come in at around $100 a tonne, which is waay better than other systems. This is tech is also about direct capture of CO2 from the ambient atmosphere. Obviously, point of generation 'smoke stack' capture would be even easier. Even doubling that figure means that just a moderate carbon price would be sufficient to justify sequestering carbon just on financial grounds.
Excerpt from their latest news:
"Project Dreamcatcher is a key step towards Storegga and CE’s ambitions to build a large-scale DAC plant in the UK within the next five years. The proposed large-scale DAC facility will capture between 500,000 and one million tonnes of atmospheric CO2 each year and then safely and permanently store it deep below the seabed in an offshore geological storage site. One of the locations being considered by the partnership for this facility is in North East Scotland, with access to the Acorn CCS and Hydrogen Project (Acorn).
Acorn is one of the most mature UK CCS and hydrogen projects and is positioned to be the most cost-effective and scalable CCS project in the UK. The Acorn project is currently in the detailed engineering and design phase of development and is planned to be operational by the mid 2020’s. DAC, CCS and hydrogen technologies are complementary solutions that provide key tools for the UK to meet its net zero targets."
However, this doesn't mean that I think that Big Fossil Fuel's original hope that CCS would enable them to indefinitely continue to run their industry at the scale it was will come to pass. I think the business risk they took twenty years ago will not pan out for them. I'm fairly sure that the fossil fuel industry will shrink in future as the price of new renewables continues to fall to below the price of new fossil fuel and the much improved 'failsafe' and modular designs of new generations of nucelar power stations are authorised. It may be that there will always be some remaining niche applications for them to fulfil in future which still need fossil fuels and so CCS can take care of that, whilst sucking out existing excess atmospheric CO2.
I think Scott's (Red Baron) system of carbon capture by sequestration of carbon into managed agricultural field systems has far more (read 'huge'...) potential than most realise. The arguments against it sound very close to the type of rhetoric that extreme environmentalists and left'ish anti-Big Industry types use to argue (fallaciously, in my opinion) against technological CCS inasmuch as I think it clear that they're antithetical to any solutions which promise to let our current technological civilisation continue as it is and so they jump through mental hoops to undermine them leaving, they hope, their favoured solutions as the only option.
Whilst I'm throwing cats amongst the pigeons, how about this? Assuming widespread adoption of CCS techniques enables us to start lowering atmospheric levels in future, I don't think we should try to get back to pre-industrial levels of 280ppm. I think 350 ppm would be a great place to stop as it keeps us just about in the 'goldilocks zone' where the long term benefits of moderate global warming are, on balance, neutral or positive and would have the very long term benefit of heading off the next glaciation... - If growth of CO2 concentration causes only logarithmic temperature increase - why worry?
jimmww at 18:04 PM on 15 June, 2021Since the first 20ppm of CO2 produces 50% of its GHG effect, the next doubling to 800 ppm will in crease its GHG effect by less than 2%, overwhelmed, most likely, by the other eight forcings.
There are reasons to look for alternative sources of energy. There are good reasons to clean up our environment (and our bedrooms). Plastics in the oceans and rivers should now be our main concern. And it isn't! CO2 is not a pollutant.
Climate change is a given, not a problem. CO2 mitigation is a problem, not a solution.
- The New Climate War by Michael E. Mann - our reviews
Philippe Chantreau at 05:16 AM on 14 June, 2021OK, I understand what you're saying. You're still not addressing some of Bob's and my points. There is a big disconnect in your discourse. Clarify a few things for me:
At what point in time did the science become strong enough to demand action?
For one principled as you are on communicating the science, at what point does denial rethoric become unacceptable?
As of now, only baby steps have been made, in large part because vested interests have been successful at delaying significant action over the past 20 years, way beyond the 80s or 90s. Was this justified?
As much as activist organizations can ask for ending fossil fuel use now, it has a zero probability of happening and even a zero probability of being attempted. You contradict yourself by stating on one hand that corporations are worried that the public would buy into that extreme activist threat, and on the other that their view is "non-starter" for at least half the population.
Your argument appears to boil down to this: it's ok to support false/misleading denial rethoric because, if it's not out there, these activist groups will convince the world of ending all fossil fuel use from one day to the next. That's a stretch reaching the breaking point. In fact, it is not believable at all.
Was it ever desirable for denial rethoric to be so successful as to prevent any effort at a transition, even one that did not present the existential threat you mentioned?
Since you have spent so much effort combating misinformation, would you say it was ever desirable to have such a large proportion of the public buying into all the myths this site debunks?
Is BAU and a never ending status-quo desirable?
Can we honestly say that nothing between the extremes of status-quo and end-it-all now could possibly be worked out?
Is it realistic to consider that, if fossil fuel companies accepted the conclusions of the science, they would instantly disappear, in view of how ingrained fossil fuel use is to our economies and all aspects of our lives?
As for nuclear, as I have said earlier, I am not opposed, at least in principle. They just need to get their sh*t together and stop being over budget and behind schedule.
Fusion sounds great, but is unrealistic as short or even mid-term solution. Cold fusion has not been beyond the pipe dream level. The best hot fusion to date is the recent 101 seconds at 120million deg at EAST. Nowhere close to breaking even, let alone produce anything. ITER is supposed to be complete in 2025, I doubt they'll see plasma before 2026.
Meantime, the multiple wedges approach that we could have adopted 20 years ago (a very reasonable approach completely removed from extreme views) has not happened on any significant scale and we sailed passed 400ppm.
- Dr. Ben Santer: Climate Denialism Has No Place at Lawrence Livermore National Laboratory
MA Rodger at 22:33 PM on 31 May, 2021We are now a few days after Koovin's seminar at the LLNL but I don't see a word of the grand message presented by Koonin. Presumably it is as embarassing as his silly book.
Trying to find some coverage of the seminar, I did spot Koonin's pathetic attempt at de-debunking, that is debunking the WSJ Mills' article [LINK-paywalled] that debunked his silly book. Koonin's efforts at de-debunking simply demonstrates the level of utter nonsense you can expect from an obfuscatiing denialist troll like Koonin.
Just holding up the first of the nine items Koonin attempts to de-debunk shows the purile standard. This first item involves the following untruthful quote from Koonin's book which needs little comment to debunk.
"Greenland’s ice sheet isn’t shrinking any more rapidly today than it was eighty years ago."
Cutting through the nonsense presented by Koonin's de-debunk, the troll defends his grand assertion using Fig 1d of Frederickse et al (2020) 'The causes of sea-level rise since 1900' which shows the 30-year average rate of SLR attributed to Greenland by the study 1910-2010. Koonin tells us:-
"The “fact check” [by Mills] does not refute the statement quoted, which is about the rate of sea level rise 80 years ago."
...
"The 2019 paper by Frederikse et al. clearly shows that Greenland’s contribution to sea level rise around 1940 was about three times higher than it was in the last decades of the 20th century."
Yet, if it is about SLR and not Greenland, then the relevant evidence from Frederickse et al is shown in Fig 1c not Fig 1d. And Fig 1c shows average rate of SLR in 2010 was 33% greater than at any time "eighty years ago" and that "today" it is likely higher again. Greenland is not the sole contributor to the acceleration in SLR (thus a cherry-pick) while Koonin's use of "the last decades of the 20th century" to represnt "today" is no more than disigenuous trolling.
...
And in the intrests of correctness (the troll Koonin may have been saving his best until last), the ninth and last of his de-debunking atttempts to defend the Koonin quote:-
"...while global atmospheric CO2 levels are obviously higher now than two centuries ago, they’re not at any record planetary high — they’re at a low that has only been seen once before in the past 500 million years."
The context of this quote which compares today with "the past 500 million years" is not given. It appears Koonin bases his "only seen once before" comment on CO2 relative to today's 400ppm being lower 300 million years ago. And presmably his grand book does not provide a justification for this comparison. So, as was discussed in the debunking by an actual geoscientist, 300 million years ago the sun was much weaker, this perhaps 1.5% weaker 300 million years ago, so [0.025 x 250Wm^-2 =] 3.75Wm^-2 or the equivalent to a doubling of CO2. Koonin ignores such argument agaist him and instead concentrates on refuting the potential for future CO2 levels reaching 1000ppm.
- Dr. Ben Santer: Climate Denialism Has No Place at Lawrence Livermore National Laboratory
MA Rodger at 00:01 AM on 26 May, 2021Eclectic @5,
I don't think there is any reason to think that Koonin wasn't always an oilman at heart and never properly signed up to AGW mitigation. And the declaration of 'Climate Emergency' is what has pushed him into his book-writing.
As late as 2012 (this LINK downloads a Powerpoint presentation from 2012) we see him saying the requirement is to stay below 550ppm and that this will require emission rates dropping to 50%. "We need to reduce emissions by a factor of two from current levels to remain stable at the 550 ppm level, and this in the face of doubling the demand of energy by the middle of the century, so we need to cut the common intensity of our energy system by a factor of four." That is over 15 years behind the science!! And he also sees a very oily future.
Back a few years and Koonin is in THIS APS Q&A (with his future boss in the Obama Admin, Steve Chu, who is saying "You’ve got to do something now"). The message from Koonin is ambiguous and if you ignore his advocating CCS, is ambiguous to the point of being a non-message.
- CO2 is plant food
Eclectic at 18:32 PM on 7 April, 2021TVC15 @#40 ,
the Canadian denialist has linked to an "amusing" website article showing :-
(A) "Plants have been starved for CO2 at the low levels existing before the industrial revolution". (Which would be why the South American Amerindians have dwelt in semi-arid wastelands for thousands of years rather than discovering the lush vibrant Amazonian Jungle ? )
and (B) "Mankind has been living on the edge of extinction with low levels of atmospheric CO2" . . . since all (terrestrial?) plants die if atmospheric CO2 falls below 150ppm.
I gather that under experimental conditions, plants can survive with less than 150ppm CO2 ~ but this is confounded by many other associated factors that would apply in a real world situation (including very extensive glaciation).
See my comments in #34 above.
But the very low CO2 scenario is moot because of recent anthropogenic CO2 emission. Without current human emissions, the planet would have continued for millions of years before reaching below the 150ppm mark. During that time, "assisted" or natural evolution would likely produce plants adapted to low CO2. Assuming that the humans of the future would decide not to burn a few gigatons of coal occasionally . . . or chose not to use heat to decompose calcium carbonate rock.
Humans "on the edge of extinction" is alarmist hogwash.
- Skeptical Science New Research for Week #9, 2021
MA Rodger at 08:30 AM on 15 March, 2021Rob Honeycutt @29,
Let's assume he is ignorant and isn't just playing with his troll-head on.
SunBurst @27,
CO2 levels were momentarily (thus for a 100k years perhaps) approaching today's levels back 3 million years ago. This was a time when the Panama Isthmus had just formed between N & S America, an event that would make a big impact on global climate. The levels of CO2 we see today were have not been seen for 13 million years and prior to that on scales of 100s of millions of years, CO2 was multiple-times higher than today although estimates of how many multiples are not well defined.
But do bear in mind that the sun has been getting warmer with time. Roughly this equates to a forcing equal to a doubling of CO2 every 150 million years. So to balance a weaker sun back 450 million years ago, CO2 would have to be perhaps at 2,000ppm, 8-times higher than pre-industrial.
- Gillett et al. (2021) global warming attribution study
jamesh at 08:02 AM on 18 February, 2021Bob
My intent was to engage our audience in a discution of scientific facts.
The central issue is climate forcing by atmospheric CO2. The term was
used by Dr. Mann in his publication dated 01 April 19 Titled Global-scale
temperature patterns and climate forcing. I think it is fair to look at the
science behind climate forcing. My purpose in citing geologic history
was to illustrate a long period when CO2 in the atmosphere could not
have forced the sequesteration of carbon in the earths sedimentary
rocks. Inasmuch as the physical laws of nature haven't change I figured
scientists might agree that CO2 in the atmosphere could not possibly
force climate change. To confirm the foregoing alledge fact, anyone
can go online and with the aid of google, find that N2 is also a GHG
and that it is 300 times more effective than CO2. All of this does make
if one keeps in mind that at 400ppm CO2 is present in the atmosphere
that it weights in at o.o4 percent. N2 comes in at 80percent. If we go
to the driest place on earth, probably the Sahara, we are told that night
temps. are known to drop as much as 36deg F. The moderating effects
of H2 and CO2 are nowhere to be found. Also there was an opportunity
to run a GHG test on effecity of CO2 by running a series of tests, starting
with sundown and running to sunup. A series could have been run, but
it was not done. Again, I am not looking to engage any one person
specificately, I only want to discuss the scientific facts (as I see them)
- CO2 lags temperature
MA Rodger at 08:39 AM on 13 February, 2021brneilsen @629,
I'm curious as to the origin of your 'greenhouse gas response' equation T=3.2563ln(C)-3.0323. And if there were any merit in such an equation, I'd be interested to learn how it 'yields' a "0.95 degC" boost to global ice age temperatures resulting from a 190ppm to 280ppm rise in CO2. My abacus (which I would be the first to admit is not always reliable) 'yields' +1.26ºC using this bizarre equation.
The usual calculation of CO2 forcing is ΔF = 5.35 x ln(CO2[1]/CO2[0]) which gives a forcing of +2.07Wm^-2 and a thus 'direct' impact on global temperature of+0.56ºC which would cause climate feedbacks that would perhaps triple this value to +1.7ºC.
The global average temperature rise out of an ice age is usually reckoned at +5ºC to +6ºC so this calculated CO2 forcing would perhaps be responsible for a third of this temperature rise. And this result fits with assessments which find the contributions to deglaciation warming to be roughly 50% surface albedo, 37% GHGs (of which CO2 is the major player) and 13% atmospheric albedo. - CO2 lags temperature
brnielsen at 14:26 PM on 12 February, 2021This has been interetsing, and explains a lot about the confusion in the general public because of prior missives that CO2-Ice core data were proof of a causive link, when it was more likely a result. NASA covers this in the section on Milankovich theory, but fail to actually split the response from CO2, which is easy to do, since the greenhouse gas response is easily modelled with the equation T=3.2563ln(C)-3.0323, where T is the Earth's average temperature in degC and C is the CO2 concentration in ppm. From the ice cores, the change from 190 to 280ppm yields a contribution of 0.95 degC, so minor compared to the overall change of 7-8 degrees.
- CO2 measurements are suspect
MA Rodger at 06:52 AM on 4 December, 2020Ken the Bear @94,
I don't think the drop in emissions from Covid will be anyway near enough to register a change that will be noticed in the Keeling Curve.
Recent annual CO2 increases measured at MLO as measured by ESRL run 2010-19 +2.32ppm, +1.91ppm, +2.61ppm, +2.01ppm, +2.20ppm, +2.95ppm, +3.01ppm, +1.90ppm, +2.86ppm, +2.46ppm. Those numbers have a 90% range of +/-0.8ppm. It seems most folk are still awaiting better understanding of the effect of Covid on emissions before making an assessment on the matter but one estimate of the drop in rising CO2 levels due to Covid has been given as between 0.08ppm & 0.23ppm. So not enough to make a noticeable dent.
- Human Fingerprints on Climate Change Rule Out Natural Cycles
MA Rodger at 02:21 AM on 19 November, 2020Wol @1,
The 'many thousands' of ppm CO2 in the distant past do make for a pretty powerful message. Of course, as you say, it is not inconsistent with the same science that says AGW will be a problem at 'several hundred' ppm CO2. The IPCC scenario RCP6.0 is so-named because by 2100AD it will have provided a climate forcing of 6W/m^2.
And while the CO2 levels were indeed up at perhaps 2000ppm 200My ago and perhaps even 6000ppm 500My ago, the sun was weaker back then and the CO2 effect is logarithmic, so the resulting climate forcing those hundreds-of-millions of years ago was less than the forcing we are set to deliver over the next 100 years. (The SkS post 'Do high levels of CO2 in the past contradict the warming effect of CO2' presents this graphically.)
And the SkS post doesn't account for the changing geography of the planet which is alos a big factor. CO2 hasn't been anything like todays' level for 3 million years, back when N & S America were yet to join together. And to find CO2 higher than today, it is 13 million years ago when the Himalayas were still being formed.
The denialist will push simple stuff (like CO2 was once thousands of ppm) but they tend not to be well versed in the full story - because if they were, they wouldn't be deniers.
- Interactive: What is the climate impact of eating meat and dairy?
MA Rodger at 15:31 PM on 5 October, 2020nigelj @10,
While Slarty Bartfast has not fully set out what he is saying, he is apparently still signed up to the description he set out on the 'breathing contribution' thread @152 & 155. On the strength of your comment @10, Slarty Bartfast @11 tries to also sign you up to it, saying your comment @10 is "exactly what I am arguing."
If you examine what is set out on that other thread, Slarty Bartfash appears to be saying that the CO2 emissions from a reservoir of carbon within the carbon cycle will be fixed by the nature of that reservoir. The reservoirs are listed as Soils, Plants, Animals, Atmosphere, Ocean and from the Soils a reservoir of 1,500Gt(C) is emitted 60Gt(C) of CO2 annually, 4% of its volume. From Animals the ratio of emissions-to-reservoir had been calculated as 800% (calculated @152 in that thread). As the reservoir of Animal carbon has increased with burgeoning human population and livestock herds, the Animal reservoir is considered increased, with its increased emissions balanced by an identical reduction in the Soils emissions. To achieve this Soils emissions reduction, which is fixed at 4% of reservoir, the Soils reservoir must shrink by 63Gt(C) while the increase in the Animal reservoir with its emissions 800% of reservoir will only increase by 0.3Gt(C).
"There is only one other place that most of the remaining 62.7 GtC can go: the atmosphere." This then is the origin of Slarty Bartfast's 30ppm atmospheric CO2 increase. I would hazard a guess that is not something you would feel entirely happy signing up to.
- Breathing contributes to CO2 buildup
CD at 08:35 AM on 12 September, 2020Slight correction to comment @152
I forgot to include the farm livestock in some of the numbers in my previous comment (@152). So the penultimate paragraph of that comment should read as follows:
The carbon pumping efficiency of the soil is only 4%. The soil contains over 1500 GtC but emits 60 GtC per annum. Humans store only 0.1 GtC but emit 0.8GtC per annum. That is an efficiency of 800%. It also means that the increase in CO2 production from humans and livestock (2.4 GtC per annum) is the same as that produced by about 4% of the Earth’s soil. That means that the total volume of soil must reduce by 4% over time as the volume of carbon entering the soil decreases and its pumping capacity is replaced by animals, if the ecosystem is to return to equilibrium. So 63 GtC will be lost from the soil while only 0.3 GtC will be transferred to the animal reservoir and none to plants. There is only one other place that most of the remaining 62.7 GtC can go: the atmosphere. This 62.7 GtC will increase the atmospheric CO2 concentration by about 30ppm.
- 2020 SkS Weekly Climate Change & Global Warming News Roundup #35
MA Rodger at 19:43 PM on 7 September, 2020gseattle @22,
While I have no idea what the 'X' stands for, there is no doubt that Edwin X Berry is a real person. It is more "ominous" that he chooses to post his grand paper on principia-scientific.com as that shows a serious lack of judgement. Those PSI guys are serious nutcases who are actually of the opinion that AGW cannot be real because the theory breaks the Second Law of Thermodynmics (which in their version apparently says that a photon cannot travel from a cold place to a hot place, which would presumably make observing distant snow-topped mountains another impossibility).
You appear to be asking for an explanation of why the detail of Berry's grand paper is so-much garbage (rather than why his conclusions cannot be correct).
If you examine his grand model, it says no more than that the atmosphere is like a lake - the level of the water will go up if the input is greater than the output and visa versa (which is of course logical). And the output will be in some way dependent on the level - the higher the level, the more water will pour out of the outflows. He then creates a very simple mathematical interpretation of this situation which has little logic or physical basis.
His model shows that with constant input, the CO2 level will tend to an equilibrium level logarithmically. Berry fails to consider that such a finding is entirely without basis for CO2 in the atmosphere as the outflows are pouring into volumes with their own constraints and are not free to accept ever-increasing quantities of CO2. Rather, the logarithmic relationship holds roughly for changes in volume, not changes of rate of volume.
Yet the big error in his reasoning is to use his fancy model before trying to compare it with the real world situation. He uses it to conclude that the rate outflow which defines the level in his model can be aportioned and thus the level likewise. Thus, if 95% of the outflow is natural, then his model shows that 95% of the level must also be natural. The crazy logic this presents wold mean that in 1750 the influx of CO2 from ocean & biosphere would have been only 150Gt(C)/yr as this would support the pre-industrial CO2 level of 280ppm and since that time this natural influx would have risen 40% to reach today's 210Gt(C) which is required to support 390ppm in the atmosphere which is what Berry tells us is the natural component of atmosperic CO2.
There is zero evidence for such a 40% natural rise in CO2 emission and no reason given for this natural rise occurring after ten millenia of flat CO2 levels, to magically appear in recent decades at just the time and the same rate as the anthropogenic input.
Berry however, makes no attempt to check his model against reality. Instead he launches into a misrepresentation of actual modelling of atmospheric CO2 with an analysis with isotope data (which I have not examined but assume it is as crazy as the foregoing analyses).
I hope this explanation of Berry's crazy theorising will suffice.
- 2020 SkS Weekly Climate Change & Global Warming News Roundup #35
MA Rodger at 22:36 PM on 5 September, 2020gseattle @13,
You are quoting the fake scientific paper of a climate change denier to misrepresent the IPCC. The denier and the IPCC do not reach any significant 'agreement'. Indeed, the denier shows this. You do not.
You quote the first sentence of the abstract yet the second sentence is entirely wrong. Barry (2019) Human CO2 Emissions Have Little Effect on Atmospheric CO2 which begins its abstract saying:-
"The United Nations Intergovernmental Panel on Climate Change (IPCC) agrees human CO2 is only 5 percent and natural CO2 is 95 percent of the CO2 inflow into the atmosphere. The ratio of human to natural CO2 in the atmosphere must equal the ratio of the inflows. Yet IPCC claims human CO2 has caused all the rise in atmospheric CO2 above 280 ppm, which is now 130 ppm or 32 percent of today's atmospheric CO2." [My bold]
The IPCC would give the size of the natural 'inflows' of CO2 into the atmosphere over a year as being roughly 210Gt(C). And the IPCC would give the 'inflows' of anthropogenic CO2 today as being roughly 10Gt(C). So the ratio between these two numbers is roughly 5%. Yet it is not a very informative value. And do note that the second sentence in that abstract is flat wrong.
210Gt(C) would raise atmospheric CO2 by roughly 100ppm. With the annual CO2 cycle in the atmosphere showing a peak-to-peak value of just 5ppm, it is obvious that there are 'outflows' operating to balance these natural 'inflows'. And year-to-year, with the variation in the pre-industrial CO2 level pretty-much flat, it is evident that the natural inflows & outflows balance almost perfectly.

Through the industrial period, the rising CO2 levels is entirely due to anthropogenic emissions. And the rising CO2 has also increased the natural 'outflows' so that today about 55% of anthropogenic emissions are diverted out of the atmosphere by natural processes. This includes 'outflows' into the ocean which are evident by increasing ocean acidity. Thus it is not 100% of the CO2 rise that is man-made but 220%.
;;;
You balk at the spreadsheet data presented by the Global Carbon Project (linked @12) and instead present a tertiary reference to another spreadsheet which is almost ten years out-of-date (so add about 300Gt(CO2) to the values given for today's values) and now provides broken links to its data sources. The 1,374Gt(CO2) value for FF 1850-2011 concurs with the GCP value which gives 1,364Gt(CO2). The 1,832Gt(CO2) value "to end of 2010" is not so obvious but presumably includes LUC emissions. (Note, unlike pre-1850 FF emissions, pre-1850 LUC emissions are significant if included.)
- 2020 SkS Weekly Climate Change & Global Warming News Roundup #35
MA Rodger at 19:27 PM on 4 September, 2020Gseattle @8 & @10,
You venture into consideration of atmospheric CO2, a subject area in which you evidently have very little understanding. I would add that levels of atmospheric CO2 are not directly a factor in the rate of species extinctions.
The pre-industrial atmosphere contained some 280ppm CO2. The increase from 280ppm to today's 412ppm (this a current annual global average) is almost wholly directly due to human emissions. The rate of increase in CO2 has been accelerating through the industrial period and is now running at +2.5ppm/year.
I don't recognise the numbers you present for (what I assume you consider to be) accumulative anthropogenic CO2 emissions in that @10 you talk of 1,370Gt and this being in some way equivalent to 177ppm.
The Global Carbon Project assess anthropogenic emissions from Fossil Fuels since 1750 as 441Gt(C) = 1,617Gt(CO2). If such a quantity of CO2 were added to the atmosphere it would increase atmospheric concentrations by 207ppm.
Additional to FF emissions are the anthropogenic emissions from Land Use Change. The Global Carbon Project assess these LUC emissions back to 1850 and thus arrive at a total for anthropogenic CO2 emissions (FF + LUC) of 645Gt(C) = 2,361Gt(CO2), a quantity which would increase atmospheric levels 303ppm if added to the atmosphere.
Global Carbon Project assess the level of CO2 in the atmosphere resulting from human activities through the industrial period amounts to 277Gt(C) = 1,106Gt(CO2) and which would (and indeed does) increase CO2 levels by 130ppm. The ocean & land sinks that have drawn CO2 from the atmosphere through the industrial period are show to account for the difference between the all-emissions 303ppm & the emissions-plus-sinks 130ppm.
None of this atmospheric CO2 business is in any way controversial outside the febrile and ridiculous reasonings of climate chage deniers. As the RealClimate item you reference @8 proclaims:-
"The basic facts about the global increase of CO2 in our atmosphere are clear and established beyond reasonable doubt."
For reasons that cannot be explained by me, you chose to ignore this message and instead choose to quote from a piece of climate denial being debunked by the RealClimate item.
- Spreading rock dust on fields could remove vast amounts of CO2 from air
Eclectic at 10:16 AM on 14 August, 2020Quite right, Daveburton. Producing/distributing rock dust sounds a very inefficient method of reducing the CO2 problem, at least with present technology.
Perhaps by 2100 the technology of renewable energy will be advanced enough to do it properly ~ but I'm figuring by then it would just be a part of a larger purpose of agricultural soil development. Even so, it would be only one component of the overall effort to get CO2 down to a sensible 350ppm.
- We've been having the wrong debate about nuclear energy
nigelj at 08:01 AM on 7 August, 2020Michael sweet @14
"You are not familiar with scientific discussion. In a scientific discussion I say "this paper supports my position". Then you say "this paper supports my position".
Please don't be ridiculous. Yes its good to quote papers when appropriate, but It's possible to have a scientific discussion without having to mention papers. It happens all the time all over the place and by highly qualified people. Realclimate.org a highly reputable leading edge climate website and they dont demand that people posting comments have to quote scientific papers. It would just shut down discussion. People dont always have the time and relevant papers might not exist.
That said, I post references to peer reviewed papers quite often, with respect to this websites rules, and because it is good to back up claims with a source, but its absurd to have to constantly quote scientific papers all the time. I notice you never demand it when people make claims about the benefits of renewables or expound on the dangers of climate change. You appear to apply double standards.
You have also utterly ignored what I said. Sometimes there are valid criticisms of a scientific issue and no relevant published research to quote in support.
"In this discussion I have provided a paper that supports my position, Abbott 2012. You say you do not like that paper and we should all agree with you. You have provided no reason why we should all agree with you."
I did not say that.
"You must support your claims with at least white papers from industry. "
I provided a white paper above at comment 12 being a lengthy criticism of Jacobsons work. I provided a published study on renewable energy. I provided entirely credible material on why nuclear projects are being built. So why do you go on misrepresenting me?
Regarding Abbot, there is no need to provide studies on the known scale of earths mineral resources, this is common knowledge easily googled. Do I need to provide studies that the moon goes around the earth?
"Your unsupported opinion as a person who claims no training or professional experience in the field"
Where do you get that from? I have never claimed that. I have said several times on this website I did physical geography at university, which covers the introductory basics of weather and climate. I also have a design degree in architecture and I may have mentioned that here, cant remember. I also did psychology and some basic maths and chemistry at university. Not that any of this makes me right or wrong about anything, but since you raised the issue I have to correct your error.
"Bringing in information that you pick up in unmoderated forums on the web also does not advance the discussion."
This is not a valid argument. Its illogical, and pretty much an ad hominem. Whether a forum is moderated or not clearly does not make information either right or wrong.
And you are wrong to claim Realclimate.org is not a moderated forum. It has a moderation policy, and comments get deleted, or sometimes thrown into the junk file.
"Clack 2016 does not rebut Jacobson 2018."
Whatever. Who cares. Maybe its because hes tired of arguing with Jacobson. Maybe he's got better things to do.
"If you cannot find published critism of someones work then you must look harder for support for your wild claims. "
Ridiculous statement.
"Since you have no training or experience in any power systems, and you refuse to read the published literature on the topic, why should I care what you think?"
I have read some of this material. I have told you that already. I'm trying to find the time to read more.
"If you want to speculate on these topics many non-scientific boards, like the unmoderated thread at RealClimate, exist."
All threads at RC are moderated as per previous comments. More lightly than here but they are still moderated.
"The moderators want to encourage discussion of nuclear power so they have allowed nuclear proponents to make many wild, unsupported claims. I respond to these claims. Since you make many unsupported, uninformed claims I respond so that casual readers do not think that your arguments have merit."
People make wild unsupported claims about renewables and other matters on this website. I never here you complain about that. You apply double standards.
"I linked the incorrect Jacobson paper on materials for renewable energy. It is actually Jacobson 2011. He shows that all materials for a renewable energy system exist. Please provide data to support your deliberately false claim that not enough materials exist for a renewable system."
I have never disputed this so why do you keep implying otherwise.? My point was whether they would last for a thousand years. As far as I can recall Jacobson never considered this. Its a discussion we should be having.
"Your point that renewable energy projects use more tons of concrete and steel than nuclear power plants was popular with nuclear supporters in 2005 (I remember when they first used this argument). Since Jacobson 2011 was published, all informed people know that it is a false argument. You show your lack of preparation when you cite an argument that is 10 years out of date."
I never said that. I said renewables look like they use a larger volume of all materials in total, so concrete, steel, copper, fibreglass etcetera combined.
"By contrast, Abbott 2012 described the lack of rare materials used in the constructions of nuclear plants (especially uranium and "unobtainium"). ..... All known uranium reserves will only produce 5 years of power for the world. "
I assume you mean land based reserves. Uranium is abundant in sea water, with billions of tons enough to power the world for many centuries assuming we can extract it. Table of quantities here. Uranium has been experimentally extracted from sea water here. Even if the costs are high they would inherently form a very small proportion of the costs of running a nuclear power plant. Abbot looks like it might be out of date in respect of this.
"Renewable systems use little of the rare elements,"
That is just a huge understatement, and ignores other materials in relatively limited supply like copper and aluminium ( bauxite reserves could all be gone in a century or two) required for generators and a vast network of new trasmission lines to enable power to be shared regionally.
I was not going to respond to you, but I dont like it when people missrepresent my position hence the response.
Moderator. I have a history here of quoting studies, more so than other people. Indisputably so. I will make the effort to quote more papers bearing in mind there are only so many hours in the day.
However I'm getting really tired of the way M Sweet repeatedly and blatantly 1) puts words in my mouth (hes done it to others as well) and 2) missrepresents my position and 3) misrepresents by background and 4) intellectually bullies people he doesnt agree with, and 5)falsely accuses me of making things up. And the way you let him get away with it.
- Skeptical Science New Research for Week #31, 2020
MA Rodger at 23:12 PM on 6 August, 2020prove we are smart @1,
Congratulations.
You have spotted a soil scientist who is in denial with regard to the causes of AGW. I suppose soil scientists are not a million miles from geologists who often are found on record misrepresenting AGW. At 1:11:20 in the video you link-to we hear:-
"0.04% of the atmosphere is carbon dioxide. Do you really think that's changing global climate? [Murmurs heard from the audience including 'yes'] Really? There is absolutely no science behind that at all to show. Yes, it [CO2] is a GHG and so is N2O and so is CH4 and so is water vapour. Those molecues all have the potential for what we call radiative forcing. But when it's 0.04% of the atmosphere it contributes very very little to global climate."
The slides had previously shown this slide:-
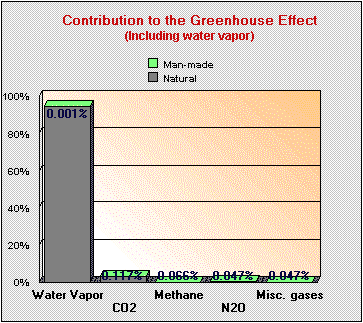
This graphic is the work of Fred Singer, a well-known aged denialist who died earlier this year. It originates from this denialist webpage and is saying that the human impact on the GH-effect is no more than 0.28% but gives zero references to support such a crazy assertion.
The webpage tries to make the case for CO2 having increased from 288ppm pre-industrial to 368ppm (which dates the webpage to perhaps 20 years ago as today CO2 is at 410ppm) , an increase of (364-288=) 80ppm but with the bold assertion that only 12ppm of this increase is due to mankind. So from all this we should not be surprised by any denialist outrage.
The pre-industrial GH-effect boosts average global temperature by something like 33ºC. About three-quarters of this is due to water vapour and clouds and 20% due to CO2. But without the CO2 and other long-lived GHGs, the levels of water in the atmosphere would soon crash (it would take a couple of decades) leaving a snowball (or more accurately 'iceball' earth.
The speaker in the video does make a stab at a man-made cause of AGW. A graphic @1:11:20 in the video shows two paths to 'temperature warming' - CO2 emissions from soil degradation and H2O emissions from warmer soils. But the speaker insists it is the H2O that is the dominant warming agent:-
1:03:13
"And when we lose carbon, we lose moisture because that's what gives us our moisture holding capacity. All this moisture, extra moisture, is evaporating and going up into the atmosphere. And it's increasing the temperature, hugely.
"This is, to my mind anyway, the chief cause of the climate instability that we have at the moment. Because what happens is if you heat something it evaporates, like you put a saucepan of water on the stove and heat it up, it evaporates.
"So these soils get a lot hotter than these covered soils and we now have huge amounts of water vapour up in the atmosphere that weren't there a couple of hundred years ago. We have to look at the whole system..."
It would be good if the "whole system" were considered as we would be saved having to listen to the likes of the dysfunctonal account of AGW in this video.
- 2020 SkS Weekly Climate Change & Global Warming Digest #30
wayne19608 at 02:11 AM on 30 July, 2020Sailrick, I kind of agree with you. It's more a ruling out of low end then high end states. Personally I will place more importance on the paleontological evidence. If we're 1C+/- now
+ 0.2C for the pre-preindustrial warming
+ 0.5C for aerosols
plus you have a 30year/66% lag meaning the temperatures were experiencing now are more indicative of 350ppm than 420ppm. So I see your point on how a +40% increase in CO2 has in all probability commited us to +2C rise in 150yrs. This doesn't address what the end state will be in 1000yrs or more. Now instead of a 40% increase imagine an actual doubling its obvious that a 2C warming shouldn't even be in the equation
- Hansen's 1988 prediction was wrong
MA Rodger at 01:25 AM on 3 July, 2020Nylo @56,
I'm with you part the way on your first point. (And your second point, the comparison with Scenario C; that seems a step too far.)
On the first part of the first point, the value given for Scenario B CO2 increase post-2010 in Hansen et al (1988) (PDF p21) is 1.9ppm/y, the MLO-measured CO2 ran at 2.4ppm/y and that does translate into being 26% above Scenatio B.
From here, I initially assumed you are looking at Fig b1 which gives a value for CO2 at 1.2 and a combined value for CFCs & CH4 of 0.46 or 38% of the value given for CO2, or 2.6x the given CO2 value. So, firstly, I am not sure where you get the "4 times the sum" and , secondly, I'm not sure why you woud be taking numbers from Fig b1. Indeed, I'm not exactly sure what Fig b1 is meant to be demonstrating. The values are described as "arbitrary" but, in the case of CO2 give a value of non-feedback warming for a doubling of CO2 (315ppm→630ppm). The CFC11&12 is for 0→2ppb each and the CH4 also for doubling although there are complications with such a stand-alone value for CH4.
I think you should be examining Fig b2 which provides the values for the decadal increments of forcing - for the 1980s CO2 0.08, CH4 0.03 & CFC11&12 0.2. Thus, back-of-fag-packet, the 2010s CO2-above-ScenarioB of +0.5ppm/y equates to a third of the 1980s annual increase or 0.027 of the 0.8 from figb2. If you venture to examine the NOAA AGGI numbers, you'll find CFC11&12 today remain at 1990 values and the CH4 increase post-2010 is a third the 1980s increase suggesting forcing below ScenarioB of -0.2 & -⅔ of 0.3 = -0.4. So by that reckoning, the additional 26% CO2 forcing would sit below the lost CFC & CH4 forcing, not "ABOVE".
Or a simpler analysis using just AGGI, the missing CO2 forcing 2010-on would be 20.6% of the additional CO2 forcing = +0.065Wm^-2, or perhaps double that for all three of the three post-1990 decades combined. The CH4/CFC11&12 forcing through the 1980s was +0.126Wm^-2 which would continue at or above that value for the following 3 decades in Scenario3, so totaling +0.378Wm^-2. But the actual forcing is given over this period 1990-2019 as +0.056Wm^-2 so relative to ScenarioB forcing that is -0.322Wm^-2 from CH4/CFC11&12 and with the extra CO2 forcing included yielding (-0.322 + 2x0.065 = ) -0.192Wm^-2. It works out again with less forcing, not "ABOVE".
- 2020 SkS Weekly Climate Change & Global Warming News Roundup #19
MA Rodger at 18:44 PM on 12 May, 2020William @5,
Regarding the effect of a Covid-19-induced reduction in CO2 emissions & the impact on atmospheric CO2, there is a CarbonBrief article by an impressive list of guest authors on this very subject. They suggest that atmospheric CO2 (as measured at MLO) would have shown a BAU increase of 2.80ppm (± 0.57) but, with the reduction in global CO2 emissions due to the Covid-19 crisis, estimate at 8% for the year with the implied atmospheric CO2 increase being 0.32ppm less or 11% smaller.
As a rule of thumb, we need to reduce CO2 emissions by roughly 50% to put a halt to increasing atmospheric CO2 (and this a temporary halt without continued cuts in emissions). However, under BAU we are still seeing small increases in CO2 emissions (Global Carbon Project numbers averaging 1% increase per year in recent years, down from 3% a decade ago but still an increase.)
- CO2 increase is natural, not human-caused
MA Rodger at 06:35 AM on 29 March, 2020mkrichew @30,
I would say it is a bit lax to substitute 18 for 19 within the OP but given the situation the OP describes, it makes zero difference to the argument presented. The "19 billion tons" figure in the OP is described as "roughly" the ΔCatm required to give a +2.4ppm(v) increase which is given as the rate of CO2 increase "recently."
We could be more precise and say that a +2.4ppm increase would require ΔCatm = 18.7 Gt(CO2), but given the wobbles caused by ENSO to the annual increase in atmospheric CO2, it is impossible to be that precise about it. The OP was written in 2012 and the source of the MLO CO2 data cited ESRL give a value for the 2012 annual MLO CO2 increase as +2.61ppm = 20.4Gt(CO2) although if the average of the 12-month increases through 2012 is used to calculate a value the result is +2.20ppm. Or if the ESRL Global data is used instead of MLO data, ΔCatm for 2012 is given by ESRL as +2.39ppm while tha average of the months yields +2.00ppm =15.6Gt(CO2). Or an alternative source of the value would be the Global Carbon Project's 2012 ΔCatm of 5.07Gt(C) = 18.6Gt(CO2) (altough note the 2012 LOC emissions are a long way from zero which is the assumption made in the the OP).
- What does Net Zero emissions actually mean?
MA Rodger at 08:24 AM on 20 March, 2020meb58 @15,
In terms of their contribution to the biosphere, I think the C3/C4 thing is a bit more complex than just CO2 levels. The Wikithing page does a pretty good job describing much of it, and complete with references.
C4 plants have a competitive advantage over plants possessing the more common C3 carbon fixation pathway under conditions of drought, high temperatures, and nitrogen or CO2 limitation. When grown in the same environment, at 30 °C, C3 grasses lose approximately 833 molecules of water per CO2 molecule that is fixed, whereas C4 grasses lose only 277. This increased water use efficiency of C4 grasses means that soil moisture is conserved, allowing them to grow for longer in arid environments.
C4 plants arose around 35 million years ago during the Oligocene (precisely when is difficult to determine) and did not become ecologically significant until around 6 to 7 million years ago, in the Miocene. C4 metabolism in grasses originated when their habitat migrated from the shady forest undercanopy to more open environments, where the high sunlight gave it an advantage over the C3 pathway. Drought was not necessary for its innovation; rather, the increased resistance to water stress was a byproduct of the pathway and allowed C4 plants to more readily colonize arid environments
Today, C4 plants represent about 5% of Earth's plant biomass and 3% of its known plant species. Despite this scarcity, they account for about 23% of terrestrial carbon fixation. Increasing the proportion of C4 plants on earth could assist biosequestration of CO2 and represent an important climate change avoidance strategy.
Of course with C4 plants becoming "ecologically significant " sometime between 35My bp and 6-7My bp, this was also a time of falling CO2 levels with (probably roughly 13My bp) CO2 levels seen dropping below 400ppm(v), until modern times.
- Skeptical Science New Research for Week #9, 2020
swampfoxh at 07:42 AM on 6 March, 2020Can anyone refer me to the source of the idea that it takes thousands of years for the planet to reach equilibrium from the relatively modest rising "rate" of greenhouse gas levels and that the planet is still warming from the effects of 260ppm about 1,500 years ago? (not in just a few decades). I have been told that a study by Goreau in 1990 and another by Rohling in 2009 addresses this "stretched" delayed effect?
- There is no consensus
Daniel Bailey at 10:52 AM on 29 January, 2020"NASA graph from 1975 to 2018 is interesting and quite telling but it omits the math showingvhow much heat the increase of 120ppm of CO2 adds to the atmosphere.
Has anyone here been able to complete this math?"
roseland67, scientists have quantified the warming caused by human activities since preindustrial times and compared that to natural temperature forcings.
Changes in the sun's output falling on the Earth from 1750-2011 are about 0.05 Watts/meter squared.
By comparison, human activities from 1750-2011 warm the Earth by about 2.83 Watts/meter squared (AR5, WG1, Chapter 8, section 8.3.2, p. 676).
What this means is that the warming driven by the GHGs coming from the human burning of fossil fuels since 1750 is over 50 times greater than the slight extra warming coming from the Sun itself over that same time interval.
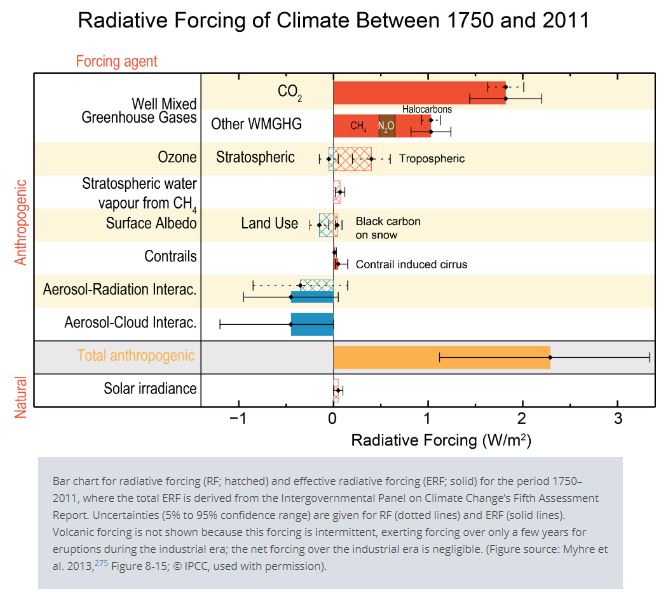
More than 100 comments found. Only the most recent 100 have been displayed.
More than 100 comments found. Only the most recent 100 have been displayed.






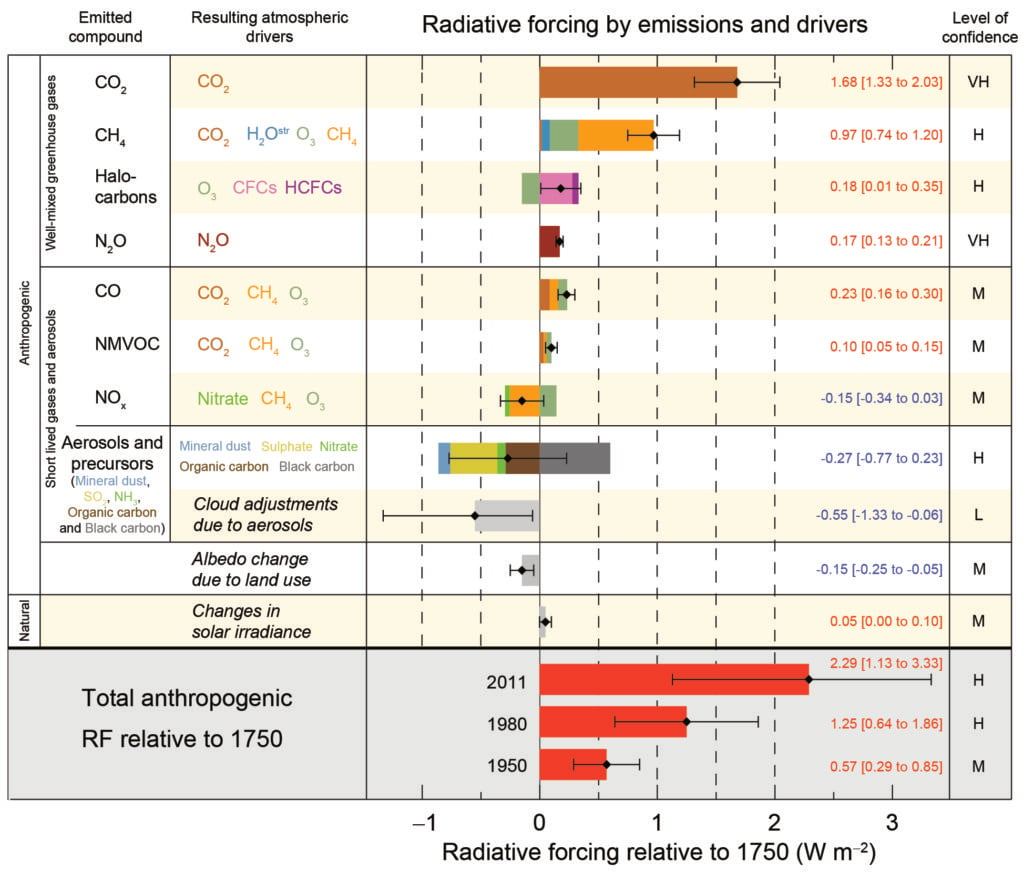
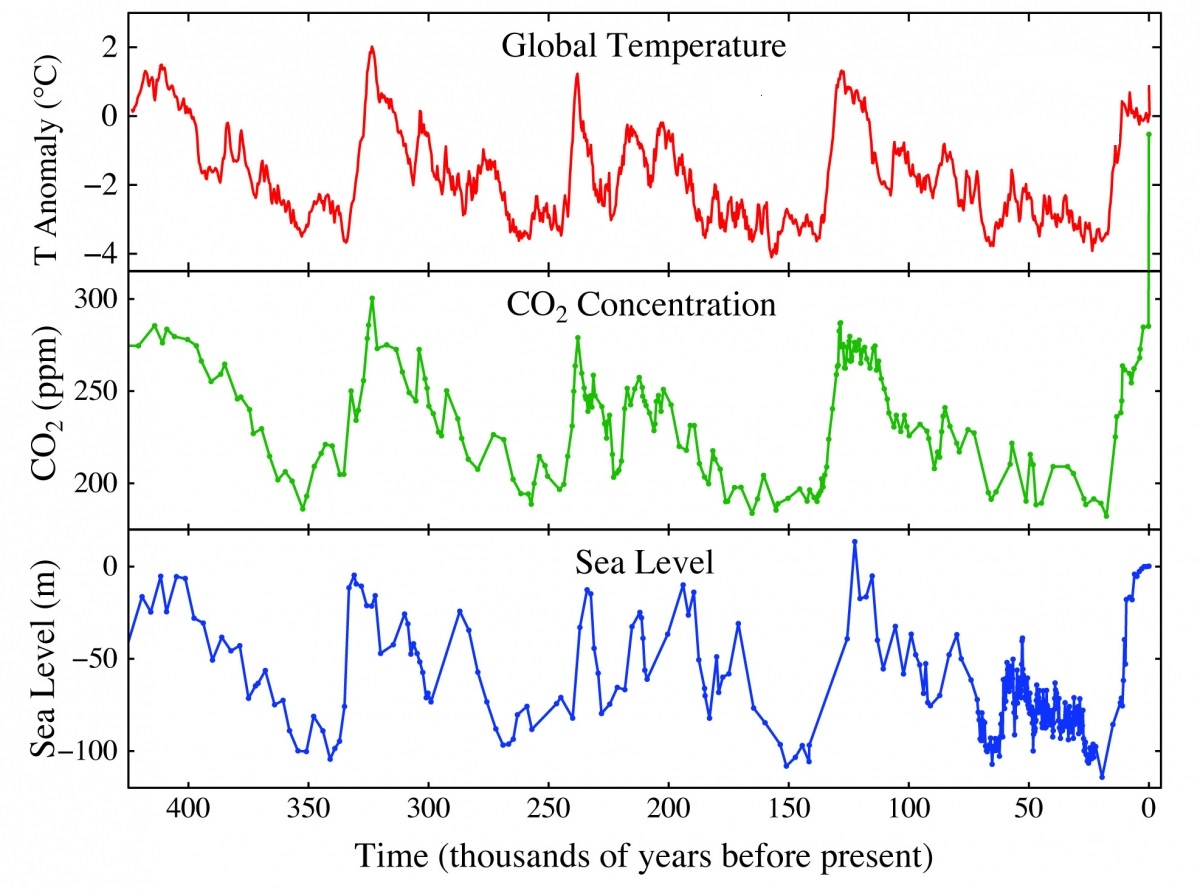
THE ESCALATOR
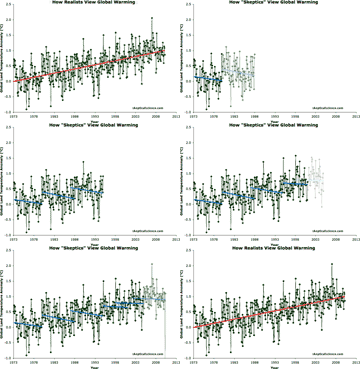
(free to republish)