


 Arguments
Software
Resources
Comments
The Consensus Project
Translations
About
Support
Arguments
Software
Resources
Comments
The Consensus Project
Translations
About
Support
![]()
![]()
![]()
![]()
![]()
![]()
![]()
![]()
![]()
![]()


![]()


Latest Posts
- Skeptical Science New Research for Week #27 2026
- Climate Adam - Is Climate Change Ramping Up El Niño Risks?
- Fact brief - Are injuries from wind turbines common?
- How bad is AI for the environment?
- 2026 SkS Weekly Climate Change & Global Warming News Roundup #26
- Skeptical Science New Research for Week #26 2026
- What Americans can learn from London’s war on cars
- New Publication: Identifying Flawed Reasoning in Contrarian Claims about Climate Change
- The Merchants of Doubt are coming for Extreme Event Attribution science
- 2026 SkS Weekly Climate Change & Global Warming News Roundup #25
- Cooking up the Climate Stripes, with Ed Hawkins
- Skeptical Science New Research for Week #25 2026
- How ‘balcony solar’ could help fight rising utility costs
- Fact brief - Does solar energy need subsidies to compete with fossil fuels?
- Plateauing CO2 emissions have slowed atmospheric growth
- 2026 SkS Weekly Climate Change & Global Warming News Roundup #24
- Skeptical Science New Research for Week #24 2026
- June update: Help still needed to get translations prepared for our website relaunch!
- How many people does heat actually kill?
- Check out the brand-new hurricane ‘cone of uncertainty’ graphics arriving this season
- 2026 SkS Weekly Climate Change & Global Warming News Roundup #23
- SkS Housekeeping: Updating the Comments Policy
- Skeptical Science New Research for Week #23 2026
- Nobody knows the future of energy
- Fact brief - Do electric vehicles almost always have a lower carbon footprint than gasoline-powered cars?
- Solar, wind, and EVs have knocked out a doomsday climate scenario
- 2026 SkS Weekly Climate Change & Global Warming News Roundup #22
- Skeptical Science New Research for Week #22 2026
- The next era of Atlantic hurricanes could be far more destructive
- On the death of RCP8.5
Comment Search Results
Search for 97%
Comments matching the search 97%:
- A look back at ‘An Inconvenient Truth,’ 20 years later
prove we are smart at 11:57 AM on 13 May, 2026I think we all feel increasing dread from our seemingly forever increasing atmospheric CO2 readings. Here is an interesting review from how the world did slow the increase in CO2 for a while- My microsoft "co-pilot" offered me these facts to the asked question..
" Are you interested in quantifying how much each event slowed the annual ppm increase (e.g., comparing Keeling Curve slopes before/after each event)?
Yes — and more importantly, it’s a scientifically meaningful thing to do, because it lets you separate narrative (“the pandemic slowed emissions”) from quantitative signal detection (“did the atmospheric growth rate actually change, and by how much?”).
Here’s the concise takeaway first:
Yes, you can quantify how much each event slowed the annual CO₂ growth rate by comparing the Keeling Curve slope before and after each event — but only a few events (e.g., the 1973 oil crisis, the collapse of the Soviet Union, the 2008 financial crisis, and COVID‑19) produce a detectable, statistically significant deviation, and even then the effect is small relative to natural variability.
Below is a structured way to think about it, plus what you’d likely find if you actually ran the numbers.
????️ 1. What “quantifying the slowdown” actually means
You’re essentially asking for:
Where slope = annual mean CO₂ increase (ppm/yr), typically computed using:
A 5‑year window before the event
A 5‑year window after the event
Deseasonalized Mauna Loa monthly data
A linear regression for each window
This isolates the trend rather than the short-term wiggles.
???? 2. What events are large enough to show up in the Keeling Curve?
Only events that cause multi‑gigaton, multi‑year changes in emissions can produce a detectable signal in atmospheric growth rate.
Events that might show up:
1973–74 oil crisis
1980–82 recession
1991 Soviet collapse
2008–09 global financial crisis
2020 COVID‑19 lockdowns
Events that won’t show up:
Individual policy changes
Single-year emission dips < 1 GtCO₂
Regional events (e.g., EU recession alone)
Anything shorter than ~6 months
The atmosphere integrates globally and has inertia.
???? 3. What the numbers typically show (based on published analyses)
These are approximate, but they’re consistent across NOAA, Scripps, and peer‑reviewed studies.
1973 oil crisis
Pre-event slope: ~1.3 ppm/yr
Post-event slope: ~1.1 ppm/yr
Δ slope ≈ –0.2 ppm/yr for ~2 years
1991 Soviet collapse
Pre-event slope: ~1.5 ppm/yr
Post-event slope: ~1.2 ppm/yr
Δ slope ≈ –0.3 ppm/yr for ~3 years
2008 financial crisis
Pre-event slope: ~2.1 ppm/yr
Post-event slope: ~1.8 ppm/yr
Δ slope ≈ –0.3 ppm/yr for ~1–2 years
2020 COVID‑19
Emissions dropped ~7% globally
But atmospheric growth rate dropped only ~0.2–0.3 ppm/yr
Δ slope ≈ –0.25 ppm/yr for ~1 year
Why the effect is always small
Because:
Atmospheric CO₂ growth is dominated by cumulative emissions, not annual changes.
Natural variability (ENSO) is ±1 ppm/yr, which is larger than most human-caused dips.
The ocean and biosphere buffer short-term changes.
This is why even COVID barely dented the curve. ( my add, so although longer lasting oil crises, regime and financial collapses and pandemic lock-downs will definitely/finally reduce the curve, should this be our future?)
???? The deeper pattern
Every slowdown corresponds to one of three categories:
Energy supply shocks (1973, 1979)
Global economic collapses (Great Depression, COVID‑19)
Large‑scale wars (WWI, WWII)
None were climate‑policy driven. The only sustained, policy‑driven flattening appears in some national emissions, not global totals."
To me, perhaps honestly for my mental health, I need to see some new/better? at least partly global fix-it talks. Ha, thoughtfully, the invites didn't include China,Russia,Usa and India-These countries were considered to be bad actors to genuine progress- call me naive but my ability to be a positive role model instead of the opposite has to be something- that link again and for what it's worth, the people attending said good things too.. www.carbonbrief.org/santa-marta-key-outcomes-from-first-summit-on-transitioning-away-from-fossil-fuels/
- Transition risk: The human cost of net zero
prove we are smart at 21:17 PM on 30 April, 2026Thanks Dr Dressler for posting that draft text for your chapter on Transition Risks. Wow!, its only been maybe 30yrs and counting since world-wide, climate scientists formed a 97% consensus about anthropogenic global warming. Wonder what happened with the denialists?
Now 2026 and it's still working: Change is coming but lets keep it slow, make it unequal and really, it's way too much trouble at this time-spead the green-washing and mis/dis information, militarise your police and increase surveillance. Oh, distraction,distraction..
Our biosphere is circling the drain while again, humanity has circled the moon. (The planet will keep going and my thoughts are humanity's golden age may still happen/ has happened- mood dependent.) 25yrs ago, I was too busy raising my kids and paying off a modest mortgage, now I'm retired and I know much more about the many different real costs of my 69 years.
We need this change but if it's not with people power and it may be the change you get, not the change you want.
- Human-caused climate change is unmistakably distinct from Earth’s natural climate variability
Just Dean at 06:51 AM on 24 April, 2026MA Rodger @ 10 — thank you for the careful and substantive engagement. A few clarifications and responses:
On the Judd data points and the plot window: the standard version of my diagram is zoomed to 100–700 ppm for visual clarity, which means the seven higher-CO₂ Cenozoic points aren’t shown. However, the York regression that gives S=8.24 K/doubling, R=0.97 is computed on all 22 Cenozoic stages (LowerAge ≤66 Ma) including those high-CO₂ points — they’re in the regression even when they’re outside the plot window. I’ve recently produced a full-range version (0–1400 ppm) that shows the complete Cenozoic extent including the Eocene hothouse points, and the fits extrapolate correctly to those higher points despite being derived primarily from the ice-age data. That’s actually one of the more remarkable features of the diagram: LINK
The discrepancy between my 8.24 and Judd’s published 7.7 K/doubling is that 7.7 is their full Phanerozoic value (485 Ma), while 8.24 is the Cenozoic-only (66 Ma) subset — both reported in their paper. I use the Cenozoic value because the Cenozoic is the most relevant period for today’s climate state.
Your point about the Judd vs Rae et al CO₂ reconstruction discrepancy at 50 Ma is well taken — that uncertainty propagates into any ESS estimate derived from deep-time data, including mine. On your suggested range of +5 to +9°C however, I’d note that the convergence of five independent fits between 8.24 and 9.91 K/doubling — across different archives, methods, and timescales — suggests the data favors the upper portion of that range rather than the lower end. The lower end would require the Rae et al CO₂ reconstruction to be correct and Judd to be systematically wrong, and would require all five fits to be biased upward — which is difficult to sustain when they converge from completely independent starting points.
Your post-net-zero CO₂ drawdown point is important and consistent with my framing. I describe the equilibrium curve as where the physics “ultimately points given enough time.” The natural drawdown means the system will tend back toward the curve at a CO₂ level determined by where emissions peak and how much natural drawdown occurs subsequently — not necessarily at the peak concentration itself. That’s precisely why the timing of net-zero matters — earlier net-zero means lower peak CO₂, lower eventual equilibrium, and a lower landing point on the curve.
Dean Rovang
justdean.substack.com - Human-caused climate change is unmistakably distinct from Earth’s natural climate variability
MA Rodger at 21:37 PM on 16 April, 2026Moderator Response @1,
The amateur analysis of 'global average' temperature linked @1 by rkcannon is entirely naive in its method and in its reporting of conclusions.
It concludes "...the notion that CO2 is the primary driver of global warming. If this were the case, periods with higher CO2 emissions would exhibit a faster rate of warming than periods with lower emissions," pointing to what the amateur calls his finding that "...long-term temperature rise was steeper in earlier periods when CO2 emissions were modest compared to current levels. These results hold despite changes in how time periods are defined ... and how weather stations are selected ... .")
The grand analysis supporting such a bold assertion looked at 100, 500 and then 992 selected weather stations (so all land sites), selected for the level of data available and then calculates the temperature trends for 42, 35, 30 & 21 year periods. The 100 station results presented show the temperature trends for the latest periods are by far the steepest in two centuries under analysis, 1815-2024. (42y +0.24ºC/decade, 35y +0.25ºC/dec, 30y +0.33ºC/dec, 21y +0.41ºC/dec) which of course entirely contradicts the conclusions presented in the analysis.
So that's worse than "amateur"!!
The other link @1 by rkcannon is to Marks-Peterson et al (2026) which is paywalled but an associated paper Shackleton et al (2026) 'Global ocean heat content over the past 3 million years' is not. These two papers drew coverage at RealClimate. Both papers examine very very old ice which provides data with less accurate age such that ice age cycles are fuzzed out.
The two papers are pointing to a more complex cooling 3My-0,5My bp. From the press release:-
"The implications of the results are that the cooling of the last 3 million years probably involves, in addition to the key role of heat-trapping greenhouse gases, important contributions from other components of the climate system such as Earth’s reflectivity, variations in vegetation and/or ice cover and ocean circulation."
Somehow there are crazy folk gleaning straws from the science to present misguided support for their crackpot version of reality. The account of Marks-Peterson et al (2026) nailed-up on the rogue planetoid Wattsuppia was headlined 'Shock New Evidence Showing No Link Between CO2 and Temperature Over Last Three Million Years Stumps Net Zero Activists' and such coverage prompted a few grownups to explain the true implications fo the two papers.
- Is Nuclear Energy the Answer?
One Planet Only Forever at 04:30 AM on 21 March, 2026PollutionMonster @471,
The end quote from the abstract of the peer reviewed article in your “nuclear energy decarboninzation.” link (the quote above the link), correctly indicates the need to maintain and improve safety, equity and environmental protection.
As indicated by the series of NPR articles I pointed to in my comments @ 460, 468 and 470 the US leadership-of-the-moment has likely reduced the safety, equity, and environmental protection related to nuclear power systems.
Your brief statement comparing safety of different energy systems ending with “...Nuclear killed zero people in contrast in 2025.” is an absurdly simplistic comparison of harms and risk of harm.
The IFP article (Institute for Progress) you linked to with the rather bizarre wording ‘Red tape nuclear power construction cost and time’ does not say what you seem to believe it says. Did you read the entire article? The opening statements of IFP article are misleading. You have to read quite far into the article to see important details that are not mentioned in the opening statements.
The opening statements are:
Nuclear plant construction is often characterized as exhibiting “negative learning.” That is, instead of getting better at building plants over time, we’re getting worse. Plants have gotten radically more expensive, even as technology has improved and we understand the underlying science better. [This statement is made in spite of the detailed content of the article explaining that many reasonable factors, including important updating of safety requirements, are the reason for the cost increase.]
Nuclear power currently makes up slightly less than 20% of the total electricity produced in the U.S., largely from plants built in the 1970s and 80s. People are often enthusiastic about nuclear power because of its potential to decarbonize electricity production, produce electricity extremely cheaply [that is a blatant misleading statement] and reduce the risk of grid disruption from weather events [this ignores the reality that designing and constructing nuclear power systems for the potential risks of weather events is part of the ‘high cost of nuclear power’, unless regulations do not require those concerns to be investigated and addressed]
But U.S. nuclear power has been hampered by steady and dramatic increases in plant construction costs, frequently over the life of a single project [later explained to be due to new understandings of safety problems that had not been identified and adequately addressed before construction of the system had begun].
…
Constructing cooling systems that can continue to operate in a damaged plant contributes heavily to nuclear construction costs.
Also buried later is the following: “Rising labor costs are the bulk of increased construction costs”.
Much further into the article is the following:
“One key indicator of regulatory standards, the number of Atomic Energy Commission (AEC) and Nuclear Regulatory Commission (NRC) “regulatory guides” stipulating acceptable design and construction practices for reactor systems and equipment, grew almost seven-fold, from 21 in 1971 to 143 in 1978. Professional engineering societies developed new nuclear standards at an even faster rate (often in anticipation of AEC and NRC). These led to more stringent (and costly) manufacturing, testing, and performance criteria for structural materials such as concrete and steel, and for basic components such as valves, pumps, and cables. [sounds like the original plans were inadequate and unsafe]
Requirements such as these had a profound effect on nuclear plants during the 1970s. Major structures were strengthened and pipe restraints added to absorb seismic shocks and other postulated “loads” identified in accident analyses. Barriers were installed and distances increased to prevent fires, flooding, and other “common-mode” accidents from incapacitating both primary and back-up groups of vital equipment. Similar measures were taken to shield equipment from high-speed missile fragments that might be loosed from rotating machinery or from the pressure and fluid effects of possible pipe ruptures. Instrumentation, control, and power systems were expanded to monitor more plant factors under a broadened range of operating situations and to improve the reliability of safety systems. Components deemed important to safety were “qualified” to perform under more demanding conditions, requiring more rigorous fabrication, testing, and documentation of their manufacturing history. [all this is justified ‘increased costs’ that raise valid questions about pushes to get cheaper ‘new nuclear now’]
Over the course of the 1970s, these changes approximately doubled the amounts of materials, equipment, and labor and tripled the design engineering effort required per unit of nuclear capacity, according to the Atomic Industrial Forum.”
… [still much later in the article]
Some regulatory increase wasn’t necessarily unreasonable. Early safety requirements for nuclear plants often overlooked critical risks. For instance, prior to the proposed power plant at Bodega Bay near the San Andreas fault, seismic activity had not been considered in the design of nuclear plants. Subsequent analysis revealed that the potential for severe seismic events was much more widespread than had previously been thought. Similarly, tornado design requirements weren’t created until an application to construct a plant in a high tornado area revealed that tornado risk was much more widespread than had been assumed. When accident risk was considered, it was often analyzed incorrectly. A reactor meltdown was thought to be an astonishingly unlikely accident, yet Three Mile Island experienced one after relatively few reactor-years of operation.
Regulations constantly change
In response to learning more about how nuclear reactors could fail, the NRC’s regulatory stance became a deterministic, defense-in-depth approach – the NRC imagined specific failure modes, and specific ways of preventing them, and then tried to layer several redundant systems atop each other to compensate for uncertainty. Whenever something new was learned about potential failure modes, the regulations were changed.
These changes applied not only to future plants, but often to plants under construction. In some cases existing work had to be removed, requiring intervention and oversight from design engineers, managers, field inspectors, and other expensive personnel. This became another major source of increased costs.
... [a little further along]
To minimize the likelihood of cost overrun, plants should be built using mature designs that don’t need to be changed during the construction process. In construction of the French reactor fleet, for instance, the CEO of the French utility company EDF noted that during plant construction “Whenever an engineer had an interesting or even genius [improvement] idea either in-house or at Framatome, we said: OK, put it on file, this will be for the next series, but right now, we change nothing.” [however, if an engineer raises a new safety related concern it should be rigorously evaluated and adequately addressed]
By building multiple reactors using an unchanging design, the benefits of learning-by-doing can be unlocked. In the French reactor fleet, though costs increased whenever a new reactor type was introduced, later plants using a given reactor design tended to be cheaper than earlier plants. Similarly, the 4th unit built at the UAE’s Barakah plant was 50% cheaper than the 1st unit.
…
However, it’s not impossible to deliver nuclear plants in reasonable amounts of time for a reasonable budget. We have a playbook for improving this process. By using mature plant designs that can be built repeatedly, learning-by-doing gains can be achieved, making each plant built cheaper than the last. By developing and maintaining a robust nuclear supply chain with the necessary expertise and experience, we can ensure we don’t lose the ability to deliver plants in the future. By stabilizing regulations, making them clear, and making changes to them predictable, we can prevent cost overruns associated with expensive and time-consuming on-site rework.
But we should be realistic about what this playbook might achieve. Public concern about nuclear accidents likely makes any significant reduction in plant safety requirements untenable. Experience with the Navy’s nuclear program suggests that even by following the above playbook, building a nuclear plant to the level of safety required is a fundamentally expensive undertaking. Truly moving the needle on nuclear power might require a ground-up rethinking of how we build plants, towards things like small modular reactors or nuclear plants built in shipyards in large numbers and floated into position along the coast.
Note that the key understanding to avoid cost increases regarding nuclear power plants is having a ‘mature design’. That means having thorough updating to be confident of safety systems and environmental protection. That means ‘lots of time required before embarking on the building of a new nuclear system and the understanding that any newly identified safety concerns need to be properly evaluated and addressed even if that delays or increases the cost of construction or requires a shut-down of operations if the safety concern is discovered after the item is in operation.
Also note that a modular nuclear system design would need to be adequately safe in all possible worst conditions of all possible installation locations.
The prerequisites for success of small modular reactors is acceptance of the reality that they will be higher cost, potentially higher cost per unit of generated and delivered electricity than renewables with battery back-up. That revises the question for discussion to be “Why is effort being wasted on the promotion and development of more expensive electricity generating alternatives?”
And the lack of transparency by the Trump administration suggests that reduced safety, increased harmfulness and increased risk of harm, is being secretly pursued because it will reward the people who made bad bets on ‘developing small modular reactors’.
Things will indeed be quicker and cheaper if the harmfulness or the risk of harm is allowed to be increased. But that only proves the unacceptability of allowing potential benefits for a few people to justify increased harm or risk of harm to Others. This would only be OK if the only people negatively affected by the reduced safety would be the people who profit from the less safe item.
- Is Nuclear Energy the Answer?
PollutionMonster at 15:21 PM on 17 March, 2026Sorry broken link for first link, no way to edit.
- Is Nuclear Energy the Answer?
PollutionMonster at 15:19 PM on 17 March, 2026My last link in 469 was an editorial. I have done some more research. I think nuclear versus renewable has taken too much of the front stage. We should focus on decaboninzation.
"Overall, the findings support the role of nuclear energy in achieving global decarbonization targets, provided that safety, equity, and environmental responsibility are upheld."
nuclear energy decarboninzation.
This is a peer reviewed article from 2025 that explicity says nuclear can helpo us meet emissions targets, Abott 2012 is a bit dated and the author admits that nuclear can arguably be used to address climate change.
Each energy source has its own strengths and weakness. For example, wind is low during heatwaves. Wind turbines are also dangerous to fix and workers have died from falling. Hydroelectric dams can break causing many deaths, take for example the Banqiao Dam failure. Nuclear killed zero people in contrast in 2025.
As for the cost of nuclear there is red tape driving up consturction cost and time. Like renenwables most of the cost for nuclear is in the construction.
Red tape nuclear power construction cost and time
The problem with nuclear is not a technological problem, but a regulatorary problem. We shouldn't be arguing we should be trying to phase out fossil fuels which kill many via air pollution.
- After a major blow to U.S. climate regulations, what comes next?
One Planet Only Forever at 03:31 AM on 13 March, 2026nigelj @23,
I agree that the roots of the problem have always been there. Too many people want to develop or conserve perceptions of superiority relative to Others. And I agree that new developments like social media amplify and accelerate the spread of harmful misunderstanding.
Another significant factor was the disastrous 2010 US Supreme Court decision in Citizens United v. FEC (see Brennan Center for Justice – Citizens United, Explained). Without Citizens United there would likely be far less marketing of politically motivated misunderstandings.
There is a more basic, simpler, explanation. People who harmfully unjustifiably, but legally, become powerful fight to ‘develop and maintain perceptions of superiority relative to others’ as viciously as they are able to. And the potentially most damaging and dangerous fundamentals of power are ‘wealth’ and ‘religion’.
The coupling of the Powerful drive for financial inequity (economic competition) with the Powerful drive for social control (nationalist religious competition) can produce undeniably disastrous authoritarian and fascist results. The coupling of religious extremists like US Christian Evangelicals or Middle East Islamic fundamentalists with ‘pursuers of fossil fuel wealth’ has undeniably produced many destructive results.
That ‘simple explanation’ has been reinforced by my rereading of Don Gillmor’s 2025 book, On Oil ( well summarized in this link to a review in the Literary Review of Canada). It is a fact-based story about the history of oil taking over economies and governments that contains a significant amount of the Alberta, Canada, history of oil. The opening chapter is called Babylon. It starts with the following explanation that the origins of Alberta oil power, not just the tar sands - oil sands – bituminous sands, was a collaboration between rich and influential fundamentalist Christian pursuers of wealth and power:
In 1967, John Howard Pew, the eight-five-year-old chair of Sun Oil, and Earnest Manning, premier of Alberta, attended the opening of the bitumen upgrading plant near Fort McMurray. It was part of the Great Canadian Oil Sands development, a subsidiary of Sun Oil. Both men were evangelical Christians. In 1930 Manning began preaching on a radio program, Back to the Bible Hour, [Alberta’s current Premier Smith was a radio talk show host before winning the leadership of the United Conservative Party and the Leadership of Alberta – taking over from the previous, less extremist who was pushed out by a powerful group of nationalist religious group pursuing control of the ‘conservative’ party in Alberta], and continued to preach as premier, encouraging Christians to live in the light of Jesus’s return. Pew was on the board of the magazine Christianity Today, which he helped finance, though critics said the magazine was merely a “tool of the oil interests.” He saw faith and oil as intertwined, and conflated both with freedom. “Without Christian freedom no freedom is possible,” he said.
Manning saw both progress and redemption in the oil sands. “We should be anxious,” he wrote, “for people to know about the oil which in the lamp of God’s Word produces a light that shines across the darkness of this world in order that men may find their way to Jesus Christ, the one who alone can save and who can solve their problems, whatever they may be.” Both men saw the oil sands as a gift from God.
I moved to Calgary four years after this baptism, in September 1971, …
The author worked his way through university in Alberta doing dangerous hard jobs in the Alberta oil fields in the 1970s.
The final chapter is called Rapture. It includes the following:
Sixty years before Trump courted oil and evangelicals, Barry Goldwater did the same, though he came to regret it. In 1964, Goldwater, a blunt, deeply conservative Southerner and, like Trump, an outsider, became the Republican candidate for president. He got the nomination in part due to the support of the oil industry and white evangelicals. Yet decades after his failed presidential bid (he lost by the largest margin in presidential history), Goldwater had misgivings about the creeping influence of white Christian nationalists. “Mark my word,” he said in 1994, “if and when these preachers get control of the [Republican] party, and they’re trying to do so, it’s going to be a damn problem. Frankly, these people frighten me. Politics and governing demand compromise [hopefully all parties compromising their positions to get to a shared well-reasoned common-sense sustainable understanding]. But these Christians believe they are acting in the name of God so they can’t and won’t compromise.
A simple explanation is that the co-joining of religious nationalist extremists (anti-immigrant and anti-any-other-religion) with unjustifiably harmful pursuers of oil, and other, wealth has continued to find ways to ‘legally gain illegitimate influence and control (and defy the existing law and find ways to delay or cancel the penalties of law being applied to them)’ by developing and spreading misunderstandings that they can benefit from. Note that both the US and Iranian leadership are co-joined religious nationalist wealthy groups claiming/believing that they will benefit from what is happening in the Middle East right now and have spread significant misunderstandings regarding what is happening.
A key understanding is that it costs wealthy people very little to support the social inequities and misunderstandings desired by religious nationalist groups. And the religious nationalists are willing to support and excuse the inequities of the pursuits of the wealthy as long as those wealthy people support powerful action on the desired social misunderstandings.
I would argue that the only viable future for humanity is as a collaborative, not combative, robust diversity of people competing to develop sustainable improvements of ways of living as part of a robust diversity of life on this amazing planet.
That better future will require more people, but not everyone (like John Cook states regarding how many people need to properly understand climate science in the interview presented in SkS item "Why Science Communication Fails: How to Break Down Misleading Arguments and Inoculate Against Misinformation"), to care to learn to be less harmful and more helpful to Others. And that tough, but important, work of increasing the number of people who learn to be less harmful and more helpful will be harder if Artificial Intelligence is ‘freer’ ‘less regulated’.
- After a major blow to U.S. climate regulations, what comes next?
One Planet Only Forever at 10:11 AM on 9 March, 2026John Hartz (and others),
After my comment @21 I did my afternoon browsing of the BBC News and came across the following very relevant article:
How I've learned that certainty is the thing to really fear, BBC In Depth, Nicky Campbell
Here are a few quotes to spark your curiosity and encourage you to read the full article:
Certainty is a curse of our age. It is a pandemic. And I've never been more certain about anything. [Opening Declaration]
I've been presenting television debates and radio phone-ins over five decades.
... in recent years it seems to me like opinion has ossified, weaponised, and tribalised. There's a growing fear (among political scientists and others) that in our modern, social media-driven world, every issue is reduced to a zero-sum game and shoved into a political tick box. ... Causes and positions are embraced uncritically. Nuance and understanding are viewed as signs of weakness.
…
Since 1997, I've had extraordinary experience after extraordinary experience of hosting "the Nations Phone-in" on Radio 5Live. I've also presented numerous TV debates and documentaries over the years … The callers opine on anything …. Don't get me wrong, the tone of these discussions has always been quarrelsome and combative … But to me at least, recently it's become a wailing cacophony of polarisation and mutual demonisation. Simplicity is elevated, subtlety is trashed, and complexity decried.
…
Complexity phobia [bold header in the article]
…
"People are increasingly disliking each other," says Prof Sander van der Linden, who researches social psychology at the University of Cambridge. "People are less willing to work with people from the other side, to engage in romantic relationships with people from the other side, and to even cohabitate with people from the other side.
"That sort of affective polarisation has seen a sharp increase."
And there's another phenomenon that has been termed "complexity phobia": the aversion to recognising incontrovertible evidence and facts if they challenge a more comfortable and comforting narrative.
…
Radio epiphanies [bold header in the article]
Of course, elements of this fractiousness have always existed. For TV producers, it's long been tempting to invite two self-righteous zealots into a studio to bellow at each other. In the business it's called a "good row".
…
I remember and now cherish the spine-tingling moments in debates where someone changed their mind before my very eyes. … as the arguments played out, I saw her position softening in real time. She absorbed the opposing arguments and thought her own reasoning through. She seemed to decide that her priorities had been ever so slightly misplaced. The look of uncomfortable epiphany was powerful and deeply moving. She listened. She understood. And eventually, she changed her mind.
It still happens. The crucial point, though, is that these flashes of insight happen far less than they used to.
...
Angry comments [bold header in the article]
What's driving this increased stridency among the public?
Social media certainly seems to be playing its part. The science now suggests that it makes people more polarised and angry, says Linden.
He and his colleagues used a computer model in 2020 to analyse more than two million posts by American politicians and major media outlets that had been published on Facebook and on X (then known as Twitter). They found that negative language did a good job of riling up readers online, and by far the strongest predictor of engagement were words that demonised some sort of "out-group".
...
These apps seem to make people more angry and divided - and in turn, more certain about their own opinions.
My trade isn't totally blame-free, of course. Linden points out that traditional media - TV, radio and the like - has long had a "negativity bias". But apps like Facebook and X have amplified it hugely. "The balance is off much more on social media," he says.
My concluding thought is ‘certainty’ that the world will only become a better place if an increasing number of people pursue learning to be less harmful and more helpful to Others … even if that ruins the profitability of already developed activities … even if that makes some ‘high status people’ ‘lower status people’.
- After a major blow to U.S. climate regulations, what comes next?
One Planet Only Forever at 07:49 AM on 26 February, 2026Bob Loblaw @11,
That is a good story to share.
One of my favourite examples to share about 'being fortunate - lucky' is that I graduated from University when things were booming in Alberta as a result of the late 1970s global energy crisis (record high oil prices in 1980). As a result, I was able to prove my abilities for several years before global events temporarily ruined the global oil industry (oil prices dropping significantly by 1986). I was always employed at a good salary level until I retired. Many people who graduated after I did struggled to have steady high paying employment. It wasn't that they were less intelligent, less capable, or less motivated. It was simply the timing of their graduation from University.
- After a major blow to U.S. climate regulations, what comes next?
Eric (skeptic) at 18:59 PM on 24 February, 2026The conclusion is basically backwards. The best case is for states to experiment with solutions and have Congress write laws to set numeric standards for CO2 just like they did for CO. The worse case is to go to the Supreme Court and watch them rule 6-3 against the same thing they ruled 5-4 for in 2007. It's pretty simple: decisions based on policy, or even worse, science, do not create strong legal precedent. Please read the Roberts 2007 dissent that I will again link here: Massachusetts v. EPA, 549 U.S. 497 (2007)
If the USSC decides a similar case, a 6-3 decision will hinge on Roberts 2007 logic both in deference to the legal issues and to Roberts himself. The three liberal justices will maintain the Stevens argument and argue it's even more crucial today. The other six may secretly harbor Scalia's merchandizing of doubt, but won't put that in writing.
How will Congress pass those laws? Good question, a simple majority in the House is inevitable thanks to my state of Virginia gerrymandering and anti-Trump sentiment. 60 votes can be purchased in the Senate by sending enough money to farmers regardless of party control.
- Trump just torched the basis for federal climate regulations. Here’s what it means.
Eric (skeptic) at 23:07 PM on 17 February, 2026This article or another article should discuss the legal basis for the endangerment finding or its rescission. Regardless of opinions of scientific merit it is worth going over the history.
The current administration's EPA states "The agency concludes that Section 202(a) of the CAA does not provide EPA statutory authority to prescribe motor vehicle emission standards for the purpose of addressing global climate change concerns". Is that correct?
In 2009 the EPA based their endangerment finding on this 2007 Supreme Court case: Massachusetts v. EPA, 549 U.S. 497 (2007) that ruled 5-4 on the merits of GHG regulation, that in fact GHG were an "air pollutant" causing actual harm to the litigants, including the state of Massachusetts. The ruling also maintained that GHG fell into Congress's definition of "air pollutant" due to the wording "including" in the statute. But the CAA or amendments through 1990 did not "include" GHG. The IRA passed in 2022 amended the CAA to give EPA authority to regulate GHG under the CAA. The BBB in 2025 reduced that authority through funding cuts and and a rescission of the GGRF authority. Also in 2025 Congress rescinded the authority of EPA to grant waivers to California. That is being litigated. Congress probably did not have Congressional Review Act authority over waivers.
The recent rescission of the endangerment finding will also be litigated and the inclusion of EPA regulatory authority over GHG by the 2022 IRA will be weighed against some reduction in that authority by the "Big Beautiful Bill" in 2025.
It's fair to say that looking at both of those purely partisan bills, that Congress needs to write GHG laws that are unambiguous to avoid the major problem the 2007 decision, namely USSC justices opining on science. Science is not in their jurisdiction as the 5-4 decision shows. Congress also has to include laws on limits to GHG authority for states to preempt federal law in either direction. Science can inform Congressional action and all the details can be left to the regulators, but obviously the outlines of the scientific mandate and specific scope of regulation must be part of the law.
Otherwise we end up with what we just saw which is the executive branch bouncing between extremes on regulatory questions. Legally the executive branch controls the EPA and has the authority to make those regulatory decisions, unless the regulations are clearly specified in law.
- The future of NCAR remains highly uncertain
MA Rodger at 01:23 AM on 6 February, 2026One aspect of this issue with Trump is whether he was ever actually believed his climate-change denial or whether he was just banging that particular drum as a politician because it was something that gained him political support. Perhaps he was being insincere back in 2009 when he added his name to this full-page ad in the NY Times (appearing in second-last row).
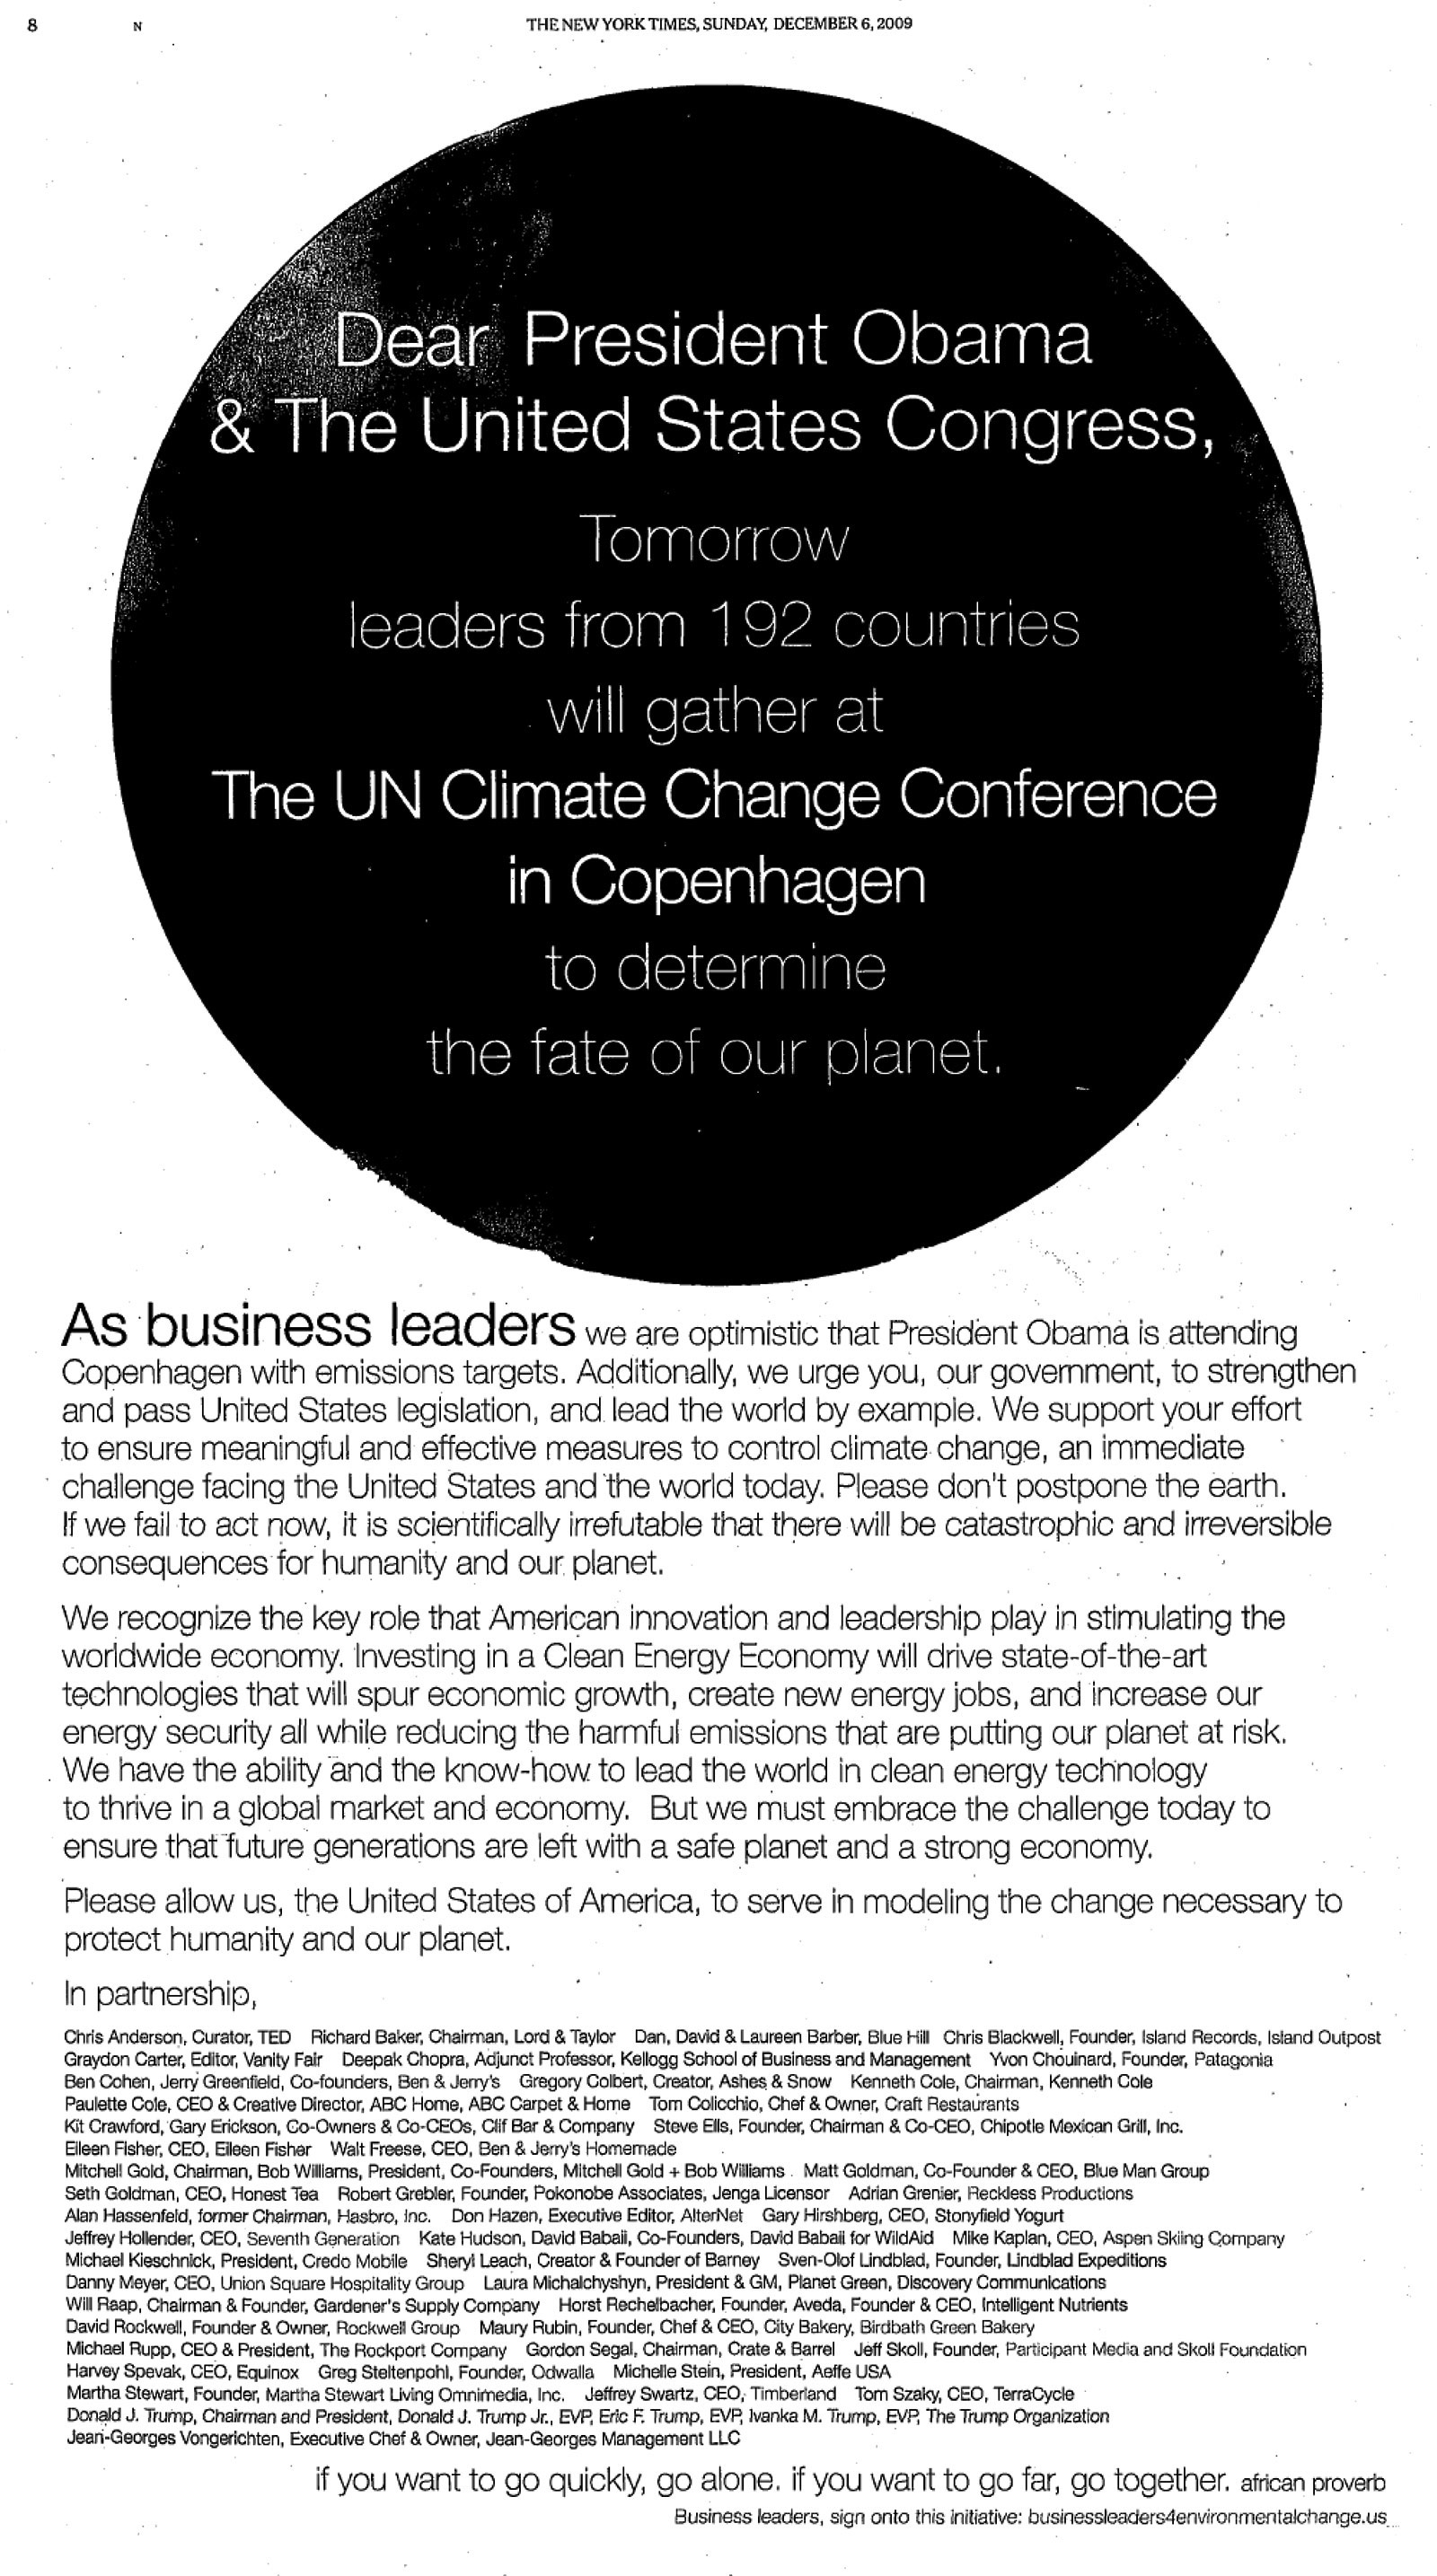 As we are dealing with a congenital liar (and a remarkably ignorant one to boot), it's difficult to know which.
And now he is slipping into his dotage, there is also the issue of him giving license to actions suggested to him by the "plucky band", those fawning actual climate-change deniers he surrounds himself with.
- The future of NCAR remains highly uncertain
prove we are smart at 21:10 PM on 5 February, 2026Plot idea: 97% of the world's scientists contrive an environmental crisis, but are exposed by a plucky band of billionaires & oil companies.
America is not the way it is because of Trump-Trump is the way he is because of America. To Trump, the Constitution isn't an ideal, it's an obstacle.
Your Trumpstein administration will probably be jailed for their crimes and just before that probability, they willingly will burn the country down with them and try to hide in the ashes. Dismantling NCAR is just another straw on the camels back.
The world is watching the USA with very different eyes and your nearest neighbouring countries are taking self preservation tactics like the rest. Electing this leader twice has shown a people out of touch and lacking critical thinking. Fascism is rising and democracy is falling in the USA.
That "plucky band" has poisoned many-maybe too many.
- Ice age predicted in the 70s
angusmac at 10:45 AM on 11 December, 2025BL@173 referring to your comment that Benton (1970) is referring to the warming and cooling of particulate pollution. I have reread Benton (1970) and I agree with your interpretation. Therefore, I confirm that my point 3 in angusmac@173 is incorrect and should be deleted.
- Ice age predicted in the 70s
angusmac at 13:35 PM on 3 December, 2025BL@173, 177 and 178
Before responding to your challenge, I note that the points you raise would not normally be part of the guidelines that a publication would provide for an independent reviewer. Instead, they appear to be points derived by someone who has studied the paper at university and wishes to arrive at preconceived conclusions regarding my ability to carry out an independent review.
I now reply as follows.
Why did he do the work?
- He developed a one-dimensional climate model based on a steady-state energy balance approach to analyse temperature and ice distribution by latitude.
- The study was motivated by the need to understand how variations in solar radiation and atmospheric properties influence global surface temperature and ice coverage, with particular focus on the roles of solar input, surface albedo, and meridional heat transport.
- His work represents an early application of energy balance modelling to demonstrate how changes in climate variables can drive significant shifts in Earth’s temperature and ice extent
What aspects of climate science does he attempt to address?
The paper addresses some aspects of climate science, including:
- The planetary energy budget, focusing on the balance between absorbed solar radiation and outgoing longwave radiation by latitude.
- The role of ice–albedo feedback and the existence of multiple stable climate states, demonstrating how changes in high-latitude ice extent can lead to either warmer climates or near-complete ice coverage.
What part of his paper represents "original work"?
He appears to have made several original contributions, including:
- Developing a zonally averaged, one-dimensional energy balance model structured by latitude, which calculates mean annual sea-level surface temperature for each latitude band. The model incorporates key parameters such as solar radiation, surface albedo, infrared emission, and meridional heat transport.
- Conducting systematic numerical experiments by varying parameters such as the solar constant, albedo, and transport coefficients. This enabled the exploration of climate sensitivity and the identification of distinct equilibrium states, including both warmer climates and scenarios approaching global glaciation.
What part of his paper provides useful guidance to future work in climate science?
Part 2 “The Model” and Part 3 “Applications” provide particularly useful guidance for future climate science research for two main reasons:
- Conceptual: These sections demonstrate that even highly simplified energy-balance models can produce multiple stable climate states. This insight has motivated more detailed investigations into climate feedback mechanisms, such as ice–albedo feedback, and their role in glacial–interglacial transitions.
- Methodological: The modelling framework introduced is straightforward and transparent and has been adopted in subsequent research. It enabled systematic evaluation of climate sensitivity, heat capacity, and meridional heat transport.
Interestingly, Sellers (1973) is classified as neutral, and Sellers (1974) is classified as warming by both PCF-08 and me.
- Ice age predicted in the 70s
angusmac at 11:51 AM on 27 November, 2025BL@176 you seem to be determined to misrepresent what I actually said.
Yes, having written many scientific papers, I am aware of the structure of scientific papers, and I did state that they are broadly divided into two parts. I also agree with the typical contents of a scientific paper presented by you, and that (using your elements) these would usually include some or all of the following:
Part 1: Introduction/Methodology/Analysis/Interpretation and Discussion.
Part 2: Conclusions
Consequently, I agree with your comment that:

However, I was focusing on Benton (1970) as an example, which is very clearly divided into two main parts, namely:
Part 1: Present several hypotheses for the cause(s) of climate change and then discuss them.
Part 2: Present the conclusions.
Furthermore, your comment below does not come as surprise to me:

I have systematically reviewed the existing methodologies contained in numerous scientific publications and have proposed enhancements where appropriate. Advancements in science and engineering often result from critically evaluating prevailing methods and introducing new approaches or techniques, which usually lead to alternative and more reliable conclusions.
I agree with your comment that the authors of PCF-08 knew how to find “Easter eggs”:

The reason I agree with your “Easter eggs” finding is because someone more sceptical than you might think that the authors of PCF-08 were data mining for information to support a preconceived warming position.
I also agree with your comment that Benton (1970) hardly merits the description of a paper:

However, I included it in my database because it was used by PCF-08.
I disagree with your comment regarding the clear prediction of warming in:

Benton (1970) only mentions 0.6°C warming in the discussion part of the paper by referring to “numerical studies have indicated” a warming of 0.6°C, namely:

I contend that if it were a clear prediction by Benton (1970) and not just an indication, then this warming would have been included in his conclusions as a clear prediction and not just an indication in the discussion part of the paper. Furthermore, if it were a prediction, I would have expected his conclusions to include an unequivocal statement similar to, “It is concluded that the present rate of increase in carbon dioxide would result an increase in temperature of approximately 0.6°C by the year 2000”.
However, the conclusions in Benton (1970) did not include an unequivocal prediction of warming.
Finally, I disagree that I am creating a false equivalence in:

On the contrary, Benton (1970) presented two main conclusions, namely: “Some years from now man will control his climate”, either by warming from “the increase of carbon dioxide” or by cooling from “particulate pollution”. It is evident from his conclusions that the Benton (1970) considers the possibility either warming or cooling to be equivalent and not a false equivalence.
However, I suspect that you will try to find some argument to postulate that “Some years from now” does not match your definition of a timeframe for a climate trend for some decades into the future.
It would appear to be you that is guilty of creating a false equivalence by taking a paragraph from the discussion part of a paper and elevating it to a conclusion of a clear prediction.
- Ice age predicted in the 70s
angusmac at 09:09 AM on 25 November, 2025BL@173 you have made so many comments; therefore, I shall respond in smaller bite-sized chunks
Reply 1 to BL@173, you do not seem to understand my reviews of the papers contained in my database. Therefore, let me explain by using Benton (1970) as an example.
Benton (1970) is typical of many scientific papers in that they are broadly divided into two main parts, namely:
Part 1: Present several hypotheses for the cause(s) of climate change and then discuss them.
Part 2: Present the conclusions.
I contend that the main part of a peer review classification of a paper is the conclusions – not the preceding discussion of the hypotheses. I think that this is where you (and the other commentators) on SkS have gone wrong because you focus on the hypotheses/discussion part of the paper, whereas the main part of the paper that matters is the conclusions.
I now present the conclusions from Benton (1970) below for ease of access for other readers (with my highlights):
 Conclusions")
It is evident from the above that, “Some years from now” Benson (1970) is primarily concerned about two things, namely “…the increase of carbon dioxide and particulate pollution”.
If you wish to argue against the Benson (1970) conclusions then please go ahead, but I suggest that any reasonable person reading these conclusions would agree that they are neutral on the causes of climate change, namely, either carbon dioxide warming or particulate cooling.
- Ice age predicted in the 70s
angusmac at 12:32 PM on 23 November, 2025Phillipe Chantreau@147
I note that Benton (1970) is included in PCF-08 as warming and NTZ as cooling. Yes, I do agree with your comment that,
However, please note that I have classified it as neutral for the following reasons:
- Benton (1970) does states that, “The present rate of increase [of CO₂] of 0.7 ppm per year would therefore (if extrapolated to 2000 A.D.) result in a warming of about 0.6°C.”
- However, he also states that, “A second cause of climatic change is particulate loading of the atmosphere. Some meteorologists have attributed the cooling of the earth since 1940 primarily to such pollution of the atmosphere by man.”
- He also notes that, “The first process tends to depress the temperature of the earth's surface; the latter tends to increase it.”
Benton (1970) concludes that [emphasis added], “At present, the natural causes of climatic change are probably more important than the effects of man-made gaseous [CO₂] and particulate pollution. However, the balance is changing as industrialization, urbanization, and transportation continue to grow at an accelerating rate. Some years from now, man will control his climate, inadvertently or advertently. Before that day arrives, it is essential that scientists understand thoroughly the dynamics of climate.”
Note that his conclusions give equal emphasis to warming, i.e., man-made “gaseous pollution” [CO₂] and cooling, i.e., “particulate pollution”. He does not single out CO₂ as the only problem. Furthermore, he also points out that we do not fully understand the dynamics of climate.
I hope that the above is a reasonable explanation of the reasons that I have arrived at the neutral classification and not cooling as you incorrectly stated.
- Five ways Joe Rogan misleads listeners about climate change
Paul Pukite at 15:08 PM on 18 November, 2025"but Lindzen seems to have botched this"
I can make the argument that Richard Lindzen set the discipline of atmospheric sciences down the wrong path for generations due to his failure to get the attribution correct on foundational climate behaviors. He claimed he was expert on atmospheric tides, having written a book called "Atmospheric Tides" in 1970. Yet, he missed pointing out that the enduring behavior of the equatorial stratosphere known as QBO was due to an obvious forcing attribution of interacting lunar and annual tides. In his research publications, Lindzen clearly stated that tidal forces had no effect on the QBO and other behaviors because he found that the math didn't agree. Unfortunately, his claim appeared so authoritarian to readers that no one ever followed up on his assertions and just assumed forcing was via some other resonant process.
Alas, this same missing tidal attribution has also been found to control mean sea-level variations over many decades in coastal sites, via similar careful cross-validation of models (starting in the Baltic, which has the most extensive record of MSL). This should not be surprising to find that tidal forces control what naively appears to be long-term tidal levels, yet the common explanation is non-tidal and unpredictable. This missed attribution is arguably also an artifact of Lindzen's original gaffe. Worse yet, the same tidal attribution can also be applied to the important climate behavior of the North Atlantic Oscillation (NAO), which is best described as an erratic cycling of atmospheric pressure. Further, the same model can be tuned slightly to match the cycles of the Atlantic Multidecadal Oscillation (AMO). And to cap it off, the same common-mode tidal forcing can be used to cross-validate predictive models of ENSO in the Pacific.
The power of these tidal models are reinforced by advancements in the solution of non-linear fluid dynamics. Admittedly, I wouldn't have as strong a thesis because most people would ascribe it all to over-fitting of curves, similar to what can happen with neural-net models. Yet the rigor of extensive cross-validation on real FD models shows none of the artifacts of arbitrary over-fitting.
Given all that, and Lindzen's poor track record in anthropogenic attributions to climate change, I consider it past due to reappraise all of natural climate variation with these tidal factors in mind.
BTW, I essentially have one peer-reviewed publication on this topic, which was comprehensively covered in a 2019 Wiley/AGU volume (also presented at several AGU and EGU conferences prior to publication).
- Ice age predicted in the 70s
angusmac at 17:27 PM on 8 November, 2025Eclectic@158
Regarding your comment that, “Looking at the Bigger Picture, why is it that you are bothering to argue about the exact percentage of scientific papers that were classed in cooling/neutral/ warming?”, since science (and technology) have moved on.
My answer is simple: both SkS and PCF-08 have stated that there was an overwhelming consensus for warming in the 1970s. To the contrary, I have shown that this is untrue. PCF-08 (and SkS) have ignored the 86 cooling papers that my literature survey found in major scientific journals.
Therefore, I recommend that the SkS 1970s ice age web page should be amended to represent the actual scientific facts (i.e. 86 cooling papers) and, as I have stated @146, PCF-08 should be either withdrawn or subjected to a detailed corrigendum to correct its obvious inaccuracies.
I hope that this answers your query. - Ice age predicted in the 70s
Philippe Chantreau at 03:59 AM on 3 November, 2025As I look further, my skepticism increases, although I may have mistaken some papers as cooling when they say neutral. In fact, they are likely neither, or irrelevant. Another example: Eichenlaub (1970) This one is strictly about Lake effect snow events in the Great lakes region, makes no claim about global climate and contains these words in the conclusion section: "While this increase in lake effect snowfall cannot, as yet, be ascribed to any single cause, a tendency toward colder winters recently in
southwestern Michigan may be partially responsible for the upward trend in that area. Further evidence is needed before valid conclusions can be drawn regarding the role of air pollution in this climatic change."
This paper was an attempt at finding possible causes to a recent past change in a specific region. It makes no mention at all of global climate, or any forecast of future trends, and stops short at stating anything with any level of certainty.
- Ice age predicted in the 70s
Philippe Chantreau at 03:48 AM on 3 November, 2025I have to confess an error: I was trying to click on the Wahl and Lawson 1970 link (which is broken} and instead went to the Battan piece, which supposedly discusses "pros and cons of geoengineering" and is "confirmed neutral. Here is the "paper" that supposedly is "confirmed" to be neutral:
https://journals.ametsoc.org/view/journals/bams/51/11/1520-0477_1970_051_1030_sospow_2_0_co_2.xml
- Ice age predicted in the 70s
Philippe Chantreau at 03:34 AM on 3 November, 2025To elaborate on the previous post, I'll add that I was somewhat lucky in being able to access that "paper" at my first try. Multiple other attempts on different pieces led to broken links or paywalls. One paywalled let me read a first page that did not suggest it was taking a strong position on forecasting future trends.
Another one was accessible but hardly relevant: "Summary of Soviet publications on weather modification." It nonetheless contained this bit: "Budyko, Drozdov and Yudin (1966) stated that in
less than 200 years the heat released by man's activities will have a greater influence on climate change than solar radiation changes." I recommend reading through it so that nobody accuses me of cherry picking. The bulk of it is about cloud seeding for agricultural purposes. Some parts reflect the insane arrogance of the Soviet approach to inhabiting this planet, especially the getting rid of Arctic ice ideas near the end. A fun read, but it's still hard to see how it could be construed as a research paper forecasting cooling of the Earth climate.
I am not sure I will have the patience to continue wading through this. So far, I am profoundly unimpressed with this "57 cooling papers" claim.
- Ice age predicted in the 70s
Philippe Chantreau at 03:12 AM on 3 November, 2025So far, it is difficult to take seriously the classification proposed in that "database." I have taken random samples and I can not understand what criteria are used to declare that a particular piece can be said to point to future climate cooling rather than warming.
Example, the first I decided to look into: "Carbon Dioxide and its Role in Climate Change", George S. Benton. This was published in: Proceedings of the National Academy of Sciences, Vol. 67, No. 2, pp. 898-899, October 1970. However, it is not at all a research paper. It is a short summary of basic principles intended for a symposium, as it says in the header: "Contributed to the Symposium on Aids and Threats from Technology, April 29, 1970." The intent is to attract attention to the fact that Earth climate needed to be better understood. In the paper, it says things like:
"The effect of carbon dioxide is to increase the earth's temperature by absorbing outgoing terrestrial radiation. Recent numerical studies have indicated that a 10% increase in carbon dioxide should result, on the average, in a temperature increase of about 0.3OC at the earth's surface. The present rate of increaseof 0.7 ppm per year would therefore (if extrapolated to 2000 A.D.) result in awarming of about 0.60C-a very substantial change."
Interestingly, this prediction was very close to what actually happened. The rest of the letter goes on to review other factors affecting climate, such as aerosols, including that from volcanic activity, solar irradiance, and others. It concludes with these words: "Some years from now, man will control his climate, inadvertently or advertently. Before that day arrives, it is essential that scientists understand thoroughly the dynamics of climate. Only by such an understanding and by active intervention can man assure himself in the long run that this planet will continue to be a suitable place to live."
The only little tidbit that would fit the "it points to cooling" narrative would be this: "In the period from 1880 to 1940, the mean temperature of the earth increased about 0.60C; from 1940to 1970, it decreased by 0.3-0.4°C." This is an accurate factual statement but is not used has having any bearing on predicting future trends, and the letter does not even make the claim of having a clear explanation for it, although aerosols are cited as likely contributors.
Citing this piece as scientific work predicting future cooling of the Earth climate is downright mendacious.
- Ice age predicted in the 70s
angusmac at 11:41 AM on 30 October, 2025This SkS rebuttal appears to be incorrect because the enclosed database of the climate science literature of the 1965-1979 period shows that there was an overwhelming scientific consensus for climate cooling (see Figure 1).
The consensus was 65% for the whole period but greatly outnumbered the warming papers by 3.4-to-1 during the 1968-1975 period, when there were 57 cooling papers (77%) compared with 17 warming (26%).

The supposed SkS rebuttal has placed too much reliance on Petersen et al, 2008 (PCF-08) However, it appears that the PCF-08 authors have committed the transgression of which they accuse others; namely, “selectively misreading the texts” of the climate science literature from 1965 to 1979. The PCF-08 authors appear to have done this by neglecting the large number of peer-reviewed papers that were pro-cooling.
I find it very surprising that PCF-08 only uncovered 7 cooling papers and did not uncover the 86 cooling papers in major scientific journals, such as, Journal of American Meteorological Society, Nature, Science, Quaternary Research and similar scientific papers that they reviewed. For example, PCF-08 only found 1 paper in Quaternary Research, namely the warming paper by Mitchell (1976), however, my review found 19 additional papers in that journal, comprising 15 cooling, 3 neutral and 1 warming (refer to enclosed database.
I can only suggest that the authors of PCF-08 concentrated on finding warming papers instead of conducting the impartial “rigorous literature review” that they profess.
If the current climate science debate were more neutral, the PCF-08 paper would either be withdrawn or subjected to a detailed corrigendum to correct its obvious inaccuracies.
Database of Cooling Neutral and Warming Papers 1965-1979.pdf
- Is this the most embarrassing error in the DOE Climate Working Group Report?
Charlie_Brown at 10:28 AM on 9 October, 2025An excellent description of proper use of statistics for data evaluation. I thank Dr. Dressler for the illustrative graphics.
My choice for most embarrassing would be something simpler because it is obvious once identified. Then it is revealed as an undergraduate level misrepresentation by irrelevant comparison. Here is an excerpt of my submitted comments.
On p. 13, Section 3.1.1 Historical radiative forcing
“Figure 3.1.1 shows that the anthropogenic forcing component was negligible before about 1900 and has increased steadily since, rising to almost 3 W/m2 today. However, this is still only about 1 percent of the unperturbed radiation flows, making it a challenge to isolate the effects of anthropogenic forcing; state-of-the-art satellite estimates of global radiative energy flows are only accurate to a few W/m2.”
Comparing 3 W/m2 to 240 W/m2 is misleading and diminishes the significance of 3 W/m2. It is an example of science denialism by distraction, obfuscation, and omission. Straightforward, fundamental physics including conservation of energy and radiant energy calculations combined with atmospheric properties allow the effects of anthropogenic forcing to be isolated by calculation. The calculated spectra of energy loss to space is verified by satellite measurements (Hanel, et al.,1972) (Brindley & Bantges, 2015). 3 W/m2 is sufficient to cause and continue observed global warming. The anthropogenic forcing is not determined by difference of two large, measured numbers and does not rely on just satellite estimates of radiative energy flows. There is very little uncertainty about the effects of increasing gas concentrations.
Even a relatively simple radiant energy model can isolate the effects of anthropogenic forcing that are used for changes in energy flux at the top of the atmosphere caused by changing conditions. Sophisticated climate models use the same approach for radiant energy calculations.
References:
Brindley & Bantges, “The Spectral Signature of Recent Climate Change,” Current Climate Change Reports, 2, July 2016. doi.org/10.1007/s40641-016-0039-5
Hanel, et al., “The Nimbus 4 infrared spectroscopy experiment: 1. Calibrated thermal emission spectra,” Journal of Geophysical Research, 77(15), May 1972. - Koonin providing clarity on climate?
Charlie_Brown at 05:09 AM on 28 September, 2025Ken Rice is lenient with the authors of the DOE Climate Impacts report and with Secretary Chris Wright. Chris Wright states in the Foreword: “I chose them for their rigor, honesty, and willingness to elevate the debate. I believe it faithfully represents the state of climate science today.” I care more about substance than credentials. My public comments included: “The Foreword highlights that the purpose of the Critical Review is to challenge and counter mainstream science. It certainly does not represent the state of climate science today. Rather, it provides a rationalization for weakening current policies for combatting climate change. The authors are neither representative of the scientific community nor diverse.”
The science is not that complex. The report is full of misrepresentation, distraction, and obfuscation. It is not worthy of an undergraduate term paper let alone a critical review of science by PhDs. Many points have been thoroughly discussed and debunked here on the SkS website. My comments included:
1) “Section 2.1 is oversimplistic. CO2 is rarely the limiting nutrient. It discusses photosynthesis as a benefit but ignores adverse effects resulting from CO2 as the primary cause of climate change including drought, extreme temperatures, excess rain, and cropland relocation.”
2) “CO2 below 180 ppm is an irrelevant distraction to the discussion of modern global warming.”
3) “Changing ‘ocean acidification’ to ‘ocean neutralization’ is semantic posturing that does not change the effects. To say that pH reduction is not acidification until the pH drops below 7.0 it is not meaningful.”
4) “Implying that the IPCC uses data manipulation to satisfy preferences is baseless accusatory language. The change in radiative forcing due to the Earth’s orbit around the sun is negligible within the period of modern global warming. The change due to sunspot activity is measured and found to be negligible.”
5) “Comparing 3 W/m2 to 240 W/m2 is misleading and diminishes the significance of 3 W/m2. It is an example of science denialism by distraction, obfuscation, and omission. Straightforward, fundamental physics including conservation of energy and radiant energy calculations combined with atmospheric properties allow the effects of anthropogenic forcing to be isolated by calculation. The calculated spectra of energy loss to space is verified by satellite measurements (Hanel, et al.,1972) (Brindley & Bantges, 2015). 3 W/m2 is sufficient to cause and continue observed global warming. The anthropogenic forcing is not determined by difference of two large, measured numbers and does not rely on just satellite estimates of radiative energy flows. There is very little uncertainty about the effects of increasing gas concentrations.
The effect of clouds is the largest uncertainty in climate models. However, average cloud cover does not change without a driving force. Therefore, the effect of increasing GHG can be isolated by holding clouds constant. Specific humidity will rise with increasing surface temperature, resulting in positive water vapor feedback. This can affect clouds."
Others have submitted many more excellent comments, but I have made my point. The science can be explained and understood by most scientific-minded people who are interested in learning. One does not need a PhD in climate science to understand the flaws in the DOE report.
Disbanding the CWG may not be a sign of progress. It may be a way to avoid the lawsuit by the Environmental Defense Fund and the Union of Concerned Scientists that would restrict the use of the report.
- Another pause?
Paul Pukite at 08:15 AM on 30 August, 2025They owners delete comments that they don't like...
[snip]
at the https://andthentheresphysics.wordpress.com blog so I will link to it here:

I use an RSS feed so can see the comment was approved and then posted, but was later removed.
- Is Nuclear Energy the Answer?
michael sweet at 03:46 AM on 6 August, 2025Responding to David-acct's off topic comment here:
Your claim that the data from your linked site does not support my statement that French nuclear power plants do not shut down is false on its face.
This data showed that reactors were shut down on the weekend:
date time Power MW
8/10 2:45 31645 Thursday 2023
8/10 13:45 30424
8/5 4:15 28489 Saturday 2023
8/5 16:15 25548
On Saturday at 16::15 6,097 MW less power was generated than on Thursday at 2:45. On 8/14/2023 I posed these questions to you:
"Several question about this raw data occured to me.
1) You state clearly that the data shows no nuclear power stations were shut down. Please explain why the power generated on the weekend is so much less than the power generated on Thursday. How does this show that no power stations were shut down over the weekend? It appears to me that about 6 of 31 power stations (20%) were turned off.
2) On both days they are generating more power at night when power is generated at a loss than they are generating during the day when the price of electricity is much higher. Can you explain why the "always on" nuclear plants generate less power during the most expensive part of the day than they do when electricity is cheapest?
This example proves beyond doubt that examining cherry picked factoids without any analysis is a complete waste of time. Please do not cite raw data any more. You need to cite analysis of data that filter out gross errors."
You refused to answer and stopped posting at SkS for several months. Please answer those questions now.
Looking at the French power link again I found this data for the weekend of August 2 (Saturday) and August 4 2025 (Monday).
date time Power MW
8/2 05:00 39717
8/2 14:15 25091
8/4 04:00 39722
8/4 13:45 24128
On this weekend reactors were shut off during the day. On 8/4 15 MW less power was being generated at 13:45 than at 04:00. Please explain why so many reactors were turned off. Other posters have suggested that they might shut down the reactors because there is not enough cooling water or because they cannot compete with cheaper solar power. In any case, the reactors are turned off since no one wants to purchase their power.
I note that since France has 63 GW of nuclear power the highest capacity factor last weekend was 63% and the lowest was 38%.
If they wasted the nuclear power by turning down the power output that counts as shut down. We cannot tell from the data if 15 reactors were shut off or if 30 reactors were run at half power.
I note that you said here "It would seem the cost of doing so would be prohibitive given the costs of restarts,"
I found this on Bloomburg French power slumps as surging renewables push out atomic plants which suggests that nuclear plants cannot compete with renewables even when they are owned by the government.
I do not care if you are not skilled enough to find resources that state France does not shut down reactors on the weekends. I linked a site that specifically stated that plants close on weekends and provided data (from your link) that showed without doubt that several reactors were closed on the weekend.
Apparently now they are shut down on sunny and/or windy days, in addition to weekends, because they cannot compete with cheaper renewables.
- Have renewables decreased electricity prices: European edition
michael sweet at 02:03 AM on 5 August, 2025David-acct at 11:
I am very disappointed that you have forgotten the discussion we had in August 2023 about France shutting down reactors on the weekend since their power is too expensive to sell.
Here and at the following posts you posted off topic and we discussed that France shuts down their reactors on the weekends. I linked to Wikipedia. Since it is common knowledge that France shuts down their reactors on the weekends it is not discussed in the peer reivewed literature.
In the posts following my link you provided a link that gave the amount of electricity generated in France using their nuclear plants by day claiming that it showed reactors were not turned off on the weekend. A cursory glance at the data indicated that France shut down at least 6 of their plants on the weekend. They may partially scale back production from more plants but it is cheaper to shut down 6 plants than to work 12 plants at half speed. You did not provide any information that suggested they do not shut down their plants on the weeekend.
This data showed that reactors were shut down on the weekend:
date time Power MW
8/10 2:45 31645 Thursday
8/10 13:45 30424
8/5 4:15 28489 Saturday
8/5 16:15 25548
I note that in our previous discussion more than half of the "always on" nuclear plants were not generating power in the middle of an energy crisis since they required long term unscheduled maintenance.
I have previously linked Jacobson et al 2022 for you. It is not my job to go find the homework you threw away in the trash. As MA Rodger says, it is easily Googled.
Jacobson has been publishing full system analysis since 2015. Every paper renewable energy becomes cheaper and cheaper. Meanwhile the British have signed contracts for $50 billion (not counting interest) for a 1700 MW nuclear plant. Nuclear costs go up and up.
Why should I have to go find references to previous discussions that we have had??? If you do not pay attention to discussions we have here on SkS you should stop posting.
This post is off topic again. The OP is about renewable energy and you are posting about nuclear power.
- Is Nuclear Energy the Answer?
tder2012 at 06:02 AM on 2 July, 2025Keep in mind the following:
nuclear 1GW x80% capacity factor x80 years = 560,640GWh lifetime
solar 1GW x25% capacity factor x30 years = 67,500GWh lifetime
wind 1GW x45% capacity factor x35 years = 137,970 lifetime
A recent SKS article identified a report released in June 2025 "Beyond LCOE" "This report explains why LCOE fails to reflect the full complexity of electricity systems and can lead to decisions that jeopardize reliability, affordability, and clean generation."
Keep in mind that Lazard's LCOE reports have many factors that they don't examine, which Lazard themselves clearly acknowledge.See the bottom of page 7 in the 2025 report (it was page 8 in 2024) "Other factors would also have a potentially significant effect on the results contained herein, but have not been examined in the scope of this current analysis. These additional factors, among others, may include: implementation and interpretation of the full scope of the IRA; economic policy, transmission queue reform, network upgrades and other transmission matters, congestion, curtailment or other integration-related costs; permitting or other development costs, unless otherwise noted; and costs of complying with various environmental regulations (e.g., carbon emissions offsets or emissions control systems). This analysis is intended to represent a snapshot in time and utilizes a wide, but not exhaustive, sample set of Industry data. As such, we recognize and acknowledge the likelihood of results outside of our ranges. Therefore, this analysis is not a forecasting tool and should not be used as such, given the complexities of our evolving Industry, grid and resource needs. Except as illustratively sensitized herein, this analysis does not consider the intermittent nature of selected renewables energy technologies or the related grid impacts of incremental renewable energy deployment. This analysis also does not address potential social and environmental externalities, including, for example, the social costs and rate consequences for those who cannot afford distributed generation solutions, as well as the long-term residual and societal consequences of various conventional generation technologies that are difficult to measure (e.g., airborne pollutants, greenhouse gases, etc.)"
- Is Nuclear Energy the Answer?
tder2012 at 22:27 PM on 1 July, 2025I'll just add a quick note about Estonia "the government has abandoned its goal of producing as much renewable electricity in Estonia by 2030 as is consumed domestically on an annual basis. Climate Minister Andres Sutt also stated that nuclear energy is now a priority"
- Fact brief - Was 'global warming' changed to 'climate change' because Earth stopped warming?
Bob Loblaw at 01:36 AM on 5 June, 2025Greenhouse effect, global warming, and climate change do indeed have different technical meanings, but common simplified usage does tend to add obfuscation - er, sorry, make things more confusing.
The Greenhouse Effect, as lynnvinc mentions, exists as a natural phenomenon. It relates to the atmospheric influence, as discussed by Charlie Brown, that leads to warmer surface temperatures than we would observe if there was no atmosphere.
It is a somewhat unfortunate term, as "the label "greenhouse" implies a similarity with actual greenhouses - and that was based on a misunderstanding of what keeps greenhouses warm. (Trapping air is more important than trapping IR radiation.)
At times, people have suggested using "the atmospheric effect" instead, but that has never caught on. At times, the human-cause changes in greenhouse gases have been referred to as "the enhanced greenhouse effect", but that is rather cumbersome and the "enhanced" part gets dropped.
As for "global warming" - that is the key easily-observed result of an enhanced greenhouse effect, but also can be caused by other factors. (CO2 dominates the current trends). On a global mean basis, surface temperatures will rise. It is not the only effect of an enhanced greenhouse effect, though. Precipitation changes are also critical. And many other weather phenomena. Seasonal changes and timing. Extreme weather events. Etc. Hence "climate change" is a much broader, more encompassing term. In the Venn diagram of climate, "Global warming " is a subset of "climate change", and "global warming" overlaps both the greenhouse effect and other causes of climate change.
On the myth of "they changed the name...", I took undergraduate climate science in the 1970s. The textbook we used was Sellers, W.D., 1965, Physical Climatology, U Chicago Press. Changes in atmospheric carbon dioxide are discussed in that book, along with other factors, under the chapter titled "Paleoclimatology and Theories of Climatic Change". My copy of the book is the one that I bought in 1978, so if "they changed the name..." then someone must have taken my copy off my bookshelf, altered the printing, and replaced it without me noticing.
- Sabin 33 #28 - How reliable is wind energy?
tder2012 at 11:03 AM on 17 May, 2025I don't care how grids get decarbonized, just get it done NOW. France did it 40 years ago by accident, only because they wanted energy security and independence, no fossil fuels to extract in France. Australia wants to do it with wind, solar, batteries, synchronous condensors, etc. I say go for it, get 'er done! Here are a few sites you can watch AUS grid generation mix, import, export between states, prices, etc (you can find sites like this for many other countries, states, etc but I like electricitymaps best as I am very concerned about CO2 and ghg emissions and I find its the best for showing that data. Also, it is a "one stop shop"). https://aemo.com.au/energy-systems/electricity/national-electricity-market-nem/data-nem/data-dashboard-nem & https://explore.openelectricity.org.au/energy/nem/?range=7d&interval=30m&view=discrete-time&group=Detailed & https://www.nem-watch.info/widgets/RenewEconomy/
Clean energy hits many roadblocks, often people ideologically opposed to them, we see this with solar, wind and also with nuclear. The No Nukes in the USA in the 70's were successful at blocking the build of nuclear power plants, but look at this article from US Energy Information Administration and see how much coal was built after 1980, fortunately they haven't build much since 2013. https://www.eia.gov/todayinenergy/detail.php?id=50658
We are only really talking about electricity here, which is 20-25 % of global energy production. Oil is barely a blip in global electricity production (mostly diesel generators in small remote communities and islands). New England in USA uses oil occasionally, they seem to encounter natural gas supply issues more than typical, this is an article on the New England Independent System Operator (NEISO) website. "Nuclear, oil, and coal generators are critical on the coldest winter days when natural gas supply is constrained (as shown below). Coal- and oil-fired resources also make valuable contributions on the hottest days of summer when demand is very high or major resources are unavailable".
Anyway, the point I want to make is that oil is barely a blip in global electricity generation, yet it is the number one source of energy generation in the world, as you can see on this Our World in Data website https://ourworldindata.org/grapher/global-energy-substitution?time=1970..latest Much decarbonization all over the world needs to be done in very short order.
- At a glance - What is causing the increase in atmospheric CO2?
StanRH at 02:27 AM on 13 May, 2025all this fuss about co 2 is comic farce;
every educated person knows co 2 can't affect climate
the reason is as follows;
"greenhouse" gases don't trap heat as they can't impede the circulation of warm air rising to subzero temps at altitude
if co 2 prevents radiant heat from leaving the atmosphere ,then it must also prevent the radiant heat from entering, by the same magical heat blocking process
it is the magnetosphere ,not co 2 that prevents the atmosphere from evaporating into the void of space
heat rises by convection regardless of mixture
by the time gases rise by convection to 25,000 ft the temp is down to - 40
besides which;
as a heat sink co 2 has nothing to do with atmospheric temperature regulation
only con artists still pretend co 2 can affect climate
Weight of atmospheric gases by volume at standard pressure and temperature
co 2 = 1.96 kg per stere x .04 percent =.000784 kg
o 2 =1.43 kg per stere x 21 percent = .303 kg
n =1.25 kg per stere x 78 percent= .975 kg
argon = 1.78 kg per stere x 1 percent = .0178 kg
Climate alarmists claim that the mass of .000784 kg of co2 governs the temp of the mass of 1.2958 kg of the other atmospheric gases
1652.806 times it's weight [mass]
visualize co 2 as 1 cup of water compared to other atmospheric gases as a 100 gallon [1600 cups] tank
that 1 cup at any temp u wish to chose dumped in the tank has negligible affect on the 100 gallons in the tank
couldn't be more evident ,could it?
- Medieval Warm Period was warmer
MA Rodger at 21:17 PM on 8 May, 2025The two Lüninget al (2019) papers linkedup-thread @273/274 are available in full - The Medieval Climate Anomaly in South America, and The Medieval Climate Anomaly in Antarctica. These will help the papers being used less selectively.
Thus in the South America paper we can read in its conclusions "A fully quantitative comparison of (medieval) and (present) temperatures is still complicated. Some sites suggest that the (present) may have been warmer than the (medieval), whilst others indicate the opposite."
Yet whatever an individual study (even when a review spanning a whole continent) may find, a bit of warming somewhere which coincides with the MWP or cooling coniciding with the LIA is surely no longer viable as some denialist rant. Consider this figure below from Kaufman et al (2020) 'Holocene global mean surface temperature, a multi-method reconstruction approach' . If we today have +1.5ºC AGW, where are we now on their Fig 3 below?
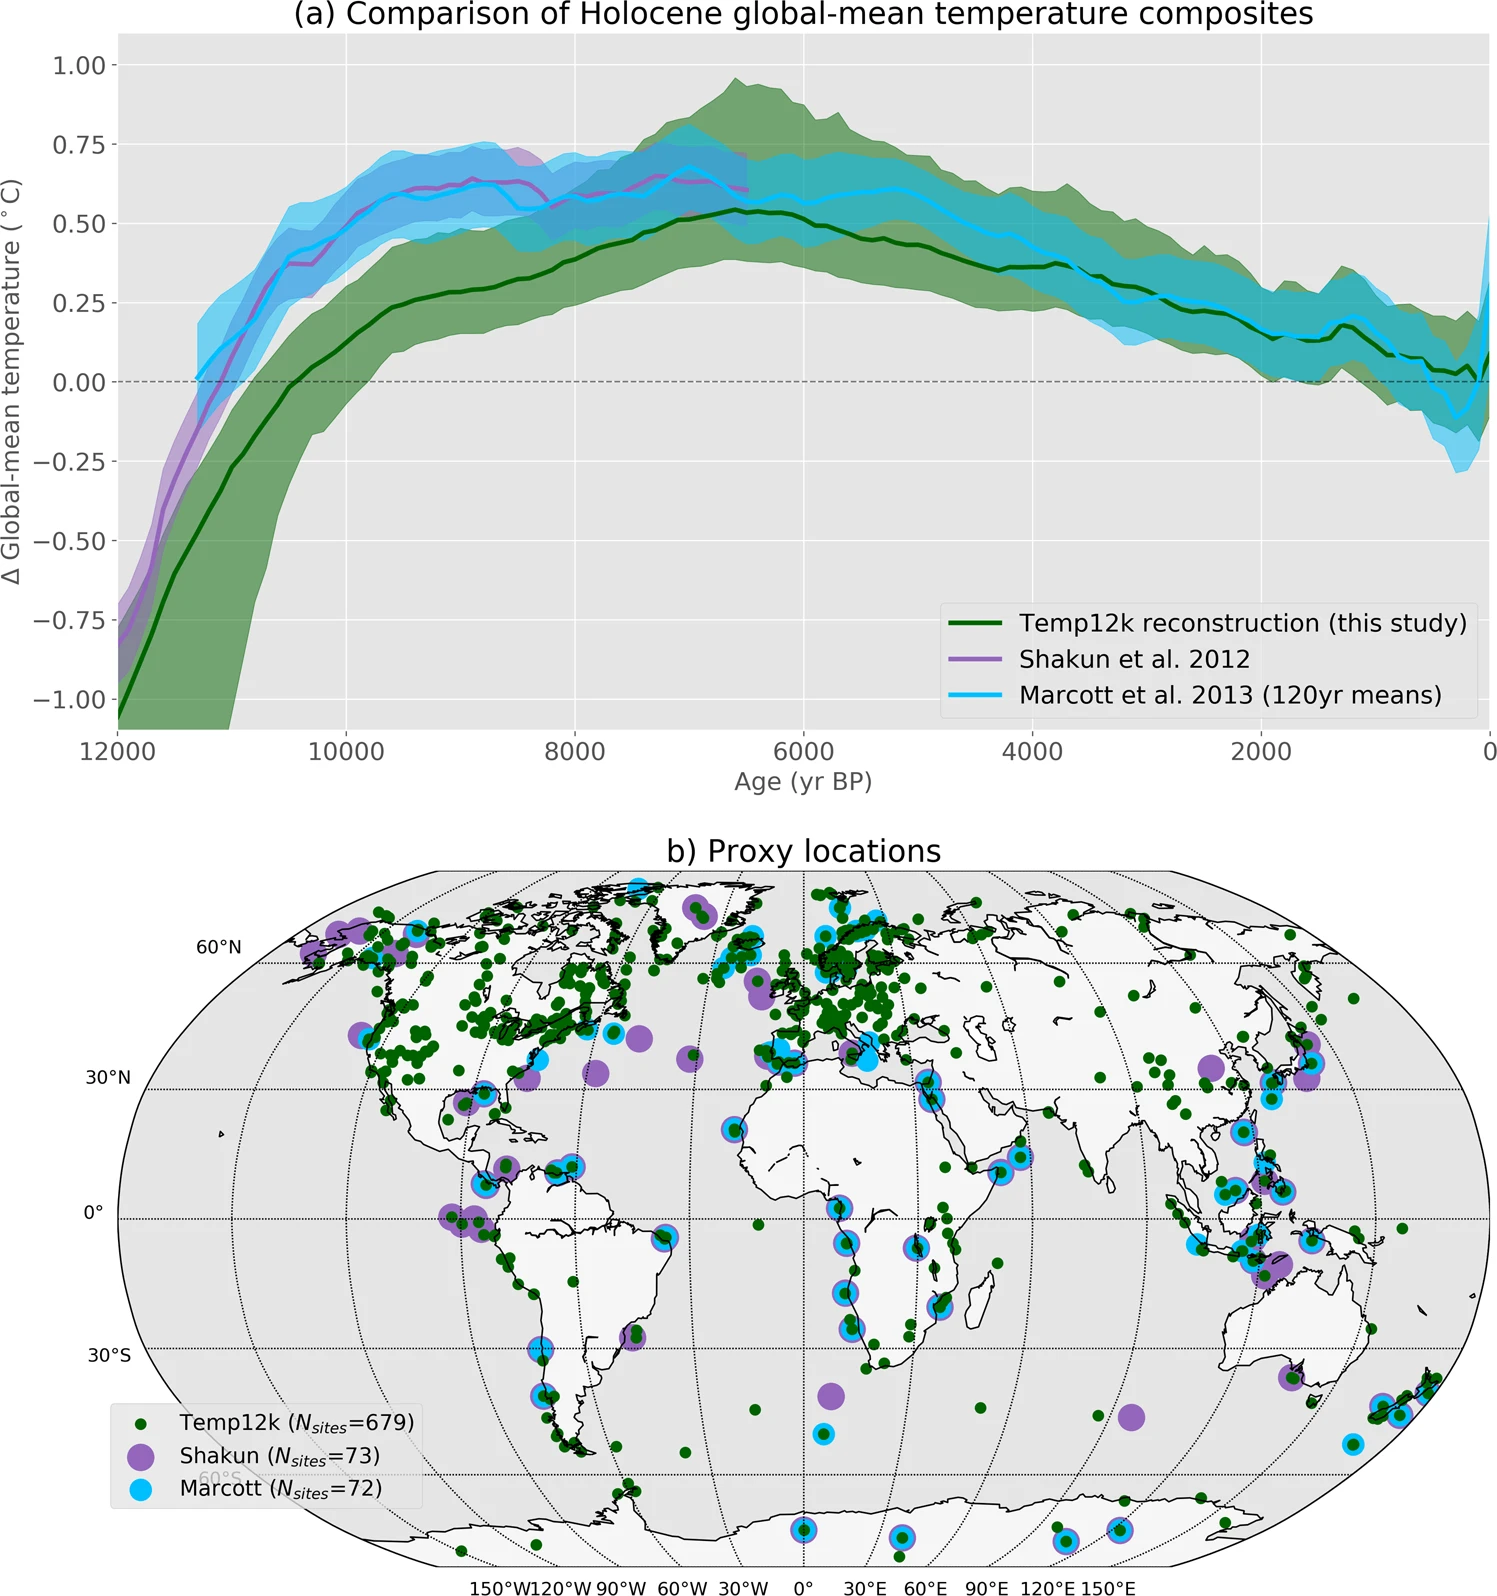
- Sabin 33 #13 - Is solar energy unreliable?
tder2012 at 09:07 AM on 7 May, 2025I agree, when will wind, solar and batteries be ready to be deployed and be able to readily supply their share of critical and required services such as synchronous inertia is completely unknown, therefore extremely risky to go down this path, considering we are in a climate and energy crisis and emergency. I am curious why you would ask about my assessments of future developments, as I am not an expert and predictions are difficult, especially about the future. However, I will share some links, one by Nate Hagens youtube channel Net Zero and Other Delusions: What Can't, Won't and Might Happen and from Fourth Energy Transition, About and The Energy Seneca.
- Sabin 33 #26 - Is wind energy good or bad for jobs?
Bob Loblaw at 23:58 PM on 4 May, 2025Eric @ 14:
Any offshore project involves different, and often more difficult, conditions and operation.
One major Canadian oil field is the offshore Hibernia field, east of Newfoundland. Considerable difficulties from the beginning, including exploration, drilling, and production. During drilling, a semi-submersible rig named the Ocean Ranger was lost during a storm in 1982, with 84 lives lost. The oil field came into production in 1997. The Hibernia production platforms are serviced by helicopters. Mechanical failure on one flight in 2007 resulted in the loss of 17 lives.
Even the "benign" offshore environment of the Gulf of Mexico has its issues. They have figured out how to deal with hurricanes, but the Deepwater Horizon oil spill demonstrated the difficulties of dealing with problems in an offshore environment.
You don't even have to go offshore to get more difficult working environments. I spent several years working in the area of permafrost and pipeline design in the north. The Trans-Alaska oil pipline was a much more difficult planning, construction, and operating task than pipelines in more hospitable environments. For natural gas, there have been a couple of proposals for pipelines to bring the Beaufort Sea gas reserves to the south: the Alaska Highway route, and the Mackenzie Valley route. Neither has been constructed, in large part because of the expense and technical difficulties. (I worked on both of these. I don't think that explains why they failed, though.)
To try to get back to the OP, which deals with job creation in a very general sense, it is clear that different projects, in different working environments, will have different work skills and requirements at all stages of exploration, planning, design, construction, and operation. Just counting "jobs" is a very simplified view of things. The devil is in the details. Once more, the myth that is being rebutted is the "wind and solar destroy far more jobs than they ever create" argument. The OP does that.
One can then argue about the quality of jobs, etc. But positions taken in that argument will probably depend on whose ox gets gored.
- 2025 SkS Weekly Climate Change & Global Warming News Roundup #14
One Planet Only Forever at 08:04 AM on 9 April, 2025This week’s news includes several items in the Climate Change Impacts category about the damaging impact of human-caused global warming and climate change on developed and developing global socioeconomic systems.
- Big Banks Quietly Prepare for Catastrophic Warming
- Global warming of more than 3°C this century may wipe 40% off the world’s economy, new analysis reveals
- Climate crisis on track to destroy capitalism, warns top insurer,
Those articles provide a basis for continuing a discussion here that started on the recent SkS reposting of “Climate skeptics have new favorite graph; it shows the opposite of what they claim”. The comment discussion had evolved away from the topic of the OP. The discussion had shifted to matters related to the development of sustainable improvements for the total global population, now and into the very far future.
The three articles listed above prompted me to expand on my semi-conspiracy theory about the development of opposition to the efforts to increase awareness and improve understanding of how people can be less harmful and more helpful to Others. (see my comment @22 and nigelj’s reply @23 on that SkS reposting linked above)
Additional considerations related to this week’s News items are:
Big Banks Quietly Prepare for Catastrophic Warming:
Quote:
“The recent reports — from Morgan Stanley, JPMorgan Chase and the Institute of International Finance — show that Wall Street has determined the temperature goal is effectively dead and describe how top financial institutions plan to continue operating profitably as temperatures and damages soar.”
Related thoughts:
This suggests that some people who know better are not powerfully raising awareness and improving the understanding of the general population. They are trying to maximize their collective benefit in spite of knowing how harmful their lack of action to limit the global harm done will be. It is like the way that the 2008/9 global financial disaster turned out to be beneficial for many of them (very few of them faced a negative change of status relative to Others – many of them increased their status relative to Others). The least fortunate who got little benefit from the sub-prime mortgage scams suffered the most.
Global warming of more than 3°C this century may wipe 40% off the world’s economy, new analysis reveals
Quote:
“Any impacts from weather events elsewhere, such as how flooding in one country affects the food supply to another, are not incorporated into the models.
Our new research sought to fix this. After including the global repercussions of extreme weather into our models, the predicted harm to global GDP became far worse than previously thought – affecting the lives of people in every country on Earth.”
Related thoughts:
A group of people today have proudly watched a 10% hit happen to global economic activity in a matter of a few days. They think they will be the winners. Everyone will lose because of the unjustified tariff attacks. But the likes of Trump probably think they will suffer less harm that Others will. Some of them may even believe they will benefit from the inequitable unjustifiable actions (paying members of Trump’s Mar-a-Lago Cult could have an unfair advantage if they heard about what the Trump Administration would actual do before it became public knowledge). These type of people would have even less concern about actions they benefit from causing 40% harm to the future economy Others have to live with.
Climate crisis on track to destroy capitalism, warns top insurer
Quote:
“The insurance sector is a canary in the coalmine when it comes to climate impacts,” said Janos Pasztor, former UN assistant secretary-general for climate change.
The argument set out by Thallinger in a LinkedIn post begins with the increasingly severe damage being caused by the climate crisis: “Heat and water destroy capital. Flooded homes lose value. Overheated cities become uninhabitable. Entire asset classes are degrading in real time.”
“We are fast approaching temperature levels – 1.5C, 2C, 3C – where insurers will no longer be able to offer coverage for many of these risks,” he said. ...
“This applies not only to housing, but to infrastructure, transportation, agriculture, and industry,” he said. “The economic value of entire regions – coastal, arid, wildfire-prone – will begin to vanish from financial ledgers. Markets will reprice, rapidly and brutally. This is what a climate-driven market failure looks like.”
Related thoughts:
All of the resistance to the achievement of Sustainable Development Goals, not just resistance to efforts to limit the harm done by climate change impacts, is raising doubts about, and reducing the sustainability of, capitalism (and democracy – given the recent authoritarian ‘winning of unjustified popular beliefs and related abusive power’ in many democracies).
The following time-line of events is part of the basis for my semi-conspiracy theory about the reasons there is such a powerful resistance to learning to be less harmful and more helpful to Others. (note that there are many similar things along the timeline ... since the beginning of recorded human history and more recently)
- 1913 – US 16th Amendment ratified allowing Congress to impose an Income Tax. (Still resisted by many wealthy and influential people who almost certainly know that their resistance is harmfully incorrect. Also resisted by people who are less aware or misunderstand things and have unjustified doubts about the benefits of an Income Tax because they are easily tempted to be misled that way)
- 1933 – 1938 – US New Deal series of reforms (Resisted - See above)
- 1948 – UN Universal Declaration of Human Rights (Resisted - See above)
- 1962 - Silent Spring first published (Resisted - See above)
- 1964 - US Surgeon General report regarding smoking (Resisted - See above)
- 1965 – UN Development Programme - evolved from UN programs that started in 1949 (Resisted - See above)
- 1972 - Stockholm Conference – identified many harmful developed human impacts (Resisted - See above)
- 1990 – IPCC first report (Resisted - See above)
- 2020 – COVID19 – (Influential people opposed to learning to be less harmful and more helpful to Others found new ways to maximize their ability to benefit from being misleading)
Constantly improving global civilization is not a guarantee. It is very hard work to limit the harm done by people who resist learning to be less harmful and more helpful to Others. They know better, but do not care about how harmful their actions and lack of actions are.
- Greenhouse effect has been falsified
Bob Loblaw at 00:02 AM on 3 April, 2025Reed Coray @ 194: "If ... my arguments are flat wrong and can be dismissed out of hand."
As Dikran points out explicitly, in #197: yes, your arguments are flat wrong.
As I pointed out in #190: "Reed Coray has utterly failed to explain the distinction between his undesirable 'trap heat' and his preferred 'warm the Earth's surface'."
Getting to definitions: heat = thermal energy. Average thermal energy is expressed by temperature. When thermal energy increases in an object, that object's temperature goes up - it "warms". When a system redistributes energy in a manner where some part of the system retains more thermal energy that before, it is perfectly reasonable to colloquially say "that part of the system has trapped heat".
...unless, as I pointed out in #188, "...you create such a strict literal meaning to the words 'trap heat' that is unjustified."
As for my closing paragraph in # 190, which begins with "Reed Coray's argument is a pig in a poke.": I obtained that list of roughly equivalent phrases from Wiktionary. In addition to providing the meanings of words, Wiktionary (or many other dictionaries) will also provide a list of synonyms or "see also" references. In other words, it provides some of the function of a thesaurus. It also lets you search for the meaning of common phrases, rather than just single words.
Try starting with its definition of "blow out of proportion". Follow the links under "Synonyms" and "See also". Then repeat with each of those listings to find additional similar phrases. You should be able to eventually find all the phrases I used at the end of #190.
Are all those phrases identical? No. Do they have identical meaning? No. As you read the definitions/origins/explanations, you will see that there are subtle differences.
...but any one of them can be considered a reasonable description of what you have been doing in in an attempt to tar all of climate science over some misguided idea that "trap heat" is physically impossible. You even go as far as saying (in #187) that use of 'trap heat' "...is designed to mislead others and is spread with the intent to manipulate truth and facts".
That's awfully thin ice you are skating on.
- China will need 10,000GW of wind and solar by 2060
One Planet Only Forever at 06:30 AM on 29 March, 2025wilddouglascounty,
Good questions.
I am a civil/structural engineer with an MBA. I have confidence in the use of models to analyze and evaluate plans. The same is done for engineered items and business opportunities. Today’s socioeconomic models are quite advanced. My university engineering education in the 1970s included a course on ‘Technology and Society’ where we used socioeconomic computer analysis models to investigate different approaches to socioeconomic development (using ‘state-of-the-art’ keyboards with dot-matrix printers as the interface devices).
My main question is: What specific monitoring will be performed to ensure that things happen as planned? When planning structures and business opportunities the model analysis is important. But it is more important to monitor, and enforce corrections as required, to ensure that the plan is being diligently and successfully turned into the desired reality. The article mentions the need for a ‘new legal system’. ‘New legal systems’ do not guarantee effective monitoring and correction (evading legal consequences is a proven ‘strategy for success’).
Indeed, it is challenging for Western socioeconomic political systems (systems based fundamentally on competition for profit and popularity with freedom of actions) to produce a collaboratively developed plan that is effectively monitored and corrected as required to ensure that ‘the desired result’ develops. It is especially difficult if the path to the desired result could be ‘less profitable or less popular’. But that monitoring and enforcement of compliance can also be hard to do in a socioeconomic system like the one in China that interacts with the world system (It is not an isolated stand-alone system).
The following additional questions came to mind as I read the article:
The plan is stated to be ‘net-zero’ before 2060. But the plan still has a significant amount of fossil fuel use in 2060. What is the plan to effectively neutralize the energy system emissions in 2060 (to be ‘net-zero’)? Note that CCS reduces ghg impacts, but does not make them zero. What are the plans for neutralizing ghg impacts of other activities in China like agriculture (also needed for China to be net-zero)?
A significant challenge for effectively limiting harm done by activities under the control of China’s leadership, or any other leadership group, is: Getting all of the most powerful and influential players to learn to be less harmful and more helpful to Others even if that 'learning' compromises their potential opportunity for benefit.
- Do Americans really want urban sprawl?
Eric (skeptic) at 23:03 PM on 18 March, 2025
It is possible to make car-centric areas more walkable, however, Rodriguez said, offering his own community of Tysons, Virginia, a suburb of Washington, D.C., as proof.
Tysons Corner is ok Tysons Corner via Google Maps
Reston Town Center is more attractive IMO. Reston Town Center via Google Maps
Merrifield near where I used to live is another transit-oriented mixed development with less success. Merrifield
Transit hubs heading towards Rosslyn and DC get increasingly sterile. The problem in general is too much pavement. Wildlife consists of house sparrows, pigeons and periodic large flocks of starlings.
The pandemic changed things although transit is picking up again. I live in a subdivision with 5 acre lots. My nearest strip mall is about 12 miles away but it's fairly efficient to go just once a week. Work is 75 miles and I go once a week out of habit more than anything else.
It boils down to the basic human need of in-person social interaction. I know most of the neighborhood walkers and dog walkers and visit a few friends within 20 minutes. Monthly coin club meeting in person and HOA every other month. The rest is online or text and that's kind of inadequate. The reason for walkability is not because you have to but because you want to.
If you work from home here in Northern Virginia and want to be walkable but within driving distance for an occasonal commute you might choose Charlottesville or many other smaller towns away from the city.
- Visualizing daily global temperatures
MA Rodger at 20:45 PM on 17 March, 2025michael sweet @2,
Firstly, the methodology used to establish an anomaly base 1850-1900 is not entirely robust, given ERA5 methods only allows a full re-analysis back to 1979. Their re-analysis back to 1940 is probably reasonable but by the earlier period the different records (GISS [which they don't use], NOAA, BEST, HadCRUT) are starting to diverge. They use an annual cycle for 1850-1900 which adds an off-set to 1991-2020 daily anomalies of between +0.79°C and +0.97°C. A table of the calculated-&-smoothed monthly off-sets is provided HERE in the 'Reference periods and other time-related definitions' dropdown.
The annual off-set is given as 0.88°C (with an uncertainty range given as +0.72°C to +0.99°C). That makes the magic annual 1991-2020 threshold anomaly as +0.62°C. The running 12-month average has been above that level since the year ending Jan 2024 and well-above since March. So in terms of the threshold, that uncertainty becomes entirely academic rather quickly.
Secondly, the number of days with a +1.50°C 1850-1900 anomaly will be dependent on the size of the wobbles/noise within the daily temperatures. Adding the annual off-set cycle, the number of days shown by ClimatePulse in 2024 above the magic +1.49°C theshold was 276. So 90-ish days were recorded below the +1.50°C theshold. Your 'above +1.74°C' threshold shows 52 days above.
The monthly averages are perhaps a more meaningful measure and prior to the 2023 "bananas" event ERA5 gives 5 months above the +1.50°C theshold (Jan to Mar 2016, Jan to Feb 2020) and only one month below since July 2023 (tat month being July 2024).
- Sabin 33 #17 - Does low-frequency noise from wind turbines cause 'wind turbine syndrome'?
David-acct at 21:38 PM on 28 February, 2025Quite a few studies [snip]
provide much better context of wind turbine noise than the SK rebuttal article.
Much is made in the article of A/C's, refrigerators, etc producing higher noise levels, Two key points are omitted.
A/c's and refrigerators operate at only a fraction of the time of windturbines ie 24/7/365
Its both the decibel level and frequency that matters, not just the decibel level.
www.nature.com/articles/s41598-021-97107-8
- Sabin 33 #15 - Does EM radiation from wind turbines pose a threat to human health?
David-acct at 11:02 AM on 16 February, 2025Quite a few studies provide much better context of wind turbine noise than the SK rebuttal article.
[snip]
Much is made in the article of A/C's, refrigerators, etc producing higher noise levels, Two key points are omitted.
A/c's and refrigerators operate at only a fraction of the time of windturbines ie 24/7/365
newer fridges operate at 32-40 dbs.
windmills dbs are inaddition to other noises, so 40-40dbs for the windmill 24/7 plus the fridge, plus the ac with run 1/3 to 1/5 the time vs all the time.
Context is important so that you are confused.
Its both the decibel level and frequency that matters, not just the decibel level.
Incomplete and partial information will lead to erroneous assumptions and impresssions.
www.nature.com/articles/s41598-021-97107-8
www.sciencedirect.com/science/article/pii/S1364032122006852
todayshomeowner.com/eco-friendly/guides/how-loud-are-wind-turbines/
https://www.nature.com/articles/s41598-021-97107-8
https://www.sciencedirect.com/science/article/pii/S1364032122006852
https://todayshomeowner.com/eco-friendly/guides/how-loud-are-wind-turbines/
- Antarctica is gaining ice
John Hartz at 08:19 AM on 13 February, 2025Suggested supplemental reading:
Introductory text:
"Social media posts sharing a graphic comparing sea ice levels in the Antarctic on the same date 45 years apart misrepresent the data to suggest climate change is a hoax.
The graphic, opens new tab depicts two authentic maps of the continent from the University of Colorado Boulder’s National Snow and Ice Data Center (NSIDC), one labelled as 'Sea Ice Extent, 24 Dec 1979' and the other 'Sea Ice Extent, 24 Dec 2024,' with white regions indicating sea ice.
'Antarctic sea ice extent is 17% higher today than it was in 1979. Ice doesn’t lie, but climate scientists do,' the text reads."
Verdict:
"Misleading. The posts cherry-pick specific dates that misrepresent Antarctic sea ice trends and ice dynamics that are influenced by multiple factors beyond global warming."
by Staff, Reuters Fact Check, Feb 11, 2025
- Moving away from high-end emissions scenarios
MA Rodger at 00:02 AM on 25 January, 2025To put some other numbers into this interchange.
Regarding rates of emissions:-
The Global Carbon Project give data for the various fossil fuel types going way back. Their budgets back to1959 also show numbers for Land Use Change emissions (as well as the ocean absorption and the land absorption).
The 1980 wobble in emissions resulted from the 1970s oil crisis driving efficiency measures but the high 1970s oil price led to over-production and what was called the "1980s oil glut" thus ending the wobble. I'm not so sure about talk in that link of a slow-down in economic growth also being a factor as use of gas and coal doesn't seem to have shown any signs of this oil-use wobble and continued apace (as this OurWorldInData graph shows).
Regarding atmospheric levels:-
The Land Use Change emissions are a significant part of global emissions and when added to FF emissions allow the calculation of the Atmospheric Fraction (Af) which is the annual ration (Atmospheric increase)/(Man-made emissions). This has remained pretty constant since the 1960s altough there is no underlying reason for it**.
The land-based absorption provides the lion's share of the wobbles in the Af with El Niño the primary wobble-driver.
(**If an emissions-free world had a single emissions event, the annual absorption in Year 1 would be about 3% and through following non-emissions years the annual absorption would slowly decrease to zero over a millenium. How much atmospheric CO2 then remained would depend on the size of the emission - so roughly 25% remaining if the emission event was 600Gt(C), this the very rough size of our cumulative emissions to date.)
- Moving away from high-end emissions scenarios
Evan at 06:09 AM on 24 January, 2025Nigelj@11
I also recall that during the 1990's the UK was making a large-scale shift from using coal to using natural gas in their "Dash for Gas". Also, France made a large-scale shift towards nuclear power in the 1980's and 1990's. Then Mt. Pinatubo blew in 1991, and from what I understand, the temporary cooling caused a drop in atmospheric CO2 concentrations due a variety of factors, such as increased uptake by cooler oceans. All of this was a temporary bump, and there were likely other factors that you pointed out, which together caused a temporary slowdown in the buildup of atmospheric CO2.
https://en.wikipedia.org/wiki/Dash_for_Gas
https://en.wikipedia.org/wiki/Nuclear_power_in_France
- Moving away from high-end emissions scenarios
nigelj at 05:41 AM on 24 January, 2025Evan @10
Your explanation for the apparent acceleration in the acceleration of CO2 levels recently looks right. Looks like its not a real acceleration.
I was curious why there was a flattening in the growth rate of atmospheric CO2 growth around 1980 - 2000. This coincides with a slowing in the rate of CO2 emissions growth over the same period, and a global flattening off in oil production from 1980 - 2000 approx. ( See links below). I recall this was the time period when smaller cars became popular so presumably the net result from flattening oil production was a slower rate of emissions growth.
Im not sure why oil production slowed over that 1980 - 2000 period, but it followed the OPEC oil crisis of the late 1970s which caused a temporary drop in oil production, and one source talked about a decline in output from the big existing oil fields in Saudi Arabia. But after the 2000s global oil production was back to business as usual, presumably as the OPEC oil embargo had ended, and new oil field discoveries were made, and there was Americas oil fracking boom.
www.statista.com/statistics/276629/global-co2-emissions/
- Moving away from high-end emissions scenarios
Evan at 22:32 PM on 23 January, 2025RickyO@9,
The CO2 graphs at the link you provide provide a possible explanation to the apparent acceleration of atmospheric CO2 concentration suggested by my plot of the data. The NOAA graph of global increase by decade (see below) shows that in the 1990's, the rate of increase decreased a small amount from that in the 1980's. Further, the increase from the 1960's to the 1970's was about 0.5 ppm, almost the same as what it was from the 2000's to the 2010's. Therefore, perhaps it is the decrease in the 1990's that affects my plot and suggests an apparent increase in the rate thereafter. Although I've seen this NOAA data before, thanks for bringing it to our attention again.
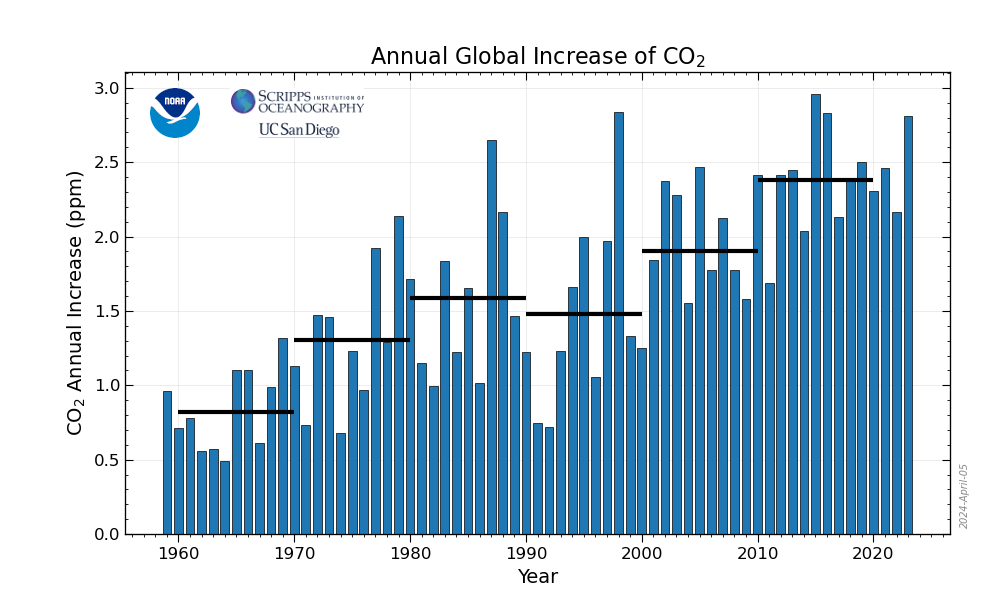
Lan, X., Tans, P. and K.W. Thoning: Trends in globally-averaged CO2 determined from NOAA Global Monitoring Laboratory measurements. Version Monday, 06-Jan-2025 10:06:16 MST https://doi.org/10.15138/9N0H-ZH07
- Moving away from high-end emissions scenarios
Evan at 09:14 AM on 21 January, 2025The article states,
"... growth in CO2 emissions slowed notably over the past decade ..."
When I plot atmospheric CO2 concentrations from 1970 to 2005 using 10-year moving averages, it shows an upward accelerating curve. When I plot the 10-year averages for 2010, 2015, and 2020 (which includes the data for 2025) the data points sit above the extrapolation of the 1970-2005 curve.
If "... growth in CO2 emissions slowed notably over the past decade ...", why is the Keeling curve currently accelerating upwards as fast or faster than it has since the 1970's?

- Skeptical Science New Research for Week #1 2025
One Planet Only Forever at 08:36 AM on 12 January, 2025There is a follow-up report from NPR for the item I linked in my comment @15.
NPR – Special Series - Untangling Disinformation: “Meta built a global fact-checking operation. Will it survive?” by Huo Jingnan, Shannon Bond, includes the following quote that is related to the evidence that David-acct repeatedly claimed that efforts to raise awareness about, and limit the harm done by, misinformation are ‘censorship’.
In a video announcing the change, Zuckerberg said fact checking contributed to "censorship" on Meta's platforms and that fact checkers were too "politically biased." Fact checkers point out it is the company, not them, that decides how to police posts on Facebook and Instagram.
"I'm just a simple European but…the United States seems to be the only country in the world where adding information is seen as censorship," said Maarten Schenk, Lead Stories chief operating officer and co-founder.
"Far from censoring, fact-checkers add context," said Laura Zommer, co-founder and CEO of Factchequeado, a nonprofit, Spanish-language fact-checking site that is not part of Meta's program. "We never advocate for removing content. We want citizens to have better information so they can make their own decisions," she added.
Note: The other items presented in the NPR – Special Series - Untangling Disinformation are very informative.
- Skeptical Science New Research for Week #1 2025
David-acct at 09:56 AM on 9 January, 2025In reply to Nigj, One planet and Bob - The topic of this thread is misinformation.
First I will acknowledge a typo in my original comment - The raw data is from Florida and Ohio not Texas and Ohio.
With that correction, This thread has turned out to be a classic example of how easy it is to get fooled by misinformation. Especially when the misinformation fits the person's biases.
Its not difficult to perform a basic level of due diligence from the raw data provided in the supplemental table
per capita death rates from the raw data:
Florida
65-74 age group Dem 4.4453%, Republican 4.1073%
75-84 age group - dem 11.1003% Rep 10.9481%
85+ age group - dem 26.9213% Rep 29.2353%
25-64 age group - dem 0.9532% rep 0.97043%
Ohio
65-74 age group Dem 5.985%, Republican 5.1432%
75-84 age group - dem 15.5005% Rep 14.3840%
85+ age group - dem 39.6232% Rep 40.1578%
25-64 age group - dem 1.2696% rep 1.0879%
In addition to the raw data conflicting with the conclusion, there are other glaring problems that should have been easily recognizable by anyone with basic scientific knowledge.
a) Its well known that computing excess deaths is subject the wide variability based on the methodology used.
b) its well known that using a short base period is problematic, A 5 year base period has well known problems. The professional literature calls for a minimum 10 year base period. This study uses a 4 year base period.
C) Its simply implausible that deaths by party affiliation is sufficiently accurate for either the base period or for the covid period, therefore any conclusion on excess deaths by party should be suspect.
All three of those issues, along with the raw data that conflicts the conclusion should have raised massive red flags, yet large segments of the population got fooled by misinformation.
- Skeptical Science New Research for Week #1 2025
Bob Loblaw at 08:09 AM on 8 January, 2025One further bit of "due diligence" (for now).
David-acct said in comment 2 (emphasis added),
"Per capita death rates for Democrats exceeded per capita death rates for republics [Republicans?] in all categories in both states except for the 85+ age group in Ohio and Texas."
He cited eTable 1 in Wallace et al (2023).
- The three column titles in eTable 1 are Florida, Ohio, and Total.
- For Florida, ages 25-64, the death counts per capita (Panel B, Mortality data, divided by panel A, Voter age distribution) are:
- Democratic 0.009532 (0.9532%)
- Republican 0.009704 (0.9704%)
I am not a geographer (oh, wait, actually I am...), but I don't think that Florida and Texas are the same state. Mark one for attention to detail.
...and it looks like the per capita death rate for Republicans aged 25-64 is a smidge higher than for Democrats. Of course, if you round it off to one significant figure 0.009532 and 0.009704 both round to 0.01 (1%). David-acct (or the secondary sources he is using) may want to try argue that the difference is not significant, but it is misinformation to claim that the Democrats number exceeded the Republicans number for that age category in Florida.
- Climate news to watch in 2025
Evan at 07:35 AM on 7 January, 2025nigelj, there is another way to look at this. Not based on temperature, but looking at what atmospheric CO2 concentrations are doing. It is no secret that CO2 concentrations have been accelerating upwards since David Keeling started measurements in the late 1950's. Accelerating is the term his son, Ralph Keeling, uses to describe the trend.
But CO2 may be more than accelerating upwards. If you take 10 year moving averages of CO2 from 1970 to 2005, it forms a smooth, upward curve depicting the upward acceleration. If you then use that curve to extrapolate forward to see where we should end up if the upward acceleration continued, what actually happens is that the concentrations for 2010, 2015, and 2020 lay above that already upward-accelerating curve!
This despite the Great Recession, the Covid Pandemic, and the recent, rapid growth of renewables and EVs. People focus on the rapid growth of renewable energy and the increasing deployment of EVs, but neglect to notice that fossil-fuel use continues to increase. Plus other second-order effects likely driven by environmental feedbacks.
Bob's reference is likely far more authoritative than my comments, but the graph I provide hints (there is too little data in the CO2 record to prove that CO2 is accelerating upwards) that the third derivative of CO2 concentration could be positive. CO2 would then not just be accelerating upwards, but the acceleration rate would be increasing.
- At a glance - Is the CO2 effect saturated?
Bob Loblaw at 00:44 AM on 6 January, 2025Thanks for that update, Charlie Brown.
I quick search over at PubPeer finds this short page with a few comments, including the retraction notice:
- The forgotten story of Jimmy Carter’s White House solar panels
One Planet Only Forever at 06:17 AM on 4 January, 2025Eric (skeptic) @5,
Regarding your point that “Some cost per metric ton of CO2 seems appropriate.” There are many other ‘externalities’ to be considered in order for EROI evaluations to not result in unsustainable harmful developments. But I will limit my response to carbon pricing and include points regarding the 1970s.
The appropriate carbon pricing value depends on the circumstances being evaluated. An example evaluation is provided in the Queen’s Gazette’s: The Conversation - “Carbon pricing alone is not enough to meet Paris Agreement targets”: By Sean Cleary, Queen's University, and Neal Willcott, Queen's University, December 20, 2023. It includes the following:
“We found that while carbon pricing on its own could limit global warming to 2.4 C, the global price would have to rise dramatically and rapidly to accomplish this. The price would have to start at $223.31 per tonne in 2023 and increase to $435.55 per tonne by 2045.
“While such an abrupt global policy change is unlikely, the price would not need to be so high if it was accompanied by other measures, including regulations that provide clarity and stability regarding green investments, clean technology subsidies and financing mechanisms (such as those facilitating transition investing by companies).”
Note that the above pricing is in Canadian dollars. And the evaluation’s methodology would result in an even higher pricing, and/or more significant other measures, being needed to achieve a 1.5 C limit. For comparison, the IPCC evaluation indicates (based on Google’s current AI summary) that the carbon price required to limit the harm to 1.5 C is US$170 (~ CAN$230) by 2030 and US$430 (~ CAN$590) by 2050.
However, it is important to understand that a correction of what has developed is required. And earlier and more significant ‘effective harm limiting action’ reduces the required magnitude of future corrective actions. So, an appropriate carbon price for starting the correction in the 1970’s would be lower. However, it could be argued that in the 1970’s there was an understandable possibility of limiting the harm done to be below 1.0 C. And achieving a lower level of future harm would require higher pricing. And most important is understanding that to properly develop sustainable improvements the developed actions, and corrective actions, need to be effectively harmless. A related essential understanding is that reducing undeserved (obtained in ways that are harmful) perceptions of superiority or advancement is ‘not harmful’. That objective understanding would require even higher pricing and more significant ‘other measures’, even in the 1970s.
The real challenge is getting people to appreciate that what has been developed is massively harmful and undeniably unsustainable (proven by the Stockholm University: Stockholm Resiliency Centre’s evaluation of Planetary Boundaries - linked here). In many cases the developed perceptions of superiority are massively undeserved. And the magnitude and required rate of the required corrections of developed perceptions of superiority and advancement increases as the required corrections are delayed by successful misinformation campaigns promoting misunderstandings and limiting awareness.
- The forgotten story of Jimmy Carter’s White House solar panels
Bob Loblaw at 00:37 AM on 3 January, 2025Eric:
The technology has certainly changed since 1979, and in 1979 the economics may not have been all that favourable, but I'm not sure I would call that decision "virtue signalling". In the early development stages of any technology, there is often a "sell it at a loss" strategy to get the market going (and growing), with expectations that the technology and economics will both improve over time.
Even GM, with the Chevrolet Bolt, apparently expected to lose money on production in the first few years. According to this Wikipedia page (information not confirmed by GM), they expected to lose $8-9K per vehicle at the start, and only expected to reach profitability in 2025. (Feel free to speculate why they stopped production, or why they started production on a money-losing proposition).
...and Tesla did not make profit until 2020 (and didn't turn a profit, excluding Bitcoin and regulatory credits, until June 2021). (https://en.wikipedia.org/wiki/Tesla,_Inc.#Finances). That's 15 years of losing money. Does Elon Musk strike you as someone that is into "virtue signalling"?
- Stop emissions, stop warming: A climate reality check
nigelj at 05:49 AM on 25 December, 2024rkolph@8
You said: "Virtually no serious scientists think that global warming is an existential threat. "
Some well qualified scientists do think climate change is an existential threat to humanity:
phys.org/news/2023-10-life-earth-existential-threat-climate.html
You said "Mainstream researchers anticipate global warming contributing perhaps a quarter percent to the excess death rate by mid-century and costing us 2.5% of GDP by 2100, making global warming less serious than many other world problems that have received far less attention."
Note that no researchers are named. You invariably find its the economist William Nordhaus. Just look up his wikipedia entry and read the expert criticisms of his DICE eoconomic model of climate change, near the end of the article. His assumptions are often unrealistic and he leaves out entire aspects of climate change like sea level rise.
One thing. He assumes quite high levels of economic growth in the future will offset climate problems. However economic growth has slowed relentlessly in developed countries since the 1970s until presently, with every sign developing countries will follow that trend later this century, and we live in a world of finite resources, with many fast being depleted and we have many countries with aging demographics and market saturation. This suggests future global economic growth will be low.
And thats before you consider the negative impacts of climate change on economic growth. Some experts calculate it will be considerably more than Nordhaus assumes:
"The largest impact of climate change is that it could wipe off up to 18% of GDP off the worldwide economy by 2050 if global temperatures rise by 3.2°C, the Swiss Re Institute warns."
www.weforum.org/stories/2021/06/impact-climate-change-global-gdp/
18% is huge and would severely impact the world. And this is still based on middle range warming estimates, and assumes critical tipping points won't be crossed.
- Fact brief - Are we heading into an 'ice age'?
nigelj at 05:04 AM on 23 December, 2024The Time magazine cover from 1977 featuring a photo of a penguin with the headline, “How To Survive The Coming Ice Age” was a fake:
apnews.com/article/fact-check-time-magazine-global-climate-fabricated-cover-944714514495
In the 1970s a small number of scientists thought there might be a flat or cooling trend in coming decades but the majority of published research around the 1940s - 1970s predicted there would be a global warming trend in coming decades (which there was)
skepticalscience.com/ice-age-predictions-in-1970s.htm
I actually did a couple of papers in physical geography at university back in the early 1980s. One of the textbooks was Atmosphere ,Weather and Climate by Barry and Chorley, a 1971 edition, and the chapter on climate change did not say the scientific community was predicting a coming cooling trend or ice age. It said global temperatures had been flat from the 1940s to 1970, and it was uncertain what would happen in the coming decades. I still have this textbook.
- Fact brief - Are we heading into an 'ice age'?
AdriantheHistorian at 02:01 AM on 23 December, 2024Skeptical Science asks that you review the comments policy. Thank you.
[snip]
The New Ice Age was Promoted and a 'Fact' back in the 1970's to get President Nixion to Create the EPA. Enviromental Protection Agency.
https://www.bing.com/ck/a?!&&p=a708972a8ba8ce15990b406eec8dd8eeef261a471c38752311e038ee709c5666JmltdHM9MTczNDgyNTYwMA&ptn=3&ver=2&hsh=4&fclid=1c8ee8b9-4b23-6ade-3488-fbd14a996bb8&u=a1L2ltYWdlcy9zZWFyY2g_cT1waWN0dXJlcytzaG93aW5nK3RpbWUrbWFnYXppbmUrY292ZXJzK3dpdGgrdGhlK25ldytpY2UrYWdlJnFwdnQ9cGljdHVyZXMrc2hvd2luZyt0aW1lK21hZ2F6aW5lK2NvdmVycyt3aXRoK3RoZStuZXcraWNlK2FnZSZGT1JNPUlHUkU&ntb=1
- Fact brief - Are we heading into an 'ice age'?
AdriantheHistorian at 01:32 AM on 23 December, 2024Skeptical Science asks that you review the comments policy. Thank you.
[snip]
TODAY!......... Climate Shift. ..??.. DID the “NEW ICE AGE”, Climate Fanatics of the 1970’s CAUSE the so-called, “Climate Shift” Crises of Today?
(Scientists say sprinkling diamond dust into the sky could offset almost all of climate change so far — but it'll cost $175 trillion)
Story by Sascha Pare 12-19-2024
Sprinkling diamond dust into the atmosphere could offset almost all the warming caused by humans since the industrial revolution and "buy us some time" with climate change, scientists say.
[This is Funny as the ''Climate Craze'' back in the 1970's was the New Ice Age..... Yes ''they'' said that Pollution (partials) were being thrown up into the upper atmosphere and causing the suns light to be reflected back into space., This was causing a New Ice Age to destroy the Earth.
Note; To STOP this New Ice Age, the USA went 'seriously' into protecting the 'Environment' way back in the 1970's with President Nixon signing the Environmental Protection Act (EPA) into law.
Today the USA only produces as much steel as it did in 1950, this is as an example of those EPA efforts.
High Gas Prices?.. EPA will Not allow a New Oil refinery to be built in America.
Etc. Etc.
And this is also a major reason for the loss of Millions of very good paying jobs, I might add. 'clean', comes with a very steep 'price'.]
Continued.
New research indicates that shooting 5.5 million tons (5 million metric tons) of diamond dust into the stratosphere every year could cool the planet by 1.8 degrees Fahrenheit (1 degree Celsius) thanks to the gems' reflective properties. This extent of cooling would go a long way to limiting global warming that began in the second half of the 19th century and now amounts to about 2.45 F (1.36 C), according to NASA.
The research contributes to a field of geoengineering that's looking for ways to fight climate change by reducing the amount of energy reaching Earth from the sun.
https://www.msn.com/en-us/weather/topstories/scientists-say-sprinkling-diamond-dust-into-the-sky-could-offset-almost-all-of-climate-change-so-far-but-it-ll-cost-175-trillion/ar-AA1w6MuP?ocid=msedgntp&pc=HCTS&cvid=2dfb5c2f1669448799854ec819ce98bf&ei=43
- Stop emissions, stop warming: A climate reality check
nigelj at 05:54 AM on 20 December, 2024AdriantheHistorian said: "Today the USA only produces as much steel as it did in 1950, this is as an example of those EPA efforts."
Not necessarilly. This is from "History of the iron and steel industry in the United States" on Wikipedia: "US production of iron and steel peaked in 1973, when the US industry produced a combined total of 229 million metric tons of iron and steel. But US iron and steel production dropped drastically during the recession of the late 1970s and early 1980s. From a combined iron and steel production of 203 million tons in 1979, US output fell almost in half, to 107 million tons in 1982. Some steel companies declared bankruptcy, and many permanently closed steelmaking plants. By 1989, US combined iron and steel production recovered to 142 million tons, a much lower level than in the 1960s and 1970s. The causes of the sudden decline are disputed. Among the many causes alleged have been: dumping of foreign imports below cost, high labor costs, poor management, unfavorable tax policies, and costs of environmental controls."
It seems most likely that the EPA contributed to a relatively small part of the stagnation in steel production if anything. I think is a price worth paying to look after the environment and have clean air and water and so forth. It's a values issue.
- Stop emissions, stop warming: A climate reality check
AdriantheHistorian at 01:36 AM on 20 December, 2024Skeptical Science asks that you review the comments policy. Thank you.
[snip]
TODAY!......... Climate Shift. ..??.. DID the Climate Fanatics of the 1970’s CAUSE the Climate Crises of Today?
Funny as the ''Climate Craze'' back in the 1970's was the New Ice Age..... Yes ''they'' said that Pollution (partials) were being thrown up into the upper atmosphere and causing the suns light to be reflected back into space., This was causing a New Ice Age to destroy the earth.
(Scientists say sprinkling diamond dust into the sky could offset almost all of climate change so far — but it'll cost $175 trillion)
Story by Sascha Pare 12-19-2024
Today those same people (Rainmakers) are selling yet another climate ''Crises''.
Note; To STOP this New Ice Age, the USA went 'seriously' into protecting the 'Environment' way back in the 1970's with President Nixon signing the Environmental Protection Act (EPA) into law.
Today the USA only produces as much steel as it did in 1950, this is as an example of those EPA efforts.
High Gas Prices?.. EPA will Not allow a New Oil refinery to be built in America.
And this is also a major reason for the loss of Millions of very good paying jobs, I might add. 'clean', comes with a very steep 'price'.
Even IF the ‘Clean’ is ONLY here and all that pollution was just Moved to China, along with all the Jobs.
Good thing we don’t use the same Air as the Chinese. Otherwise it would ALL have been a waste of time and Money.
TODAY!......... Climate Shift. ..??.. DID the Climate Fanatics of the 1070 CAUSE the Climate Crises of Today?
(Scientists say sprinkling diamond dust into the sky could offset almost all of climate change so far — but it'll cost $175 trillion)
Story by Sascha Pare 12-19-2024
Sprinkling diamond dust into the atmosphere could offset almost all the warming caused by humans since the industrial revolution and "buy us some time" with climate change, scientists say.
New research indicates that shooting 5.5 million tons (5 million metric tons) of diamond dust into the stratosphere every year could cool the planet by 1.8 degrees Fahrenheit (1 degree Celsius) thanks to the gems' reflective properties. This extent of cooling would go a long way to limiting global warming that began in the second half of the 19th century and now amounts to about 2.45 F (1.36 C), according to NASA.
The research contributes to a field of geoengineering that's looking for ways to fight climate change by reducing the amount of energy reaching Earth from the sun.
https://www.msn.com/en-us/weather/topstories/scientists-say-sprinkling-diamond-dust-into-the-sky-could-offset-almost-all-of-climate-change-so-far-but-it-ll-cost-175-trillion/ar-AA1w6MuP?ocid=msedgntp&pc=HCTS&cvid=2dfb5c2f1669448799854ec819ce98bf&ei=43
- CO2 effect is saturated
michael sweet at 23:06 PM on 4 December, 2024this works for me.
https://escholarship.org/content/qt3428v1r6/qt3428v1r6_noSplash_b5903aebfe105b4071103e11197138f8.pdf
Moderator: when i tried to hyperlink the link it didn't work, sorry
- CO2 effect is saturated
michael sweet at 23:02 PM on 4 December, 2024callitasitis: a free copy of the paper is located here. Google Scholar located this copy in about 30 seconds.
- 2024 SkS Weekly Climate Change & Global Warming News Roundup #48
AdriantheHistorian at 23:44 PM on 2 December, 2024As this is your first post, Skeptical Science respectfully reminds you to please follow our comments policy. Thank You!
Funny as the ''Climate Craze'' back in the 1970's was the New Ice Age..... Yes ''they'' said that Pollution (partials) were being thrown up into the upper atmosphere and causing the suns light to be reflected back into space., This was causing a New Ice Age to destroy the earth.
Today those same people (Rainmakers) are selling yet another climate ''Crises''.
Note; To STOP this New Ice Age, the USA went 'seriously' into protecting the 'Environment' way back in the 1970's with President Nixon signing the Environmental Protection Act (EPA) into law.
Today the USA only produces as much steel as it did in 1950, this is as an example of those EPA efforts.
High Gas Prices?.. EPA will Not allow a New Oil refinery to be built in America.
And this is also a major reason for the loss of Millions of very good paying jobs, I might add. 'clean', comes with a very steep 'price'.
Even IF the ‘Clean’ is ONLY here and all that pollution was just Moved to China, along with all the Jobs.
Good thing we don’t use the same Air as the Chinese. Otherwise it would ALL have been a waste of time and Money. - CO2 effect is saturated
MA Rodger at 16:23 PM on 1 December, 2024Bob Loblaw @797,
Commenter CallItAsItIs @800 continues to demonstrate a schoolyard approach to this subject which is not appropriate to its scientific nature. If "one could probably show" something then why shouldn't 'one'. Oh, this is because "typesetting equations tends to be a long, grueling task" for him and "most likely" these equations would then be subject to rebuttal "over statements I did not make or that you misunderstood." I think I'd prefer "the dog ate my homework!!"
While the commenter CallItAsItIs appears a lost cause and too far up his own nonsense to see any of his multivarious misconceptions, it would be correct here to ask him to explain his comment @796 and show where exactly it is within Schwarzschild's equation there is "an exponential term that vanishes at high altitudes" and demonstrate from that how it is this would obtain "the exact same result (he has) been claiming through all the ridicule."
- CO2 effect is saturated
CallItAsItIs at 14:04 PM on 1 December, 2024Bob Loblaw @797
Yes, I see the light. You simply cannot conceive of the idea that adding CO2 changes the temperature at which the atmosphere reaches "thermal equilibrium".
Wrong! Whether adding CO2 changes the equilibrium temperature remains to be seen. I should note, however, that with the absorption strength of CO2 on the 15 micron band, one could probably show that band saturation occurs over a pretty wide temperature range.
Do the actual math. Your handwaving achieves nothing other than making you look like a fool.
I have already done the math but am not posting it here. Typesetting equations tends to be a long, grueling task for me and not worth the effort in view of the fact that you and your AGW comrades would most likely discredit it over statements I did not make or that you misunderstood. Attend my Fear no Carbon lectures if you want to learn something more about the mathematics of this band saturation effect.
- CO2 effect is saturated
Bob Loblaw at 06:40 AM on 28 November, 2024Congratulations, CallItAsItIs. You actually have some sort of access to a textbook that covers "radiometery", and you know how to look in an index.
I am familiar with Petty's book, although It is not one that I have on my personal bookshelves.
I'll see your Petty, and raise you a Wallace and Hobbs, "Atmospheric Science, an Introductory Survey" (Beer's Law discussed on pages 296-297), a Pierrehumbert "Principles of Planetary Climate" (Beer's Law discussed in chapters 4 and 5), a Liou "An Introduction to Atmospheric Radiation" (which has 6 sections listed in the index for the Beer-Bouguer-Lambert law), and an Oke "Boundary Layer Climates" (also multiple references in the index).
All of those four books are ones that I do have on my personal bookshelf.
And if you want to see what else I know about Beer's Law, you can read this post:
https://skepticalscience.com/from-email-bag-beer-lambert.html
Yes, Beer's Law applies to individual wavelengths/frequencies. I challenge you to find a single reference that supports your argument that "conservation of energy must hold for each frequency independently of the others."
You see, Beer's Law says nothing at all as to what happens to energy that is absorbed when photons disappear within the volume of air it includes. As far as Beer's Law is concerned, the energy simply disappears along with the photon. To apply "conservation of energy" principles, you need to include where that energy goes - which you repeatedly fail to do.
- CO2 effect is saturated
Bob Loblaw at 00:32 AM on 28 November, 2024CallitItAsItIs @ 765 (where he responds to my request for his definition of "sources of energy"):
You are in no position to tell other people to "learn some physics". Let's start with one of your statements:
...we are trying to determine the warming of the atmosphere due to GHGs tapping energy from the terrestrial IR radiation rising from the surface. This means that the upwelling terrestrial IR radiation is the source.
Once again, you are wrong. Let's look at Trenberth's diagram again:

You clearly have no idea what this diagram shows. I will point specifically to two arrows in the middle of the diagram, originating at the surface. The ones labelled "Thermals" and "Evapotranspiration". Those are flows of energy from the surface ("source") to the atmosphere (sink, if you like). IR radiation (labelled "Surface radiation") is to the right, and it is not the only transfer of energy from the surface to the atmosphere.
You continue with:
The sun also is a source of energy since it puts out IR radiation which is absorbed by the GHGs and converted into thermal energy in the same manner as the terrestrial IR radiation.
Once again, you ignore anything other than IR radiation. A lot of the sun's direct warming of the atmosphere comes from absorbing non-IR radiation - visible light, and UV radiation. In fact, the main reason that the stratosphere is much warmer than the troposphere is because of UV absorption by ozone. The atmosphere is not completely transparent to visible or UV radiation.
Then you state (with respect to surface heating):
The down-welling terrestrail radiation from the atmosphere is another a source, but a much weaker one.
Look at the Trenberth diagram again. Solar radiation absorbed by the surface is 161 W/m2. (On the left side.) If you look on the right side, you see that "Back Radiation" (IR from the atmosphere to the surface) is 333 W/m2. I challenge you to find one reputable source that says 333 is "much weaker" than 161.
..and if you look closely at the IR radiation flows between the surface and the atmosphere (on the right of the diagram), you will see that the net exchange is only +23 W/m2 - the atmosphere only absorbs 356 W/m2 of the 396 W/m2 coming off the surface, but sends 333 W/m2 back to the surface. Contrast that with the 97 W/m2 (17+80) transferred from the surface to the atmosphere by thermals and evapotranspiration, and add in the 78 W/m2 of solar radiation absorbed directly by the atmosphere (in the middle of the diagram) and you get a total of 175 W/m2 of energy added to the atmosphere from sources that are not surface emission of IR radiation.
And then in your closing paragraph, you state (emphasis added):
Since the contributions to the total upwelling EMR at different frequencies involve different photons, conservation of energy must hold for each frequency independently of the others.
And this is probably the root cause of your confusion. No, conservation of energy is not something that must hold for each frequency independent of others.
Once CO2 (or any other material) absorbs a photon, the energy gets transformed into another form (thermal/kinetic, chemical, etc.) and the CO2 is free to do whatever it wants to (restricted by physics and chemistry, of course) with that energy. It can emit it as radiation in any frequency of the many it is capable of absorbing or emitting. It can keep it as kinetic (thermal) energy. It can dump it off as kinetic energy to other molecules it collides with as it bounces around in the sky.
The energy contained within the CO2 molecule has no memory of where it came from. Absorption of radiation, kinetic transfer from colliding with other molecules, etc. It's all just energy once it is stored in the molecular structure of the CO2.
Energy conservation only applies to the system as a whole. Your version of "physics" is bordering on crackpot territory.
- 20 fact briefs published in collaboration with Gigafact!
prove we are smart at 07:44 AM on 14 November, 2024What the heck, thought I'd do the quiz even knowing I would know that stuff now. Well, I got number 15 wrong and am so glad I did!
I was eventually led back to here- skepticalscience.com/argument.php?p=1&t=162&&a=297 you can learn so much from the informed comments. By the time I read the first 25 comments of that decade old post I had my information- In fact a link from number 25 commenter led me here- www.amazon.com/The-Alchemy-Air-Scientific-Discovery/dp/0307351793 ( looks like a good read)
Surprising facts and scientific knowledge, gotta luv Skeptical Science.
- Fact brief - Is there an expert consensus on human-caused global warming?
Bob Loblaw at 06:37 AM on 11 November, 2024Jess Scarlett @ 6:
You're going to have to put together a much stronger argument than that if you want to convince anyone that there isn't a strong expert consensus on human-caused global warming.
For starters, is your lead question ("Have you looked into all the climate scientists gagged...") a rhetorical gambit, or are you actually asking a serious question? Are you trying to imply that the studies that have looked at the scientific literature missed a few "gagged scientists", or many, or all? Are you trying to imply that this "gagging" has been so thorough that none of their opinions have every made it into print? Or that the few that have made it into print would be a much greater number "but gagging"?
The OP here links to the full SkS rebuttal on the topic. Here is the link to the basic tab of that rebuttal, but note that there are also advanced and intermediate tabs to read. The basic rebuttal links to the various papers that have been done on the subject, and those papers give details on just what sort of searches they did to obtain the list of papers that were evaluated. Feel free to look them over and come back with an argument as to why those searches will have missed the opinions of the "gagged scientists" you seem to think exist in large numbers.
...but before you start trying to make an argument that the review system won't let opposing opinions get published, I suggest that you read this SkS article on "pal review" that shows just where bad reviewing practices exist in the climate science literature. (Hint: it's the "gagged scientists" that have historically abused the peer review system.)
But let's entertain your argument that there are a whole bunch of 'gagged scientists" that can't get published, or have chosen to remain silent out of fear. You said "...all the climate scientists gagged..." That seems to imply a large number. I'll begin with a recollection of discussing climate science with someone at a conference about 30 years ago. He made the claim that lots of scientists had reversed their opinion from global cooling in the 1970s to warming in the 1990s. (This is debunked on this post at SkS.)
- I challenged him by saying "name one".
- He prattled on about there being lots.
- Again, I said "name one".
- He kept prattling on.
- I repeated "name one".
- I held my hand up about head high and started dropped it down to chest height, waist height, and below, saying "this is your credibility dropping".
- He still didn't give a name. He never did.
So that is my challenge to you: you claim that there are scientists at CSIRO and NASA that have been gagged because they disagree with the scientific consensus. Name One. And provide some sort of link to a reliable source of information supporting that position.
Second: in the advanced tab of the full rebuttal, under "The Self-Ratings", the Original Cook et al study obtained ratings of over 2100 papers from 1200 scientists, and 97.2% of those ratings agreed with the consensus. In the following paragraph, it states that the authors' review of over 4000 abstracts indicated a 97.1% agreement with the consensus.
- My second challenge is for you to do some elementary arithmetic (I won't call it math), and tell me how many papers do you think those "gagged scientists" failed to publish, and how would the 97% number have changed if they had succeeded in publishing those papers.
- I'll give you a hint. You'd have to find nearly 2100 papers or 4000 abstracts to get it to drop to a 50% consensus.
- Good luck finding that many papers.
- ...and before you try to link to PopTech's list of papers, please read "Meet the Denominator".
Please provide us with backup of your claim.
- 4 Hiroshima bombs worth of heat per second
One Planet Only Forever at 06:55 AM on 11 October, 2024MA Roger @54,
Thank you for the detailed explanation. I now appreciate that the ‘reason’ or attribution for the EEI rate appearing to have increased from 4 bombs to 9 bombs (or higher) is still not fully understood.
The annual CO2 level increase now appears to be about 40% higher than the average from 1980 to 2010 (see below). That does not appear to reasonably explain the more than doubling of the EEI in a way that is reasonably consistent with the expectation that no significant warming will occur after human impacts on GHG levels are effectively ‘net-zero’.
Could it be that the magnitude of annual GHG increase is significantly exceeding the rate of annual EEI to achieve the new balanced state? That would mean that there is a growing amount of ‘yet to be realized’ global warming. However, if the wind-down of GHG impacts is able to be slow enough, the reduction happens sooner and a more significant reduction happens earlier, then that excess warming could be realized by the time that human impacts become effectively net-zero. That would be seen by the EEI not declining at the time that the rate of CO2 increase begins to significantly decline.
Based on NOAA (see here) the approximate 10 year average annual increases of CO2 levels were as follows:
0.8 ppm - in the 60s (1960 to 1970)
1.3 ppm - 70s
1.6 ppm - 80s
1.5 ppm - 90s
1.9 ppm – 2000s
2.4 ppm - 2010s
Average annual increase from 1980 to 2010 = 1.7 ppm
Average of 2010 to 2020 = 2.4 (with 2018 at 2.4 and 2019 at 2.5), an increase of about 40% compared to the period used to calculate the 4 bomb per second rate.
- Are climate models overestimating warming?
MA Rodger at 02:08 AM on 20 August, 2024ubrew12 @3,
The models do certainly calculate soil moisture and account for surface albedo. I don't know how accurately this is done. Presumably, if it were done badly enough to affect the modelling generally, such a failing would be quickly corrected.
You ask this because you wonder whether the 'Dust Bowl' could be the reason for these Corn Belt states having seen such low warming rates 1973-2022. Perhaps they began the period with warming already in place.
The GISTEMP web site easily allows such ideas to be tested. Over the full 1880-2022 period of data, the same low warming trend is still seen across the eastern USA thro' summer months on a global map. It is actually there all year and strongest in Autumn,weakest in Winter & Spring. So using this region to be representative of AGW, it is simply a dishonest cherry-pick (which is what 'Derwood Turnip' is doing). And as a region testing the climate models, as shown in the global map above in the OP, it is again a dishonest cherry-pick (which is what Roy Spencer is doing), although Montana/North Dakota would give a more dramatic result, indeed the most dramatic result.
- Are climate models overestimating warming?
ubrew12 at 21:58 PM on 19 August, 2024This article includes a graph of the worlds 1970-2023 prediction anomaly. This is pure speculation, but the anomaly in question may not be simply 'unforced variability'. We know that in the 30 years before 1970, the Corn Belt was recovering from the 'Dust Bowl': non-evaporative fallow land was being replaced by irrigated crops. Post 1970 this trend would have continued, as better agricultural practices filled the summer Corn Belt with evapotranspirating crops: a form of human agency the climate models may not include as a boundary condition. If so, then such a overprediction anomaly may also be found in other cropland areas, like in Ukraine.
An opposite effect might be expected in places where evapotranspirating jungle was, post 1970, being cut down and replaced with relatively inefficient ranchlands, soybeans, and palm oil plantations: Brazil and Borneo. Hence, they show up colored blue in that graph.
I'm just speculating. Do the climate models account for this kind of human agency, land-use change, as a boundary condition?
- A major milestone: Global climate pollution may have just peaked
Bob Loblaw at 04:54 AM on 24 July, 2024Joel:
The figure mentions OurWorldInData.org. They have a large collection of charts of CO2 and greenhouse gas information on this web page.
One of the charts (second row, right side, in the view I have) is for "Annual greenhouse gas emissions by world region". It looks like the total for that chart matches the values in the figure in this post, so I expect the figure here is using the same data (just not by region).
If you dig down into the information for that chart at OurWorldInData, it gives the following reference:
Jones, Matthew W., Glen P. Peters, Thomas Gasser, Robbie M. Andrew, Clemens Schwingshackl, Johannes Gütschow, Richard A. Houghton, Pierre Friedlingstein, Julia Pongratz, and Corinne Le Quéré. “National Contributions to Climate Change Due to Historical Emissions of Carbon Dioxide, Methane and Nitrous Oxide”. Scientific Data. Zenodo, March 19, 2024. https://doi.org/10.5281/zenodo.10839859.
That paper describes the data as "emissions CO2, CH4 and N2O from fossil and land use sources during 1851-2021."
If you follow the link to that paper, it then points to yet another paper that gives a more complete description: https://www.nature.com/articles/s41597-023-02041-1. The abstract of that paper starts with:
Anthropogenic emissions of carbon dioxide (CO2), methane (CH4) and nitrous oxide (N2O) have made significant contributions to global warming since the pre-industrial period and are therefore targeted in international climate policy.
From that information, it seems pretty clear that forest fires, peat, etc. are not included.
The figure here provides enough information that your question can be answered with a little effort tracking down sources.
- 2024 SkS Weekly Climate Change & Global Warming News Roundup #29
Cleanair27 at 04:25 AM on 23 July, 2024As nigelj points out, the proper term is 'dismantle', not Heritage's humorously incompetent and unintentionally ironic use of 'deconstruct'. This calls to mind Jacques Derrida's post-modernist deconstruction project, hardly what Heritage would want to be associated with.
I don't entirely agree with nigelj's critique, rooted in standard welfare economics. There is no free market, and market failures are common and widespread, so different concepts are better for justifying regulation. For a different perspective on the history, troubles, and potential of the American administrative state, and why the Heritage wrecking ball is seriously foolish, consider this: The Fourth Branch
- What’s next after Supreme Court curbs regulatory power: More focus on laws’ wording, less on their goals
One Planet Only Forever at 08:00 AM on 18 July, 2024My comments about the harmful learning/change resistant hard-liners (religious, racist, sexist, greedy rich, and more types) taking over the US right-wing, including the SC control evident in the Chevron deference judgement, is well summarized in this new NPR article:
RNC represents culmination of a decades-old movement in the Republican Party
The article also aligns with the understanding that ruining democracy and ending the related freedoms, particularly the freedom from unjust persecution, for caring thoughtful responsible people is often a slow process (I mentioned this was presented in the book “How Democracies Die” in my comment @62 and earlier comments). It also supports the understanding that the institution of the Republican Party failed to protect US democracy by allowing the hard-line social conservatives to taking over the party. And it presents the case that the take-over of the Republican Party was a significant source of the divisiveness in current day USA.
The following are a few quotes from the article:
They feared changing values around sex, civil rights, women’s rights and gay rights.
They believed the establishment was too moderate, too accommodating.
They dismissed the machinery of government and the media as controlled by a liberal elite.
They were known as “the New Right,” and 50 years ago they won a victory in the Republican Party.
It is the heirs of that political movement who have gathered at this year’s Republican National Convention in Milwaukee. As the party pushes to dramatically reshape government and roll back changing cultural mores, nominating a candidate who has disregarded fundamental elements of American democracy, it may feel like a sudden and extreme pivot in American politics. But this surge to the far-right stems from seeds planted a half-century ago.
...
1974: Kanawha County, West Virginia
... They were appalled by mentions of sex, inclusions of profanity, exploration of non-Christian creation myths, and readings from Malcolm X.
The protests grew violent. Bombs exploded at elementary schools (Horan later went to prison for his involvement). Snipers fired at school buses. The Ku Klux Klan joined a rally at the state capitol in Charleston.
Meanwhile, outside activists arrived to aid the protesters, as well. They came from a variety of mostly new organizations: the Conservative Caucus, Citizens for Decency Through Law, the Populist Forum, and one called the Heritage Foundation.
The Heritage Foundation is undeniably the harmful buddying up of the fossil fuel interests with the social conservative interests (almost all in conflict with learning to b e less harmful and more helpful to others)
It is important to understand that the powerful fossil fuel interests had been significantly influencing US leadership judgment before the social conservatives pursued the capture (hostile take-over stuff) of the Republican Party in the 1970s. The harmful wealthy fossil fuellers willingly buddy up with harmful social conservatives because:
- It costs callous wealthy fossil fuellers very little to support the unreasonable misunderstanding-based leadership judgments and actions desired by the social conservatives.
- And the social conservatives are obviously happy to support any interest group that will support their interests no matter how unreasonable they are and how much misunderstanding is required to support them.
The union of unreasonable misunderstanding fuelled people have captured control of the SC for the foreseeable future (no mechanism to change the SC other than a SC justice ‘retiring’ when Democrats control the Senate and Presidency, or a SC justice being successfully impeached and convicted by the House and Senate).
Some final quotes from the NPR article:
1974: Boston, Massachusetts
A bottle shattered. Eggs splattered and rocks hammered against the window of a school bus filled with children. Parents had violently risen up against a plan to desegregate schools, which involved sending children sometimes across town by bus.
As riots engulfed the city, once again outside activists from a variety of new groups arrived to help the protesters.
The next year, 1975, featured a remarkable convergence. Hundreds of anti-busing protesters from Boston and anti-textbook protesters from West Virginia joined together in a march on Washington, D.C.
Two separate, regional uprisings against social change became one.
...
The outside groups who aided the protests, along with a host of others like them, would earn the moniker “the New Right.”
...
1976: North Carolina
It was embarrassing how badly Ronald Reagan was losing.
... Reagan pledged to transform the GOP, shift it rightward, into a “party of bold colors, no pale pastels.”
In other words, Reagan was the candidate of the New Right.
... He lost the first five primaries to Ford, in increasingly emphatic fashion. His top aides prepared to withdraw.
... Sen. Jesse Helms and his political strategist Tom Ellis, took charge of Reagan’s campaign in their state. They reshaped his message, emphasizing a nationalist appeal featuring the Panama Canal.
Reagan adopted a new slogan: “Make America Number One Again.”
...
This week, amid bipartisan calls to ratchet down political rhetoric after the assassination attempt against Trump, Republican delegates in Milwaukee approved the party’s latest platform. While it removes explicit opposition to abortion, the social backlash and apocalyptic rhetoric that decades ago typified the New Right infuses the document, from its call to “deport millions of illegal Migrants who Joe Biden has deliberately encouraged to invade our Country” to its focus on banning textbooks “pushing critical race theory.”
The New Right did not fully succeed 50 years ago when it sought to “organize discontent,” with “its eye on the presidency,” and the goal of taking “control of the culture.” But its values and heirs to its movement drive today’s Republican Party.
And the New Right Republican Party also supports environmental and fossil fuel interests that conflict with learning to be less harmful and more helpful.
I recommend reading the full NPR article and the many other presentations of the long slow deliberate attack on democracy and its 'freedoms for all reasonable responsible people' by the collective of unreasonable hard-liners who win by promoting harmful misunderstanding to excuse unjust beliefs and related unjust judgments. They harmfully mislead because they can get away with it.
- What’s next after Supreme Court curbs regulatory power: More focus on laws’ wording, less on their goals
TWFA at 09:22 AM on 11 July, 2024Nigel, you can appeal to higher courts, but if they are all required to defer to the unelected and permanently entranched regulators it has obviously been a wasted effort prior to Loper overturning Chevron. As to how many, it is probably far to many to count, because not only do they write the regulations but periodically reach back and reinterpret and usually expand their scope, for example the ex-post-facto inclusion CO2 into the Clean Air Act of 1970 as a pollutant caused cases to go to the Supreme Court where in a split decision it was decided in 2007 that the EPA "could" regulate CO2 but would still be subject to lawsuits, thus leaving the final decision with the courts and not the regulators.
There are almost 100,000 pages in something like 250 volumes of the Code Of Federal Regulations, all written by unseen and unaccountable people, revolving doors of experts who regularly pierce the semipermeable membrane between government and private sector, first feverishly promulgating regulations and then moving to the private sector to make a living helping others either fighting or complying with them.
The regulatory world is a living being with a whole economy and ecosystem of its own, like the mysteries of the human brain or the global ecosystem, nobody can claim they know everything that is going on, least of all the public at large, yet those regulations affect virtually every aspect of life.
- Of red flags and warning signs in comments on social media
nigelj at 08:54 AM on 16 June, 2024Interesting that TWFA quotes Paul Ehrlich as an example of a clever contrarian. Perhaps TWFA doesnt realise Ehrlichs predictions of mass famine by the 1970s due to over population, have clearly been proven spectacularly wrong. And it is unlikely there would be mass famine in the future, given fertility rates have fallen so much (fortunately).
Sure sometimes contrarians are proven right but putting your faith in them is very risky - especially the climate contrarians who have been debunked over and over again.
- Of red flags and warning signs in comments on social media
michael sweet at 01:32 AM on 16 June, 2024TWFA:
Have you noticed that there is a record heat dome over the USA today? Or that south Florida had record floods yesterday? Why would we wait 20 years to decide to take action when the climate has already dramatically changed exactly as the 97% of scientists predicted?
The longer we wait to take action the worse the damage will be.
Renewable energy is cheaper than fossil energy today and will save trillions of dollars.
- Of red flags and warning signs in comments on social media
Bob Loblaw at 01:31 AM on 16 June, 2024TWFA @ 4:
Oh, my. What red flags does your comment trigger?
- Questions the 97% consensus. Suggests waiting a couple of decades to see what happens. Claims action will take "hundreds of trillions". As the OP says, "wording typical for the 'discourses of climate delay'".
- Uses phrases "conclusions are correct and infallible" and "your perfection of science and purity of motive" [emphasis added], which attempts to make the consensus look like it is an absolute claim (even though the OP says "the facts are at least more than settled enough to base our decisions on". [again, emphasis added].
- Says "...convinced the right people..." and "...your theory of climate control..." [emphasis added], showing conspiratorial thinking (in group, out group).
- Says "...that anything said in question or to the contrary is "disinformation"...", in spite of the fact that the OP uses phrases such as "...in most likelihood be wrong or misleading...", "...might also be an indication...", "...It doesn't necessarily mean that everything written is wrong, but it nonetheless serves as a warning flag...", and "...might need to be read with a suitably large grain of salt."
All in one short paragraph. An impressive feat, to pack so many warning signals into such a short comment. Were you intending to provide us with an example of the type of comment that is probably safe to ignore? Or maybe you're just doing a Poe? Or maybe you are just so self-unaware that you don't see this in yourself?
- Of red flags and warning signs in comments on social media
TWFA at 00:18 AM on 16 June, 2024I don't know why you worry about all this chatter if you know your science and conclusions are correct and infallible, that anything said in question or to the contrary is "disinformation". You've already convinced the right people of your perfection of science and purity of motive and they are going to make everybody else spend hundreds of trillions testing your theory of climate control, so stop worrying about it, in a couple decades we'll see if the 97% were right or some Copernicus or Ehrlich among the 3% hawking "disinformation" was instead.
- On Hens, Eggs, Temperature and CO2
Bob Loblaw at 04:24 AM on 4 June, 2024As MAR points out in comment 9, Koutsoyiannis et al ignore ENSO as a possible factor in their analysis.
Is ENSO a factor in global temperatures? Yes. Tamino has had several blog posts on the matter, where he has covered the results of a paper he co-authored in 2011, with updates. The original paper (Foster and Rahmstorf, 2011) looked at the evolution of temperatures from 1979-2010, and determined that much of the short-term variation is explained by ENSO and volcanic activity. After accounting for ENSO and volcanic activity, a much clearer warming signal is evident.
Tamino recently updated this analysis, with modified methodology and covering a longer time span (1950-2023). This method turns this:

to this:

Now remember: Koutsoyiannis et al used differenced/detrended data in their analysis, which means that they have removed any long-term trend and fitted their analysis to short-term variations. If you remove the short-term effects due to ENSO, Koutsoyiannis et al will have a temperature signal with a lot less variation. That means they have a lot less ΔT to "cause" CO2 changes. Their physics-free "causality" gets stretched even thinner (if this is possible with an analysis that is already broken).
- On Hens, Eggs, Temperature and CO2
Bob Loblaw at 00:42 AM on 4 June, 2024David @ 6:
Yes, the point you make about how glacial cycles show CO2 and T variations that would imply a huge temperature increase is needed over the last century to cause the observed rise in CO2 is discussed in the PubPeer comments on the earlier paper.
The earlier paper used the UAH temperature record that only covers very recent times (since 1979). The new paper also looks at temperature data starting in 1948 - but temperature data from re-analysis, not actual observations.
If their statistical technique is robust, then they should come up with the same result from the glacial/interglacial cycles of temperature and CO2...
...but their methodology is devoted to looking at the short-term variation, not the long-term trends. Our knowledge from the glacial/interglacial periods has much lower time resolution. Different time scale, difference processes, different feedbacks, different causes. That does not fit with their narrative of "The One True Cause".
A purely statistical method like Koutsoyiannis et al cannot identify "cause" when the system has multiple paths and feedbacks operating at different time scales.
- The science isn't settled
TWFA at 13:36 PM on 9 May, 2024Of course I looked at Fig. 1... the ebb point in curve is at 1750, clearly rising by 1800 and well on the way by 1850.

I just want to know why, if we are the ones causing all this, that it began long before we were emitting measurable amounts of CO2, which was around 1890. Do I need to show you a chart of sea levels vs emissions?
Time series of sea level anomalies (blue) Jevrejeva et al. (2014).
Million tons of carbon emitted from burning fossil fuels from the Carbon Dioxide Information Analysis Center (CDIAC 2014) - The science isn't settled
TWFA at 11:59 AM on 9 May, 2024Come on, 2 buckets a day is 730 a year, and now you're bitching that it's a thousand a year instead, like that changes anything, it's all within an order of magnitude of my first 365 estimate, why didn't you just go right to 100,000 a century for greater effect?
The point is we KNOW such methods work and have been effective, not just on the coast, but improved insulation, hydroponics and gee, maybe agriculture will come back in thenorthern climes.
The Venetians have been dealing with rising water since the 5th century, on the other hand we only have an alleged 97% certainty that by adjusting the atmospheric content of CO2 up or down by a fiftieth of a percent from the four tenths of a percent it is now that we can control the temperature of the entire planet and avoid having to buldoze all that sand.
Besides, according to the Jevregeva data in '08 and refined in '14 the sea levels stopped receding and began to rise in 1750, when James Watt was twelve years old and over a century before our emissions were even measurable, see Fig. 1
Jevrejeva '08 - The science isn't settled
TWFA at 03:52 AM on 9 May, 2024I still get hung up on the plane example, not sure anybody is framing it correctly.
If you consider the plane to be built upon an aeronautical theory of AGW and is predicted with 97% certainty by those who designed it to be airworthy and get you to your destination, which would be surviving changes in the climate by preventing them altogether using a human controlled CO2 thermostat to control the temperature of the verses planet... verses choosing an alternative, far more pedestrian and proved means of transportation to climate survival that has worked for thousands of years, namely innovation, adaption and migration, which would you choose?
For example, a five gallon bucket of sand tossed upon your acre of oceanfront property every day will keep up with 8" of sea level rise over the next century.
- Simon Clark: The climate lies you'll hear this year
Bob Loblaw at 00:19 AM on 1 May, 2024Martin:
To see an example of the sort of "tricks" used by NoTricksZone, you can read this pair of old posts on the 1970s global cooling myth:
https://skepticalscience.com/70s-cooling-myth-tricks-part-I.html
https://skepticalscience.com/70s-cooling-myth-tricks-part-II.html
- Climate Adam: Is Global Warming Speeding Up?
MA Rodger at 17:19 PM on 12 April, 2024ubrew12,
Tamino subsequently posted an OP titled 'Accelerations' which features this NOAA adjusted data (the last two graphics) showing a pair of break-points in the rate of warming, 1976 & 2013, with the pre-2013 rate being quoted as +0.165ºC/decade and the post-2013 rate measuring a rather dramatic +0.4ºC/decade. But that said, there will be very big 'error bars' on that last value. Additionally Tamino's adjustments did result in 2023 temperature being increased (by +0.02ºC) which, given the cause of the "absolutely gobsmackingly bananas" 2023 temperatures remain unresolved, may be very wrong.
- Gigafact and Skeptical Science collaborate to create fact briefs
Joel_Huberman at 08:16 AM on 8 April, 2024I suspect the % of climate scientists agreeing that global warming is real and human-caused is now, in 2024, much closer to 100% than when the 97% measurement was made.
- Welcome to Skeptical Science
cookclimate at 09:28 AM on 4 April, 2024CO2 does not cause Earth’s climate change.
It is estimated that it will cost $62 trillion to eliminate fossil fuels, but eliminating fossil fuels will be a complete waste of our tax and corporate dollars, because it will not stop the warming. You can’t stop Mother Nature.
The IPCC (Intergovernmental Panel on Climate Change) frequently shows that temperature correlates with CO2 for the last 1,000 years as proof that CO2 is causing the warming. But if you extend that to the last 800,000 years, the temperature and CO2 lines do not correlate or fit (Figure 14 in Supplemental Data). If the lines don’t fit, then you must acquit CO2. CO2 is not guilty of causing climate change. CO2 does not control Earth’s temperature. The IPCC has not demonstrated any scientific evidence that CO2 controls Earth’s temperature (they only have unproven theories).
The facts:
• Earth is currently warming (it is still below the normal peak temperature).
• CO2 is increasing (it is above the normal CO2 peak).
• Earth’s current warming is being caused by a 1,470-year astronomical cycle.
The 1,470-year astronomical cycle warms the Earth for a couple of hundred years and melts ice sheets primarily in Greenland and the Arctic. It has repeated every 1,470-years for at least the last 50,000 years. It is normal that it would be happening again. It accelerates Earth’s rotation, stopping length of day increases (Figure 9). It warms the Earth. Based on historical data, the current warming should peak near the year 2060 and then it should start to cool.
For more information, see A 1,470-Year Astronomical Cycle and Its Effect on Earth’s Climate,
and Supplemental Data,
www.researchgate.net/publication/379431497_Supplemental_Data_for_A_1470-Year_Astronomical_Cycle_and_Its_Effect_on_Earth's_Climate#fullTextFileContent - Climate - the Movie: a hot mess of (c)old myths!
Eclectic at 08:59 AM on 4 April, 2024Jimsteele @97 / 98 :-
John Mason is quite correct, in that the SkS website is open to all-comers. And so, unsurprisingly, as you gaze around the threads, you will occasionally see comments by climate crackpots who have delusional unscientific fixations and who are impervious to reason and scientific facts ~ whereas, at the WUWT website, those sorts of commenters come in droves. (Indeed, they are the 95% majority there.)
But at SkS , you need to comply with the very reasonable rules of posting ~ and you should provide rational fact-based discussion, not pseudo-science & repetitive ranting.
Jimsteele, you have some serious work to do, to reconcile your self-contradictory statements.
- Climate - the Movie: a hot mess of (c)old myths!
jimsteele24224 at 13:43 PM on 3 April, 2024
Eclectic, First the skin surface dynamics are essential. The skin surface is the only layer from which heat can leave the ocean.
Second It is your narrative that grossly incomplete! You make a totally unsubstantiated assertion that without CO2 the oceans would freeze. You totally ignore solar heating. However the heat flux into the ocean primarily happens due to tropical solar heating in the eastern oceans, where La Nina like conditions reduce cloud cover and increase solar heating. The ocean sub surface can trap heat but the skin surface cannot.
- Climate - the Movie: a hot mess of (c)old myths!
jimsteele24224 at 06:07 AM on 3 April, 2024A Netherlands journalist, Maarten Keulemans, tried to denigrate Climate the Movie: The Cold Truth in about 50 tweets using much of the same arguments posted to here on SkepticalScience. I successfully debunked all of his arguments in 16 tweets (originally I intended 20) listed below, and so I was just honored with being interviewed for a Dutch TV segment regards how the Climate the Movie promotes vital scientific debate. Too often alarmists try to suppress debate with weak arguments or denigrating the opposition as deniers. However I doubt alarmists can refute any of my arguments, but I will gladly entertain your arguments.
1 Denigrating the Climate Reconstruction graph by Ljungqvist https://twitter.com/JimSteeleSkepti/status/1771929435366940908…
2 Keulemans' Medieval Warm Period lie https://twitter.com/JimSteeleSkepti/status/1771933673488789868…
3 Contamination of Instrumental by Urbanization https://twitter.com/JimSteeleSkepti/status/1771939656504062260…
4 The Best USA temperature Statistic! https://twitter.com/JimSteeleSkepti/status/1771947116631580724…
5 Ocean Warming Facts https://twitter.com/JimSteeleSkepti/status/1771957182407536940…
6 US Heat Waves https://twitter.com/JimSteeleSkepti/status/1771963700951527487…
7 It is the Sun Stupid! https://twitter.com/JimSteeleSkepti/status/1771977013576024282…
8 Alarmists know better than Nobel Prize Winners ! https://twitter.com/JimSteeleSkepti/status/1771987039631921454…
9 Wildfires: Liar Liar Keulemans' Pants on Fire https://twitter.com/JimSteeleSkepti/status/1772000151596572844…
10 The Dangers of CO2 Sequestration and CO2 Starvation https://twitter.com/JimSteeleSkepti/status/1772016867265380795
11 Models Running Hot! Keulemans Disgraceful attack on the most honest Dr John Christy! https://twitter.com/JimSteeleSkepti/status/1772081300884852829…
12 Keulemans’ Blustering Hurricane Fears
https://twitter.com/JimSteeleSkepti/status/1772319957042479298
13. Dishonestly Defining Natural Climate Factors
https://twitter.com/JimSteeleSkepti/status/1773395443864736058
14. Denying Antarctica’s Lack of Warming
https://twitter.com/JimSteeleSkepti/status/1773473481637957758
15. Misinformation on CO2’s Role in Warming Interglacials during our Ice Age.
https://twitter.com/JimSteeleSkepti/status/1773777313924297210
16. Science journalists vs grifting propagandists – Antarctica
https://twitter.com/JimSteeleSkepti/status/1774428539858907444 - Climate - the Movie: a hot mess of (c)old myths!
One Planet Only Forever at 02:21 AM on 2 April, 2024Two Dog @55,
I offer the following as an example of the incorrectness of your beliefs, and your apparent resistance to learning:
A combination of understood natural factors explain the 'blip' of warm global average surface temperatures in the early 1940s. That warm blip, along with the other aspects shared by others, especially nigelj, for your potential learning benefit, is a significant part of the total understanding of why there 'appeared to be no warming from 1940 to 1970 in spite of CO2 levels increasing'.
- Climate - the Movie: a hot mess of (c)old myths!
nigelj at 04:48 AM on 1 April, 2024Two Dog @41
"Finally, on the "cherry picking" of the 50s, 60s and 70s. I think its a fair point to pick 30 years out of 150 in this case. Indeed, the argument above is, as I understand it, that the main and dominant factor in the current warming is human GHG emissions. For that theory to hold, in any period where GHG emissions are increasing year on year, then only a few years "blip" in warming must presumably call the theory into question? (unless we can find another new and temporary factor like air pollution)"
The reason the temperature record has "blips" and is not a smooth line is because the trend is shaped by a combination of natural and human factors that have different effects. However the overall trend since the 1970s is warming. The known natural cycles and infuences can explain the short term blips of a couple of years or so, (eg el ninos) but not the 50 year overall warming trend since the 1970s. Sure there may be some undiscovered natural cycle that expalins the warming, but its very unlikely with chances of something like one in a million. And it would require falsifying the greenhouse effect which nobody has been able to do. Want to gamble the planets future on all that?
The flat period of temperatures around 1940- 1977, (or as OPOF points out it was really a period of reduced warming) coincides with the cooling effect of industrial aerosols during the period as CB points out. This is the period when acid rain emerged as a problem until these aerosols were filtered out in the 1980s.
However the flat period mid last century also coincided with a cool phase of the PDO cycle (an ocean cycle), a preponderance of weak el ninos, and flat solar activity after 1950 and a higher than normal level of volcanic activity. Literally all the natural factors were in a flat or cooling phase. In addition atmospheric concentrations of CO2 were not as high as presently, so it was easier for the other factors to suppress anthropogenic warming.
So for me this is all an adequate explanation of why temperatures were subdued in the middle of last century. Just my two cents worth. Not a scientist but I've followed the issues for years.
- Climate - the Movie: a hot mess of (c)old myths!
Bob Loblaw at 04:38 AM on 1 April, 2024It's also worth noting that the trend values OPOF is providing from the SkS Trend Calculator use 2σ ranges for the uncertainties.
...and if you look closely, none of the trends OPOF mentions are significantly different from 0. So, the "cooling from 1940 to 1970" is really "no significant warming [or cooling] from 1940 to 1970". To argue "cooling", you need to
- ignore the statistical significance of the linear fit
- choose your starting point carefully.
In comment 41, Two Dog makes the point "...then only a few years "blip" in warming must presumably call the theory into question? ". That depends on "the theory" being that CO2 is the only factor causing warming on an annual or several-year basis. As we've been pointing out, this is not "the theory" that climate science is working with.
Two Dog is making the classical logic failure that is discussed in the SkS Escalator.

In fact, Two Dog is also arguing with himself. On the one hand, he is arguing that climate science can't possibly know all factors that might be affecting global temperature, no matter how many factors they have already considered in the relevant scientific literature. And then on the other hand, he is criticizing climate science because any blip in temperature that is not explained solely using CO2 as the only factor "...must presumably call the theory into question?". The two positions he argues are mutually contradictory.
Unfortunately this is a common thing in "skeptical" arguments against well-supported climate science - mutually-contradictory (and often impossible) positions on the subject. It's like the Queen in Alice in Wonderland:
I daresay you haven't had much practice,' said the Queen. 'When I was your age, I always did it for half-an-hour a day. Why, sometimes I've believed as many as six impossible things before breakfast.
More than 100 comments found. Only the most recent 100 have been displayed.
More than 100 comments found. Only the most recent 100 have been displayed.


THE ESCALATOR

(free to republish)