


 Arguments
Software
Resources
Comments
The Consensus Project
Translations
About
Support
Arguments
Software
Resources
Comments
The Consensus Project
Translations
About
Support
![]()
![]()
![]()
![]()
![]()
![]()
![]()
![]()
![]()
![]()


![]()


Latest Posts
- Skeptical Science New Research for Week #24 2026
- June update: Help still needed to get translations prepared for our website relaunch!
- How many people does heat actually kill?
- Check out the brand-new hurricane ‘cone of uncertainty’ graphics arriving this season
- 2026 SkS Weekly Climate Change & Global Warming News Roundup #23
- SkS Housekeeping: Updating the Comments Policy
- Skeptical Science New Research for Week #23 2026
- Nobody knows the future of energy
- Fact brief - Do electric vehicles almost always have a lower carbon footprint than gasoline-powered cars?
- Solar, wind, and EVs have knocked out a doomsday climate scenario
- 2026 SkS Weekly Climate Change & Global Warming News Roundup #22
- Skeptical Science New Research for Week #22 2026
- The next era of Atlantic hurricanes could be far more destructive
- On the death of RCP8.5
- RCP8.5 Update
- 2026 SkS Weekly Climate Change & Global Warming News Roundup #21
- Skeptical Science New Research for Week #21 2026
- What’s a ‘super El Niño’? And other El Niño questions, answered
- Fact brief - Does electromagnetic radiation from wind turbines pose a threat to human health?
- Five things you need to know about El Niño’s likely comeback
- 2026 SkS Weekly Climate Change & Global Warming News Roundup #20
- Skeptical Science New Research for Week #20 2026
- Higher warming predictions for 2026 and 2027
- A look back at ‘An Inconvenient Truth,’ 20 years later
- Two videos about the Atlantic Meriodonal Overturning Circulation (AMOC)
- 2026 SkS Weekly Climate Change & Global Warming News Roundup #19
- EGU2026 - Five days of virtual learning
- Skeptical Science New Research for Week #19 2026
- Climate Adam - Climate Change is Destroying Lives... Now
- EGU2026 - Presentation about the Skeptical Science Experiment
Comment Search Results
Search for ocean warming
Comments matching the search ocean warming:
- Human-caused climate change is unmistakably distinct from Earth’s natural climate variability
MA Rodger at 22:44 PM on 23 April, 2026Eric (skeptic) @7,
I was a little taken aback in your comment by you saying in the context of 'slow feedbacks' that "feedback increases CO2." That is not the normal understanding of 'slow feedbacks' which are the main difference between ECS & ESS.
Folk are usually rather vague about the nature of the things dividing ESS from ECS but carbon feedbacks isn't what I find mentioned (as per here). It's usually the changing vegetation & ice cover that gets the mention, along with deep ocean warming. Melting ice/permafrost and oceans will have an associated thermal-lag element but I can't see that aspect being very great. This suggests the big part of Δforcing remaining out-of-equilibrium after ECS arrives is albedo changes.
I see two points of note - (1) The value of ESS & (2) Its relevance to the AGW situation.
(1) The main evidence supporting a significant ESS is of course the temperature and the CO2 records. And those don't come with labels showing the Δforcing involved in ESS. However, they do show ESS significantly above the usual range of ECS values (ECS =+2.0ºC to +4.5ºC) although there remains the "fat tail" in ECS analyses which sits yet higher.
The accounts of ESS have in the past put ESS = 1.5 x ECS or ESS = 2 x ECS, whatever that means number-wise. The analysis is usually applied to pre-ice age data although the OP above has also used mainly ice-age data-points and spliced them onto Judd et al (2024). (The OP figures show the Cenozoic data points of Judd et al below 700ppm CO2. So not shown is the seven Cenozoic points at higher CO2 levels. If these high points were missing also from the OP's analysis, it may explain the discrepancy between the Judd ESS [+7.7ºC] and the OP ESS [+8.2ºC].)
Judd et al (2024) Fig 4b
Of course, the ESS analyses are dependent on these temperature and CO2 reconstructions. And there is significant variation here as Judd et al Fig 4a below and Rae et al (2021) fig 7 below-again demonstrate. (At 50My bp, Judd et al have CO2 at 1,200ppm & Temp at 33ºC while Rae et al have CO2 at 1,500ppm & Temp at 27ºC which would make a significant difference in caculating ESS.)
Judd et al (2024) Fig 4a
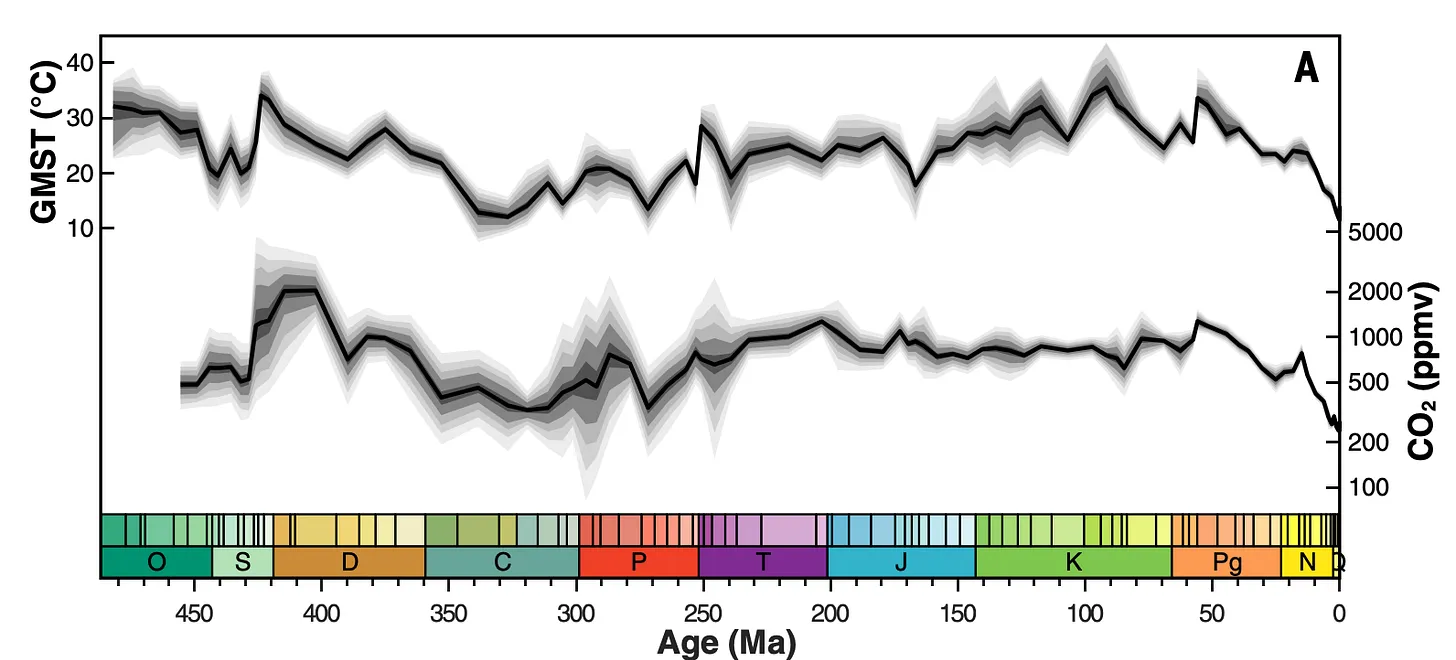
Rae et al (2021) Fig 6

So what value ESS? Presumably somewhere +5ºC to +9ºC.
But does it matter?
(2) Both ECS and ESS warming assumes the CO2 levels (or equivalent) are maintained until the respective equilibrium is reached. Give the draw-down of CO2 over the millennium will amount to roughly half the CO2 level increase of today, that maintenance of CO2 levels over the millennium would require a lot of CO2 coming from somewhere. The carbon feedbacks aren't that big. (See this CarbonBrief article which suggests natural feedbacks could amount to perhaps 15% or so.) If CO2 levels will not be maintained over centuries post-net-zero, that suggests that even ECS lacks relevance, although beyond the millennium and into ESS-territory there is no significant CO2 draw-down.
Of course, with AGW rapidly approaching +1.5ºC and the emissions still up where they shouldn't be, I don't think any reassurance given about AGW not reaching ESS levels or ECS levels (ECS levels which still may be higher than the 'usual range' due to the "fat tail"): any such perceived reassurance should not be allowed to lessen the efforts to rapidly cut emissions and reduce the bad effects of AGW we are creating for the future. (And note that the less-dreadful IPCC scenarios also include net-negative anthropogenic emissions post-net-zero to add to the natural draw-down.) - Human-caused climate change is unmistakably distinct from Earth’s natural climate variability
rkcannon at 17:14 PM on 18 April, 2026Rebuttal: Systems Analysis vs. Circular Reasoning
Subject: Response to Moderator Comments regarding Bhatta (2024) and Marks-Peterson (2026)
While the ad hominem labels—"amateur" and "naive"—provide a look into the moderator’s temperament, they do not address the physical and statistical discrepancies presented. As a Professional Engineer (PE), I prefer to evaluate the Transfer Functions of a system rather than the consensus of the "grown-ups."
1. On Circular Reasoning and System Gain
The moderator admits that the Nature paper (Marks-Peterson et al., 2026) requires "important contributions" from albedo and ocean circulation to explain a 2.5°C cooling while CO2 remained stable.
The Logic: To claim CO2 is the "key" control knob, only to demote it to a "passenger" whenever the data shows the planet cooling without its help, is circular reasoning.
The Math: Since the early 1900s, human CO2 emissions have increased by over 1,700%. If a seventeen-fold increase in the supposed "driver" results in a warming rate statistically similar to 1910, a rational systems analysis concludes the system is insensitive to that input.
2. The Failure of "Aerosol Masking"
The argument that mid-century cooling was "masked" by aerosols fails the spatial and modern test.
The Discrepancy: If industrial aerosols were a primary "cooling shield," China—with the world’s highest coal-related aerosol loading—should have been a global cool spot. Instead, China has warmed faster than the global average.
The Conclusion: You cannot invoke a "masking shield" to explain the 1940s cooling while ignoring its failure to stop warming in modern Asia. This is curve-fitting, not physics.
3. The Measured Driver: Albedo and the CERES Data
The moderator’s focus on 21-year surface trends ignores the most robust data set we have: the CERES satellite record.
The Data: Since 2000, CERES has measured a 0.8% drop in Earth’s albedo. This change in reflectivity has added roughly 2.7 W/m2 to the Earth's energy budget—effectively 100% of the warming forcing that the IPCC attributes to CO2 over the last 250 years.
4. The Missing "Fingerprint" and UHI Bias
If CO2 were the driver, the laws of physics dictate a "Tropical Hot Spot" in the upper troposphere. Decades of radiosonde and satellite data show this fingerprint is missing. The warming we do see is surface-based and highly correlated with Urban Heat Island (UHI) contamination. When you "homogenize" data by forcing rural stations to match urban trends, you aren't measuring global climate; you're measuring the encroachment of asphalt on thermometers.
Conclusion
Rational skepticism demands that models reconcile with empirical history. If the planet cooled 2.5°C with no change in CO2 in the Pliocene, and cooled for 40 years during a CO2 surge in the 20th century, the "Control Knob" theory is functionally dead. It is fascinating to watch the "Immune System" of this forum react; the Killer T-cells are working overtime to neutralize empirical data that looks like a "foreign invader" to the dogma. Nature doesn't care about your PhD or your moderation policy if your math is wrong. - Human-caused climate change is unmistakably distinct from Earth’s natural climate variability
MA Rodger at 21:37 PM on 16 April, 2026Moderator Response @1,
The amateur analysis of 'global average' temperature linked @1 by rkcannon is entirely naive in its method and in its reporting of conclusions.
It concludes "...the notion that CO2 is the primary driver of global warming. If this were the case, periods with higher CO2 emissions would exhibit a faster rate of warming than periods with lower emissions," pointing to what the amateur calls his finding that "...long-term temperature rise was steeper in earlier periods when CO2 emissions were modest compared to current levels. These results hold despite changes in how time periods are defined ... and how weather stations are selected ... .")
The grand analysis supporting such a bold assertion looked at 100, 500 and then 992 selected weather stations (so all land sites), selected for the level of data available and then calculates the temperature trends for 42, 35, 30 & 21 year periods. The 100 station results presented show the temperature trends for the latest periods are by far the steepest in two centuries under analysis, 1815-2024. (42y +0.24ºC/decade, 35y +0.25ºC/dec, 30y +0.33ºC/dec, 21y +0.41ºC/dec) which of course entirely contradicts the conclusions presented in the analysis.
So that's worse than "amateur"!!
The other link @1 by rkcannon is to Marks-Peterson et al (2026) which is paywalled but an associated paper Shackleton et al (2026) 'Global ocean heat content over the past 3 million years' is not. These two papers drew coverage at RealClimate. Both papers examine very very old ice which provides data with less accurate age such that ice age cycles are fuzzed out.
The two papers are pointing to a more complex cooling 3My-0,5My bp. From the press release:-
"The implications of the results are that the cooling of the last 3 million years probably involves, in addition to the key role of heat-trapping greenhouse gases, important contributions from other components of the climate system such as Earth’s reflectivity, variations in vegetation and/or ice cover and ocean circulation."
Somehow there are crazy folk gleaning straws from the science to present misguided support for their crackpot version of reality. The account of Marks-Peterson et al (2026) nailed-up on the rogue planetoid Wattsuppia was headlined 'Shock New Evidence Showing No Link Between CO2 and Temperature Over Last Three Million Years Stumps Net Zero Activists' and such coverage prompted a few grownups to explain the true implications fo the two papers.
- The El Niño cometh
MA Rodger at 18:05 PM on 3 April, 2026green tortoise,
Concerning in-thread images - There are a number of sites offering on-line image hosting images for free. As an example, I've just uploaded an the image below with this site. It can be a for-ever upload if you choose but in this case it will be live for a month.
The graphic is actually on-line on my The Banana!!! Watch site which is hosted by GoogleSites who don't allow hot URL links.
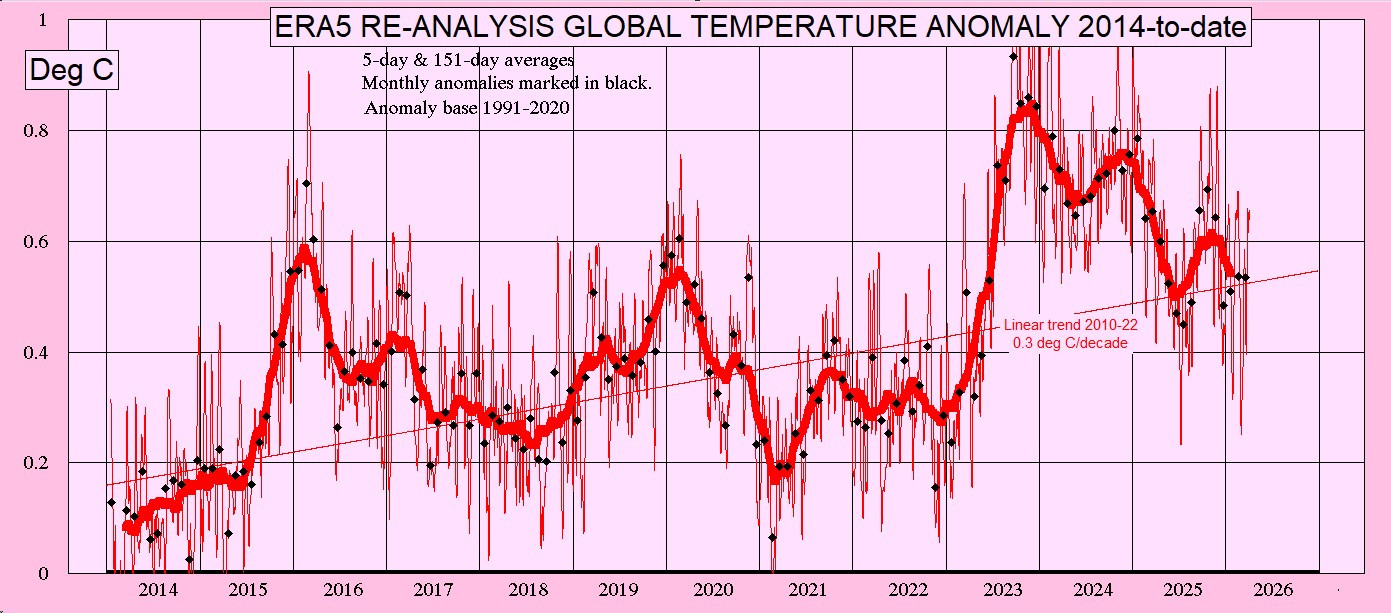
Concerning the present global SAT/SST - The Climate Pulse site is excelent for giving year-on-year up-to-the-moment temperatures but these do need to be both de-wobbled and adjusted for the underlying rate of AGW to allow the comparison you attempt.
The monthly SAT anomalies in this graphic above show the start of 2026 pretty-much on the 2010-22 trend line. That is what we also see back in 2015, prior to the 2016 El Niño. The situation in early 2023 was a little different as the La Niña had not lessened at all in preceding years, so the SAT would be expected to be significantly depressed prior to the El Niño wobble.
Of course, the 2010-22 warming trend of +0.30ºC/dec does not escape discussion. In the preceding decades, AGW had been strongly constant, stuck at roughly +0.18ºC/dec when models suggested there should have been some acceleration. The models do show today's AGW at +0.30ºC/dec with that acceleration.
The less-wobbly monthly SST anomalies (60N to 60S) provided by Climate Pulse show a strong warming since November last year and that warming has now reversed the cooling seen Jan-Nov. But comparisons with previous pre-El Niño periods show that such a warming is quite normal in pre-El Niño periods. Mind there is the possibility that the coming El Niño will come with a repeat of those 'bananas!!!' temperatures.
Concerning the coming El Niño - The NINO3.4 SST which is used to calculate the ONI (a measure of the ENSO) has just poked its head above zero. The forecasts are strongly pointing to an El Niño by the end of the year and the models have shifted it a little stronger in the last month. (Note that ONI has recently had a new friend RONI - Relative Oceanic Niño Index - that allows for better comparisons back through the years. Today RONI runs lower than ONI)
- Why Science Communication Fails: How to Break Down Misleading Arguments and Inoculate Against Misinformation
Eric (skeptic) at 09:23 AM on 16 March, 2026Just Dean, thanks for the explanation and updated version of your essay. I signed up for a Science account and read through Judd 2024. They explain geography thusly:
the change in the proportion of land to ocean area relative to today (29, 84). The impact of these paleogeographic changes on planetary energy balance can be treated as a forcing (ΔFgeog) (29, 81). In the Ordovician, subaerially exposed continents constituted only ~15% of the total surface area of the planet (compared to ~30% today), with the value increasing quasi-linearly across the Paleozoic (fig. S12). This results in an overall lower surface albedo for the Paleozoic and thus a positive forcing.
My question to you is are they claiming that geography, which they simplify to a forcing, is solely a temperature effect in the context of equilibrium? We agree that geography drives the CO2 and temperature to different sections of the curve, but the key question is how. I may be mistaken but I believe your main claim is that ocean circulation and temperarture changes affecting CO2 are a key determinant of equilibrium, minus current manmade CO2 which you would consider similar to examples in Judd such as Siberian traps and PETM.
Do you believe that current ocean circulation is unimportant (or perhaps I should say non-consequential) for long term equilibrium given present day geography? Or perhaps as some suggest, deepwater formation will slow with global warming? If so then we can perhaps reach a point close to the Judd curve as the long term feedbacks add more sequestered CO2 to atmosphere overwhelming the slowing uptake.
However I believe we are currently in a cold geography evidenced by the million year ice age, reaching CO2 starvation levels during full glaciation. The primary measurement of cold geography is ocean temperature sustained by cold deepwater formation but warmed from above by manmade warming. AI tells me the ocean's warming rate is 2.2 mC per year or 0.22C per century. This affects sea level of course but also CO2 absorption modulated by vertical ocean temperature profile.
In short, it appears that Judd's simplified (perhaps oversimplified) view of geographic forcing treats that forcing as negative with present day geography. Do you believe that would preclude reaching the corresponding temperature on the Judd curve?
- Why Science Communication Fails: How to Break Down Misleading Arguments and Inoculate Against Misinformation
Eric (skeptic) at 09:19 AM on 15 March, 2026Just Dean, the dashed black line in the diagram in justdean.substack.com/p/how-one-diagram-reveals-the-climate comes from geographic changes that drive both temperatuire and CO2. CO2 is an amplifier of temperature and temperature is an amplifier of CO2, but geography dictates global temperature. Prominent examples are Antarctica cooling with opening of Drake Passage www.researchgate.net/publication/256822123_Influence_of_the_opening_of_the_Drake_Passage_on_the_Cenozoic_Antarctic_Ice_Sheet_A_modeling_approach Arctic glaciation with closing of Isthmus of Panama: www.sciencedirect.com/science/article/pii/S0012821X05004048 There are others.
The steepness of the purple dots is due to the combination of CO2 and temperature mutual feedback added to albedo feedback from the forming and retreat of the continental ice sheets.
So we are left with the green and red lines. In the text they assert that CO2 stays high centuries after net zero (" even 700 years after emissions cease, roughly 85–99 percent of peak warming persists. Atmospheric CO₂ remains at more than half its peak value") I beat up the AI to get current numbers:
"Thus, the ocean absorbs ~9.2 Gt of CO₂ per year from the ~1,191 Gt excess currently in the atmosphere." or 0.77% per year. That 0.77% per year will drop as the excess atmospheric CO2 drops and the ocean saturates, but it suggests less than a century to drop to half, not multiple centuries. All hypothetical of course, but it also suggests we can start to see a drop before net zero.
- Trump just torched the basis for federal climate regulations. Here’s what it means.
nigelj at 10:48 AM on 2 March, 2026OPOF was talking about people who ignore the best interests of future generations. The expert interview below is relevant and important and does it related to climate change. Its a long read but worth it. Its from NPR. Ive made a few of my own comments at the end. The article:
Harvard psychology professor Daniel Gilbert argues that humans are exquisitely adapted to respond to immediate problems, such as terrorism, but not so good at more probable, but distant dangers, like global warming. He talks about his op-ed piece which appeared in Sunday’s Los Angeles Times.
The interview:
NEAL CONAN, host:
In an op-ed in Sunday’s Los Angeles Times, Harvard psychologist Daniel Gilbert argues that human brains are adapted to respond to some threats more than to others. For example, he says, we take alarm at terrorism, but much less to global warming, even though the odds of a disgruntled shoe bomber attacking our plane are, he claims, far longer than the chances of the ocean swallowing parts of Manhattan.
And the reason is biology, the human brain evolved to respond to immediate threats but may completely miss more gradual warning signs. If you have questions about how and why our brains got wired this way or about its implications, 800-989-8255, or e-mail us, talk@npr.org.
Daniel Gilbert is a professor of psychology at Harvard University, author of the book Stumbling On Happiness. You can link to his op-ed and to all previous Opinion Pages at the TALK OF THE NATION page at npr.org.
Daniel Gilbert joins us now from his home in Cambridge, Massachusetts. Nice to have you on the program today.
Professor DANIEL GILBERT (Psychology, Harvard University): Thanks so much for having me.
CONAN: Now, you say that we need to put a threat, a face on a threat, in order to truly perceive it.
Prof. GILBERT: Well, that’s true. I mean, you know, look, if alien scientists were trying to design something to exterminate our race, they would know that the best offense is one that does not trigger any defense. And so they would never send little green men in spaceships. Instead, they would invent climate change, because climate change has four properties that allow it to get in under the brain’s radar, if you will.
There are four things about it that fail to trigger the defensive system that so many other threats in our environment do trigger.
CONAN: As you point out in your piece, our brains are exquisitely tuned to, if we see a baseball coming at our head, get out of the way.
Prof. GILBERT: Exactly so. So that’s one of the features of climate change that makes it such an insidious threat, is that it’s long-term. It’s not something that threatens us this afternoon, but rather something that threatens us in the ensuing decades. Human beings are very good at getting out of the way of a speeding baseball. Godzilla comes running down the street, we know to run the other way. We’re very good at clear and present danger, like every mammal is. That’s why we’ve survived as long as we have.
But we’ve learned a new trick in the last couple of million years – at least we’ve kind of learned it. Our brains, unlike the brains of almost every other species, are prepared to treat the future as if it were the present. We can look ahead to our retirements or to a dental appointment, and we can take action today to save for retirement or to floss so that we don’t get bad news six months down the line. But we’re just learning this trick. It’s really a very new adaptation in the animal kingdom and we don’t do it all that well. We don’t respond to long-term threats with nearly as much vigor and venom as we do to clear and present dangers.
CONAN: So a lot of us thought evolution would reduce us to four toes or maybe four fingers. You say what it in fact has meant is that we’ve developed delayed gratification.
Prof. GILBERT: Well, yes indeed. I mean, evolution has optimized our brain for the Pleistocene. I mean, you’d be, you know, if we put you back three million years, you’re going to be the most adapted animal walking the earth. The problem is that our environment has changed so rapidly because we’ve got this great big brain so we could navigate our ancestral environment, and lo and behold, what did we do? We created an entirely new environment to which our brain is not perfectly adapted.
CONAN: We’re talking with Daniel Gilbert, a psychologist at Harvard University, on the TALK OF THE NATION Opinion Page. If you’d like to join us, 800-989-8255, e-mail, talk@npr.org. And this is TALK OF THE NATION from NPR News.
Another requirement for that human response, that triggered response, is some sort of moral outrage, you say.
Prof. GILBERT: You’re right. And so I started by saying there were four, and then I talked about one, so what are the other three? The other three are, A) the source of the threat should be human rather than inanimate; B) there should be a moral component; C) as we just talked about, it should be short-term rather than long-term; and D) if you want the human brain to respond, you really want to make sure that the threat is sudden rather than gradual.
So you asked about the moral component. There’s a lot of energy these days in our Congress, and indeed in our nation, devoted to what really our strictly moral issues. There’s very little doubt that many people will be injured by burning flags or gay sex, and yet we are up in arms about flag burning and gay marriage. And the reason is that these offend many people at the moral level. We’re very good at taking umbrage. We’re just not very good at taking action against things that don’t create – that don’t arouse moral emotions. And you know, climate change just doesn’t.
As I say in my essay, if, you know, if eating, if the practice of eating kittens were the thing responsible for climate change, we’d have people massing in the street in protest right now, because eating kittens is such a morally reprehensible action.
CONAN: Yet we see things like, obviously a terrorist attack, a human action, really centers everybody’s attention. Tens of thousands of people die on American highways every year and nobody notices.
Prof. GILBERT: Well, you’re exactly right. I mean, one of the things that the human brain is specialized for is other human beings. They are the greatest source of reward and punishment in most of our environments. We’re a highly social mammal, and our brains are awfully good at looking for, thinking about, and remembering any sign of other people and their plans and their intentions. That’s why we see faces in the clouds but we never see clouds in peoples’ faces. If you play people white noise for long enough, they begin to hear voices in it. But they never hear white noise in voices.
So we’re looking. It’s as if the brain is tuned in to the signal of other human action. And that’s why when other people do things to us, we’re very, very quick to respond. We respond to terrorism with unrestrained venom and with great force, just as our ancestors would have responded to, you know, a man with a big stick. The problem is climate change doesn’t have a human face. It’s not an Iraqi with a big mustache. It’s not somebody we can villainize. It’s not a man with a box cutter. And so if there’s no one to vilify, there’s no face to put it to, it’s hard for human beings to get very excited about it.
CONAN: Let’s get a call in from Guillermo, Guillermo calling from Raleigh, North Carolina.
GUILLERMO (Caller): Hi.
CONAN: Hi.
GUILLERMO: I guess my point is similar along the lines – somewhere along the way in school I heard a story basically along the lines of more complex issues humans don’t process that well yet. So, for example, if a person had to hear all of the news events that occurred on the planet earth in a single day, your brain wouldn’t be able to take it. And I just wanted him to see if there’s any truth in this, or…
CONAN: Does quality relate to our quality of alarm?
Prof. GILBERT: Well, you bet it does. I mean, climate change in some ways is a very simple issue. But those who profit from not taking action against global warming have turned it into a complicated issue. Why have the opponents – and believe it or not, there are opponents of action against global warming – why are the opponents turning it into a complicated issue? Well, as our caller well knows, if we can make this complicated, enough people will throw up their hands and say, you know, scientists, they all disagree. Who knows what we can really do about this?
You know what? Scientists don’t disagree about this, and what we can do is very, very clear.
CONAN: Scientists don’t necessarily agree on the cause of it. They do agree that it’s happening. Anyway, Guillermo, thanks very much for the call.
GUILLERMO: Thank you very much.
Prof. GILBERT: Well, scientists agree to an enormous extent on the cause of it. You know, it’s interesting, when you look at scientific articles on global warming, there’s enormous consensus. When you look at news articles on global warming, about half of them mention that there isn’t much consensus. It really just isn’t so. Scientists are in vast agreement about the causes of global warming, as much as they’re in agreement about the dangers of cigarette smoking. You could say scientists don’t all agree, and I’m sure there’s somebody out there who’s still saying it doesn’t cause cancer, but by and large…
CONAN: So there you have an evil human face you can put on this. Those who are dastardly working towards profit 50 years hence.
Prof. GILBERT: You see, that’s how I’m getting myself to respond.
CONAN: Thanks very much for being with us, Daniel Gilbert. We appreciate your time today.
Prof. GILBERT: My pleasure. Thanks.
CONAN: Daniel Gilbert’s op-ed was this week in the Los Angeles Times. It’s Why Americans are Afraid of the Wrong Threats.
Again, if you’d like to read the piece, there’s a link to it at our webpage. Just go to npr.org and go to the TALK OF THE NATION page. Also there, all of the other previous Opinion Pages on TALK OF THE NATION.
I’m Neal Conan. This is TALK OF THE NATION from NPR News, in Washington.
Copyright © 2006 NPR. All rights reserved. Visit our website terms of use and permissions pages at http://www.npr.org for further information.
https://www.npr.org/2006/07/03/5530483/humans-wired-to-respond-to-short-term-problems
My comment: I’m not a doomer. I dont think such findings mean we are locked into inaction, or that we are doomed. Perhaps we can overcome these impediments, and renewable energy is gaining traction on its merits and low costs anyway. But its just something we need to understand. And I think some of us are more reactive to distant future events that others, for some reason that seems deeply seated. Like personality differences.
- Zeke's 2026 and 2027 global temperature forecasts
prove we are smart at 07:30 AM on 24 December, 2025Tis the season to be jolly, tralala, tralala, lal,lal,lar... Occasionally I still get optimistic but less frequently now. I agree with Zeke's conclusion {from a link above} "Consilience of evidence
If we were solely relying on drawing trend lines through cherry-picked periods in surface temperature records, I too would be pretty skeptical about making strong claims regarding a recent acceleration in warming.
But we don’t just have surface temperatures:
Acceleration in surface temperatures is more readily apparent and significant when removing natural variability.
Our climate models expect a faster rate of warming under current policy scenarios.
We have a clear mechanism in declining aerosol emissions to explain a recent acceleration.
Acceleration is apparent in both ocean heat content and earth energy imbalance measurements.
In my view this consilience of evidence tips the scale toward pretty clear acceleration in recent years. I hope I am wrong – I’d prefer to live in a world where the rate of warming was flat or falling – but the evidence is becoming too strong to ignore." Here is his link from the re-post article above, www.theclimatebrink.com/p/the-great-acceleration-debate
But as I have learnt, delving into the links and especially the comments to those links,reveal many new avenues of thought.
This link from comments from the James Hansen's link on his recent estimates (above), has really lined up with my thoughts. Can anybody explain to me why this author Steven J Newbury is wrong? theuaob.substack.com/p/the-agency-trap-why-we-must-fail
- Ice age predicted in the 70s
Philippe Chantreau at 04:10 AM on 3 November, 2025Here is another one, figuring as "confirmed cooling": Borisov (1969)
Only the abstract comes up: "Soviet climatologists are vitally concerned with the problem of ameliorating the climate of Siberia and other northern lands as a means of developing these regions for an expanding population. P. M. Borisov, a candidate in geographic sciences, Moscow, examines one means of warming the climate by the transport of Atlantic Ocean water across the Arctic Basin. This could be done by pumping water out of the Arctic Ocean at the Bering Strait, thus accelerating the flow of warmer Atlantic water into the basin. Flow direction would be controlled by means of a dam across the Bering Strait. Borisov predicts dramatic improvement in Arctic climate would result. Huge areas of permafrost would be freed for agriculture in northern Canada and Siberia. Grass would grow in the Sahara Desert. This article, appearing first in the Soviet journal, Priroda, was translated by the Canadian Defence Research Board. It is reprinted here through the courtesy of the Board and by special permission of the editors of Priroda." I don't see how this paper makes a prediction that future global climate will be cooling.
I think I am done with this little list of "papers."
- Koonin providing clarity on climate?
Charlie_Brown at 05:09 AM on 28 September, 2025Ken Rice is lenient with the authors of the DOE Climate Impacts report and with Secretary Chris Wright. Chris Wright states in the Foreword: “I chose them for their rigor, honesty, and willingness to elevate the debate. I believe it faithfully represents the state of climate science today.” I care more about substance than credentials. My public comments included: “The Foreword highlights that the purpose of the Critical Review is to challenge and counter mainstream science. It certainly does not represent the state of climate science today. Rather, it provides a rationalization for weakening current policies for combatting climate change. The authors are neither representative of the scientific community nor diverse.”
The science is not that complex. The report is full of misrepresentation, distraction, and obfuscation. It is not worthy of an undergraduate term paper let alone a critical review of science by PhDs. Many points have been thoroughly discussed and debunked here on the SkS website. My comments included:
1) “Section 2.1 is oversimplistic. CO2 is rarely the limiting nutrient. It discusses photosynthesis as a benefit but ignores adverse effects resulting from CO2 as the primary cause of climate change including drought, extreme temperatures, excess rain, and cropland relocation.”
2) “CO2 below 180 ppm is an irrelevant distraction to the discussion of modern global warming.”
3) “Changing ‘ocean acidification’ to ‘ocean neutralization’ is semantic posturing that does not change the effects. To say that pH reduction is not acidification until the pH drops below 7.0 it is not meaningful.”
4) “Implying that the IPCC uses data manipulation to satisfy preferences is baseless accusatory language. The change in radiative forcing due to the Earth’s orbit around the sun is negligible within the period of modern global warming. The change due to sunspot activity is measured and found to be negligible.”
5) “Comparing 3 W/m2 to 240 W/m2 is misleading and diminishes the significance of 3 W/m2. It is an example of science denialism by distraction, obfuscation, and omission. Straightforward, fundamental physics including conservation of energy and radiant energy calculations combined with atmospheric properties allow the effects of anthropogenic forcing to be isolated by calculation. The calculated spectra of energy loss to space is verified by satellite measurements (Hanel, et al.,1972) (Brindley & Bantges, 2015). 3 W/m2 is sufficient to cause and continue observed global warming. The anthropogenic forcing is not determined by difference of two large, measured numbers and does not rely on just satellite estimates of radiative energy flows. There is very little uncertainty about the effects of increasing gas concentrations.
The effect of clouds is the largest uncertainty in climate models. However, average cloud cover does not change without a driving force. Therefore, the effect of increasing GHG can be isolated by holding clouds constant. Specific humidity will rise with increasing surface temperature, resulting in positive water vapor feedback. This can affect clouds."
Others have submitted many more excellent comments, but I have made my point. The science can be explained and understood by most scientific-minded people who are interested in learning. One does not need a PhD in climate science to understand the flaws in the DOE report.
Disbanding the CWG may not be a sign of progress. It may be a way to avoid the lawsuit by the Environmental Defense Fund and the Union of Concerned Scientists that would restrict the use of the report.
- Koonin providing clarity on climate?
Charlie_Brown at 01:43 AM on 28 September, 2025Evan @ 1 100,000 year cycles are caused by the Milankovitch cycles of the Earth’s orbit around the sun. CO2 fluctuations were the result of ocean temperature changes. It is hypothesized that at the beginning of ice ages increased dissolution of CO2 in cold water, the result of the temprature dependence on Henry's Law, slows cooling by reducing CO2. Evolving CO2 from warm water at the end of an ice age enhances the rate of warming.
This time is different. This is the first time in the history of the planet that CO2 and other GHG concentrations are increasing rapidly due to emissions from human activities.
Everyone dies. That is natural. When someone causes someone else to die, that is immoral.
- Climate change is accelerating, scientists find in ‘grim’ report
MA Rodger at 14:45 PM on 18 September, 2025Evan @3,
You set out your "point" that, in your opinion, "the warming would likely continue due to how we have already affected the balance of natural GHG sources and sinks" even after every humanity has effectively disappeared.
The carbon cycle is understood enough (and has been understood for some time) to allow studies to conclude that the carbon sinks will continue to outweigh any natural sources and the resulting reduction in GHG will roughly balance the remaining unfulfilled warming from our emissions. Thus warming effectively stops once our emissions stop.
There has been work looking at the potential for large new sources of natural emissions or the stifling of sinks. These include the likes of methane emissions from melting permafrost or warming Arctic seas, the cascading collapse of econsystems like the Amazon rainforest or the capacity of oceans to absorb CO2 in a warmer world. (Your mention of "feedbacks" @5 - you may have specific examples in mind.) Some of this past work has sounded pretty worrying but such worrying findings have not survived full analysis.
Beyond 'net zero', there are also calls for 'net-negative emissions' that don't get discussed as much as they should. These are seen as globally necessary if our emissions are not cut quickly enough, a situation which seems pretty certain to happen. 'Net-negative' does not address future warming but works to reduce the time over which peak warming continues.
- Update on Texas flooding
One Planet Only Forever at 04:19 AM on 21 July, 2025RedRoseAndy,
This comment is nearly identical to the comment you made in April on the 2025 SkS Weekly Climate Change & Global Warming News Roundup #16 linked to here. My response there still applies to your slightly modified comment (except it is obviously now too late to have the thoughts be part of the UN Ocean Action Panel event.
In the future if you see a potential to repeat this input on a new SkS posting you could simply point people to the comment you made in April (like I have done).
Note that your comment does not appear to relate well to this specific item. The comment made in April was related to some of the articles listed in the News Roundup #16. So it would be better to point people to the April comment, not this one. And supplementary related points should be made on that item, not on this item.
- Fact brief - Was 'global warming' changed to 'climate change' because Earth stopped warming?
Charlie_Brown at 06:57 AM on 2 June, 2025There are, or at least there should be, technical differences between the terms. The greenhouse effect results from the presence of greenhouse gases and natural concentrations keep the Earth from being an ice rock planet. Global warming results from increasing the concentration of greenhouse gases. It upsets the global energy balance and results in accumulated energy. Climate change results from an uneven distribution of accumulated energy around the globe. Major atmospheric and oceanic circulation patterns are changed. There have been large climate changes in history from natural causes, but this time the cause is emissions from anthropogenic use of fossil fuels and fossil rock. Severe weather results from localized and sudden changes in the uneven distribution of energy.
Depending on the message, the terms global warming and climate change might be used interchangably, but I prefer being clear with the technical distinction. Sometimes it seems appropriate to use them together, as in increasing GHG concentrations cause global warming and climate change.
- At a glance - Is the CO2 effect saturated?
Bob Loblaw at 03:05 AM on 1 February, 2025sychodefender @ 34:
For feedbacks, they start as soon as any system change occurs. When CO2 rises, it take a bit of time for temperature to rise, and then once temperature rises, atmospheric water vapour will rise, which will have a greenhouse gas heating effect (after a bit of time...), etc.
...but I have left "a bit of time" undefined for the moment. There are many different factors that take varying amounts of time to respond to changes. MA Rodger's response @ 35 touches on several of these factors.
Obviously, day-to-day weather causes changes in temperature, which will cause day-to-day feedback effects, etc. When we talk in terms of climate, though, we are more interested in the persistent changes, and how factors relate over longer periods of time. We also often talk about averages over large areas, not local effects such as your back yard.
Taking MA Rodgers statement about "increased evaporation adds 7% H2O capacity for every +1ºC", we are talking about longer term effects - e.g. decades. You won't see this simple a relationship when discussing day-to-day local weather. This relationship is looking at global trends over decades.
We can't instantaneously double atmospheric CO2 in the real world (thankfully!), but we can in a climate model. Back in 1981, Hansen et al published a well-known paper on CO2 and climate that included an interesting diagram.
Hansen, J., Johnson, D., Lacis, A., Lebedeff, S., Lee, P., Rind, D., & Russell, G. (1981). Climate impact of increasing atmospheric carbon dioxide. Science, 213(4511), 957-966
They ran a computer model where they instantaneously doubled atmospheric CO2, and their figure 4 shows how energy fluxes changed over time.
 fig 4")
This is a somewhat complex diagram, so bear with me a bit.
- The first panel shows the immediate response. We see a very slight increase in atmospheric absorption of solar radiation, a larger reduction of IR loss to space, and some changes in the radiation, thermal, and evaporation fluxes between the surface and atmosphere.
- A lot of things are now "out of balance", so changes will occur.
- Notice that the change in IR loss to space (ΔF) is -2.4 W/m2. Combined with the change in solar (ΔS = 0.1), we get a net change of +2.5. This is the "climate forcing" that MA Rodger refers to. This is what drives the overall warming of the earth-atmosphere system.
- The atmosphere is the fastest to respond to these energy changes, because it does not require a lot of heat to warm up air. Land will heat up more slowly, and oceans even slower than land.
- In the middle panel, we see what is happening "a few months later". The atmosphere has restored its local balance, but the surface has not - so the whole system is still out of balance. Surface temperature (Ts) is still the same as it was at the start.
- The net climate forcing is now +3.9 (similar to the 3.7 number MA Rodger states in comment 35. Different models will vary slightly on what this number should be.)
- The atmosphere has now had a chance to warm - and get more humid. So now, we see the effects that include the feedback.
- With water vapour feedback now active, the net global imbalance has increased from +2.5 to +3.9. Roughly 50% larger than if there was no feedback.
- The last panel is "many years later". The entire system has balanced again.
- The atmosphere has a net balance of zero.
- The surface has a net balance of zero.
- The whole system has a net balance of zero.
- ...but note that many of the internal energy fluxes are different from what they were before CO2 was doubled.
- Absorbed solar has change for both the atmosphere and surface. Total net solar (ΔS) has only increased by 0.1, but where it is absorbed is different - more in the atmosphere and less at the surface.
- IR loss rates to space have changed. Net change (ΔF) is only 0.1 (to balance the change in ΔS), but again we see that contributions from the surface and atmosphere have changed.
- IR exchanges between the surface and atmosphere have changed. The climate is warmer, so IR fluxes have increased in both directions.
- Convective fluxes (thermal and evaporation) between the surface and atmosphere have changed slightly.
- ...and surface temperature is now 2.8C warmer... (Global warming!)
- ...so we are living in a different climate, with many changes. A new equilibrium, but one that looks quite different from what we are used to.
Hopefully this is not too hard to follow. As stated before, climate is a complex system. It gets quite difficult to to isolate changes in one part from another. Looking at one part can help understanding - but you do need to be careful about over-emphasizing what you see in that one part (and missing another important part). Much of what you can call "contrarian" positions involves over-simplifying the system, to the peril of leaving out parts that do matter. You're doing the right thing by asking questions.
- At a glance - Is the CO2 effect saturated?
MA Rodger at 19:47 PM on 31 January, 2025sychodefender @34,
So if there were a doubling of CO2, this would imposed a climate forcing of +3.7Wm^-2 on the planet. And this would begin to warm the planet with some +1.25ºC warming arriving in a decade (and the remainder taking far longer having to warm up deep oceans and melt ice caps).
This warming will act to restore the planet's temperature equilibrium but the warming is being amplified due to the water content of the atmosphere. Physics tells us that increased evaporation adds 7% H2O capacity for every +1ºC and measurement shows this is happening.
Being itself a greenhouse gas and with the altitude of cloud formation in a warmer atmosphere, this extra H2O adds to the required warming to reach equilibrium. It's roughly three steps forward, two steps back.
So after that decade, assuming constant CO2 since the doubling, the remaining imbalance would be about +2.3Wm^-2. The warming so far will have seen the imbalance drop, +1.4Wm-2 due to CO2 and +2.8Wm^-2 from the H2O.
Note that the H2O feedback works very quickly. As soon as there is a temperature rise, the water will be evapourating from the oceans with the march towards equilibrium being thus that three steps forward, two back.
Thats the basic version. It gets much more complicated in the detail. - At a glance - Is the CO2 effect saturated?
MA Rodger at 02:42 AM on 29 January, 2025sychodefender @30,
Another take on answering you questioning....
As you say, the climate forcing from mankind's CO2 emissions does cause feedbacks, these most evident in the water cycle, humidity, cloud cover, cloud height (this last the least understood). But there is no "self-sustaining loop" or even any significant CO2 emissions consequent from mankind's emissions as a feedback. There is thus no need for a natural mechanism to prevent run-away global warming.
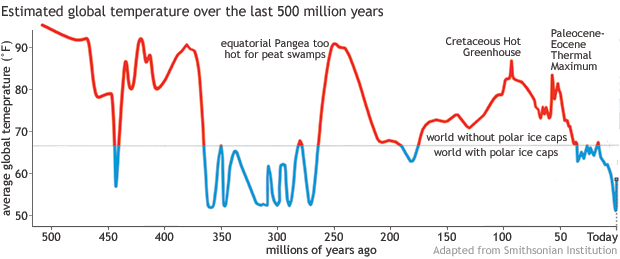
You mention CO2 in this "natural mechanism" and CO2 has operated naturally as the major control knob for the climate through the eons. (Calling CO2 the 'control knob' should not be in any way controiversial.) The ancient Earth's climate is a bit of a mystery as the sun was less energetic in the early solar system (and from its weak beginning will continue to strengthen) and with no means of knowing the ancient atmospheric composition the 'faint sun paradox' remains unexplained. More recently, over the last 500 million years the temperature record is reasonably well known. (Through that time the sun has brightened by about 5% which is a climate forcing equivalent to roughly a quadrupling of CO2.)
There are a few very-long-term mechanisms at work altering the carbon available for the carbon cycle (in the atmosphere, bliosphere and ocean waters, these being in equilibrium for multi-millenial periods).
Taking CO2 from the atmosphere into rocks as coal was a major process in warm climates for early parts of this 500My period as back then fungi were not well developed enough to decompose plants which could thus be buried and turned to coal. Modern fungi prevents such significant coal formation.
A second mechanism is the water-weathering of mountain rocks which allows the formation of carboniferous rock in sea water. When the 700Gt(C) humanity has emitted so far has reachen equilibrium between biosphere, ocean and atmosphere (which takes abut a millenium), the remaining 25% of our emissions in the atmosphere (assuming only natural processes) will require rock-weathering to be extracted, this taking tens of millenia to complete. At a similar rate of action, the formation of the Himalayas and associated increase in rock-weathering has seen the atmospheric CO2 content drop over the last 50 million years and with it the cooling of the planet.
Once this deposit of carbon into the geology occurs, it is volcanism that works to return it to the carbon cycle. Thus when the planet is so cold that there is no rain to weather rocks and no significant biosphere at work, the volcanic activity will slowly pump CO2 back into the atmosphere restoring the level of greenhouse effect. The emissions are very small relative to mankind's emissions (perhaps about 1%).
You mention Milankovitch cycles which have been waggling the planet's temperature for the past 3 million years (initially as a 40ky cycle, then 100ky).
The Milankovitch cycles are not so strong in themselves but are amplified by positive feedbacks. Within these cycles, CO2 is part of that positive feedback (increasing the size of the wobbles) with carbon being locked away under frozen land and in cooling oceans under increased sea ice. However the big driver of recent ice ages is albedo not CO2.
You mention the logarithmic relationship between CO2 levels and climate forcing. This is an empirical relationship for concentrations in the range 150ppm to 1300ppm. As Zhong & Haig (2013) fig 6 shows, beyond 1300ppm the forcings increase faster than logarithmic. By then, of course, an increase in the CO2 consentrations would need to be four-times an increase to add the same extra forcing. But we don't want to be creating a world with 1300ppm. It would have already been under a forcing of 8.4Wm^-2 from the extra CO2, perhaps global warming of +7ºC.
- Stop emissions, stop warming: A climate reality check
MA Rodger at 04:19 AM on 27 December, 2024rkrolph @8,
The quote you provide comes from a 900 word essay entitled 'Progressive myths harm the honest discourse' by Michael Huemer, a professor of philosophy at the University of Colorado at Boulder. The essay is really no more than an advert for his book 'Progressive Myths' (Amazon preview here).
In both book and essay he rails against "political activists" saying that "Nearly every piece of information they disseminate is a distortion or outright lie," and also that their influence is pervasive. In the essay he cites three exemplar "lies" promulgated by such "political activists." The three exemplars given are:-
(1) Women earn just 82 cents for every dollar that men earn for the same work;
(2) Police shootings show a marked racial bias against Black Americans;
(3) Global warming is an existential threat to America and the world.
These are, of course 'progressive' lies as are the nine "myths" featured in his book (according to this book review) and with Huemer apparently a 'libertarian' (according to the reviewer of the book who does say but not convincingly Huemer "also addresses falsehoods from the far right"). With the subject of the book being titled "Progressive Myths", some significant bias should bring no surprises. The Amazon book review linked above shows the book's Part VI containts three chapters:-
19 The Global Warming Consensus.
20 Existential Climate Risk.
21 Mask Science, which presumably is about spread of the recent pandemic.
(I should point out that, as I am a more-progressive less-libertarian Brit sat on the other side of the pond, I would consider the egregious lies and denials spread by 'libertarians' in the US should be far more of an issue and a concern. Thus I see the book as the lesson of Matthew 7:3-to-5 at play here.)
With that preamble from me, is there any merit to the notion of "global warming is an existential threat to America and the world" being nothing but a "progressive myth," as Huemer says? Is it indeed a lie? And do "Virtually no serious scientists think that global warming is an existential threat"?
The first thing required to be clear is what is meant by "existential threat."
There are some lunatics who talk of an "existential threat" to humanity, apparently suggesting that the Homo Sapiens species could become extinct. But such a notion is not being considered by Huemer.
The future exisitence of "America (USA) and the world" is the issue at hand. In the Amazon book review linked above which was lilely written by Huemer, the question is put "Is global warming really going to destroy human civilization?" Put another way, could we be** stoking a collapse of the USA and/or enough of the sovereign states of the world to collapse the world economic order. Note that more will be in play that AGW itself. Without collapsing the entire world order, the remaining sovereign states will almost certainly be arguing over resources, with the environmental impacts of AGW thus precipitating political conflict and thus further chaos.
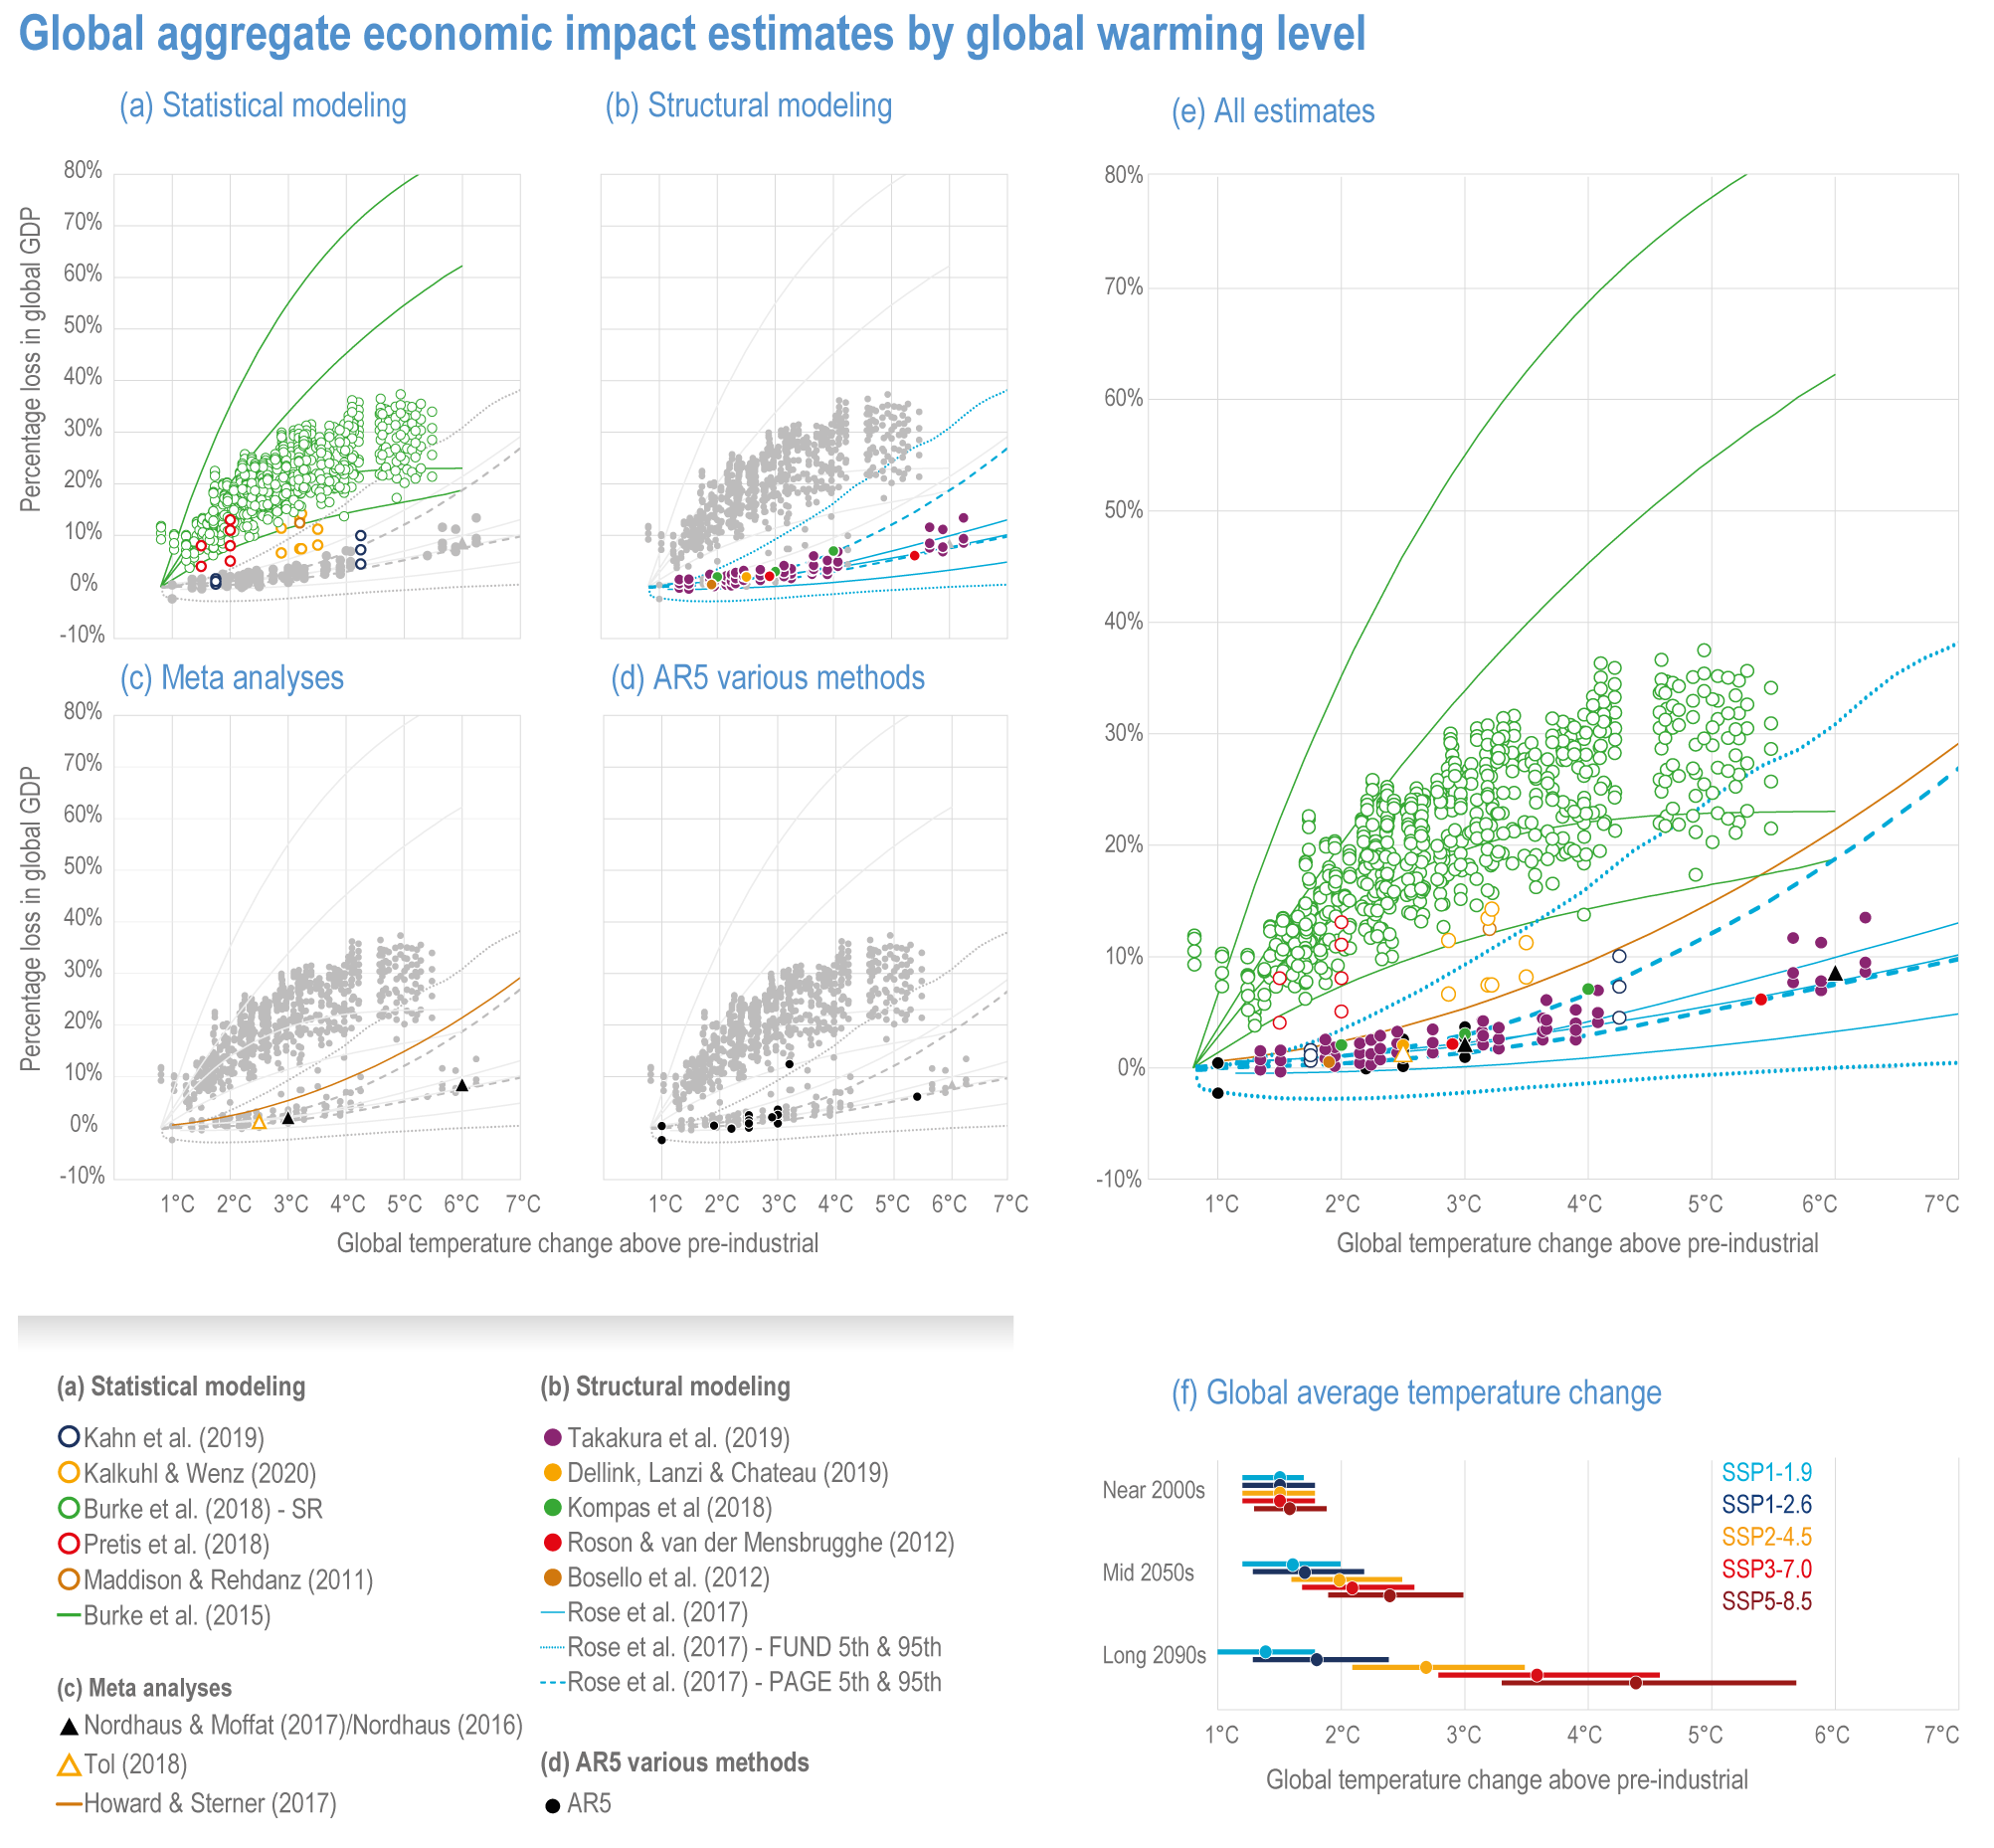
(** There is considerable uncertainty with the climate effects of AGW, even when a global level of warming is a given. There is thus a lot of uncertainty even before the level of AGW is converted into a measure of economic impacts.) The evident uncertainties within any assessment of the economic damage from AGW means assessment has to account for a less-than precise answer. The average of the potential results does not really provide a worthy assessment. It would be properly some assessment of the worst likely outcome.
And that leads to the work apparently setting-out what will be the financial impacts of AGW. In the most recent IPCC AR6 the conclusion is that no identifiable range of economic impacts globally is apparent due to the varying methodologies producing such a wide range of results. This range has increased since the limited analyses reviewed in AR5. Further complications include there being non-linear impacts with increasing AGW and there will be significant regional variation.
But to at least put some numbers to it, the range shown in AR6 for +4ºC of AGW is +3% to +33% with the CI ranging from negative to +66%. (Note the authors of these lower evaluations do come under fire and the likes of Richard Tol are well known for presenting a denialist stance.) This range compares to the "2.5% of GDP by 2100" stated by Huemer without any mention of the level of AGW assumed. It also compares with the range given in AR5 Box 3.1 "These incomplete estimates of global annual economic losses for temperature increases of ~2.5°C above pre-industrial levels are between 0.2 and 2.0% of income (medium evidence, medium agreement)."
There are many difficulties facing these researchers trying to set some sort of economic cost to AGW, mitigated or unmitigated, some examples being:-
☻ The 2100 time-frame usually chosen ignores some very serious issues, not least Sea Level Rise over multi-century timescales. Greenland melt down will become inevitable at some point below 2ºC AGW if it continues at that level. Thus it becomes a certainty for continuing AGW of +2ºC to resultant +7m SLR over a millennium or so. At +4ºC, there would be an additional +8m SLR from other land ice loss.
☻ There are many saying the undeveloped nations will see negative economic growth under unmitigated AGW. This may well not have such a big simplistic impact on global economic growth as the deveolped world accounts for the vast majority of the global economy. So if say Madagascar were to melt into the Indian Ocean and disappear, the global economy shrinks by just 0.1%. But also the 30 million inhabitants would thus be looking for some sort of future beyond their lost homeland. Some may see such migrations boosting economies elsewhere while others may see it as a more significant annual cost than the $500/head/y lost from their present day autochthonic productivity.
☻ The potential size of unmitigated AGW has been reduced in the minds of some researchers because the world has turned against using coal. This is argued because there are insufficient non-coal FFs to create much more than +3ºC AGW. Yet such an assumption remains to be fully argued out.
And do "Virtually no serious scientists think that global warming is an existential threat"? There is another philosopher who talks as though no scientist could seriously say it is not an exisitential threat. "In the worst-case scenarios in scientists’ climate models, human-caused climate change is a threat to the continued existence of many species and to human society as we know it."
To conclude, Huemer presents a predictably denialist (and he insists he is not an AGW denialist) with his outlandish pronouncements entirely out-of-kilter with him being a growed-up philosopher and all.
- Climate Risk
Bob Loblaw at 00:58 AM on 5 November, 2024Paul @ 5, 7:
I wouldn't say that Curry has flipped - but I have to admit that I have not being paying a lot of attention to her and I have never had the impression that she has a coherent, logical, consistent position on much related to climate science. She would have to actually hold a position in order to be able to flip away from it. She has a history of broadcasting all sorts of whack-a-doodle stuff (calling it "interesting") - but in a way that she can deny she supported it (or opposed it) when the cards line up.
So, in that tweet, what the heck is she really claiming she has been saying for over a decade now? Only the contents of David Wallace-Wells' tweet, which says little? If you interpret his tweet as saying that there are other factors besides CO2 driving the current warming trend, and stopping CO2 emissions will have little effect, then maybe that fits her history of obfuscation and attacks on climate science as we know it. But is that what David Wallace-Wells really means?
We could try to find David Wallace-Wells' article at The Conversation. Not hard. It's here. Want more detail? The article at The Conversation links to the actual paper it is based on. It is here.
I have not read the paper in detail - it is moderately long and technical - but I can get the gist of it. It certainly does not support any argument that CO2 levels are less important than presented in the IPCC reports and positions. What the paper does seem to present is an argument (from model simulations) that the expected drop in CO2 levels after reaching net zero - due to fast parts of the carbon cycle continuing to remove CO2 - will be offset by other slow feedbacks in the climate system that will cause continued warming.
The paper uses the Australian Community Climate and Earth System Simulator Earth system model (ACCESS-ESM-1.5), which appears to include a number of slow-response feedbacks related to ice, ocean circulation, etc. (The paper provides references that explain that model in more detail, but the details are not apparent from a quick read of the current paper.)
So, the gist of this new paper seems to be that slow feedbacks often not included in many models will make things worse than expected, once net zero is reached. They also indicate that the longer we wait to reach net zero, the worse things will be.
This may fit into Curry's Uncertainty Monster scenario ("See, I told you there were things the models didn't get right!), but it is an uncertainty that will bite us in the posterior regions - not Curry's favoured "everything uncertain will fall to our benefit".
I would not be surprised if Curry hasn't actually read the paper (or maybe even the Conversation article), and just saw what she wanted to see in the tweet - without actually understanding it.
- Climate Risk
nigelj at 11:08 AM on 24 October, 2024Jess Scarlett, I appreciate your concerns, but the amount of CO2 released by drilling holes is totally insignificant. Even volcanic eruptions have not released enough CO2 to explain the recent warming trend. Scientists have spent thousands of hours researching these issues and every possible cause of warming and every possible source source of CO2 before ruling them out. You can find this material with a simple google search and by scanning through the information in the "climate myths" box on the left hand side of this page.
If you are suspicious of the temperature record in Australia then I suggest please look at the global surface temperature record over land. Look at the global temperature in the oceans. Look at the ballon temperature record. look at the upper atmosphere temperature record. They all show roughly the same warming trend. Urban and rural areas show the same warming trend. One set of data might be in error, but it seems very unlikely to me several would be.
Also sometimes the raw data has problems, so needs adjustments. For example data from early last century from ships were found to be in error, and the raw data was adjusted DOWN so actually reduced the warming record. This is hardly a sign of people wanting to exagerate the warming trend. If you are still sceptical about temperature data, look at the UAH satellite temperature record compiled by Roy Spencer a scientist and a climate change sceptic, but even his temperature record shows robust warming.
If you still dont believe the global temperature records, and that the world is warming, you are beyond being reasoned with.
Your comments do suggest you may have been persuaded by conspiracy theories. The idea that there is an international movement by tens of thousands of meterologists and scientists to deliberately exaggerate warming is just insanity. There is no rational motivation for such a thing. No government wants expensive problems to deal with and is certainly not going to invent them when it gets plenty dumped on its plate anyway. It would be impossible to have a giant conspiracy like this and keep it quiet. Some of these guys would leak the truth. Its like the idea that NASA faked the moon landings. This doesn't stand up to even the slightest scrutiny.
Yes the renewables have their downsides and require a lot of mining. And yes the corporate sector benefit from building renewables and sometimes the business world is a dirty affair. But what is your better solution to the climate problem? Because its a huge environmental problem that is affecting not just human society, but the natural world, and you say you are a greenie, right?
Lots of your statements are false at PC points out. And evidence free. I suggest don't let any concerns you might have that we are potentially neglecting our various other environmental problems bias you against the climate issue. I don't see evidence we are neglecting other problems. Personally I think we have to deal with both the climate problem and other environmental problems together , and humanity is obviously able to deal with several problems at the same time.
- 4 Hiroshima bombs worth of heat per second
MA Rodger at 21:14 PM on 9 October, 2024One Planet Only Forever @52,
The difference (4 bombs & 9 bombs) is indeed due to a different EEI numbers which are increasing with time. The OP uses 8Zj/y. The 1.12Wm^-2 quoted by philalethes @48 is 18Zj/y. But even that could be now out-of-date.
The actual EEI wobbles a lot and through 2019 12-month average CERES number is 1.30Wm^-2.
The quoted 'EEI (from 2019) = 1.12 W/m²' value presumably comes from Loeb et al (2021) 'Satellite and Ocean Data Reveal Marked Increase in Earth’s Heating Rate' which puts it as "1.12 ± 0.48 W m−2 in mid-2019," this based on a linear (OLS) fit through CERES data, a linear rise 2000-19 backed by the OHC data for the same period. The CERES linear fit gave a +0.05Wm^−2/year increase in EEI, the OHC +0.04Wm^−2/year, both with big error bars (making the results barely statistically significant at 2sd).
While we now have had a few more years of looking at EEI, the 2000-to-date OLS thro' the CERES data is still yielding the same basic result suggesting today a value of 1.37Wm^-2/y. But the point of such an analysis (which as a strict linear value would point to AGW starting only in 1995) is to work towards an attribution of the increasing EEI.
(The EEI numbers presented by the ClimateChangeTracker EEI page stretches back to 1985 when estimates of EEI were cooling due to volcanic eruptions (El Chichón 1982 & Pinatuba 1991). Within the wobbles, the latest 12-month average (to June 2024) is +0.95Wm^-2.)
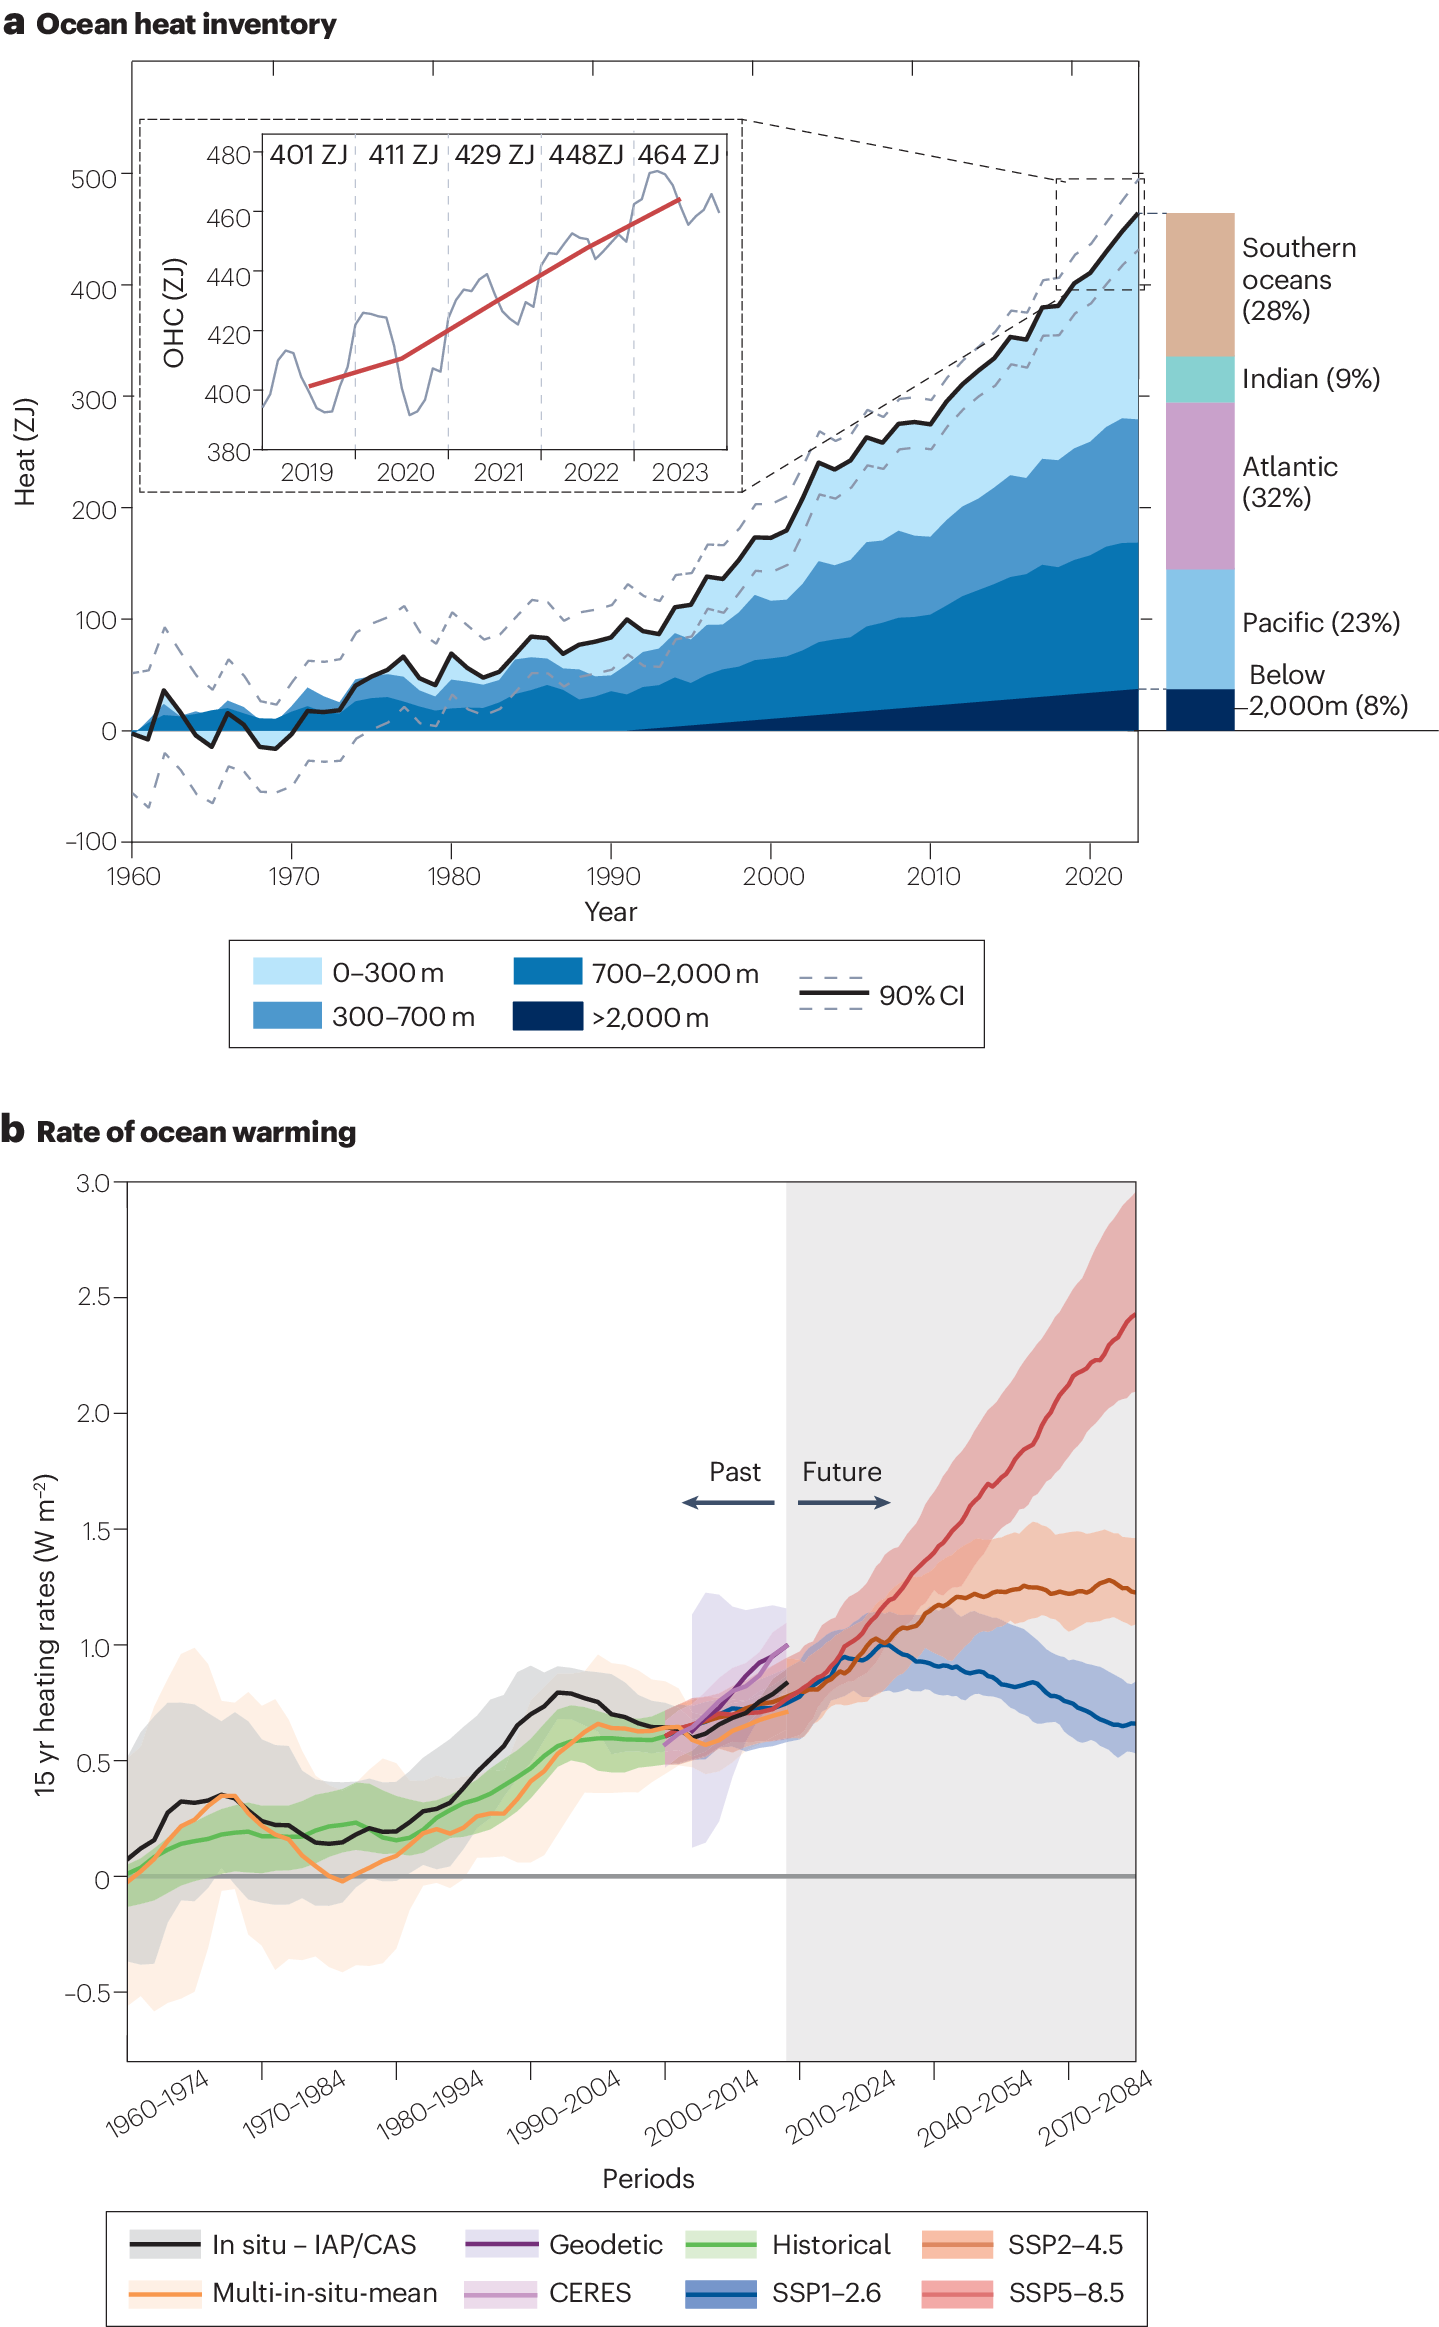
Reconciling CERES numbers with longer in-situ OHC data isn't entirely achieved with such OHC data significantly lower, although OHC calculated from sea level (geodetic) data gives a good match to CERES. The graphic below is from Cheng et al (2024). Note numbers in the insert in graph suggests 2020-23 OHC rising at 17.7Zj/y.
- The doom spiral
Jan at 19:49 PM on 20 September, 2024Sadly, climate scientist have no time to follow the path single discussions on feedbacks take. Therefore, they think models can in anyway predict what is comming. Unfortunately they can't! So many models errors of Earth system developments now amerging that one can only vomit.
Thererby, models miss way too many feedbacks which are now soming into motion.
The Amazon is now trapped in the vicious cycle, speeding up its collapse decades earlier then predicted. Antarctic heatwaves and see ice losses also happens decades earlier then predicted.
The methane feedback has started while models did not see a significant signal till 2100 to emerge. The methane modul of models is crap! But do not know if the new one is already deployed.
Be it as it may, the warmings of the Arctic methane bomb are now out and will increase the comming years as recent observational studies are quite worring. Not only Yedoma permafrost emits much more, but the real danger will be geological methane from methane hydrates and gas rich sediment layers, which is a wild card, which is ever more observed and documented - methane of thermogenic origion reaches the atmosphere where measurements have been made, while ground water melts its way downward through cracs driven by osmosis.
Marine heatwaves, a feedback of oceans warming too fast, are also not predicable by models as they are driven by small scale to global circulation patterns in the oceans and atmosphere. We have now the first MHW in the North Pacific reaching in its peak regions some 7-8°C above the 1981-2011 average (one cause: Asian flooding amplifying the subtropical North Pacfic high via hot upper air currents).
Not only that marine heatwaves expanded non-linear, they are also a game changer in terms of ocean heat uptake, circulation patterns, and extreme events. Models were not able to predict their spread which can only be described as nuts.
Next problem we face is that over the oceans first 300m ocean heat is now building up, in the mode water and intermediate water mass regions the heat buildup spreads to deeper layers with subsurface water masses warming, freshening, and expanding. Very bad sign indeed!
First study came now out that vertical mixing of the oceans could already be suppresed by increasing stratification. Further, we see worrying changes in mode water masses in the Northern Hemisphere. At the same time recent changes around Antarctica (e.g. warming and hemispheric temperature gradient declining -oops!) are also worrying as it has been the Southern Ocean that had been mostly responsible for the monotoic trend of incrasing heat uptake the last 20 years - intensfying winds around Antarctica the major reson (Ozone hole supported that development of increasing hemispheric temeprature gradient).
Just now the experts of ocean mxing and ocean heat uptake trying frantically to find out which processes controlls heat uptake of the oceans as we did never really loocked into it. But now the changes become so worrying that our simple assumption that the oceans would continue their monotoic trend in increasing heat uptake like nothing was amiss doesn't matter how fast we warm our planet had been way too simple.
If ocean heat uptake declines from 90% of the extra energy to 80%, the whole goes fast bam, as a too fast warming had been the problem in the first place.
And if oceans should start to take less than 90% of the extrem energy kept in the system, all the other feedbacks will be triggered.
This can go very fast! Doomer? Stupid framing of the system, as the above is in all points a real possibility as we do not know when and how fast feedbacks could start to synchronize.
And if this should happen the only chance humanity will have, will be to reduce GHG conrentrations in the atmsphere as fast as we can do it united as a species figthing for its own survival!
Sadly, many climate scientist have become statisticans and thereby they have lost contact with reality as the discussions deep in the mechanics of our climate systems point something very clear out:
We are now flying blind and even an extinction level event is a possibility whch can progress fast!
- 2024's unusually persistent warmth
Bob Loblaw at 05:07 AM on 18 September, 2024pattimer:
My first reaction is to think "nothing chemical or biological". The energy sink that we see as global warming is entirely physical - thermal energy. Plant photosynthesis does store energy from the sun, but that is essentially offset by the release of energy as biological carbon decomposes.
Most of the energy imbalance (solar radiation absorbed, minus infrared radiation emitted out to space) goes into oceans. The heat capacity of air (the entire atmosphere) is a tiny fraction of the heat capacity of the oceans.
Our routine temperature observations only cover small proportions of the ocean/atmosphere systems. Our most detailed ones are air temperature near the surface - your everyday weather station data. When you see global air temperature fluctuating during El Nino cycles, we are seeing a shift between what stays in the atmosphere and what goes into oceans.
I think it will take time to figure out just what part of the oceans is storing less heat during this period of warmer atmospheric temperatures. And even more time to understand just exactly how the physics has played out.
...but my gut says "physics", not chemistry or biology.
- 2024's unusually persistent warmth
pattimer at 19:57 PM on 17 September, 2024Could there be some change in the Oceans other than the El Nino cycle, perhaps chemically or biologically that is limiting the oceans previous ability to absorb as much of the global to absorb as much of the global warming
? - What should you do to prepare for the climate change storm?
One Planet Only Forever at 02:06 AM on 5 September, 2024Here is some additional information for TWFA, and others who have developed and share misunderstandiings like they have, to thoughtfully consider and respond to.
Today, NPR published the following report: “Coastal flooding is getting more common, even on sunny days”. It is a detailed evidence-based report about the current and future reality regarding the impacts of recent rapid sea level rise due to global warming caused by human activities on this planet. It includes the following quotes:
"The costs of high-tide flooding are enormous. Even a few inches of water can make neighborhoods inaccessible to some residents, including those who use wheelchairs or rely on strollers to transport young children. And standing water can also snarl commutes, block emergency vehicles and cause secondary flooding if sewers back up into buildings or overflow into natural bodies of water."
"Sea levels don’t rise at the same rate everywhere, and the effects of high-tide flooding are even more pronounced in places where sea levels are rising most rapidly, the report notes. In the last 25 years or so, the number of days with high-tide flooding has increased by a whopping 250% or more in many regions, including along the Gulf of Mexico, and in the Mid-Atlantic and the Pacific Islands."
"And there’s no reprieve in sight, as global temperatures continue to increase and sea levels continue to rise. The average number of annual high-tide flood days for the U.S. is expected to top 45 days by mid-century. Local governments in many coastal areas are racing to upgrade infrastructure to withstand salt water, improve sewers and drainage and budget for the costs of damage and disruption from high-tide flooding."
"While high-tide flood forecasts do not consider flooding from storms, the same sea level rise that is driving more sunny day floods also exacerbates coastal storm flooding, as residents of Florida, Georgia and South Carolina experienced following Hurricane Debby. The storm came ashore in Florida as a weak Category 1 hurricane and was quickly downgraded to a Tropical Storm, but storm surge and rain has nonetheless caused catastrophic flooding across the Southeast, in part because rising seas mean the ocean is closer to the built-up coastline."
- On Hens, Eggs, Temperature and CO2
MA Rodger at 19:27 PM on 4 September, 2024rkcannon @16.
Assuming Mark Johnson @18 is correct and you do refer to the graphic posted @6 (which seems entirely sensible), your question has still not been properly addressed.
And that presumably is to ask why the CO2 fluctuations through recent ice ages (180ppm to 280ppm) are associated with large temperature fluctuations (10ºC peak-to-peak) but the larger recent anthropogenic CO2 (280ppm to 420ppm) doesn't result in any commensurate temperature increase in the graph.
There are a number of factors to consider.
(1) The forcing from changes in CO2 is logarithmic, so the recent CO2 forcing would be slightly smaller than the ice age forcing (2.2Wm^-2 as opposed to 2.4Wm^-2).
(2) It takes time for the temperature to react to an imposed forcing so only about two-thirds of any CO2-forced increase would have occurred in the decades of man-made warming so far.
(3) The ice age CO2 forcing was not the major forcing through ice ages. The change in albedo due to the shrinking ice sheets and the rising oceans would be double the CO2 forcing. Other factors like methane and dust were also in play. (The orbital forcing that triggers ice ages is very minor.) Increasing CO2 contributed perhaps a third of the ice age forcings.
(4) The temperatures being plotted are from the EPIC ice core data and thus Antarctic temperatures which wobbled tiwce as much as global temperatures through the ice ages. (Note the modern CO2 value has been added, marked with an asterisk. Grafting on the modern EPIC temperature record would be difficult, and would not show much as the instrument record is more wobble than rise.)
So taking (1) to (4) into account, the 10ºC ice age cycle in the graphic @6 would be a little smaller, say 90% (1) then a third off (2) then two-thirds off (3) and finally halved (4). So the global temperature should be very roughly something like [10ºC x 0.9 x 0.67 x 0.33 x 0.5 =] +1ºC which is pretty-much what we see globally today. - CO2 lags temperature
MA Rodger at 20:05 PM on 6 August, 2024Blusox69 @664,
The paper you link-to is Koutsoyiannis (2024) 'Stochastic assessment of temperature–CO2 causal relationship in climate from the Phanerozoic through modern times' which is hot off the press. The author should immediately ring alarm bells being a known perveyor of crazy denialism.
This SkS thread deals with the Temp → CO2 → Temp relationship prior to recent times when mankind began to increase atmospheric CO2 levels by burning fossil fuels and clearing forests.
The author of Koutsoyiannis (2024) also co-authored Koutsoyiannis & Kundzewicz (2020) 'Atmospheric Temperature and CO2: Hen-Or-Egg Causality?' which addresses a different relationship and does so with eye-bulging stupidity.
[To explain this stupidity, the measured CO2 record of recent decades has wobbles caused by El Niño impacting rainfall patterns and thus reducing vegitation growth in tropical regions. This effect is enough to slow the draw-down of CO2 and accelerate the atmospheric CO2 increase from human emissions, delaying the absorption of perhaps 15Gt(CO2) over a matter of months. Such a wobble is quite visible on the measured CO2 record. The whole process has been measurd from satellites.
An El Niño also causes a wobble in global average temperature and this temperture wobble arrives earlier than the CO2 wobble This is the situation Koutsoyiannis & Kundzewicz are measuring, a Temp wobble preceeding a CO2 wobble.
What Koutsoyiannis & Kundzewicz entirely fail to explain is the long-term rise in CO2 due to human emissions. This becomes eye-bulgingly stupid when they address the source of this long-term CO2 rise if it is due to rising temperature. They "seek in the natural process of soil respiration" and also "ocean respiration" but fail to actually look and find it. This should be no surprise. While warming biosphere and oceans would release CO2, the CO2 content of the biosphere & oceans is today increasing not falling, not exactly what you'd expect in a CO2 source.]
I cannot say I have read Koutsoyiannis (2024) properly. After a lot of blather, it tells us it there are questions to be asked about the role of CO2 within the climate system. Is it a GHG? Is it "decisive" in this role? Is the GH-effect enhanced in the last century? Are human emissions increasing the GH-effect? Are human emissions "decisive" in this regard? Is mankind the cause of rising CO2 levels? Is CO2 increasing global temperature, or visa versa, or both?
Koutsoyiannis (2024) then lists a bunch of references to support the assertion that "conventional wisdom" is wrong although the science behind the "conventional wisdom" is rather unwisely (and unscientifically) ignored. Note that all nine of Koutsoyiannis's bunch of references is authored by Koutsoyiannis. He has, according to himself, managed to overturned the scientific understanding of our planet's greenhouse effect.
And this new paper, Koutsoyiannis (2024), proceeds to use 12,000 words examining the temporal relationship between CO2 and global temperature for periods back 541million years. I have not read those 12,000 words but they certainly comprise more eye-waterlingly stupid blather.
- Why were the 1930s so hot in North America?
nigelj at 08:08 AM on 25 July, 2024Read a study somewhere saying Americas unusually strong heatwaves during the 1930s (the heatwave index was off the chart) were a statistical outlier resulting primarily from both the pacific and atlantic oceans being in a strong natural warming phase at the same time, combined with local meteorological conditions favouring heatwave formation. This combination was a very uncommon coincidence, but it seems to me that a similar combination of factors in the future is inevitable sooner or later, and when you add in anthropogenic warming since the 1930s, a new heatwave record would be set and by a wide margin, and the impacts would be huge.
Heatwave intensity and frequency has also increased in America in recent decades. Refer:
www.epa.gov/climate-indicators/climate-change-indicators-heat-waves
- At a glance - Was 1934 the hottest year on record?
nigelj at 06:48 AM on 19 June, 2024The following study published on researchgate explores the reasons why the 1930s were so hot and dry in the USA:
"Extraordinary heat during the 1930s US Dust Bowl and associated large-scale conditions. Unusually hot summer conditions occurred during the 1930s over the central United States and undoubtedly contributed to the severity of the Dust Bowl drought. We investigate local and large-scale conditions in association with the extraordinary heat and drought events, making use of novel datasets of observed climate extremes and climate reanalysis covering the past century. We show that the unprecedented summer heat during the Dust Bowl years was likely exacerbated by land-surface feedbacks associated with springtime precipitation deficits. The reanalysis results indicate that these deficits were associated with the coincidence of anomalously warm North Atlantic and Northeast Pacific surface waters and a shift in atmospheric pressure patterns leading to reduced flow of moist air into the central US. Thus, the combination of springtime ocean temperatures and atmospheric flow anomalies, leading to reduced precipitation, also holds potential for enhanced predictability of summer heat events. The results suggest that hot drought, more severe than experienced during the most recent 2011 and 2012 heat waves, is to be expected when ocean temperature anomalies like those observed in the 1930s occur in a world that has seen significant mean warming. (emphasis mine)"
- Climate's changed before
Eclectic at 11:22 AM on 21 April, 2024Spooky @899 , you should not really be surprised ~ since the OP article is referring to Global temperature changes.
Not to the local rapid changes in the boreal icesheet region (e.g. Denmark, Greenland, Alaska : during the last glacial age) as shown in the Bolling-Allerod warming and in the briefer Dansgaard-Oeschger events. Those local northern regions are affected by "sudden" changes in local oceanic currents ~ both smaller & larger (e.g. the AMOC). But that has little effect on the global scale, except when it involves a massive event like the melting of the Laurentide Ice Sheet (i.e. the Younger Dryas).
In India, the Indian Monsoons (to which you allude) show much fluctuation resulting from very small alterations in local temperatures & winds (winds which may bring more oxygen18-rich water) . . . even in the absence of a 30-year climate change.
For global temperature changes, there need to be global-scale changes in albedo / insolation / particulates / or greenhouse gasses.
- How extreme was the Earth's temperature in 2023
Paul Pukite at 01:19 AM on 20 April, 2024nigelj said: "El ninos release ocean heat that has been building up"
The complement to this is that La Ninas absorb atmospheric heat as the cold thermocline approaches the surface, thus exposing a large area heat sink. Thus, a complete swing is -cold to +hot.
So the fact that we have been in a La Nina state the prior few years makes the warming spike even more stark.
Also the AMO shows a significant El Nino-like peak. This is perhaps expected, as the precursor to this situation occurred in 1878 (see chart below) when one of the largest El Ninos recorded occurred in the Pacific, while a similar scaled peak occurred in the Atlantic's AMO.

- How extreme was the Earth's temperature in 2023
Jan at 17:45 PM on 19 April, 2024Made it a little bit nicer, as it is important:
On the causes of the exceptional temperature jump in 2023
First things first:
What was special about the warming in 2023 was, that it happened all in the last 6 months, so it was a much larger jump over these months than the mean values of 2023.
Further, only a moderate El Nino existed, so not too much warming came from here.
Reasons where:
SOx reductions over the shipping routes amplified the marine heatwave signal across the mid-latitudes.
The El Nino in combination with a positive Indian Dipole - both lead to a larger heat release of the tropical oceans as a clear and strong circulation cell is supported over the tropical oceans due to the zonal SSTs gradient.
Sea ice reductions around the Antarctic caused circulation changes that led to moist and warm air advection over Antarctica (strong effect on the warming as exceptional heat waves rocked Antarctica), as well as radiative effects of the sea ice reductions and heat release over sea ice-free areas.
Then that climate warming warms the oceans now more than natural variability is often able to produce colder than normal SSTs - at one time only some ocean regions existed with colder than normal temperatures.
Then we had the vast expansion of marine heatwaves across the global oceans, especially across the mid-latitudes reaching a coverage of more than 40% in July.
The warmer-than-normal Oceans created a cloud feedback thereby increasing shortwave absorption (reinforces marine heatwaves).
From 2012 to 2016 we had a non-linear increase of moisture in the marine boundary layer caused by exceptional SSTs. The next jump will have happened in 2023 causing a water vapor feedback over large parts of the oceans to increase. And tropical moist air advection is causing marine heatwaves in the subtropics to mid-latitudes. So also here is another feedback as more water vapor radiates longwave radiation back to the surface.
Further, we had during summer to autumn large areas where the soil-moisture-temperature cascade came into play producing these exceptional continental heat waves. It comes along with a cloud feedback and supports stalled/fixed high-pressure systems as these heat domes redirect the jet around them (higher troposphere).
Then we had the pattern effect of increasing zonal (east/west direction) temperature gradients at the ocean surface and continents which disturb the overlying circulation, often causing blocking patterns (also a reason for the marine heatwaves to build up)
Then we had towards autumn a heat release of the marine heatwaves across the mid-latitudes, as the atmosphere gets colder. Also, cold core and warm cors eddies cause extreme temperature gradients in the western boundary extension regions leading to a larger latent heat releases over these ocean regions (small-scale pattern effect of SSTs increases wind speeds).
Last it has been possible that the oceans released heat from the subsurface that had built up. Across the mid-latitudes warm freshening water masses are accumulating under the surface as shallow as 150m depth. And these heat depots could have been tapped, as the jets speed up during winter, as the density gradient between the tropics and poles increases in the upper atmosphere while it decreases near the surface, especially during winter. More and stronger low-pressure systems due to increased shear are the outcome. And all these extreme low-pressure systems in autumn and winter across the mid-latitudes in 2023/24 could have tapped these subsurface heat depots. But no study here as this is a new development seen in the intensity of the low-pressure systems the last years (e.g. number of atmospheric rivers hitting the US west coast)
Main problem thou is the expansion of marine heatwaves, as they are feedback driven by global warming heating the oceans from the surface too fast (thermal stratification increases non-linear in the upper 300m of the oceans in various regions), in combination with the pattern effect which disturbs global zonal circulation with the result of more stalled high-pressure systems (low wind speeds are in most instances the main precondition for marine heatwaves to form besides thermal stratification and shallow upper mixed layer depth).
Last the warming of the northern latitudes can also be included in the factors driving global warming in 2023.
In short, the warming of 2023 was feedback-driven by various systems forcing each other into a heating mode with the systems of the oceans, atmosphere, and landmasses acting in unison!
The exact series of which contributed to what extent to the heating science has to find out. But it would have to be done on a monthly basis!
The next jump will have devastating consequences as they become larger...
In my opinion, the model spread is now a joke as it is way too large proving the uselessness of models as they will increasingly become unable to predict what is coming as too many parametrizations prevent them from simulating the non-linear character of the mutually reinforcing systems with many processes operating on small scales...
p.s. we warm the oceans too fast from the surface that is our main problem!
- How extreme was the Earth's temperature in 2023
Jan at 16:59 PM on 19 April, 2024What was special about the warming in 2023 was, that it happened all in the last 6 months, so it was a much larger jump over these months then the mean values of 2023.
Further, only a moderate El Nino existed, so not too much warming came from here.
Reasons where:
SOx reductions amplified the marine heatwave signal across the mid-latitudes.
The El Nino in combination with a positive Indian Dipole - both lead to a larger heat release of the tropical oceans as a clear and strong circulation cell is supported over the tropical oceans due to the zonal temperature gradient.
Sea ice reductions around the Antarctic caused circulation changes that led to moist and warm air advection over Antarctica (strong effect on the warming as exceptional heat waves rocked Antarctica), as well as radiative effects of the sea ice reductions and heat release over sea ice-free areas.
Then climate warming warms the oceans now more than natural variability is often able to produce colder than normal SSTs - at one time only some ocean regions existed with colder than normal temperatures.
Then we had the vast expansion of marine heatwaves across the global oceans, especially across the mid-latitudes reaching a coverage of more than 40% in July.
The warmer-than-normal Oceans created a cloud feedback thereby increasing shortwave absorption (reinforces marine heatwaves).
From 2012 to 2016 we had a non-linear increase of moisture in the marine boundary layer caused by exceptional SSTs. The next jump will have happened in 2023 causing a water vapor feedback over large parts of the oceans to increase. And tropical moist air advection is causing marine heatwaves in the subtropics to mid-latitudes. So also here another feedback as more water vapor radiates longwave radiation back to the surface.
Further, we had during summer to autumn large areas where the soil-moisture-temperature cascade came into play producing these exceptional continental heat waves. It comes along with a cloud feedback.
Then we had the pattern effect of increasing temperature gradients in the oceans surface and continents which disturb the overlying circulation, often causing blocking patterns (also a reason for the marine heatwaves to build up)
Then we had towards autumn a heat release of the marine heatwaves across the mid-latitudes, as the atmosphere gets colder.
Last it have been possible that the oceans released heat from the subsurface that had built up. Across the mid-latitudes warm freshening water masses are accumulating under the surface as shallow as 150m depth. And these heat depots could have been tapped, as the jets speed up during winter, as the density gradient between the tropics and poles increases in the upper atmosphere while it decreases near the surface. More and stronger low-pressure systems due to increased shear are the outcome. And all these extreme low-pressure systems in autumn and winter across the mid-latitudes in 2023/24 could have tapped this subsurface heat depot. But now study here as this is new.
Main problem thou is the expansion of marine heatwaves, as they are feedback driven by global warming heating the oceans from the surface too fast (thermal stratification increases non-linear in the upper 300m of the oceans in various regions), in combination with the pattern effect which disturbs global zonal circulation with the result of more stalled high-pressure systems (low wind speeds are in most instances THE precondition for marine heatwaves too form besides thermal stratification and small mixed layer depth).
Last the warming of the northern latitudes can also be included in the factors driving global warming in 2023.
In short the warming of 2023 was feedback-driven by various system forcing each other into a heating mode with the systems of the oceans, atmosphere, and landmasses acting in unison! The exact series of which contributed to what extent to the heating science has to find out. But it would have to do it on a monthly basis!
The next jump will have devastating consequences as they become larger...
Here is my FB page, want now to make my own blog, as the experts lose the oversight and models will be increasingly wrong (the model spread is in my opinion a joke as it is way too large proving the uselessness of models)...
https://www.facebook.com/Erdsystemforschung/
All the best
Jan
p.s. we warm the oceans too fast that is our main problem!
- How extreme was the Earth's temperature in 2023
nigelj at 07:08 AM on 18 April, 2024Some explanations for the unusual global warming levels in 2023:
James Hansen thinks the anomalously high global surface temperature in 2023 are due to AGW + El Nino + Aerosols reductions. I can't find the related commentary, and have to go by memory, but Hansen suggests that the quite abrupt reductions in shipping aerosols in 2023 added to reductions in industrial aerosols over the last ten years warmed the oceans and this energy comes out after a time delay and it all came out in 2023. Perhaps someone has the details of his suggestion and comments on its credibility.
El ninos release ocean heat that has been building up. I note that the high sea surface temperatures are in the northern oceans are away from the centre of el nino activity.
From NASA: Five Factors to Explain the Record Heat in 2023. But what caused 2023, especially the second half of it, to be so hot? Scientists asked themselves this same question. Here is a breakdown of primary factors that scientists considered to explain the record-breaking heat ( I have cut and pasted the key statements only):
The long-term rise in greenhouse gases is the primary driver.
The return of El Niño added to the heat.
Globally, long-term ocean warming and hotter-than-normal sea surface temperatures played a part.
Aerosols are decreasing, so they are no longer slowing the rise in temperatures.
Scientists found that the Hunga Tonga-Hunga Ha‘apai volcanic eruption did not substantially add to the record heat.
earthobservatory.nasa.gov/images/152313/five-factors-to-explain-the-record-heat-in-2023
From PBS News: ‘We’re frankly astonished.’ Why 2023’s record-breaking heat surprised scientists. A range of factors including general warming due to human-caused climate change, the El Niño climate pattern, record-low Antarctic sea ice and others — contributed to 2023’s record-breaking heat, but they don’t tell the full story. Schmidt said more work has to be done to fully understand why the year was so hot.
“In 2024, we’ll be seeing whether this persists or whether it kind of goes back to a normal pattern,” he said. “And that will be kind of telling as to whether 2023 was just a very unusual combination of things that all added up to what we saw, or whether there’s something systematically different going forward.” (Seems like good comments to me)
From Copernicus:
Some alternative suggestions on 2023 warming including changes in regional wind patterns over the northern parts of the oceans bringing heat to the surface:
atmosphere.copernicus.eu/aerosols-are-so2-emissions-reductions-contributing-global-warming
(This is not a reference to el nino, but to other changes in wind patterns to the north. For me it raises the question of caused the changes in wind patterns)
Clearly there is no definitive answer yet on why 2023 was so unusually warm ( ditto 2024 thus far). As scientists say next years data will help illuminate the causes.
- Climate - the Movie: a hot mess of (c)old myths!
Eclectic at 05:09 AM on 4 April, 2024Gentlemen ~ "Climate The Movie" is currently being featured and featured "bigly" , at the WattsUpWithThat [WUWT] blogsite. WUWT has the topic "pinned" for consideration and comments. Comments are currently numbering 422. Yes, 422.
However, please do not waste your time by seeking through the 422 for any sign of perceptive & intelligent comments. I assure you that I have skimmed the 400-ish . . . and it's merely the typical WUWT "usual suspects" who are angrily venting into the WUWT echochamber.
Jimsteele , it sounds like you are completely unfamiliar with the WUWT website. It is full (well ~ at the 95% level) of commenters who deny the greenhouse effect ~ either directly or indirectly. Yes, I view the website to "educate" myself . . . mostly about the follies of Motivated Reasoning which are on display there daily. WUWT manages to be both interesting and tiresome. But the cynical reader will see some amusing comments there ~ of egregious fatuities & unintended ironies.
Jimsteele @91 ~ please go back and carefully re-read my comment @84. No, I did not state or allege that you "denied the greenhouse effect". But among your convoluted statements on ocean warming/cooling, you both allege and imply that CO2 contributes little or nothing to the (presently unfrozen) temperature of the Earth's ocean. Do you see the irony/incongruity of your position ?
- Climate - the Movie: a hot mess of (c)old myths!
Charlie_Brown at 05:02 AM on 4 April, 2024The discussion of the heat transfer mechanisms at the ocean’s surface is irrelevant for understanding the mechanism of global warming caused by increasing greenhouse gas emissions. It neglects infrared radiant energy emitted from the surface and the overall global energy balance.
jimsteele @91 claims that he does not deny the “greenhouse effect”, yet the movie and his initial post @67 direct to myths about “global warming caused by increasing GHG emissions.” He reveals his lack of knowledge about the “greenhouse effect” when, @83, he accuses eclectic: “It is your narrative that grossly incomplete! You make a totally unsubstantiated assertion that without CO2 the oceans would freeze.” It is a correct assertion substantiated by a simple radiant energy balance over the globe: Solar In = Infrared Out.
The surface of the ocean and the land are blackbodies that absorb and emit radiant energy based on Planck’s Distribution Law. Gases, being simple molecules, emit at specific wavelengths as internal energy levels change determined by bending and stretching depending on the molecular structure. CO2 has many strong absorptance/emittance lines in the wavelength band of about 14 to 16 microns and many more weak lines on the shoulders of this band.
Absorptance equals emittance at thermal equilibrium (Kirchoff’s Law). That is the energy balance of a molecule. The condition of thermal equilibrium is important because it is conservation of energy, not conservation of photons at a specific frequency. Because the bottom layer of the stratosphere is cold, the intensity of emitted energy from CO2 is lower than the intensity emitted in the same wavelength band from the surface. Thus, energy emitted to space is reduced. With increasing CO2, the emittance lines fill in and the range of the CO2 emittance band becomes wider. Infrared out is reduced. Energy accumulates. The pre-industrial steady state balance when accumulation was zero is upset. Warming occurs until the energy balance is restored. It is restored when the temperature of the surface increases enough such that the energy emitted by the surface at other wavelengths outside of the CO2 absorptance band matches the reduced energy emitted to space from within the CO2 band.
- Climate - the Movie: a hot mess of (c)old myths!
jimsteele24224 at 03:15 AM on 4 April, 2024Eclectic, LOL What are you talking about saying " Jim ~ you would lose all scientific credibility if you assert that the so-called greenhouse effect does not exist."
But truth is I have never denied the greenhouse effect. Your allegations are typical of alarmists trying to denigrate skeptics. Every skeptic I know totally understands the greenhouse effect and are grateful for its warming effect. The question is how much does further increased CO2 cause further warming and is that beneficial or not.
Your second funny is telling me not to get distracted by the details of the actual mechanisms of the ocean is warming, simply because you believe ,without ever substantiating, that there are equilibrium points that are unaffected by those proven dynamics.
Please educate yourself Eclectic.
- Climate - the Movie: a hot mess of (c)old myths!
jimsteele24224 at 02:19 AM on 4 April, 2024Eclectic, LOL What are you talking about saying " Jim ~ you would lose all scientific credibility if you assert that the so-called greenhouse effect does not exist."
But truth is I have never denied the greenhouse effect. Your allegations are typical of alarmists trying to denigrate skeptics. Every skeptic I know totally understands the greenhouse effect and are grateful for its warming effect. The question is how much does further increased CO2 cause further warming and is that beneficial or not.
Your second funny is telling me not to get distracted by the details of the actual mechanisms of the ocean is warming, simply because you believe ,without ever substantiating, that there are equilibrium points that are unaffected by those proven dynamics.
Please educate yourself Eclectic.
- Climate - the Movie: a hot mess of (c)old myths!
Eclectic at 12:57 PM on 3 April, 2024Jimsteele @81 :
Thank you ~ but the analysis is still incomplete. Possibly some semantic obfuscation or confusion is impeding the basic physical picture.
Over a 24 hour cycle or 365 day cycle, the interesting variations in the topmost few microns of ocean are unimportant. What is important is the overall flux of energy into & out of the ocean ~ for that is what maintains the ocean's temperature structure (stratification) and long-term heat content. And the ocean is responsible for a large slice of the atmosphere's heat content & stratification (indirectly). It goes both ways.
Remove CO2 and the lesser greenhouse gasses . . . and the ocean temperature would decrease . . . and the surface few microns would be ice (and the deeper ocean would freeze as well).
Ergo ~ and in straightforward language ~ it can be accurately said that CO2 has a major effect in warming the planetary ocean.
- Climate - the Movie: a hot mess of (c)old myths!
Eclectic at 12:13 PM on 3 April, 2024Jimsteele @76 :
You have answered incompletely. Have I missed something basic in physics or in logic ? e.g. ~
Solar shortwave radiation -> ocean
ocean heat -> atmosphere by molecular vibration and by IR radiation
atmospheric heat -> ocean (predominantly by molecular vibration, but a small component of IR radiation too)
CO2 -> greenhouse effect -> lower atmosphere warming [lapse rate]
Ergo, CO2 provides a large (but indirect) amount of ocean warming.
?
- Climate - the Movie: a hot mess of (c)old myths!
jimsteele24224 at 12:05 PM on 3 April, 2024Hi John,
Warming the surface stratifies the oceans' upper layers. Turbulent mixing mostly increases the cooling effect by bringing warmer subsurface water to the skin surface. The ocean's mixed layer deepens in the winter as the upper layer cools.
- Climate - the Movie: a hot mess of (c)old myths!
Eclectic at 11:02 AM on 3 April, 2024Jimsteele : help me understand your position.
m
At the most basic level :- solar radiation at visible wavelengths does penetrate 10's of meters into the ocean. (As a scuba diver, I can vouch for this.)
At other wavelengths, into the infrared & longer, there is shallow or deep penetration, but the actual penetration flux is tiny in comparison to the visible light. (That includes the infrared flux radiated from CO2 in the lowermost few meters of atmosphere.)
Then we have a large flux of energy (both out of and into the ocean) from molecular vibrations at the ocean/air interface ~ vibrations of molecules of water / water vapor / nitrogen / and oxygen. I have not chased down the magnitude of such flux into and out of the ocean ~ but presumably that magnitude is huge.
In summary ; the ocean receives heat predominantly from light energy and from conduction from the atmosphere. CO2 molecules have only a very tiny direct ocean-warming effect ~ but arguably a huge indirect warming effect through CO2's action as a greenhouse gas warming the planet's atmosphere.
Have I understood that correctly ?
- Climate - the Movie: a hot mess of (c)old myths!
jimsteele24224 at 07:50 AM on 3 April, 2024scaddenp: I am unsure why you claim "On interannual and to some extent the decadal scales, variations in surface temperature are strongly influenced by ocean-atmosphere heat exchange, but I think you would agree that the increasing OHC rules that out as cause of global warming?"
rn
Why?
rn
Most studies I have reviewed, find that most heat flux(98%) leaves the oean and warms the air. I trust the Argo data that the oceans have slightly warmed, but Argo does not determine attribution.
rn
It has been well established that the tropics absorbs more heat locally than it ventilates. And that outside the tropics more heat is ventilated than is absorbed. Because CO2 infrared never penetrates deeper than a few microns compared to deep solar heating, I argue solar heating of the oceans drives atmoispheric warming.
rn
I addressed this in https://twitter.com/JimSteeleSkepti/status/1771957182407536940
rn
rn
- Climate - the Movie: a hot mess of (c)old myths!
jimsteele24224 at 07:15 AM on 3 April, 2024scaddenp: I am unsure why you claim "On interannual and to some extent the decadal scales, variations in surface temperature are strongly influenced by ocean-atmosphere heat exchange, but I think you would agree that the increasing OHC rules that out as cause of global warming?"
Why?
Most studies I have reviewed, find that most heat flux(98%) leaves the oean and warms the air. I trust the Argo data that the oceans have slightly warmed, but Argo does not determine attribution.
It has been well established that the tropics absorbs more heat locally than it ventilates. And that outside the tropics more heat is ventilated than is absorbed. Because CO2 infrared never penetrates deeper than a few microns compared to deep solar heating, I argue solar heating of the oceans drives atmoispheric warming.
I addressed this in https://twitter.com/JimSteeleSkepti/status/1771957182407536940
- Climate - the Movie: a hot mess of (c)old myths!
scaddenp at 06:38 AM on 3 April, 2024Two dog. The OHC content data in red comes from the Argo array. You can find reasonable description here. The old pentadecadal data is ship-based and has much bigger error bars. I cant immediately find the paper that determined the accuracy of the Argo data but if interested I am sure I dig it out.
On interannual and to some extent the decadal scales, variations in surface temperature are strongly influenced by ocean-atmosphere heat exchange, but I think you would agree that the increasing OHC rules that out as cause of global warming?
"I did also read that the warming effect of CO2 decreases as its concentration increases so the warming is expected to reduce over time. Is there any truth in that?"
Sort of - there is a square law. If radiation increase from 200-400 is say 4W/m2, then you have to increase from CO2 from 400 to 800ppm to get 8W/m2. However, that doesnt translate directly into "warming" because of feedbacks. Water vapour is powerful greenhouse gas and its concentration in the atmosphere is directly related to temperature. Also as temperature rises, albedo from ice decreases so less radiation is reflected back. Worse, over century level scales, all that ocean heat reduces the ability of the ocean to absorb CO2. From memory, half of emissions are currently being absorbed there. Hot enough and the oceans de-gas. These are the calculation which have to go into those climate models.
Which brings us to natural sources. Geothermal heat and waste heat are insignificant so would you agree that the only natural source of that extra heat would be the sun? Now impact of sun on temperature has multiple components that climate models take into account. These are:
1/ variations in energy emitted from the sun.
2/ screening by aerosols (natural or manmade). Important in 20th century variations you see.
3/ changes in albedo (especially ice and high cloud)
4/ The concentration of greenhouse gases in the atmosphere.
Now climate scientist would say that changes to all of those can account for all past natural climate change using known physics. They would also say very high confidence that 1/ to 3/ are not a significant part of current climate change (you can see the exact amount for each calculated in the IPCC report). Why are they confident? If you were climate scientist investigating those factors, what would you want to measure to investigate there effects? Seriously, think about that and how you might do such investigations.
Is it possible there is something we dont understand at play? Of course, but there is no evidence for other factors. You can explain past and present climate change with known figures so trying to invoke the unknown seems to be clutching at straws.
- Climate - the Movie: a hot mess of (c)old myths!
jimsteele24224 at 06:07 AM on 3 April, 2024A Netherlands journalist, Maarten Keulemans, tried to denigrate Climate the Movie: The Cold Truth in about 50 tweets using much of the same arguments posted to here on SkepticalScience. I successfully debunked all of his arguments in 16 tweets (originally I intended 20) listed below, and so I was just honored with being interviewed for a Dutch TV segment regards how the Climate the Movie promotes vital scientific debate. Too often alarmists try to suppress debate with weak arguments or denigrating the opposition as deniers. However I doubt alarmists can refute any of my arguments, but I will gladly entertain your arguments.
1 Denigrating the Climate Reconstruction graph by Ljungqvist https://twitter.com/JimSteeleSkepti/status/1771929435366940908…
2 Keulemans' Medieval Warm Period lie https://twitter.com/JimSteeleSkepti/status/1771933673488789868…
3 Contamination of Instrumental by Urbanization https://twitter.com/JimSteeleSkepti/status/1771939656504062260…
4 The Best USA temperature Statistic! https://twitter.com/JimSteeleSkepti/status/1771947116631580724…
5 Ocean Warming Facts https://twitter.com/JimSteeleSkepti/status/1771957182407536940…
6 US Heat Waves https://twitter.com/JimSteeleSkepti/status/1771963700951527487…
7 It is the Sun Stupid! https://twitter.com/JimSteeleSkepti/status/1771977013576024282…
8 Alarmists know better than Nobel Prize Winners ! https://twitter.com/JimSteeleSkepti/status/1771987039631921454…
9 Wildfires: Liar Liar Keulemans' Pants on Fire https://twitter.com/JimSteeleSkepti/status/1772000151596572844…
10 The Dangers of CO2 Sequestration and CO2 Starvation https://twitter.com/JimSteeleSkepti/status/1772016867265380795
11 Models Running Hot! Keulemans Disgraceful attack on the most honest Dr John Christy! https://twitter.com/JimSteeleSkepti/status/1772081300884852829…
12 Keulemans’ Blustering Hurricane Fears
https://twitter.com/JimSteeleSkepti/status/1772319957042479298
13. Dishonestly Defining Natural Climate Factors
https://twitter.com/JimSteeleSkepti/status/1773395443864736058
14. Denying Antarctica’s Lack of Warming
https://twitter.com/JimSteeleSkepti/status/1773473481637957758
15. Misinformation on CO2’s Role in Warming Interglacials during our Ice Age.
https://twitter.com/JimSteeleSkepti/status/1773777313924297210
16. Science journalists vs grifting propagandists – Antarctica
https://twitter.com/JimSteeleSkepti/status/1774428539858907444 - Climate - the Movie: a hot mess of (c)old myths!
nigelj at 05:38 AM on 3 April, 2024Two Dog @65. All that additional heat energy accumulating in the oceans has to come from somewhere. Possible candidates are anthropogenic warming, increased solar activity, and an increase in sub sea geothermal or volcanic activity.
Scientists have ruled out solar forcing and geothermal or volcanic activity. It's really hard for me to see where else that quantitiy of energy could come from if not those three possibilities. Just waving your hands and saying there may be something else isnt remotely convincing to me. Its just so implausible and such a vanishingly small possibility and so unlikely.
- Climate - the Movie: a hot mess of (c)old myths!
scaddenp at 13:00 PM on 2 April, 2024Two Dog, I don't want to be dog-piling, but I am very curious as to how you assess evidence when you are examining a question like global warming? We are seeing the same information, and yet to my mind you are fixating on the very unlikely or what you seem to think is unknownable rather than the obvious, the observable and the extremely likely. Other commentors have commented on your tendency to push what they see as straw-man arguments - you seem to be confident the scientists say things or work in ways that they dont. I am curious as to what informed assertions like these?
Can I assume that you comfortable with conservation of energy? So that any change in temperature involves moving or transforming energy. Consider total ocean heat content - a much less noisy measure than surface temperature and the ocean is where most of the heat is going.
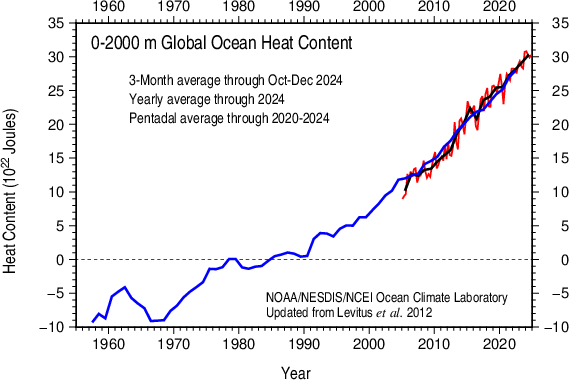
The blips you see here in the red on this record are the near-surface action of ENSO - when the upwelling of warm water to surface heats the atmosphere but cools the ocean.
Do you agree that all that heat has to come from somewhere whether it is natural or anthrogenic? If your priors are to assume it is natural, then how do you start to think about what might be causing it and what measurements would you like to make to verify or falsify?
Also, you do realise that increased radiation from the CO2 has been directly measured? In terms of likelihood, the match between the amount of excess radiation and increased ocean heat content would be strong evidence for anthropegic warming for most people. I am assuming your priors would try to discount that so again, what do you think happens to excess radiation from the greenhouse effect and what kind of measurements would you use to verify?
- Climate - the Movie: a hot mess of (c)old myths!
nigelj at 04:48 AM on 1 April, 2024Two Dog @41
"Finally, on the "cherry picking" of the 50s, 60s and 70s. I think its a fair point to pick 30 years out of 150 in this case. Indeed, the argument above is, as I understand it, that the main and dominant factor in the current warming is human GHG emissions. For that theory to hold, in any period where GHG emissions are increasing year on year, then only a few years "blip" in warming must presumably call the theory into question? (unless we can find another new and temporary factor like air pollution)"
The reason the temperature record has "blips" and is not a smooth line is because the trend is shaped by a combination of natural and human factors that have different effects. However the overall trend since the 1970s is warming. The known natural cycles and infuences can explain the short term blips of a couple of years or so, (eg el ninos) but not the 50 year overall warming trend since the 1970s. Sure there may be some undiscovered natural cycle that expalins the warming, but its very unlikely with chances of something like one in a million. And it would require falsifying the greenhouse effect which nobody has been able to do. Want to gamble the planets future on all that?
The flat period of temperatures around 1940- 1977, (or as OPOF points out it was really a period of reduced warming) coincides with the cooling effect of industrial aerosols during the period as CB points out. This is the period when acid rain emerged as a problem until these aerosols were filtered out in the 1980s.
However the flat period mid last century also coincided with a cool phase of the PDO cycle (an ocean cycle), a preponderance of weak el ninos, and flat solar activity after 1950 and a higher than normal level of volcanic activity. Literally all the natural factors were in a flat or cooling phase. In addition atmospheric concentrations of CO2 were not as high as presently, so it was easier for the other factors to suppress anthropogenic warming.
So for me this is all an adequate explanation of why temperatures were subdued in the middle of last century. Just my two cents worth. Not a scientist but I've followed the issues for years.
- Skeptical Science New Research for Week #12 2024
nigelj at 06:05 AM on 22 March, 2024Regarding "Climate models can’t explain 2023’s huge heat anomaly — we could be in uncharted territory, Schmidt, Nature [perspective]:"
This is very concerning and perceptive.
This following article by Copernicus has a great review of the effects of aerosols, and some interesting ideas of what may have contributed to last years unusually high temperatures in the nothern atlantic in partcular:
"Aerosols: are SO2 emissions reductions contributing to global warming?"
https://atmosphere.copernicus.eu/aerosols-are-so2-emissions-reductions-contributing-global-warming
Excerpts:
In 2020, the International Maritime Organization adopted its ‘IMO 2020’ regulation to drastically reduce shipping-related sulphur dioxide (SO2) emissions. Studies have concluded that the drop in emissions significantly reduced the formation of clouds over shipping lanes. An analysis by Carbon Brief estimated that that “the likely side-effect of the 2020 regulations to cut air pollution from shipping is to increase global temperatures by around 0.05C by 2050 (My note: Clearly this doesnt do much to explain the last 9 months unusual warming, and why would a change in 2020 shipping fuels that was implimented in that year, not slowly phased in, suddenly manifest 3 years later anyway? ). This is equivalent to approximately two additional years of emissions.” However, linking SO2 reductions directly to the recent extreme marine heatwaves omits part of the complexity of using models to calculate sulphate aerosol interactions in the atmosphere or estimating the effective application of the IMO 2020 regulation, and, more generally, the complexity of climate and atmospheric chemistry.
Reviewing the record North Atlantic Sea surface temperatures in June 2023, a preliminary analysis from CAMS scientists found a significant negative anomaly in Saharan dust aerosol transport over the tropical Atlantic Ocean, and an increased anomaly in biomass burning aerosol over the North Atlantic, coming from the massive Canadian wildfires. These aerosol anomalies are much bigger than the sulphate change from shipping emission reductions. This makes the estimation of the impact of reduced sulphate aerosol emissions on the sea surface temperatures very challenging.
June 2023 monthly mean aerosol optical depth (AOD) anomaly relative to June average AOD for the period 2003-2022 from the CAMS global reanalysis of atmospheric composition shows a negative anomaly related to reduced dust transport across the tropical North Atlantic (blue) and a positive anomaly related to smoke transport from Canadian wildfires over the extra-tropical North Atlantic (red). Base on non-validated data Credit: CAMS
The Copernicus Climate Change Service (C3S) also suggested that, among other factors, the reduced winds of a weakened Azores anticyclone - an extensive wind system that spirals out from a centre of high atmospheric pressure - could have reduced the ocean-atmosphere exchange and the vertical mixing of the ocean between colder and warmer waters, as well as reducing Saharan dust transport over the Atlantic, all of which has the potential to increase the ocean surface temperature.
“There will be, no doubt, long-term impacts from the reduced SO2 emissions, but it will demand dedicated research to understand the impact of sulphur changes. The changes in dust or black carbon have a more tangible effect in the short term”, says Richard Engelen CAMS Deputy Director.
My comments: Of course this doesn't easily explain the unusually high levels of warming in the pacific. Next year will be revealing. It should be relatively cooler year on past patterns but if it isnt IMO it would suggest a step change in anthropogenic global warming. We know the climate is non linear and abrupt changes are possible. Will be interesting to see what BS the denialists will come up with to counter another unusually warm year.
- CO2 lags temperature
Charlie_Brown at 09:26 AM on 16 March, 2024RBurr @ 654
1) CO2 lags temperature rise at the end of an ice age because CO2 evolves from ocean waters as the temperature rises. This is Henry’s Law. In that case, temperature rises first due to the Milankovitch Cycles. Note that ice age temperatures cool slowly and warm rapidly. Modern CO2 emissions are different because they come from burning fossil fuels. Therefore, temperature rises as a result of CO2. Cause and effect in both cases is clear in both cases, and different in both cases.
2) The quantum mechanical mechanism on IR radiation that explains the greenhouse warming theory has been proven. It is based on fundamental principles of energy balance and radiant energy transfer and has been verified by massive amounts of data, cross-checks, and validation.
3) The Earth’s energy “balance” is fundamental:
Input = Output + Accumulation
Output is reduced as greenhouse gases increase. Thus, energy accumulates.
4) Your description of quantum mechanics does not make sense. Quantum mechanics is fundamental to the specific frequencies (i.e., wavelengths) that are absorbed and emitted by CO2, CH4, and H2O. There is a huge amount of energy carried by IR radiation. It is naturally emitted (not dissipated) and lost to outer space by IR. By the overall global energy balance at steady state:
Input solar = Reflected solar + Emitted IR
Accumulation is zero at steady state, as before CO2 emissions of the industrial revolution.
5) The hot object in this case is the sun at about 5800 Kelvin. That is more than hot enough to warm the earth. The temperature profile is 5800 K of the sun to 288 K (60F) of the Earth 217 K of the lower stratosphere to 2 K of outer space. Increasing CO2 reduces the energy loss to space at specific wavelengths (e.g., approx. 13-17 microns). The absorptance/emittance lines in that range increase, meaning that energy is emitted from a cold 217 K instead of a warm 288 K. This upsets the energy balance. The balance is restored by accumulating energy until the surface temperature increases enough to make up the reduction by CO2. Nothing about this violates either the 1st or 2nd law of thermodynamics. Some mistake the 2nd law by describing the energy balance being at steady state, but the steady state was upset by increasing GHG.
6) Neither the Milankovitch Cycles nor the Schwabe Cycles (sunspots) explain the cause of modern global warming. The long-term Milankovitch Cycles have not been in a period of significant change for the last 12,000 years after warming from the last ice age. Measured radiosity data from the sun show that short-term Schwabe Cycles have not changed significantly either and do not explain modern warming.
- At a glance - Human activity is driving retreat of arctic sea ice
gerontocrat at 03:48 AM on 7 March, 2024And some unusual evidence on the NW Passage hot off the press from "The Guardian" newspaper.
https://www.theguardian.com/environment/2024/mar/06/gray-whale-nantucket-extinction
Gray whale sighted off New England 200 years after species’ Atlantic extinction
Scientists confirm cetacean’s presence but cite impact of climate change which has made North-west Passage ice-free in summer
Scientists have confirmed the presence of a whale off New England that went extinct in the Atlantic Ocean two centuries ago – an exciting discovery, but one they said that illustrates the impact of climate change on sea life.
Researchers with the New England Aquarium in Boston found the gray whale while flying 30 miles south of Nantucket, Massachusetts, on 1 March. The whale, which can weigh 60,000 pounds (27,215kg), typically lives in the northern Pacific Ocean.
The gray whale vanished from the Atlantic Ocean by the 18th century, but there have been five observations of the animal in Atlantic and Mediterranean waters in the last 15 years, the aquarium said in a statement. The whale found this month was probably the same animal spotted in Florida late last year, the aquarium said.
The researchers who found the animal off Massachusetts said they were skeptical at first, but after circling the area for 45 minutes, they were able to take photographs that confirmed it was indeed a gray whale.
“I didn’t want to say out loud what it was, because it seemed crazy,” said Orla O’Brien, an associate research scientist with the Anderson Cabot Center for Ocean Life at the New England Aquarium.
Scientists said they were thrilled to see the animal, but its presence probably has to do with the warming of the planet. The North-west Passage, which connects the Atlantic and Pacific Oceans through the Arctic Ocean in Canada, has lacked ice in the summertime in recent years, they said."
- Skeptical Science New Research for Week #5 2024
One Planet Only Forever at 15:59 PM on 2 February, 2024Thank you for another informative and enlightening curated set of research reports.
I particularly recommend: How Economics Can Tackle the ‘Wicked Problem’ of Climate Change, Stiglitz et al., School of International and Public Affairs/Institute of Global Politics, Columbia University (from this week's government/NGO section)
The entire document is a relatively brief presentation. I am a fairly slow reader. And it only took me 40 minutes to read all of the document.
The following extracted points may encourage people to read the full document.
Introduction ends with:
This report describes how the tools of economics, when combined with insights from other disciplines, can help policymakers address tradeoffs, implement climate policies that are both equitable and cost-effective, and help the world achieve a more sustainable future.
The Conclusion ends with:
We cannot “optimize” climate actions with any useful precision by balancing the benefits and costs of action — understanding risk and uncertainty and the concomitant urgency of addressing climate change are central to climate policy. Carbon prices work best when combined with other policies to support the development of infrastructure, institutions, regulations, and alternative technologies. In addition, international treaties are most effective when they combine sticks and carrots to encourage deeper cuts in emissions over time while maintaining broad — if not universal — participation. As befits a “wicked” problem, we need to continue to learn from the past and adapt our strategies for reducing emissions as we go.
What I found particularly informative was in the section headed WHAT SHOULD BE THE GOAL OF CLIMATE CHANGE POLICY? The following quote is from the middle of the section:
A surprising source of fodder for the climate action naysayers has come from a group of economists who use models that generate so-called “optimal” pathways by attempting to balance the benefits and costs of climate action. While these models can be calibrated to show virtually any result, the versions that have received the most attention show that the “optimal” level of action would be to allow the earth to warm between three to four degrees Celsius by 2100 — a level of warming that most scientists say is truly frightening.4 Recent updates to the model suggest an optimal warming of 2.7 degrees in 2100.5
This level of warming is still high. Researchers at Columbia and elsewhere have investigated these models, called Integrated Assessment Models (or IAMs) because they integrate environmental effects with economics, something that all good models do. The assumptions ingrained in these models about the environment, the economy, and how they interact are badly flawed.
The section then elaborates on the flaws including the following selected quotes:
- ... while climate change is a threat multiplier that will affect societies in countless ways, damage estimates focus on the few effects of climate change that are easiest to capture. Many or most categories of climate damage — migration, conflict, ocean acidification, biodiversity loss, etc.— are not included in state-of-the-art models.
- ...the models usually ignore distributional concerns, which are highly relevant to policy responses because climate change has the greatest impact on the poor, who have the fewest resources to protect themselves.
- Future generations will also be disproportionately harmed by climate change, and they are typically undervalued in IAMs as well. Indeed, a critical assumption in the IAMs is how future benefits are “discounted.” A dollar today is worth more than a dollar 100 years from now, but how much more? And how do we value the reduced risk of a climate catastrophe confronting our grand-children? Most climate damage estimates implicitly undervalue future generations by discounting future benefits using market rates of return, which are determined largely by the preferences of individuals today over consumption at different points during their lifetimes — thus failing to grapple with the ethical issues raised by taking on risks that will be borne by future generations.
- More reasonably, and more ethically, we should value our children and grandchildren as much as we value ourselves. Consider a situation where climate change’s effects turn out to be particularly severe, which is a realistic possibility that most IAMs ignore. Incomes of future generations will be reduced as a result — but they will have to spend a lot to repair the damage and to adapt to the new climate, at precisely those times when they are least able to do so.
- In addition to undervaluing the benefits of action, the IAMs do not provide useful estimates of the costs of climate action, in part due to the extreme difficulty of forecasting technological innovation over centuries. The models also assume that markets are perfectly efficient, or that they would be efficient if only we could get the price of carbon right — the only distortion is caused by green-house gas pollution. But, as we discuss further in the next section, research over the past 50 years has highlighted the multiple inefficiencies in market economies that serve as barriers to emissions reductions — imperfections of competition, of information, of absent markets, and ill-informed or less-than-rational individuals.
- To be sure, the most recent studies have produced enormous improvements over earlier versions of IAMs. For example, an analysis by Danny Bressler of Columbia University shows a seven-fold in-crease in climate damages from incorporating an estimate of human mortality caused by temperature increases.9 The latest estimates from the U.S. Environmental Protection Agency now includes damages from temperature-related mortality.10 However, even the state-of-the-art estimates of climate damages are plagued by the same limitations noted earlier.
- Greenhouse effect has been falsified
MA Rodger at 18:48 PM on 15 December, 2023Is it healthy to pander to crazy sock-puppet nonsense by discussing 'what-if' ideas when the sock-puppet is wedded to a 'surely it is' idea?
The idea that the existing GHE can be attributed to 50% water vapour, 25% cloud and this forced by 25% CO2 which thus attributes cloud as a warming agent does overlook the full impact of cloud on planetray albedo and which could be used to calculate cloud as a cooling agent.
The sock-puppet @176 suggests a cloudless Earth would see albedo drop from 30% to 15%, the latter being roughly the Moon's effective albedo which would suggest the Moon woud have an average temperature of 267K. However the measured temperature of the Moon averages at 201K and this because the Moon rotation is so slow that it sheds massive amounts of energy during its day with Moon equatorial temperatures reaching 390K.
Of course, the Earth spins fast enough to prevent such a large duirnal range and if there had never been CO2 to form a GHE, there would never have been oceans to slow it down from its 4 hour day back when the Earth-Moon began.
But unlike the Moon, there is a lot of water on Earth and the albedo of ice is high. That is reduced by the dust which would cover the ice on a GHE-free Earth but albedo would remain high, and perhaps higher than today. De Vrese et al (2021) suggests the albedo of 'meteoric ice' is 65% which, if the Earth's albedo, would indicate a 250K Earth and a GHE of 38K.
- Skeptical Science New Research for Week #49 2023
nigelj at 04:35 AM on 10 December, 2023MS Sweet. Good information to know.
"I note that Dr. Hansen has long held an Earth System Sensitivity of 6 C. The IPCC consensus has been 3C"
The IPCC number is "equilibrium climate sensitivity", a different thing from earth system sensativity as below. Making it hard to compare the two numbers.
"By definition, equilibrium climate sensitivity does not include feedbacks that take millennia to emerge, such as long-term changes in Earth's albedo because of changes in ice sheets and vegetation. It includes the slow response of the deep oceans' warming, which also takes millennia, and so ECS fails to reflect the actual future warming that would occur if CO2 is stabilized at double pre-industrial values.[38] Earth system sensitivity (ESS) incorporates the effects of these slower feedback loops, such as the change in Earth's albedo from the melting of large continental ice sheets, which covered much of the Northern Hemisphere during the Last Glacial Maximum and still cover Greenland and Antarctica)...."
(Climate sensitivity, wikipedia)
We will probably never know any of these numbers for sure because you can't put the planet in the laboratory. (Although I think paleo studies like the one you posted have a lot of credibility - because they are based on real world conditions). But IMHO that uncertainty is not necessarily a crucial problem. Current rates of warming are bad and are having very visible effects, and huge implicatrion in the short to medium term, and so whatever the level of climate sensitivity using whatever definition, we clearly have a huge problem.
- At a glance - Evidence for global warming
One Planet Only Forever at 06:48 AM on 7 December, 2023Regarding the discussion of ENSO patterns, modelling and forecasting.
The SkS Argument/Myth item "Global warming and the El Niño Southern Oscillation" that John Mason @31 suggested as a more appropriate thread has some potentially very relevant points made in the latest comments starting with comment 198 (from 2019).
Another location of potentially helpful information is the Australian Bureau of Meteorology's "Climate Driver Update" website (linked here). The "Pacific Ocean" tab (linked here) presents a broad range of forecasts for the NINO3.4 SST from multiple forecasters. There is approximately a 1.0 degrees C range of forecasts for January 2024.
- At a glance - Evidence for global warming
Daniel Bailey at 10:53 AM on 6 December, 2023@michael sweet @38
The graphic uses the GISS temperature data, color-coded by ENSO phase, updated through the end of 2021. When the full-year data for 2023 comes out, it should get updated then. The slopes will change somewhat as the background phase states change, but the underlying exogenous driver is still human activities. As a result, ocean heat content rates are accelerating (from Li et al 2023, Figure 1), further warming all ENSO phases over time:

- At a glance - Evidence for global warming
Paul Pukite at 03:01 AM on 5 December, 2023Because the present post is mentioning ENSO
"Sea-surface temperature patterns in the tropical Pacific were characteristic of La Niña, a phenomenon that should have mitigated against atmospheric heat gain at the global scale. However, the annual global surface temperature across land and oceans was among the six highest in records dating as far back as the mid-1800s. 2022 was the warmest La Niña year on record.
At the time of writing, there is still about a month of 2023 to run. Yet once again we have record-breaking temperatures, with some records smashed by huge margins, so that 2023 looks as though it may well go down as the hottest on record."
As it turns out we are now in the midst of a definitely emerging El Nino. The ENSO cycles can transiently override the gradual warming of AGW, so this is a factor to point out.
concerning
https://skepticalscience.com/el-nino-southern-oscillation.htm
There was a long-running discussion on ENSO at the Azimuth Project forum started in 2014 that recently ended. The original motivation was to collaborate and analyze ENSO data and consider different math approaches to modeling the cycles, as the organizers of the project were skeptical as to a chaotic or random origin for ENSO. Alas, the owner of the site shut it down and wiped out the entire archive. Fortunately, some of the open source code for the effort was kept on a GitHub repo and I was able to grab ownership and keep that alive, so a remnant discussion is available for those that have GitHub accounts. https://github.com/azimuth-project
- At a glance - Evidence for global warming
michael sweet at 00:13 AM on 4 December, 2023I note that Arhennius predicted in 1896 that the tropics would heat up slower that the poles and the ocean would heat up slower than the ocean. Since the global average heating is about 1.2 C, we woud expect less than 1 C warming in the tropical ocean.
- At a glance - Evidence for global warming
michael sweet at 00:07 AM on 4 December, 2023Paul Pukite,
At post two you said "Not the middle of the equatorial Pacific." Referring to the comment "All these show a similar warming trend."
At post 7 you said "when one searches for equatorial Pacific ocean SST time-series, you only get NINO34, NINO4, etc data. These show no or very little trend,"
I entered the thread to show that your comments were false. My illustration at post 9 clearly demonstrates that you were incorrect. You posted a graph at post 13 claiming no trend, asserting that the graph had not been detrended. My post at 21 showed your graph was detrended and your claims of no trend in the tropical ocean are simply false.
Now at 23 you post a graph that is actually not detrended and use your eyecrometer to claim your graph is more informative than my illustration. Using my eyecroneter on my illustration I see clearly that the trend is closer to one degree. If you put a least squares line on your graph we would have data instead of idle speculation. All these trends can easily be Googled, you are simply not looking.
I have proved beyond doubt that your claim that the tropical oceans "show no or very little trend," is completely false. The fact that you produced a graph that was not detrended and showed a trend after claiming a detrended graph showed there was no trend indicates that you are not interested in a discussion of the science here.
If you want to speculate on ENSO causes go for it As I understand it, ENSO is essentially random on a yearly basis.
- At a glance - Evidence for global warming
One Planet Only Forever at 14:11 PM on 3 December, 2023Paul Pukite @23,
I will continue to pursue the points I raised regarding your comment @2.
I am confident that nigelj’s comment about similar trends was regarding ‘a trend like the global average surface temperature data - warming rather than cooling with more significant warming occurring after 1950 than prior to 1950’.
Your comment @2, and later comments except for your latest @23 (sort of), appear to insist that it is not possible to have confidence regarding a warming trend in the NINO 3.4 region (the middle of the equatorial Pacific).
Your comment @2 starts with:
"All these show a similar warming trend." [nigelj’s point]
Not the middle of the equatorial Pacific. (your response)
As my comments should indicate, I learned from and accepted nigelj’s finding of an explanation about the current models indicating a larger amount of warming in the equatorial Pacific (especially the east part) than the actual observations. However, as I commented, that does not alter the incorrectness of your comment @2. But you do appear to have finally accepted your incorrectness (sort of) by ‘seeing’ a warming trend in the NINO 3.4 SST data.
However, I am still confident that it is incorrect to declare that having confidence that ‘the NINO 3.4 SST historical data indicates warming similar to the global average surface temperature data’ requires an accurate explanation for the trend being lower than the current global climate models for that region and it requires that understood influence to be removed from the SST values.
The data is what it is regardless of the mechanisms producing it. Large variations of the temperature data simply requires a longer duration of the data set to have confidence that there is a warming trend. And a lower trend rate will also require a longer data set to establish confidence.
The NOAA presentation of the centered 30-year base periods (linked here) that I provided a link to in my comment @16 helpfully presents the trend of the SST NINO3.4 data set in spite of significant variations in the data values. Each 30-year period contains a substantial variety of the variation. Comparing the 5 year steps for the data starting in 1936 shows that there is indeed a recent trend (more significant after 1950 than before 1950 – consistent with the NINO3.4 chart you included in your comment @23). The 1966 to 1995 values, and all the more recent ones, are clearly warmer than the earlier ones. However, it also shows that the ENSO perturbations in the data are large enough to make the warming trend hard to be confident of, even appearing to potentially be a cooling trend in a shorter data set. The 1981 to 2010 results are not clearly warmer, and may even be cooler, than 1976 to 2005.
Global average surface temperature data evaluations using the SkS Temperature Trend Calculator (linked here) can also provide an example supporting my confidence that the ‘noise’ of ENSO variations do not need to be removed to be able to have confidence regarding a trend.
As I indicated in my comment @17, using the GISTEMPv4 dataset in the SkS Temperature Trend Calculator (linked here) the trend of the data after 1950 is 0.152+-0.018 C / decade (high confidence of a warming trend). I add the following set of shorter recent time periods and the resulting trend and level of confidence (2 sigma value compared to trend value):
Years Trend +- 2 sigma
2016 to 2023 = -0.148 +- 0.513
2015 to 2023 = -0.066 +- 0.428
2014 to 2023 = +0.074 +- 0.379
2013 to 2023 = +0.180 +- 0.331
2012 to 2023 = +0.244 +- 0.289
2011 to 2023 = +0.284 +- 0.249
2010 to 2023 = +0.262 +- 0.220
2005 to 2023 = +0.229 +- 0.129
The longer the time period is the more confidence there is in the evaluated trend. Admittedly the global average surface temperature variation in the evaluations is only about 2 degrees C. So a longer time period would be expected to be required for the NINO SST values because they have larger variation of temperature and a smaller trend. But confidence regarding the trend can still be established without a detailed understanding of the mechanisms at play. And I am confident that the authors of 2012 report you (mis)quoted in your comment @2 had reason to be confident with their evaluation and reporting (repeating part of the quote I had included in my comment @4)
“...While centennial trends are not assessed here, we note that using a reduced period results in more consistent linear trends in SSTs over the 61-year record (Fig. 1), which are significantly positive throughout the tropical Pacific Ocean.”
What the authors of the paper observed and explained, was that the pre-1950 data was not as reliable as the post-1950 data. And since the main interest is ‘warming similar’ to the global average surface temperature which has more significant warming since 1950 than before 1950, the earlier SST values are not that important.
- At a glance - Evidence for global warming
nigelj at 05:09 AM on 3 December, 2023OPOF & M Sweet. You guys sound correct in your technical analysis and correct that the equatorial part of the pacific ocean is warming (and I also thought the graphs posted by PP showed a slight warming after 1970). But the warming in a narrow band along the equator is at a significantly slower rate than the pacific ocean as a whole (roughly 0.2 compared to 0.6 in the maps in link I posted). The map posted by MS is a bit too large scale to pick up this level of detail and difference.
This basic pattern is important, and the explanation seems quite good. I think that is the main point.
- At a glance - Evidence for global warming
michael sweet at 23:24 PM on 2 December, 2023Paul Pukte @10,
When you present a graph and say "my eyecrometer detects no trend" with no statistical analysis you are wasting our time. Likewise when you say "I am pretty certain this is not detrended" you are wasting our time. If you are not absolutely certain the data is not detrended go find out for sure.
When I go to your data source I find the graph you have presented has this label:
"cutting out region defined by mask ersstv5 nino3 mask.nc, operating on NOAA ERSSTv5 (in situ only), SSTA normalized to 1981-2010, Nino3 index minus 20S-20N average SST, normalised by a factor" my emphasis
It appears to me that your graph shows the anomaly in the Nino3 area minus the trend in the tropical oceans. Since the illustration that I posted in post at 9 shows that the tropical ocean has a clear waring trend. You have ignored since it contradicts your claims. It appears to me that your graph shows that the ENSO anomally has not changed compared to the rest of the ocean, not that the temperature has not risen in the Nino 3 area as you claim.
I note the the older data in your graph must have large error bars. I also note that small areas of the globe have much more noise so it is hard to detect the warming signal, especially by eyecrometer.
- At a glance - Evidence for global warming
One Planet Only Forever at 13:41 PM on 2 December, 2023Paul Pukite @13,
Your latest comment does not address the questions I raised regarding your initial comment and the ways you have commented regarding this point.
@2 You said “...Not the middle of the equatorial Pacific. The temperature variation there is also not well understood because El Nino & La Nina cycles dominate and these are difficult to predict more than a year in advance.”
I am open to learning (even though I still struggle with right vs left hand). Years ago I learned that the difficulty in ‘predicting the ENSO’ does not affect the ability to evaluate trends in the equatorial Pacific SST. Due to the trend of SST in the Niño 3.4 region (the middle of the equatorial Pacific) NOAA had revised their methodology for the Ocean Nino Index (ONI) values to be relative to a regularly updated baseline.
The following is from the NOAA webpage (linked here) that presents the ONI values identifying the “Cold & Warm Episodes by Season”.
“DESCRIPTION: Warm (red) and cold (blue) periods based on a threshold of +/- 0.5oC for the Oceanic Niño Index (ONI) [3 month running mean of ERSST.v5 SST anomalies in the Niño 3.4 region (5oN-5oS, 120o-170oW)], based on .”centered 30-year base periods updated every 5 years.”\
And the linked NOAA webpage for “centered 30-year base periods updated every 5 years” shows the annual temperature curves for each of the 30-year base periods. In that presentation there is an undeniable warming trend since 1950.
What you will notice is that the NOAA ONI and the related base periods start in 1950. This ties directly to the paper you made the unrepresentative quote from mistakenly believing that it supported your incorrect ‘declared belief’ about the middle of the equatorial Pacific.
In closing I will say that a statistical evaluation of the data points is the proper way to determine a trend in the data. However, when I look at the NINO3 graph you have chosen to share I see a warming trend for the portion from 1950 to 2010. That would be consistent with the more valid evaluation of the data done by the authors of the paper you misrepresented in your comment @2.
- At a glance - Evidence for global warming
nigelj at 05:44 AM on 2 December, 2023I don't think PP is a denialist. Have seen his comments at RC. We sometimes just get on edge and jump to the conclusion that anyone who says "flat trend" is a denialist because its a common denialist talking point.
We know the oceans as a whole have warmed considerably since the 1980s. But then you do have a few areas with cooling like the cold blob in the nothern atlantic.
I'm eyeballing Paul Pukete's graphs of the equatorial pacific and at best I can only see a very slight warming trend from around 1970 - 2022. I mean it does look flat or near flat, so I looked for an explanation and this is interesting. I have highlighted the main pargraphs only:. It seems to be consistent with what PP is saying.
Part of the Pacific Ocean Is Not Warming as Expected. Why? BY KEVIN KRAJICK |JUNE 24, 2019
State-of-the-art climate models predict that as a result of human-induced climate change, the surface of the Pacific Ocean should be warming — some parts more, some less, but all warming nonetheless. Indeed, most regions are acting as expected, with one key exception: what scientists call the equatorial cold tongue. This is a strip of relatively cool water stretching along the equator from Peru into the western Pacific, across quarter of the earth’s circumference. It is produced by equatorial trade winds that blow from east to west, piling up warm surface water in the west Pacific, and also pushing surface water away from the equator itself. This makes way for colder waters to well up from the depths, creating the cold tongue.
Climate models of global warming — computerized simulations of what various parts of the earth are expected to do in reaction to rising greenhouse gases — say that the equatorial cold tongue, along with other regions, should have started warming decades ago, and should still be warming now. But the cold tongue has remained stubbornly cold.
Why are the state-of-the-art climate models out of line with what we are seeing?
Well, they’ve been out of line for decades. This is not a new problem. In this paper, we think we’ve finally found out the reason why. Through multiple model generations, climate models have simulated cold tongues that are too cold and which extend too far west. There is also spuriously warm water immediately to the south of the model cold tongues, instead of cool waters that extend all the way to the cold coastal upwelling regions west of Peru and Chile. These over-developed cold tongues in the models lead to equatorial environments that have too high relative humidity and too low wind speeds. These make the sea surface temperature very sensitive to rising greenhouse gases. Hence the model cold tongues warm a lot over the past decades. In the real world, the sensitivity is lower and, in fact, some of heat added by rising greenhouse gases is offset by the upwelling of cool water from below. Thus the real-world cold tongue warms less than the waters over the tropical west Pacific or off the equator to the north and south. This pattern of sea-surface temperature change then causes the trade winds to strengthen, which lifts the cold subsurface water upward, further cooling the cold tongue.
news.climate.columbia.edu/2019/06/24/pacific-ocean-cold-tongue/
- At a glance - Evidence for global warming
Paul Pukite at 04:52 AM on 2 December, 2023One Planet Only Forever
Here is the NINO3 SST time-series, which is taken from the equatorial Pacific, and note that it is difficult to discern a warming trend. That's just the way it is in the ocean, which acts like a large heat sink, with the colder water below the therrmocline occasionally approaching the surface leading to colder La Nina episodes.
,

I am pretty certain this is not detrended as it the detrended version is also here an it appears similar
https://climexp.knmi.nl/selectindex.cgi?id=someone@somewhere
- At a glance - Evidence for global warming
michael sweet at 10:43 AM on 1 December, 2023Paul Pukite:
This map shows warming trends for the entire world for the years 2015-2019. It uses a baseline of 1951-1980. I note that most of the oceans have a positive anomaly. You are just not looking. source

- At a glance - Evidence for global warming
Paul Pukite at 01:16 AM on 1 December, 2023
one has to look fairly hard for maritime areas that do not show a "similar warming trend"
As far as I can tell, when one searches for equatorial Pacific ocean SST time-series, you only get NINO34, NINO4, etc data. These show no or very little trend, being dominated by ENSO variations. As far as I can tell, they have not been detrended, but do have the annual seasonal temperature cycle removed.
Proxy records to demonstrate the hockey stick contain many samples from coral ring measurements. Yet, these also show very little trend which is not surprising as most coral is found in tropical or equatorial waters, where the SST also shows little trend. That's why most hockey stick discussion is on tree ring data.
- At a glance - Evidence for global warming
Paul Pukite at 09:13 AM on 29 November, 2023"All these show a similar warming trend."
Not the middle of the equatorial Pacific. The temperature variation there is also not well understood because El Nino & La Nina cycles dominate and these are difficult to predict more than a year in advance.
"SST trends in the equatorial Pacific Ocean are especially controversial due to the discrepancy in the sign of the trend in the central and eastern Pacific among various SST datasets (Vecchi et al. 2008; Karnauskas et al. 2009; Deser et al. 2010a)"
https://link.springer.com/article/10.1007/s00382-012-1331-2#Sec5
- At a glance - Evidence for global warming
nigelj at 06:17 AM on 29 November, 2023We have many ways of measuring global warming. Urban areas, rural areas,oceans, the middle, and upper atmosphere. Sea level rise is also an indication of warming. All these show a similar warming trend. How much more do people want to be convinced? There really isn't any part of the planetary system left to measure.
If we were reliant purely on land surface data in cities for example, I would be scepetical. One data set might be flawed. But the chances of so many multiple data sets all being flawed and in the same direction is effectively zero.
Sarah Palin seems like a typical example of a lay person who thinks she knows better than the climate experts. Of course its good to discuss things and question if the experts are right, but remember the experts know things you dont know and small details are important in science.
Another expample of someone out of their depth is John Clauser, a physicist with a nobel prize in quantum physics and an outspoken anthropogenic climate change sceptic despite the fact he has never published any research related to climate change or formally specialised in something like atmospheric physics. It hasn't stopped him telling everyone that climate science is all wrong. He has made many indisputably false statements sometimes by using very out of date information. So even scientists outside their area of expertise can fool themselves. Good commentary here:
www.realclimate.org/index.php/archives/2023/11/clauser-ology-cloudy-with-a-chance-of-meatballs/
- 2023 SkS Weekly Climate Change & Global Warming News Roundup #44
MA Rodger at 21:23 PM on 8 November, 2023This Hansen et al (2023) paper was pre-published back in January and did result in a bit of discussion here at SkS. And there was supposed to be a second paper specifically on SLR.
Hansen et al rattle through a pile of stuff, some of which I would agree has merit and some which I find difficult to accept, some very difficult. The high ECS is one of the very difficult ones. (Perhaps the point that the big part of the difference between high ECS values and the IPCC's most likely value ECS=3ºC, [something the IPCC tend not to identify preferring a range of values as in AR6 Fig1.16]: the difference is due to warming that follows the forcing by a century or more. That time-lag is one of the reasons the ECS estimates are not better nailed down and still has its 'fat tail' . It also would give mankind a fighting chance of dodging it.)
SLR is certainly a big subject of concern. It is a long-term problem, multi-century. The equilibrium position for a +1.5ºC is perhaps 3m and the threat of setting Greenland into unstoppable meltdown at higher levels of warming would triple that. I do tend to get irked by the SLR by 2100 being the sole subject of discussion.
Of course, predictions of that 2100 SLR being massive (5m) is one of Hansen's foibles. The worry is, I think, specific to Antarctica and it is a genuine worry. But to achieve 5m by 2100 would need massive numbers of icebergs bobbing around in the southern oceans and result in global cooling. And there is also the awkward point for climatologists that increased snowfall over Greenland/Antarctica could provide a significant reversal of SLR.
The final issue raised by Hansen et al (2023) is the impact of the reduction of aerosols from our falling SO2 emissions. Quantifying the impact of SO2 emissions is not entirely global a thing, so emissions in, say, China may induce more cooling than, say, Europe. But that said, global SO2 emissions data I identify tends to be way out-of-date. The most recent is this one from a Green Peace publication. This shows the reduction in SO2 is well in hand over the last decade. And the CERES data showing EEI does show a drop in albedo (yellow trace in the 2nd graphic) through that period. My own view of these CERES numbers is that they include a lot of bog-standard AGW-feedback-at-work.


There is also the last 5 months of crazy global temperatures (so post-dating Hansen et al's pre-publication). I don't see these as being sign of things to come. I'd suggest it is casued by the January 2022 Hunga Tonga eruption which threw both SO2 and H2O into the stratosphere, the cooling SO2 dropping out leaving the warming H2O to do its thing before eventually it too dropping out.
And the in-the-pipeline thing. Climatology is/has-been saying we need to halve CO2 emissions b 2030, and following the point of net zero in mid century we enter a century-plus of net-negative CO2 emissions. That would see all emissions 2008 to year-of-net-zero removed by human hand and stored away safely. So that is on top of the natural draw-down of CO2 into the oceans. And if we don't do that, it will not be from ignorance of the situation.
- John F. Clauser: the latest climate science-denying physicist
Rob Honeycutt at 02:32 AM on 29 October, 2023TWFA... re: Hurricanes
This is another example of the limits of your understanding and your proclivity for motivated reasoning. If you were to actually spend time reading the research on hurricanes you'd find a lot of interesting aspects to this issue.
1) Cyclonic activity has two effects that work somewhat in opposition to each other. Warming oceans provide more energy to spin up large cyclones, but upper winds tend to tamp them down. That physical element of the processes introduce a lot of uncertainty into the natural vs man-made issue.
2) Cyclone data is a real bear to wrestle. Older data is sparse due to the fact that the only information comes from early seafaring vessels and areas with low populations. Even 20th century data lacks a great deal of information about size and intensity of storms. Only in the past 10-15 years have scientists been able to track the total energy contained within individual storms.
The result:
Yes, cyclonic activity is increasing as human activities warm the planet.
Yes, storms are spinning up faster and covering larger expanses when they do.
No, a statistically significant increase in the number of landfall storms isn't yet being obsevered.
Once again, there are a number of well written articles on Skeptical Science on precisely this topic by people better informed on this subject than me. I would highly suggest you take the time to read a few of them before continuing on this topic.
Also, if you have questions or obsevations on that topic, please post in the thread for that article in order to keep your discussion on-topic.
Thusfar, we have gish-gallopped around quite a few topics here in this thread that is supposed to be relevant to Clauser.
- John F. Clauser: the latest climate science-denying physicist
TWFA at 01:16 AM on 29 October, 2023Michael, the claim was that the hurricane was the most powerful ever in the East Pacific, not the most powerful recorded or obseved, and frankly I don't know who was recording hurricanes in that region 200 or 500 years ago that never made landfall or how they were measured.
The climate would and will continue warming at this phase even if man never existed, and with warming comes more weather and stronger weather. I assume all here consider NASA to be a creditable source, in this article last year, while making the usual predictions about what will happen when things get warmer, they cite a single study from 2019 that suggests that the current activity may be outside the natural variability:
Since the 1980s, the hurricane record has shown a more active period in the North Atlantic Ocean. On average, there have been more storms, stronger hurricanes, and an increase in hurricanes that rapidly intensify. Thus far, most of these increases are from natural climate variations. However, one recent study suggests that the latest increase in the proportion of North Atlantic hurricanes undergoing rapid intensification is a bit too large to be explained by natural variability alone. This could be the beginning of detecting the impact of climate change on hurricanes, the paper states. In contrast, the frequency of hurricanes making U.S. landfall (a subset of North Atlantic hurricanes) has not increased since 1900, despite significant global warming and the heating of the tropical Atlantic Ocean.
- John F. Clauser: the latest climate science-denying physicist
Rob Honeycutt at 06:32 AM on 28 October, 2023TWFA... "It's not that I don't care about surface temperature, I care about whether the models for surface temperature have been applied to predicting temperatures above and below, a perfectly logical query."
Yes, this is a perfectly reasonable and logical query. So, pause right there before you move forward with any assumptions.
The answer to the best of my understanding:
Yes, climate models are applied to the surface and up through the various layers of the atmosphere. Once you get above the surface you run into challenges with measuring those various layers. The surface has the advantage of extensive direct data, above that you have to rely on either balloon data (which is sparse) or satellite data (which is an indirect measure of temperature and actually poorly measures some layers, like the mid-troposphere).
For deep ocean models, I'm unsure. But I would imagine those would have little affect on shorter time scales and is more important measure as a longer term reservoir for accumulating heat energy.
For sea surface or near surface modeling, there is a lot of coupling between the ocean and atmosphere, thus those are going to be inherent to climate models.
The other important point to understand about climate modeling is that they are, as mentioned earlier, "boundary conditions" modeling.
You can think of "initial conditions" modeling like the hurricane storm tracks you see on the news. We know where the model is and the models project the likelihood of where it will track over the following days.
Climate models are different. What they're doing is running model ensembles. Essentially, they're doing longer term weather/climate runs, over and over, in order to see what the mean state is. As they say, "All models are wrong, but they are skillful." We're not asking models to tell us whether this year will be warmer or cooler than the last. We know that's inherently noisy. We're asking climate models to tell us, over time, how much warming we can expect to see.
Understand that? They're wrong because one model run will say next year is warmer and another will say it's cooler. But they are "skillful" because they can tell us, with a high degree of confidence, the longer term trend for the climate system.
- John F. Clauser: the latest climate science-denying physicist
Rob Honeycutt at 00:26 AM on 28 October, 2023TWFA: "... if the atmosphere and planet is heating up, so should the temperatures at 20,000' or 40,000', or even deep ocean temperatures, there should be plenty of data available at least for the former, weather balloons and PIREPs, it should track the models just as well and if not we would need to know why."
Each of these comments from you is a fascinating demonstration of how little you've actually looked at the science of climate change. There is published research on all these topics and there is a very broad, deep agreement across research fields that human emissions of CO2 are the primary cause of warming of the past 50 years.
And the PIREP bit is espectially bizarre. Being a pilot myself I know what you're talking about, but you should also know that PIREP's tend to be few and far between. They're helpful but not reliable. In addition, those PROG charts you pull in to ForeFlight or download via ADS-B in, those are produced through the same models used for climate models. They're merely initial conditions modeling (weather) as opposed to boundary conditions modeling (climate).
All this and still you have yet to say one word about Clauser's claims.
- 2nd law of thermodynamics contradicts greenhouse theory
Likeitwarm at 04:18 AM on 30 September, 20231600. Rob Honeycutt et al
I'll wear that name proudly!
I'm just looking for the most plausible reasons for climate change.
I have found a number of theories. You will call them all quackery because they are not your theory.
I like Peter Ward's. Scroll down the page you sent me and read Peter's responses to his challengers. He makes a lot of sense. His challengers did not prove him wrong, only disagreed with him.
What I find wrong with your version of the science is that you say the small amount(less than 8% of all IR from the surface) re-radiated IR from a colder part of the atmosphere causes warming of the surface per Trenberth chart. That cannot happen. Your radiated photons from all emitting gases carry wave length and amplitude dependent on temperature emitted from. Not enough energy to heat the surface there. Per Ward 2015 colder IR is reflected by warmer object, not destroyed.
Magically, your chart shows the down welling radiation is greater, almost double, than what the sun supplies. Satellites see 255k for the temperature that is radiated from about 5-6 km altitude, not from the surface. The surface is warmer, not from the GHE, but from gravity doing work on the atmosphere causing adiabatic heating. This is why near surface temperatures are ~33c warmer than Planck equations predict. That makes sense unlike the GHE raising the temperature that much.
There is no experiment showing co2 warms the atmosphere.
There is no measurement showing human emissions of co2 cause the recent warming.
All you have is a correlation that doesn't prove anything.
The extra UV-B radiation reaching the surface warms the ocean and the warmer ocean emits more co2 per Ward 2015 makes sense and he does have a correlation with ozone levels and temperatures. Read his paper I linked to.
I know you like labels, but get the label right.
It's "CO2 causes climate change science denier" not "climate science denier". - 2nd law of thermodynamics contradicts greenhouse theory
Likeitwarm at 04:38 AM on 28 September, 2023Sysop, Thank you for allowing this conversation with scaddenp and myself to continue.
1562 scaddenp
You said "What I am asking is whether you can remember what switched you into looking for sites like CO2Science or temperature.global? Was it just disbelief about trace gases or were there other considerations?"
I've been thinking about an answer for you.
I started looking into "global warming" back in the mid 2000s, 25 years ago,
I think with this site https://www.geocraft.com/WVFossils/ice_ages.html.
Many other places and books since then.
I find a lot, 1000s or more, of scientists that disagree with AGW.
One is Nasif Nahle who has calculated the emissivity of CO2 at less than .003 and and says that it doesn't absorb or emit much if any IR. You can see his calculations at https://jennifermarohasy.com/2011/03/total-emissivity-of-the-earth-and-atmospheric-carbon-dioxide/
Then there is the Club Of Rome, a bunch of rich elitists that think they know best for the rest of us. Back in 1968-1974 they decided they needed a scare tactic to get people to reduce births, thus reducing the population of the earth and the resources used by them. They settled on AGW because CO2 is emitted when fossil fuels are burned. Reduce the available energy and you will reduce the birth rate.
The U.N. IPCC was not charged with finding out what makes the climate change but rather how to pin it on human causes. See https://shalemag.com/manmade-global-warming-the-story-the-reality/ and https://principia-scientific.com/the-club-of-rome-and-rise-of-predictive-modelling-mafia/
UN’s Top Climate Official: Goal Is To ‘Intentionally Transform the Economic Development Model’
https://www.investors.com/politics/editorials/climate-change-scare-tool-to-destroy-capitalism/
You see, the goal was not to save us all from overheating the planet or acidifying the oceans. The goal was to scare everyone into giving up cheap fossil fuels.
I don't know what the goal of you and your colleagues at Skeptical Science is but I do know you can create logic and equations to describe anything, so I remain skeptical of your site.
Now you know where I'm coming from. See www.ourwoods.org.
Cheers - There is no consensus
Eclectic at 18:27 PM on 10 September, 2023RicardoB @950 :
thank you for the link to Jordan Peterson's YouTube interview with Dr Judith Curry [made February 2023]. Thank you ~ sort of ~ but alas the video is one (1) hour plus 34 minutes long.
Warning. I didn't get much farther than 35 minutes into the video, before my patience ran out. Dr Curry seemed her usual rather vague & waffly self . . . a blend of half-truths & suggestive propaganda. [See my comments at post #949 , above.] If she or Dr Peterson have anything highly worthwhile to say in the remaining hour of the video ~ then please time-stamp it so I can go look at it.
Shortly before I gave up entirely, Curry at 38:40 said**: "at least over the next 3 decades, like the natural variability piece of this is pointing towards cooling ... [which] would tamp down the [CO2-caused warming]".
** My comment is that this is routine lawyer-advocate rhetoric coming from Curry ~ she has almost no evidence to support this "looming cooling" in the next 3 decades . . . but it sounds good to the gullible Denialist listener . . . and if real climate scientists challenged her, she would simply stand back and say (approx) "Oh I didn't say the world would cool, I just said the expected anthropogenic warming would/could/might be somewhat lower than the IPCC expects." [Which seems likely to be 0.5 degreesC hotter than 2023 ~ barring a sustained heavy asteroid bombardment.]
# At the start of his video : some minutes of Petersonian waffle ~ he may have (as a psychologist) some personal insight . . . but it seems to get overridden by his desire for limelight (such is his multi-year track record).
At 19:30 , Dr Jordan Peterson shows how little he knows about climate matters ~ fair enough ~ but why is he choosing to boost Dr Curry?
At 23:30 , Dr Curry makes vague & fluffy reference to cloud effects. And goes on to say: "we don't know how sensitive the climate is to increasing CO2"
At 24:35 , Curry goes on to suggest: "... the oceans and the sun that are the biggest sources of uncertainty in understanding what's going on ..."
RicardoB , you can see why I regard most of what comes out of Dr Curry's mouth as being very often slanted towards insinuations of a vague or semi-deniable type, well-suited as grist for Denialists.
But, if there's anything good in the last one (1) hour of the video . . . then let me know !
- It's cooling
Rob Honeycutt at 06:54 AM on 5 September, 2023CORK... "But this is not incompatible with a cooling at geological time scales."
What's important to understand is that warming or cooling, on whatever scale, is due to physical processes, most of which are at least fairly well understood by researchers.
The Escalator graphic is demonstrating there are inherent variations in the surface temperature trend. This makes sense when you understand that short term changes surface temperature is a function of energy going into and coming out of the earth's oceans.
The Escalator graphic is presented to explain how "skeptics" will use very short trends in global temperature to claim the "globe" has stopped warming, when nothing could be further from the truth.
The earth, on the whole, is rapidly warming primarily due to increasing atmospheric concentrations of greenhouse gases. That fact is true regadless the short term rate of warming at the surface.
- Climate Confusion
Markp at 21:50 PM on 1 September, 2023Not sure how to respond to comments to my comment... There is no "reply" etc., featured in those comments, so I'll just say to Eclectic that I'm sorry you find my last paragraph unclear, and to Bob Loblaw and Rob Honeycutt: I'm clear on the difference between different types of "zero" CO2 scenarios, whether they imply constant concentrations or not. And Zeke's "explainer" is nice but is only a case in point: too many people simply assert that under a complete end to human emissions scenario, whereby natural uptake through oceans and trees continue drawing down CO2, heating will stop. Almost immediately. And they seem to base that belief purely on what has been modelled. And as everyone should know about models: garbage in, garbage out. The models don't reflect reality, though they try. Their inputs aren't complete, but merely partial. For example, ZECMIP is only CO2. The fact is, when we talk about hypothetically achieving no more human emissions, we're talking about a time in the future that is not tomorrow or next year or next decade, but at the very least, several decades, at least going by the extremely lazy response by humanity thus far. Correct? So by that time in the distant future, as emissions have continued, and tipping points have tipped, many things will have likely changed that our current thinking (or modeling) does not account for. So it is a bit silly to claim that temperatures will just stop IF/WHEN/? we ever manage to end human emissions, or "net" end them through the net zero concept. We place far too much reliance on models here, or rather I should say, those who are cheerleaders for net zero do.
So to Eclectic, I'm not proposing an alternative to reducing emissions. We need to reduce emissions. But that won't be enough. We also need to try the best form of SRM we can manage, which in my view is land-based mirrors, because the tech is here now, it's low tech, non-toxic, completely scalable, does not block sunlight from reaching our flora and fauna, and has an immediate effect on warming, unlike all the downstream GHG management methods.
- Ice age predicted in the 70s
Don Williamson at 23:06 PM on 18 August, 2023To Eclectic
Use Google Scholar as well as a couple of search engines reading peer-reviewed paper on the 'hiatus' 'wsrming slowdown'
If you jot down the various reasons that were used in the multiple papers you'll understand why Dr Michael E Mann said, "The problem isn't that we cannot explain the temporary slowdown in warming — ???????????? ???????????????????????????? ???????? ???????????????? ???????????????????? ???????????? ???????? ???????????????? ???????????????????????????????????????????????? ???????????? ????????"
Dr Kevin Trenberth Trenberth was a co-author on a paper published in Nature Climate Change that used models to show that pauses in surface temperature warming correspond to additional heat being stored deep in the ocean, ???????????????????? ???????????????????? ???????????????? ???????? ???????????? ???????????????????????????????? ???????????????????????????? ???????????????????????????????????? ????????????????????????????.
The 'warming' was taking place where there's little to no measuring devices?
Is that sound science?
link to quotes above:
https://www.scientificamerican.com/article/has-global-warming-paused/
????
- Ice age predicted in the 70s
Rob Honeycutt at 13:32 PM on 17 August, 2023Don @125...
"The last time I checked, which was a few years ago, he was expecting to top 300 papers on the subject. That's a lot of papers trying to explain a 'talking point'"
I'm very curious if you bothered to read any of these papers, or could quote the conclusions drawn from any of them.
For my own part, based on the research I've read, whenever there's an extended period of little or no warming... what I'm assuming is that means the oceans are taking up a lot of heat energy and all that eventually has to come back into equilibrium with the atmosphere.
"Contrarians" seem to only think, "Ha! No warming! Take that you eco-socialist!"
- Ice age predicted in the 70s
Eclectic at 10:39 AM on 17 August, 2023Don Williamson @123 and prior :
To put things in a more realistic perspective : the Ocean Heat Content continued to rise during the so-called Hiatus of atmospheric temperatures. So there was actually no real Hiatus ~ it was just an interesting talking-point. The globe was continuing to warm.
Yes, we can discuss "the hiatus" as an abstract concept or as a propaganda topic ~ but we are wasting our time if we tie ourselves into a pretzel trying to argue about consensus or scientific opinion regarding a physical non-event in overall global warming.
Propaganda point: Yes . . . a real scientific point: No
However, the 1945-1975 "cooling pause" was definitely real.
- There is no consensus
Eclectic at 17:56 PM on 15 August, 2023Rkrolph @948 , as far as I have seen, Dr Curry has not changed her expressed views in recent years (she has retired academically, but AFAIK still maintains a commercial interest in weather/hurricane season predictions). # I follow her blog most days ~ the blog is slightly redeemed by one or two of the commenters there. The blog is a somewhat more genteel version of WUWT blog.
Unlike Drs Spencer & Christie, and the definitely-emeritus Prof Lindzen, the good Dr Curry maintains a certain amount of vagueness in her speech and presentations . . . implying that she is not quite opposed to the mainstream climate science. Vagueness & a degree of "uncertainty" are her game ~ enough fuzziness for some Plausible Deniability, when someone tries to pin her down now or at a future date. But it is as obvious as an elephant in your kitchen, about which side of the scientific fence she occupies. And this goes down well with the usual group of denialist U.S. senators.
** Up to as much as two-thirds of modern rapid global warming might possibly be owing to "natural variations" or ocean/atmosphere cycles . . . that's the sort of Plausible Deniability she goes for. So no need to take any climate action.
Mr John Stossel is a reporter that has gone over to the Dark Side, years ago. Basically a propagandist. I haven't followed him closely enough to allow me to make a psychiatric assessment.
- How big is the “carbon fertilization effect”?
Rob Honeycutt at 07:30 AM on 14 July, 2023Dave @22... In order to at least attempt to make this a productive discussion I'm going to focus in on one small point. That is the "greening is turning to browning" which you're rejecting with incessent copy/paste Gish Gallop and little genuine engagement.
FAQ 5.1 | Is the Natural Removal of Carbon From the Atmosphere Weakening?
For decades, about half of the carbon dioxide (CO2) that human activities have emitted to the atmosphere has been taken up by natural carbon sinks in vegetation, soils and oceans. These natural sinks of CO2 have thus roughly halved the rate at which atmospheric CO2 concentrations have increased, and therefore slowed down global warming. However, observations show that the processes underlying this uptake are beginning to respond to increasing CO2 in the atmosphere and climate change in a way that will weaken nature’s capacity to take up CO2 in the future. Understanding of the magnitude of this change is essential for projecting how the climate system will respond to future emissions and emissions reduction efforts. [emphasis added]
Please tell me how you square the idea of "Is natural removal of carbon
from the atmosphere weakening? No..." with the above text in bold, taken from the exact same AR6 FAQ 5.1. - How big is the “carbon fertilization effect”?
daveburton at 01:45 AM on 14 July, 2023Eclectic wrote, "Daveburton @22 ~ Please explain more of your first chart [ IPCC's decadal Carbon Flux Comparison 1980-2019 ]. The natural sink flux figures… show a rather steady proportionality to the total carbon emissions."
Glad to. Any two things which steadily increase are thereby correlated. There's only a possibility that the relationship might be causal if there's a possible mechanism for such causality.
There's no possible mechanism by which the rate at which CO2 emerges from chimneys could govern the rate at which CO2 is taken up by trees & absorbed by the oceans, or vice-versa, so the relationship cannot be causal — just as this famous relationship is not causal:

Eclectic wrote, "The land sink shows about 30-35% of total emissions, while the sum of land & ocean remains around 55-60%."
Yes, I usually say "about half," as in, "If our CO2 emissions were cut by more than about half then the atmospheric CO2 level would be falling, rather than rising."
It is important to recognize that the relationship is merely coincidental, not causal.
Eclectic wrote, "as the decades progress, the natural carbon sink flux in absolute terms rises with the rising emissions ~ but does not show a proportional increase."
The rate at which natural processes, such as ocean uptake, uptake by trees and soil ("greening"), and rock weathering, remove CO2 from the air, is affected in minor ways by many factors, but in a major way by only one: the current amount of CO2 in the air.
Our CO2 emission rate does not and cannot affect the natural removal rate, except indirectly, in the long term, by being one of the most important factors which affect the amount of CO2 in the air.
Eclectic wrote, "looking back in time ~ as the atmospheric CO2 level decreases, the size of the natural sink flux decreases also."
That is correct. It will also be correct looking forward in time, when CO2 levels are falling, someday.
Eclectic wrote, "this directly contradicts your hypothesis of 'if emissions were halved ... atmospheric CO2 level would plateau.'"
If you'll allow me to use "halved" as a shorthand for "reduced to the point at which emissions merely equal current natural removals, rather than exceed them," then those two statements are both correct, and perfectly consistent. It's pCO2 (level), not the rate of CO2 emissions, which (mostly) governs the rates of all the natural CO2 removal from the atmosphere.
Of course there are also minor factors which affect the removal rates. For instance, as we've already discussed, a 1°C rise in water temperature slows ocean uptake of CO2 by roughly 3%. Conversely, a rise in air temperature accelerates CO2 removal by rock weathering. (Sorry, I don't have a quantification of that.) But the main factor which controls the rate of CO2 removals is pCO2.
Eclectic wrote, "While the nutritive components of some food crops may reduce slightly as CO2 rises…"
Oh boy, another rabbit hole! That's the Loladze/Myers "nutrition scare."
It is of little consequence. That should be obvious if you consider that crops grown in commercial greenhouses with CO2 levels as high as 1500 ppmv are as nutritious as crops grown outdoors with only 30% as much CO2.

≥1500 ppmv CO2 is optimal for most crops. That's why commercial greenhouses typically use CO2 generators to raise daytime CO2 concentration to well above 1000 ppmv. It is expensive, but they go to that expense because elevated CO2 (eCO2) makes crops much healthier and more productive. (They don't typically supplement CO2 at night unless using grow-lamps, because plants can't use the extra CO2 without light.)
If elevating CO2 by >1000 ppmv doesn't cause crops to be less nutritious, then elevating CO2 by only 140 ppmv obviously doesn't, either.
Better crops yields, due to eCO2 or any other reason, can cause lower levels (but not lower total amounts) of nutrients which are in short supply in the soil. But that doesn't happen to a significant extent when agricultural best practices are employed.
I had an impromptu online debate about the nutrition scare with its most prominent promoter, mathematician Irakli Loladze, in the comments on a Quora answer. If you're not a Quora member you can't read it there, so I saved a copy here. He acknowledged to me that food grown in greenhouses at elevated CO2 levels is as nutritious as food grown outdoors.
Faster-growing, more productive crops require more nutrients per acre, but not more nutrients per unit of production.
Inadequate nitrogen fertilization reduces protein production relative to carbohydrate production, because proteins contain nitrogen, but carbohydrates don't. Likewise, low levels of iron or zinc in soils cause lower levels of those minerals in some crops. So, it is possible, by flouting well-established best agricultural practices, to contrive circumstances under which eCO2, or anything else which improves crop yields, causes reduced levels of protein or micronutrients in crops.
But farmers know that the more productive crops are, the more nutrients they need, per acre. Competent farmers fertilize accordingly.
Or, for nitrogen, they may plant nitrogen-fixing legumes — which benefit greatly from extra CO2.
If you don’t fertilize according to the needs of your crops, negative consequences may include reductions in protein and/or micronutrient levels in the resulting crops. The cause of such reductions isn't eCO2s, it's poor agricultural practices.
The nutrient scare is an attempt to put a negative "spin" on the most important benefit of eCO2: that it improves crop yields.
Eclectic wrote, "it is (as you state) beyond argument that higher CO2 benefits overall crop yield & plant mass."
That's correct. Moreover, agronomy studies show that for most crops the effect is highly linear as CO2 levels rise, until above about 1000 ppmv (which is far higher than we could ever hope to drive outdoor CO2 levels by burning fossil fuels). That linearity is obvious in the green (C3) trace, here:

That improvement is one of several major reasons that catastropic famines are fading from living memory.
If you're too young to remember huge, catastrophic famines, count yourself blessed. Through all of human history, until very recently, famine was one of the great scourges of mankind, the "Third Horseman of the Apocalypse." But no more. This is a miracle!
https://ourworldindata.org/famines

Ending famine is a VERY Big Deal, comparable to ending war and disease. Compare:
● Covid-19 killed 0.1% of world population.
● 1918 flu pandemic killed about 2%.
● WWII killed 2.7%.
● The near-global drought and famine of 1876-78 killed about 3.7% of the world population.
Eclectic wrote, "other CO2/AGW concomitant effects of increased droughts /floods /heat-waves can be harmful to crop yields in open-field agriculture. [And especially so for the staple crop of maize.]"
Well, let's examine those one at a time.
Heat-waves. Overall, temperature extremes are not worsened by the warming trend. Heat waves are slightly worsened, but by less than cold snaps are mitigated. That's because, thanks to "Arctic amplification," warming is disproportionately at chilly high latitudes, and it is greatest at night and in winter. The tropics warm less, which is nice, because they're warm enough already.
1°C is about the temperature change you get from a 500 foot elevation change. (That's calculated from an average lapse rate of 6.5 °C/km.)
On average, 1°C is similar in effect to a latitude change of about sixty miles, as you can see by looking at an agricultural growing zone map. Here's one, from the Arbor Day Foundation:

From eyeballing the map, you can see that 1°C (1.8°F) = about 50-70 miles latitude change.
James Hansen and his colleagues reported a similar figure: "A warming of 0.5°C... implies typically a poleward shift of isotherms by 50 to 75 km..."
1°C is less than the hysteresis ("dead zone") in your home thermostat, which is the amount that your indoor temperatures go up and down, all day long, without you even noticing.
In the American Midwest, farmers can fully compensate for 1°C of climate change by adjusting planting dates by about six days.

Floods. Theoretically, by accelerating the water cycle, climate change could increase the frequency or severity of floods. But the effect is too slight to be noticeable. AR6 says no change in global flood frequency is detectable:

Droughts. Droughts have not worsened. In fact, the global drought trend is slightly down. Here's a study:
Hao et al. (2014). Global integrated drought monitoring and prediction system. Sci Data 1(140001). doi:10.1038/sdata.2014.1

Here's the U.S. drought trend (the bottom/orange side of the graph):
https://www.ncei.noaa.gov/access/monitoring/uspa/wet-dry/0

Not only does climate change not worsen droughts, it has long been settled science that eCO2 improves plants' water use efficiency (WUE) and drought resilience, by improving CO2 stomatal conductance relative to transpiration. So eCO2 is especially beneficial in arid regions, and for crops which are under drought stress.
Maize (corn) has been very heavily studied. Even though it is a C4 grass, it benefits greatly from elevated CO2, especially under drought stress. Here's a study (one of many):
Chun et al. (2011). Effect of elevated carbon dioxide and water stress on gas exchange and water use efficiency in corn. Agric For Meteorol 151(3), pp 378-384, ISSN 0168-1923. doi:10.1016/j.agrformet.2010.11.015.
EXCERPT:
"There have been many studies on the interaction of CO2 and water on plant growth. Under elevated CO2, less water is used to produce each unit of dry matter by reducing stomatal conductance."
Here's a similar study about wheat:
Fitzgerald GJ, et al. (2016) Elevated atmospheric [CO2] can dramatically increase wheat yields in semi-arid environments and buffer against heat waves. Glob Chang Biol. 22(6):2269-84. doi:10.1111/gcb.13263.
However, I agree with you that putting a monetary value on the benefits of CO2 for crops is difficult. In part that's because the price of food soars when it's in short supply, and plummets when it's plentiful. So, for example, if we were to attribute, say, 15% of current crop yields to CO2 fertilization & CO2 drought mitigation, and value that 15% using current crop prices, we would be underestimating the true value, because absent that 15% boost the prices would have been much higher.
- How big is the “carbon fertilization effect”?
daveburton at 08:56 AM on 13 July, 2023Rob, in answer to your first question, Bob is correct: they use different units.
Both the graph and the "plug in suitable values" calculation (above) are for freshwater, but that hardly matters. CO2 is noticeably less soluble in saltwater, but the effect of temperature on CO2 solubility is nearly identical. Here's the same calculation with salinity 35 (typical seawater), for a 1° temperature increase (from 288K to 289K):
Bob is also correct that ocean chemistry is more complicated than that, in part because most of the dissolved CO2 immediately dissosiates into various ions. Here's a good resource on ocean chemistry:
http://www.molecularmodels.eu/cap11.pdf
What's more, in the oceans, biology generally trumps chemistry, and that is certainly true for CO2 uptake. Some people think that the capacity of the oceans to take up CO2 is limited to surface water by ocean stratification. But that's incorrect, beause the "biological carbon pump" rapidly moves CO2 from surface waters into the ocean depths, in the form of "marine snow."
The higher CO2 levels go, the faster that "pump" works. Here's a paper about it:
https://www.science.org/doi/reader/10.1126/science.aaa8026
Once carbon has migrated from the ocean surface to the depths, most of it remains sequestered for a very long time. Some of it settles on the ocean floor, but even dissolved carbon is sequestered for a long time. For instance, it is estimated that the AMOC takes about 1000 years to move carbon-rich water from high latitudes to the tropics, where it can reemerge. That is obviously far longer than the anthropogenic CO2 emission spike will last.
Due to the temperature dependence of Henry's Law, a 1°C increase in temperature slows CO2 uptake by the oceans by about 3%. That's a slight positive feedback: more CO2 in the air increases water temperatures, which slows ocean uptake of CO2. But it is very minor, because a 50% (140 ppmv) rise in atmospheric CO2 concentration accelerates CO2 uptake by the oceans by 50%, which obviously dwarfs 3%. That's the main reason that ocean uptake of CO2 continues to accelerate despite the temperature dependence of Hanry's Law.
- How big is the “carbon fertilization effect”?
Rob Honeycutt at 01:41 AM on 13 July, 2023Dave... Perhaps also think about what this chart represents. It's saying the solubility of CO2 falls as temperature increases. That means when temperature rises more CO2 remains in the atmosphere leading to more warming.
I believe this is the same effect that amplifies warming from orbital patterns to produce glacial-interglacial events.
If I'm correctly interpreting what you're claiming, it seems you're saying that warming oceans will take up more CO2, which would be inverse to the actual effect of CO2 solubility.
- How big is the “carbon fertilization effect”?
daveburton at 00:59 AM on 13 July, 2023I wrote elsewhere, "Due to the temperature dependence of Henry's Law, a 1°C increase in temperature slows CO2 uptake by the oceans by about 3%."
In reply, Rob asked, "Where do you come up with this 3% figure?"
From Weiss (1974), an approximate relationship is (as summarized by Pro-Oceanus):
The equilibrated ratio of partial pressure to dissolved concentration is governed by solubility:
pCO2 = Kₒ [CO2 (aq)]
where pCO2 is the partial pressure of CO2 in the gas phase, Kₒ is a solubility coefficient, and CO2 (aq) is the concentration of CO2 dissolved in the water.
The solubility of CO2 in water is a function of both the temperature and the salinity of the water, one relationship from Weiss (1974):
ln (Kₒ) = -60.2409 + 93.4517(100/T) + 23.3585(ln(T/100)) + S(0.023517-0.023656(T/100)+0.0047036(T/100)²)
where the solubility coefficient (Kₒ) has the units of mol kg⁻¹ atm⁻¹, temperature (T) is Kelvin, and salinity (S) is in parts per thousand (approximately equal to PSU).
Note that for non-saline waters, the second term of the equation becomes zero, leading to
ln (Kₒ) = -60.2409+93.4517(100/T)+23.3585 ln (T/100)
To get the "3%" figure, you can plug in suitable values, or you can look at a graph, like this one:
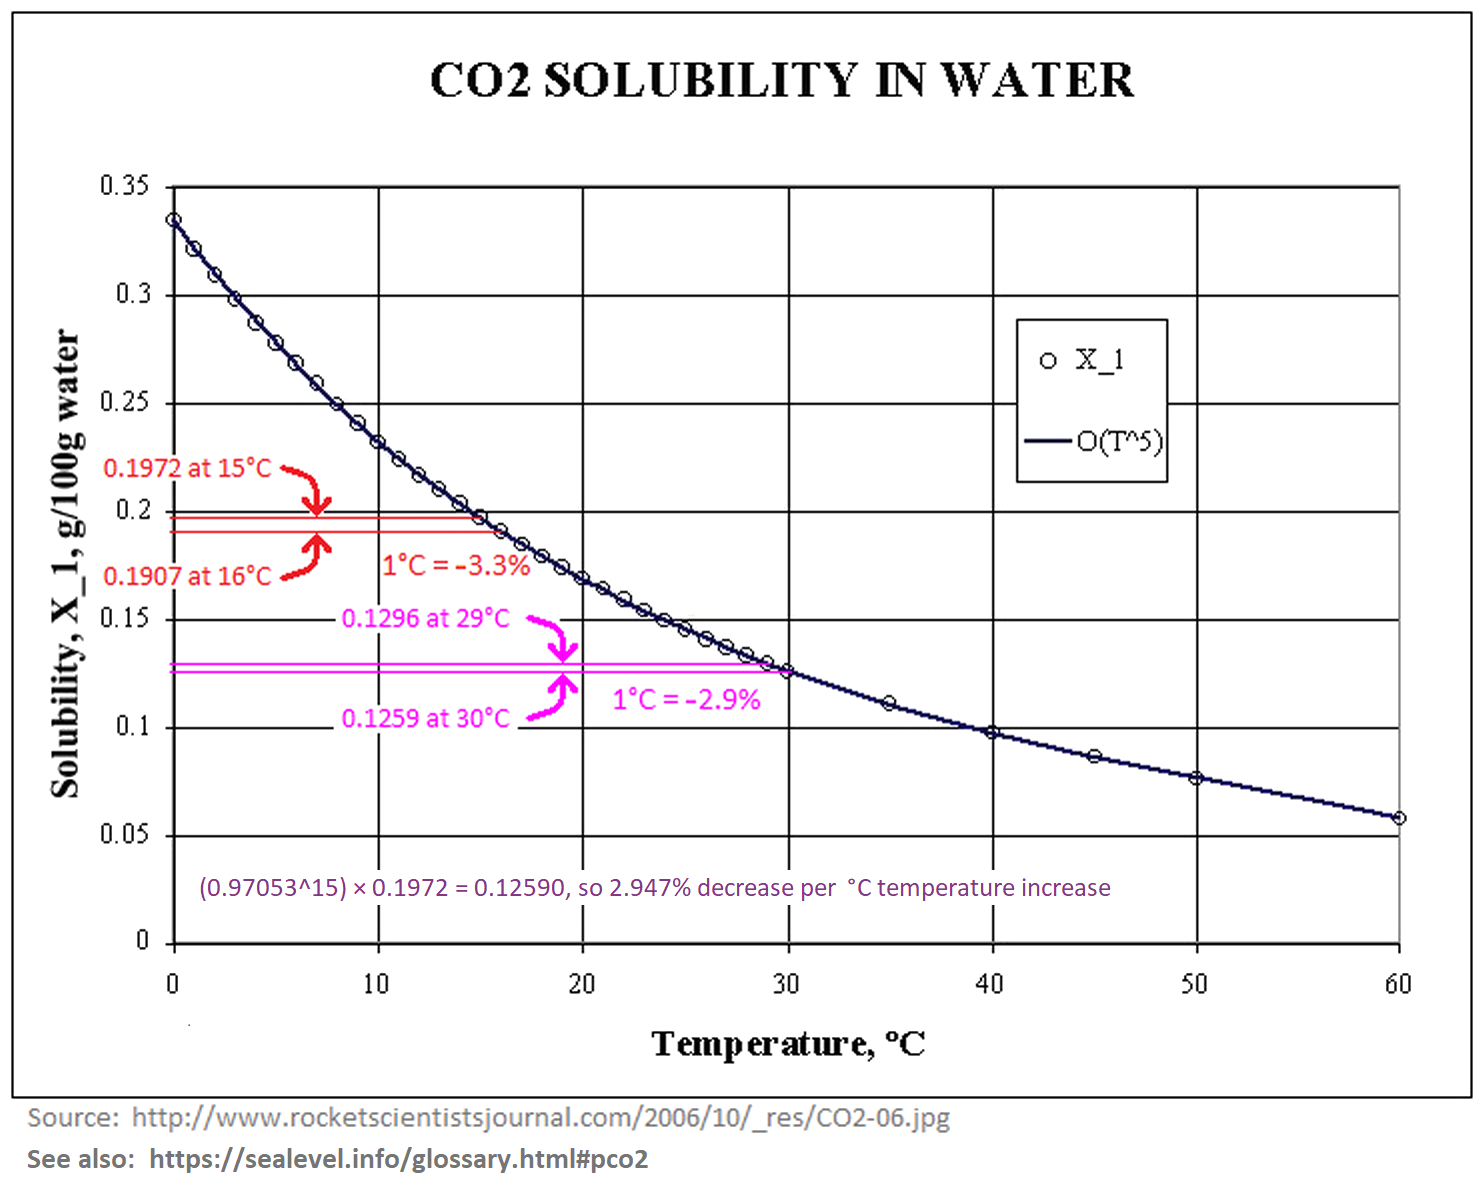
- How big is the “carbon fertilization effect”?
Rob Honeycutt at 11:17 AM on 11 July, 2023Dave... Your reference to the inset on FAQ 5.1 is comical at best.
It states exactly what I'm telling you, as did the other bits I posted.
FAQ 5.1: Is natural removal of carbon
from the atmosphere weakening?
No, natural carbon sinks have taken up a near constant fraction of our carbon dioxide (CO2) emissions over the last six decades.
You were making the claim that natural sinks were removing more of our emissions, and that is not the case by any stretch of the imagination. And the caption you posted goes on to say...
However, this fraction is expected to decline in the future if CO2 emissions continue to increase.
How can you not understand this? Take note that AR6, though it's the most current IPCC report, came out nearly two years ago, and the report is relying on data and research that was completed well before even that.
The most recent papers are saying that, yes, that CO2 fertilization effect is now waning.
Tropical Forests’ Carbon Sink Is Rapidly Weakening – Crucial for Stabilizing Earth’s Climate
Once again, in your own citation the language is clear.
FAQ 5.1 | Is the Natural Removal of Carbon From the Atmosphere Weakening?
For decades, about half of the carbon dioxide (CO2) that human activities have emitted to the atmosphere has been taken up by natural carbon sinks in vegetation, soils and oceans. These natural sinks of CO2 have thus roughly halved the rate at which atmospheric CO2 concentrations have increased, and therefore slowed down global warming. However, observations show that the processes underlying this uptake are beginning to respond to increasing CO2 in the atmosphere and climate change in a way that will weaken nature’s capacity to take up CO2 in the future. Understanding of the magnitude of this change is essential for projecting how the climate system will respond to future emissions and emissions reduction efforts.
The "observations show" means they are already seeing this happening, and that is based on research that's at least half a decade old.
- Hansen predicted the West Side Highway would be underwater
Rob Honeycutt at 10:06 AM on 6 July, 2023Dave @19... "Rob wrote, "that greening is now turning into 'browning.'" Well, here's what AR6 shows:"
This is absolutely classic.
1) That is not an image that appears in AR6, not with the added orange box. Thus you're co-opting their work to infer conclusions they do not make.
2) The caption for FAQ 5.1 is stating exactly what I've been explaining to you:
For decades, about half of the carbon dioxide (CO2) that human activities have emitted to the atmosphere has been taken up by natural carbon sinks in vegetation, soils and oceans. These natural sinks of CO2 have thus roughly halved the rate at which atmospheric CO2 concentrations have increased, and therefore slowed down global warming. However, observations show that the processes underlying this uptake are beginning to respond to increasing CO2 in the atmosphere and climate change in a way that will weaken nature’s capacity to take up CO2 in the future. Understanding of the magnitude of this change is essential for projecting how the climate system will respond to future emissions and emissions reduction efforts. [emphasis added]
Therefore, quite clearly, you are using this graph completely out of context and using without understanding any of the underlying physics or research on the issue.
You are merely crafting tidbits to confirm your personal biases.
And, Dave, pointing out that you don't have the requisit training in this subject is not ad hominem. I don't have the training either, but I'm not making statements that directly contradict what the leading researchers in the field are saying.
- Hansen predicted the West Side Highway would be underwater
One Planet Only Forever at 08:00 AM on 6 July, 2023daveburton,
I will try to limit how much I repeat any of the assistance others have provided to increase your awareness and improve your understanding of the issues. I will try to focus on aspects of your response @10 that have not yet been addressed.
I think it may be best to respond in reverse as follows.
Regarding: "Assumption #2: You seem to think that the CO2 level controls sea-level."
That is a misunderstanding of my comment. I am aware of and understand the following Common Sense Consensus knowledge:
Increased CO2 levels will result in a warmer global average surface temperature resulting in the reduction of the amount of water that is stored as ice supported by land (melting of ice supported by water does not change the level - unless the melting of that ice accelerates the flow of land supported ice to the ocean). Most of the water that is no longer "ice supported on land" will drain into the oceans resulting in a higher sea level (and this process will take a long time to reach a balanced state after CO2 levels stop increasing).
In addition to the sea level change due to melted ice, an increased level of CO2 in the atmosphere will result in an increased average temperature of the oceans. And water expands as it warms resulting in a higher average sea level in addition to the melted ice impact.
Regarding: "Assumption #1: You assume that there's such a thing as "a locked-in doubling of CO2.""
I was not assuming anything. I was presenting a hypothetical situation for consideration. That situation is a case where CO2 levels reach 560 ppm and stay at that level due to continued human impacts.
Simply asking what the sea level will be when CO2 levels reach 560 ppm will result in a vast range of answers. There are a diversity of cases where CO2 levels reach 560 ppm that would have significantly different expected maximum sea level rise. They include the following:
- CO2 rapidly reaching 560 ppm and continuing to rapidly increase. That will produce a low amount of sea level increase at the moment that 560 ppm is reached. But it would cause a much higher level in the distant 'balanced condition' of the future that will be established at some significant time after CO2 levels are no longer being increased.
- CO2 levels slowly reaching 560 ppm and continuing to slowly increase. That would result in a higher sea level when 560 ppm is reached that in case 1. But if the same 'maximum ppm level' as in case 1 is reached then the long term sea level rise would likely be comparable to case 1.
- CO2 level increases to 560 ppm then is held steady by continued human impacts (a locked in level of CO2). This is the case I was referring to. Indeed you misunderstood my comment.
- CO2 levels rise to 560 ppm and then are rapidly reduced by human industrial CO2 removal or other human impact changes that result in reduction of CO2 levels rather than a steady level of 560 ppm. This is closer to what an ethical consideration would conclude. The more ethical conclusion is that CO2 levels should not be allowed to reach 560 ppm. And human actions to remove CO2 from the atmosphere are required even though the CO2 levels do not reach 560 ppm.
Finally regarding your opening statement: "...why are you asking me "about the human origins of global warming"? My comment had nothing to do with that."
I was not asking a question. I was pointing out that the information you provided did not affect the conclusion of the OP. Your comment could be considered to be an attempt to use a 'new twist' of the "Hansen got it wrong" claim.
That raises a new question. Why did you make the claim you made @8?
- Hansen predicted the West Side Highway would be underwater
daveburton at 07:39 AM on 6 July, 2023Rob wrote, "that greening is now turning into 'browning.'"
Well, here's what AR6 shows:

Some people point to that little orange box and say that greening has ceased. That reminds me of the folks who say that the it's not as warm as the 2015-16 El Nino, so warming has ceased.
Philippe wrote, "There is probably a better thread for this argument,"
I agree. I was just trying to address OnePlanet's remark about a "locked in" CO2 level.
Philippe wrote, "There is only one factor that truly controls how green any region can be: water availability."
That's a common misconception. Elevated CO2 levels greatly improve plants' water use efficiency (WUE) and drought resilience. That's why elevated CO2 is especially beneficial for crops when under drought stress. It has been heavily studied by agronomists. Here's a paper about wheat:
Fitzgerald GJ, et al. (2016) Elevated atmospheric [CO2] can dramatically increase wheat yields in semi-arid environments and buffer against heat waves. Glob Chang Biol. 22(6):2269-84. doi:10.1111/gcb.13263.
Philippe wrote, "The experiences that have shown a CO2 fertilization effect were done in very controlled conditions and involved extremely high concentrations (800 ppm and up)."
That's incorrect. All major crops have been studied, and all benefit from elevated CO2. It is true that the greatest benefits accrue at 1000 ppmv or higher, but even modest CO2 increases significantly improve crop yields.
This recent study quantifies the effect for several major crops. Their results are toward the high end, but their qualitative conclusion is consistent with many, many other studies. They reported, "We consistently find a large CO2 fertilization effect: a 1 ppm increase in CO2 equates to a 0.4%, 0.6%, 1% yield increase for corn, soybeans, and wheat, respectively."
This study evaluated pine trees:
Idso, S., & Kimball, B. (1994). Effects of atmospheric CO2 enrichment on biomass accumulation and distribution in Eldarica pine trees. Journal of Experimental Botany, 45, 1669-1672.

As you noted, the effect is greatest with CO2 >800 ppmv, but, as you can see, even a much smaller CO2 increase has a substantial effect.
Rob wrote, "This entire paragraph is patently absurd and completely fabricated."
It is 100% factual, Rob. I'm surprised that you didn't already know it.
These figures are from that same AR6 Table 5.1 excerpt which I already showed you:
average CO2 removal rate in the 2010s = 2.7707 ppmv/yr
average CO2 removal rate in teh 2000s = 2.3481 ppmv/yr
These figures are from Mauna Loa:
average CO2 level in the 2010s = 399.91 ppmv
average CO2 level in the 2000s = 378.84 ppmv
(399.91-378.84) / (2.7707-2.3481) = 49.86
So a 50 ppmv increase in CO2 level accelerates the natural removal rate by about 1 ppmv/year.
49.86 / 2.1294 = 23.42 ppmv increase yields a +1 PgC removal rate increase.
I encourage you to do the calculations yourself for any other time period of your choice.
If you have the natural removal rate as a function of CO2 level (which we do), it is trivial to simulate the CO2 level decline if emissions were to suddenly cease. I wrote a little Perl program to do it; email me if you want a copy.
Rob wrote, "if true, the oceans would just continue to suck up all the atmospheric CO2 and we'd live on a frozen planet."
That's incorrect. The system progresses toward equilibrium, which is below 300 ppmv, but not zero.
Rob wrote, "rather that starting from a prior where all the published science is getting it wrong, and making stuff up... you don't have the requisite training to fully grasp the topic"
Rob, it's not necessary to resort to ad hominem attacks. I'm happy to document things that are surprising to you. You need but ask. Everything I've written is well-supported.
Rob wrote, "take some time to fully familiarize yourself with Henry's Law."
Due to the temperature dependence of Henry's Law, a 1°C increase in temperature slows CO2 uptake by the oceans by about 3%. But a 50% (140 ppmv) rise in atmospheric CO2 concentration accelerates CO2 uptake by the oceans by 50%. That's the main reason that ocean uptake of CO2 continues to accelerate.
- 2nd law of thermodynamics contradicts greenhouse theory
EddieEvans at 06:06 AM on 7 June, 2023Likeitwarm
It sounds like the energy captured by greenhouse gases changes the Earth's energy balance. Without the greenhouse gases, Earth would freeze. From the page, "he Second Law does not state that the only flow of energy is from hot to cold - but instead that the net sum of the energy flows will be from hot to cold. That qualifier term, 'net', is the important one here. The Earth alone is not a "closed system", but is part of a constant, net energy flow from the Sun, to Earth and back out to space. Greenhouse gases simply inhibit part of that net flow, by returning some of the outgoing energy back towards Earth's surface.
The myth that the greenhouse effect is contrary to the second law of thermodynamics is mostly based on a very long 2009 paper by two German scientists (not climate scientists), Gerlich and Tscheuschner (G&T). In its title, the paper claimed to take down the theory that heat being trapped by our atmosphere keeps us warm. That's a huge claim to make – akin to stating there is no gravity."
More though, it seems that melting albedo on the Arctic Sea allows solar radiation to warming the ocean, which is something else to consider. I'm not a scientist, just interested.
- CO2 is not the only driver of climate
Eclectic at 10:20 AM on 8 May, 2023Piotr @70 ,
Think about it this way ~ causes and effects.
In this universe, if you see an effect, there must be a cause (and with enough study, you can find that cause - which may be a single cause, or a combination of causes).
Past studies (by experts) have shown broad changes in climate - not measured in tenths of a degree as per modern thermometers, but in broad assessments of indirect indications of climate average temperatures / sea level changes / vegetation changes / and so on. From this, it is evident that the climate changes when there is a causative change (a change in solar output, or in atmospheric CO2 levels, or in reflective "albedo" from global ice coverage, or in stratospheric aerosol particles from major volcanic eruptions).
All these jig-saw pieces fit together nicely, to give the scientists (and us) a good understanding of how climate "works".
Beware of non-scientists who say that "stuff just happens" [excuse the American expression]. They seem to wish to believe that the past century or two of very rapid global warming is somehow not caused by the obvious causes. And that it came for no identifiable reason. They seem to wish to believe that the modern warming "just happened for no cause" (sometimes expressed in the meaningless phrase "it is just a rebound from the Little Ice Age").
(The Little Ice Age had its own causes - frequent major volcanism plus episodes of reduction in solar output.)
Or they say that the modern rapid warming must instead be caused by "long-term changes/oscillations in ocean currents" ~ which actually does not make scientific sense (if they bothered to think it through).
Piotr, there are definitely some people who do not wish to think.
- Why the food system is the next frontier in climate action
One Planet Only Forever at 09:10 AM on 30 April, 2023Evan,
Your question may be questionable.
The climate change issue is primarily about human actions that are increasing ghgs in the carbon cycle (increasing the balanced state of ghgs in the atmosphere and causing other harms like increased CO2 absorption in oceans).
That perspective helps identify and understand the differences between the variety of ghg impacts caused by human actions. Most important, it helps understand that some causes of CO2e from human food production and consumption are ‘not the concern’.
Steady-state production of ghgs from food production and consumption is not the primary concern. That would be a sustainable carbon cycle. Food production and consumption that increases the level of ghgs, especially the use of fossil fuels, is the primary concern. An increasing population that eats less ‘higher impact food like meat or rice’ can actually result in a reduction of the steady-state level of ghgs. In addition to an increasing population having less consumption, the remaining consumption can be changed to be less harmful, like developing meat and rice production that does not cause as much ghg impact.
Therefore, an answer to the question about the ‘per capita CO2e’ is that, due to the current developed problem of significant excess ghgs, especially CO2, already in the atmosphere, unnecessary CO2e impacts from human activity need to be ended and actions that will reduce the steady-state ghg levels in the atmosphere are required. (The peak level of ghg increase due to the historic, and continuing, lack of interest in seriously restricting harmful and unnecessary actions will undeniably be a harmfully excessive level).
Also, the required changes of food production and consumption for the collective of human activity to be more sustainable will vary by region. Regions that currently have more people eating less than a ‘diet necessary for healthy living’ can be expected to have increasing impacts. But if such a region also has a significant amount of harmful unnecessary food consumption, due to a significant status gap in that region's society, then that region could, depending on how much harmful consumption is occurring in the region, reduce the total regional level of ghg impacts while the less fortunate in the region increase their impacts.
PS. The titles of the two study reports linked in the last paragraph you are questioning are informative (the reports are even more informative): “A meta-analysis of projected global food demand and population at risk of hunger for the period 2010–2050” and “Future warming from global food consumption”. However, developed socioeconomic-political biases can bias what is investigated, how it is investigated, and how it is reported. That is likely a significant root cause of the populist political attacks on less biased science that establishes a requirement for significant changes of developed beliefs and actions, especially if it highlights the need for rapid changes of popular and profitable developments. It may also be why I did not see the obvious problem of harmful over-consumption being highlighted.
- There is no consensus
Albert22804 at 09:46 AM on 20 April, 2023"Such low ECS figures would mean the earth's climate should be almost perfectly stable over geologic time (no glacial-interglacial cycles) and we know that's not true."
Rob, believe it or not there are other factors that effect global temperature like, the sun, solar winds, magnetic fields, cosmic rays, transportation and retention and expulsion of ocean heat, volcanic activity above and below water, aerosols, clouds, gravitational pull of other planets, milankovitcg cycles, earth rotation wobble, shifting of poles, etc.
Our current warming cycle started around 1700 as The little ice age peaked negatively and we have been warming sporadically ever since.
its all perfectly normal with many historical precedents in the Holocene and previous interglacials.
1000 years ago Vikings colonised and farmed parts of Greenland that are still permafrost today. How can this be unless Greenland was far hotter than today. etc Etc etc.
But Michael Mann showed us in his model that the medieval warm period and little ice age never existed so all those thousands of scientists that proved they did exist must be wrong.
- Two attempts to blame global warming on volcanoes
Bob Loblaw at 03:21 AM on 6 April, 2023I had presumed that JohnSeers' question @ 49 was with respect to the direct heating effects of undersea volcanoes, rather than any indirect effects associated with CO2 emissions, etc.
Oceans are an important mechanism of heat transfer. Globally, tropical and subtropical regions absorb much more solar radiation than they emit back to space, so they show a net gain via radiation. Polar and sub-polar regions are the opposite - they lose more by IR emission to space than they absorb from solar radiation.
The climate system re-balances those regions of gain/loss by transporting energy poleward, and this happens via circulation in both the atmosphere and the oceans. Ocean currents such as the Gulf Stream, etc. move large amounts of energy.
And both land areas and ocean floors show vertical heat transport from the interior of the earth to the surface - but as discussed in the link I gave in comment #50, the amounts are small. And as pointed out in comments, to argue that current surface warming is the result of this flux of heat from the earth's core (via volcanoes or regular conduction) would require massive undetected increases in that geothermal heat flux.
Ain't happening, and anyone arguing that it is (without evidence) can be assumed to be badly uninformed (or mis-informed).
- Two attempts to blame global warming on volcanoes
JohnSeers at 23:06 PM on 4 April, 2023There is a third argument made that volcanoes cause global warming. Many underwater volcanoes heat the ocean and transfer heat via the PDO, AMO, ENSO etc.
Is there any debunking of that anywhere? - The Big Picture
Bart Vreeken at 21:31 PM on 22 March, 2023N R N P @168
Shall I have a try in answering your questions? I live in The Netherlands and here we have the same kind of discussions. Excuse me in advance for my English, it seems to be horrible.
A. Changing for the worse?
I hope we do agree that the earth is warming. It's an on going process and we (science) expect that it will go on for a much longer time. So it gives a lot of changes in the climate almost everywhere.
A key point is that the continents and the oceans are warming in a different speed. The oceans are warming much slower. This has consequences. When the atmosphere warms up it can contain more water vapor. But the less warming ocean can't deliver enough water vapour to keep the more warming continents humid enough. As a result there is more risk for drought at many places.
An other thing is that the air whole circulation will change. It means that local climates can change more than the global average. Wet climates can turn to dry climates, but also the other way round. Our agriculture, infrastructure and houses are not (always) prepared for that.
As you know, a warmer climate makes the sea level rise. The warmer water in the ocean expands, the ice sheets and mountain glaciers are melting to a certain extent. This sea level rise will give a lot of problems in many coastal areas. Here in the Netherlands the protection against the sea is very well organized, we can manage the first one or one-and-a-halve meter in this century. When it gets more we have a problem, but we are already try to prepare for that. Other countries, including deltas in Asia and parts of the US are less protected and will have large problems before 2100. By the way, it's not only the sea level rise there. Many of these places have also subsidence of the land, but these two come together and the problems are coming much faster then without sea level rise.
And then there is the unpredictable part. We don't know exactly how the ice sheets will react. Maybe there are mechanisms for a quick decline of parts of the ice sheets. In that case we have less time to prepare for it.
Of course, there can also be places where the climate gets better, or at least in a part of the year. And at least, we will need less fuel for warming the houses. (but more electricity for cooling in the summer.)
An interesting point is the direct effect of the increasing CO2 level to the vegetation and the agriculture. Plants can grow faster with that. Remote sensing shows something like 'global greening'. But it's a mixture of natural response and increasing agriculture. The last thing is tricky when water recourses are limited. And as we have seen, the increasing risk for drought is a cause for concern by itself. Maybe you know the story of the Aral See?
Then your question B) changing because of human activities?
Yes, we can be sure about this. We could calculate the effect of increasing CO2 hundred years ago and it's just what happening. Other possible factors, like changing sun power don't have much effect, these changes are too small. The less known part is how the atmosphere reacts (water vapor, clouds), how the ocean circulation reacts, how ice sheets react in detail.
"C) why this time it is different than the changes that have taken place?"
The changes are going very fast now, and as I said, the houses, the infrastructure, the agriculture and the water supply are not prepared for these changes. And there is the risk for sudden, even faster changes (tipping points).
More than 100 comments found. Only the most recent 100 have been displayed.
More than 100 comments found. Only the most recent 100 have been displayed.


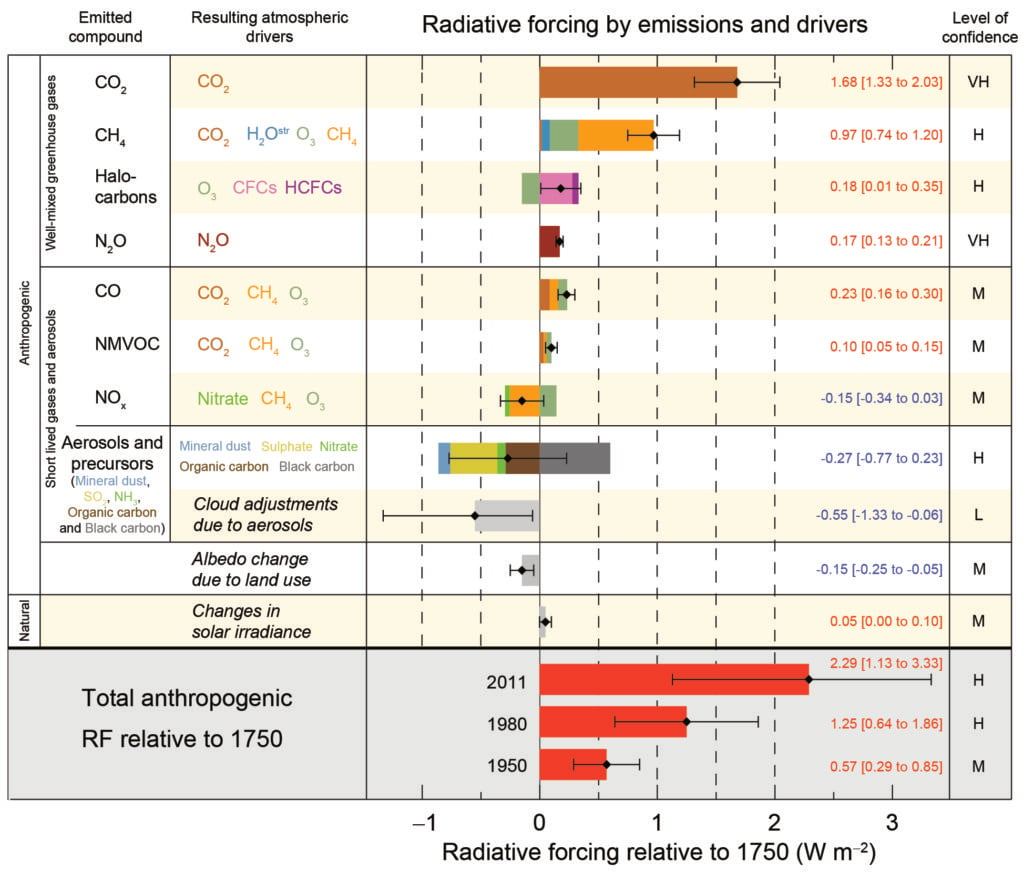
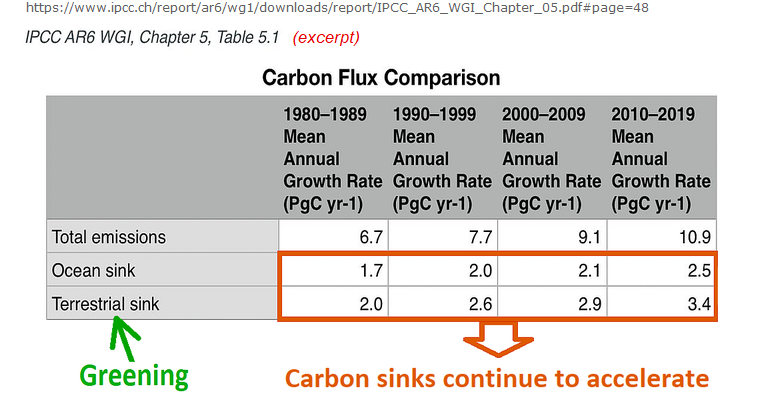
THE ESCALATOR

(free to republish)