


 Arguments
Software
Resources
Comments
The Consensus Project
Translations
About
Support
Arguments
Software
Resources
Comments
The Consensus Project
Translations
About
Support
![]()
![]()
![]()
![]()
![]()
![]()
![]()
![]()
![]()
![]()


![]()


Latest Posts
- How many people does heat actually kill?
- Check out the brand-new hurricane ‘cone of uncertainty’ graphics arriving this season
- 2026 SkS Weekly Climate Change & Global Warming News Roundup #23
- SkS Housekeeping: Updating the Comments Policy
- Skeptical Science New Research for Week #23 2026
- Nobody knows the future of energy
- Fact brief - Do electric vehicles almost always have a lower carbon footprint than gasoline-powered cars?
- Solar, wind, and EVs have knocked out a doomsday climate scenario
- 2026 SkS Weekly Climate Change & Global Warming News Roundup #22
- Skeptical Science New Research for Week #22 2026
- The next era of Atlantic hurricanes could be far more destructive
- On the death of RCP8.5
- RCP8.5 Update
- 2026 SkS Weekly Climate Change & Global Warming News Roundup #21
- Skeptical Science New Research for Week #21 2026
- What’s a ‘super El Niño’? And other El Niño questions, answered
- Fact brief - Does electromagnetic radiation from wind turbines pose a threat to human health?
- Five things you need to know about El Niño’s likely comeback
- 2026 SkS Weekly Climate Change & Global Warming News Roundup #20
- Skeptical Science New Research for Week #20 2026
- Higher warming predictions for 2026 and 2027
- A look back at ‘An Inconvenient Truth,’ 20 years later
- Two videos about the Atlantic Meriodonal Overturning Circulation (AMOC)
- 2026 SkS Weekly Climate Change & Global Warming News Roundup #19
- EGU2026 - Five days of virtual learning
- Skeptical Science New Research for Week #19 2026
- Climate Adam - Climate Change is Destroying Lives... Now
- EGU2026 - Presentation about the Skeptical Science Experiment
- Fact brief - Were the 2022 whale deaths off the US East Coast caused by offshore wind development?
- 2026 SkS Weekly Climate Change & Global Warming News Roundup #18
Comment Search Results
Search for sea level rise
Comments matching the search sea level rise:
- Human-caused climate change is unmistakably distinct from Earth’s natural climate variability
MA Rodger at 21:37 PM on 16 April, 2026Moderator Response @1,
The amateur analysis of 'global average' temperature linked @1 by rkcannon is entirely naive in its method and in its reporting of conclusions.
It concludes "...the notion that CO2 is the primary driver of global warming. If this were the case, periods with higher CO2 emissions would exhibit a faster rate of warming than periods with lower emissions," pointing to what the amateur calls his finding that "...long-term temperature rise was steeper in earlier periods when CO2 emissions were modest compared to current levels. These results hold despite changes in how time periods are defined ... and how weather stations are selected ... .")
The grand analysis supporting such a bold assertion looked at 100, 500 and then 992 selected weather stations (so all land sites), selected for the level of data available and then calculates the temperature trends for 42, 35, 30 & 21 year periods. The 100 station results presented show the temperature trends for the latest periods are by far the steepest in two centuries under analysis, 1815-2024. (42y +0.24ºC/decade, 35y +0.25ºC/dec, 30y +0.33ºC/dec, 21y +0.41ºC/dec) which of course entirely contradicts the conclusions presented in the analysis.
So that's worse than "amateur"!!
The other link @1 by rkcannon is to Marks-Peterson et al (2026) which is paywalled but an associated paper Shackleton et al (2026) 'Global ocean heat content over the past 3 million years' is not. These two papers drew coverage at RealClimate. Both papers examine very very old ice which provides data with less accurate age such that ice age cycles are fuzzed out.
The two papers are pointing to a more complex cooling 3My-0,5My bp. From the press release:-
"The implications of the results are that the cooling of the last 3 million years probably involves, in addition to the key role of heat-trapping greenhouse gases, important contributions from other components of the climate system such as Earth’s reflectivity, variations in vegetation and/or ice cover and ocean circulation."
Somehow there are crazy folk gleaning straws from the science to present misguided support for their crackpot version of reality. The account of Marks-Peterson et al (2026) nailed-up on the rogue planetoid Wattsuppia was headlined 'Shock New Evidence Showing No Link Between CO2 and Temperature Over Last Three Million Years Stumps Net Zero Activists' and such coverage prompted a few grownups to explain the true implications fo the two papers.
- Trump just torched the basis for federal climate regulations. Here’s what it means.
Bob Loblaw at 01:43 AM on 3 March, 2026nigel @ 38:
Going back in history, many trades operated guilds that helped identify skilled craftsmen. But as you point out, there is a fine line between controlling entry to the association to ensure that the people in it are truly skilled versus controlling entry to maintain some sort of privilege and exclusivity (and economic advantage). When it comes to regulation, the equivalent to the latter is regulatory capture (which I mentioned in #10). Someone has to watch the watchers, to make sure that the system is kept honest.
Even for something like engineering, where a person is accredited to design structures, there is a dependency on other accreditation processes. An engineer designing a building does not design and test the beam that will be used - they buy one "off the rack" from a company that makes them and provides specifications of the load it can handle. And that company will need to test their beams according to some sort of independent methodology developed by an accredited standards association.
I would argue that climate change is indeed a topic that has massive health and safety implications for the public, but as you say it is a much less tangible and immediate than things such as health outcomes, electrical safety, etc. The current EPA has codified this by barring the use of any indirect costs in the economic analysis of regulations.
The implications that can arise from climate change are also influenced by many other factors, which makes it easy for the contrarians to engage in a variation of whataboutism - assigning blame of any observed bad outcomes on something else. The tobacco industry perfected this technique in delaying actions against tobacco's health impacts.
Another issue with something like climate change is that is it not a well-defined target zone of study. Atmospheric science will help you understand why a region's climate is what it is, and how it might change, but to understand sea level rise you need to know oceanography. And to know food production implications, you need to know agricultural science. And to know flooding risks, you need to know hydrology. And to know ecosystem stresses, you need to know ecology. Thus "climate change" is by its nature an extremely multidisciplinary subject. You need a lot of people cooperating to put it all together. No single person can do it all alone, and the fake skeptics that act as if they know it all are clearly working outside their area of expertise. The width of the “climate change” net can be seen by the tremendous variety of references listed in things like the IPCC reports. The shallowness of the contrarians' analysis can be seen in the highly-selective and self-referential lists of publications they include in their reports.
In the current Trump administration, the phrase "conflict of interest" takes on new meaning - "Only my interests matter, and the only conflict is how others dare to challenge me".
- Zeke's 2026 and 2027 global temperature forecasts
prove we are smart at 18:19 PM on 26 December, 2025@2 MA Rodger "His argument is really simply that the current trajectory of mankind is pointing to some really bad outcomes. You could use such projections to point to, say, pre-industrial mankind drowning in horse shit."
I never read that story before-a funny shitless outcome for technology and fossil fuels saving the cities, the twist to that is the savior is now the villain and an existential threat to, well,everything. ???????????? Human health
Extreme heat increases risks for vulnerable groups, including pregnant women and infants.
Heatwaves, air pollution, and the spread of diseases all worsen as temperatures rise.
???? Economies
Countries face major economic losses from reduced productivity, damaged infrastructure, and disrupted supply chains.
For example, Cyprus could lose up to €29 billion from its GDP by 2050 without action.
????️ Ecosystems & wildlife
Species that depend on stable climates — like mountain meadow animals or cool-stream amphibians — are already struggling as their habitats change or disappear.
????⚡ Water and energy systems
Asia’s water and power systems are being hit hard by floods, droughts, and extreme weather, putting millions at risk and requiring trillions in adaptation spending.
???? Communities & infrastructure
Rising sea levels, stronger storms, and more frequent wildfires threaten homes, roads, and essential services.
NASA notes that effects like sea ice loss, glacier melt, and more intense heat waves are already happening and will worsen.
???? Food security
Droughts, heat, and unpredictable weather reduce crop yields and disrupt food supply chains.
????️ Earth’s natural systems
Global assessments highlight extreme weather, biodiversity loss, and destabilization of Earth’s systems as top long-term risks for humanity.
There is no argument the earth temperature is still rising,in fact,arguably accelerating. All the nation states are playing in an international poker game,where everyone is cheating. The unfriendly USA is openly and aggressively war mongering for Venezuela's heavy crude and more than eyeing off the sovereign nation of Greenland for its particular usefulness.
All the responders opinions agree that last link I mentioned is complete "pretentious twaddle". I see something else. I see tipping points of no return happening on our watch. I see a tragedy from a thousand cuts to our biosphere. I see political leaders too "involved" with corporations/big business and election cycles to plan sincerely.
Worst of all,the consumer has only a little appetite for a meaningful change to their bubble. The commodification of everything and the insidious media manipulation means a continuation of an economical system driving us all towards that cliff.
At least 6@ nigelj adds a little realism to it all. I don't have an answer to turn societies to less comforts, we need to be less capitalistic and more community minded and that goes against most western countries lifestyles.
- Climate skeptics have new favorite graph; it shows the opposite of what they claim
MA Rodger at 05:03 AM on 29 November, 2025RegalNose@26,
In the context of Judd et al (2024)'s graph below (Fig4a in the OP above),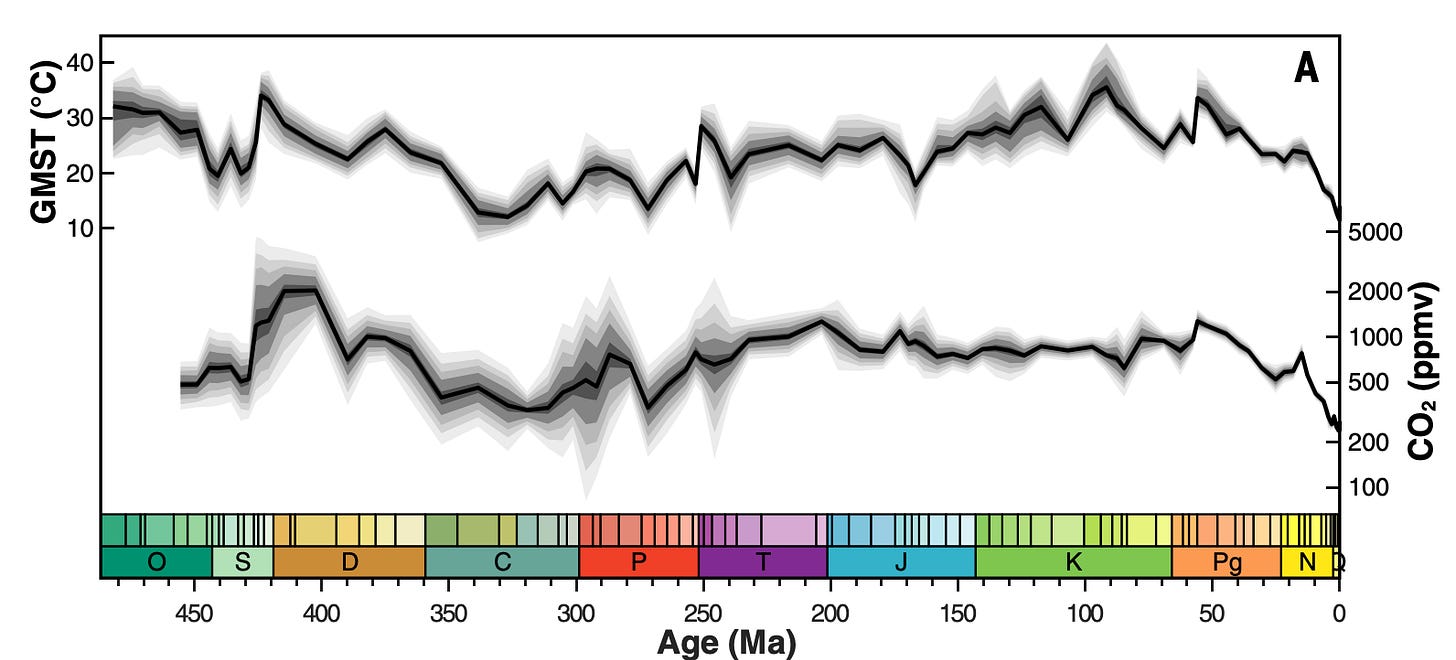
you ask - Isn't the NASA graph (below)
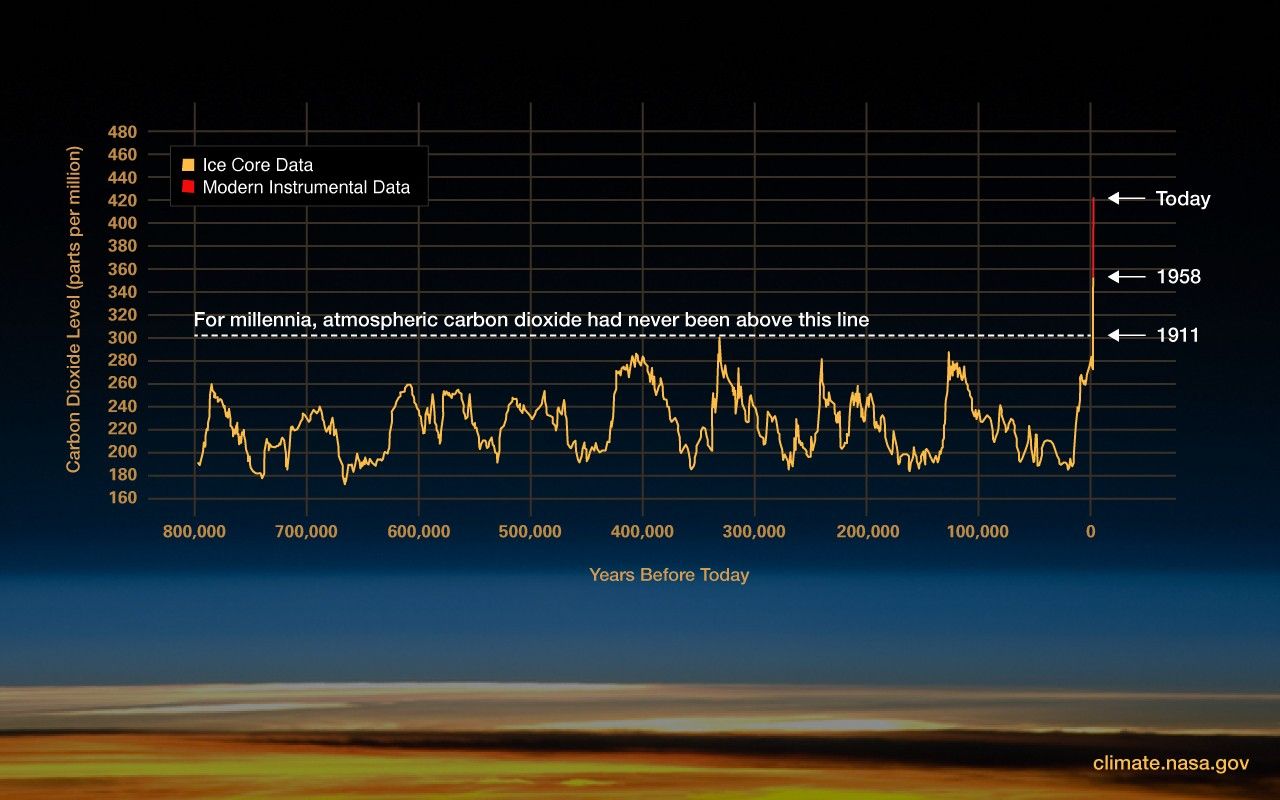
just pure scaremongring?
You ask "What am I missing? Why the panic and crisis mode?"
The OP above does not really answer your question of why CO2 should put us humans into a panic mode.
❶ The OP is firstly addressing the misuse of the Judd et al findings, being converted into total nonsense. It is, of course, difficult to nail down 'total nonsense'. ❷ Secondly, the OP chats about the threat of our CO2 to natural life on Earth rathert than the treat to humanity. ❸ That is not to say we humans should not be panicking.
❶ That first point, the OP presents an exemplar piece of 'total nonsense' which says "There's always this rise and fall." The context here implies it is the global temperatures they are saying "always ... rise and fall."
They continue:-
"This idea that the whole thing is based on carbon emissions from human beings is total bullshit. It's not true. Right. We might be having an effect, but we're having a small effect, a very small effect.”
This quote is 'total nonsense' as the findings of Judd et al, the evidence they are presumably presenting, says the exact opposite. Judd et al say it is CO2 on which the "whole thing is based". From their abstract:-
"There is a strong correlation between atmospheric carbon dioxide (CO2) concentrations and GMST, identifying CO2 as the dominant control on variations in Phanerozoic global climate and suggesting an apparent Earth system sensitivity of ~8°C." [My bold]
And the present-day big actor driving the 'whole thing', the startling rise in CO2 NASA graph above, that is the 'human beings'. This 'whole thing' is not "very small".
Additionally, Judd et al finding "an apparent Earth system sensitivity of ~8°C" suggests the effect is far from "very small" in terms of global temperature.
❷ The threat to nature from to the CO2-rise being so rapid is a major part of the above OP. Perhaps to add a little colour, 56 million years ago the Paleocene–Eocene Thermal Maximum (PETM) was caused by CO2 rising from ~800ppm to ~2,000ppm. The climatic forcing would be the same if we today allow CO2 to rise to 690ppm (and no other GHG increases - accounting for other GHGs, the equivalent would be perhaps 520ppm).
The PETM was not a massive event in historical climate or ecology but it did have pretty big impacts. Consider horses - they shrank to the size of large dogs to cope with the heat. The PETM is often held up as the nearest example of what we are stoking with our man-made climate change. But there is one stark difference. The PETM warming took something like 25,000 years. Our warming is happening 100-times quicker. The sixth mass extinction event which humanity is already threatening with other activities will be a certainty if our warming gets anywhere close to rivalling the PETM's +6ºC.
❸ But we humans are an adaptable species. However the problems are this.
(1) We a very numerous species that relies on a lot of real-estate. Loss of big portions of that real-estate (or even just the projected loss of it) will have big big geo-political consequences. If we could all pull together and address the problems, that may not be so disastrous. But we won't. And I'd imagine climate-change-mitigation measures will not be such a high priority when the world economy collapses and wars of national survival break out.
(2) The climatology cannot tell us how long we can keep melting Greenland to prevent 20ft of sea level rise becoming inevitable, or when the AMOC will disappear plumging Europe into the deep freeze, or when the cloud feedbacks over the Pacific will add another +3ºC to the warming, etc. The +2ºC limit to the warming was dropped in favour of +1.5ºC because tipping-points such as these could potentially be triggered below +2ºC.
I hope that goes some way to explaining "the panic and crisis mode."
- Climate skeptics have new favorite graph; it shows the opposite of what they claim
Bob Loblaw at 03:21 AM on 28 November, 2025RegalNose @ 26:
The OP mentions the concern about rapid changes. Do not dismiss that concern lightly.
...but with regard to the long-term record, and the Mesozoic period in particular:
- What evidence exists that human civilization in its current form was doing well in those warmer Mesozoic climates? Will our agricultural systems work for us?
- Temperatures similar to the Mesozoic would result in major reductions in land-based ice (especially Greenland and Antarctica). That will lead to sea level rise.
In the next 75 years or so, a metre of sea level rise is a reasonable expectation. That will lead to a lot of new coastal flooding (already beginning), at significant cost (either to prevent, mitigate, or move away from).
In the longer term (centuries), a complete loss of land ice in a Cenozoic-like climate would lead to an 80m rise in sea levels. Here is a map (from this web site, where you can see a larger image) of how much flooding is likely. Are there any portions of that flooded coastal zone that you would like to see preserved?

- Debunking Joe Rogan, Dick Lindzen, and Will Happer
One Planet Only Forever at 07:03 AM on 7 November, 2025Because of Lindzen's past history of contributions to climate science, I find it very difficult to grant him any benefit-of-doubt regarding his statement in the first point raised (repeated below):
Lindzen @ 6:02: “global mean temperature doesn't change much, but you know you focus on one degree, a half degree, so it looks like something”
Lindzen @ 22:06: “Gutierrez (sic) at the UN says the next half degree and we're done for. I mean, doesn't anyone ask, a half degree? I mean, I deal with that between, you know, 9:00 a.m. and 10:00 a.m [laughs]. Rogan: "it does seem crazy. It's just that kind of fear of minute change that they try to put into people.”
To start, Lindzen seriously misrepresents what Gutierres has said. A quick internet search finds the following UN News item: There is an exit off ‘the highway to climate hell’, Guterres insists. It includes the following selected quotes:
“It’s climate crunch time” when it comes to tackling rising carbon emissions, the UN Secretary-General said on Wednesday, stressing that while the need for global action is unprecedented, so too are the opportunities for prosperity and sustainable development.
...
Question of degrees
He said a half degree difference in global warming could mean some island States or coastal communities disappearing forever.
Scientists point out that the Greenland ice sheet and West Antarctic ice sheet could collapse and cause catastrophic sea level rise. Whole coral reef systems could disappear along with 300 million livelihoods if the 1.5℃ goal is not met.
Extreme weather from East Asia to the western seaboard of the US has been turbocharged by climate chaos, “destroying lives, pummelling economies and hammering health”, said the Secretary-General.
It is very challenging to excuse someone like Lindzen saying those types of things (and all the other cases of misleading manipulative messaging by him and Happer that have been pointed out).
Rogan can be excused for being a gullible desperate pursuer of popularity who is easily impressed and therefore potentially is unwittingly massively harmfully misleading. No such excuse comes to mind for Lindzen (or Happer).
I look forward to the follow-up mentioned by Dana that will "...look at the underlying psychology in a separate article in the near future."
- Climate change is accelerating, scientists find in ‘grim’ report
michael sweet at 03:25 AM on 23 September, 2025Radman365:
You say "It does at least appear to me that there is an excessive degree of certainty with regards to "the truth" on both sides." There are two truths here to determine.
1) Is sea level rise accelerating? On one side we have a paper published in an obscure journal by authors who have produced erroneous analysis before on this topic and did not review their work with anyone with expertise in the subject. On the other we see hundreds of scientists who have discussed the data extensively with each other and reached a consensus that sea level rise is accelerating. The hundreds of scientists have identified multiple large errors in the obscure authors work.
In this case it is relatively simple to do the analysis and the results are very strongly indicating acceleration. I note that in addition to the tide guage data the hundreds of scientists have independant satalite data that reaches the same conclusion. The obscure scientists simply do not know what they are doing and have screwed up. Why did they ignore the satalite data that showed their analysis was incorrect?
The data is clear, sea level rise has accelerated over the past 50 years. Ignoring half of the data and assuming that sea level rise is independant at different locations in the world is simply an ignorant way to look at the data.
2) The important question is: will sea level continue to accelerate in the future? Data from the future is difficult to obtain. Scientists are debating what we should expect in the future. A few thnk it will not be too bad while others think it will be catastrophic. The fact that sea level rise is accelerating makes many of us very worried. The last time CO2 was over 400 ppm sea level was over 20 meters higher than today. I note that every time an IPCC report is released the projections of sea level rise increase.
You are welcome to think that sea level rise will not be too bad. That might be the case. Since sea level rise is accelerating, most of the readers here thinik we should be concerned about it. 20 meters of sea level rise would submerge most of the major cities in the entire world, although it will take a long time. Since the answwer to sea level rise is installing cheap renewable energy everywhere, why not try supporting renewable energy in your community?
- Climate change is accelerating, scientists find in ‘grim’ report
radman365 at 01:10 AM on 20 September, 2025And yet here's evidence that the models are wrong about one of their most fundamental predictions: accelerating sea level rise. Instead, this study using 60 years of tidal gauge data show an annual rate of approximately 1.5mm, not 3-4mm.Oops!
https://www.mdpi.com/2077-1312/13/9/1641
Blockbuster sea level study may turn climate change orthodoxy on its head!
- Climate change is accelerating, scientists find in ‘grim’ report
One Planet Only Forever at 06:55 AM on 18 September, 2025Evan,
Thank you for clarifying the focus of your comment @1. My take is that you are concerned that feedback mechanisms that will cause significant unanticipated warming far into the future have been triggered by human impacts to date.
My understanding is that, at the present and near future level of human impacts (with peak total impacts significantly lower than 2.0 C), sea level rise is one of the few impacts that will be increasing for a long time after human activity stops increasing ghg levels.
Recent years of unexpected global average surface temperatures raises questions. However, my point remains that how bad things get, including how much unexpected feedback is triggered, is totally controlled by human actions.
Lower total peak human ghg impacts in the future will produce lower amounts of harmful consequences in the future.
The wording in the article that concerns me is the moving away from the Paris Agreement goals by saying “the study finds that its [the Paris Agreement] primary target of limiting global warming to 2°C remains within reach."
As presented by the Wikipedia item for the Paris Agreement:
The Paris Agreement has a long-term temperature goal which is to keep the rise in global surface temperature to well below 2 °C (3.6 °F) above pre-industrial levels.
Limiting impacts to 2 degree C does not reach the Paris Agreement objective. And every bit of increased impacts increases the risk and magnitude of harmful unexpected feedback.
- Climate change is accelerating, scientists find in ‘grim’ report
One Planet Only Forever at 02:19 AM on 18 September, 2025Evan,
My understanding is that the global warming, climate changes, and sea level rise due to increasing ghg levels is due to the 4%. How much future harm is done is indeed totally dependent on what global humanity collectively does in the future.
What global humanity has done to date, including the failure to dramatically reduce activities that undeniably increase ghg levels, especially the most fortunate failing to lead the transition to less harmful ways of living (and the related failure of the most fortunate to help those who are tragically unfortunate have better less harmful life experiences), made things worse now than it had to be.
If humans stop causing impacts that continue to increase ghg levels then the global warming, climate change and sea level rise impacts will stop getting worse.
So, “Future emissions [do] control future warming,” when those emissions are understood to be the human caused excess emissions increasing ghg levels (the 4%). And that understanding is reinforced by the complete quote “Future emissions control future warming, … And if the world were to rapidly act on carbon dioxide and methane emissions, we could halve the rate of warming.”
And that understanding can be extended to state that: If global humanity were to rapidly act on carbon dioxide and methane emissions and rapidly act to develop and implement effective sustainable reduction of levels of ghgs then the maximum level of future harm due to future human impacts will be less than would otherwise be created.
A reminder about an often ignored aspect of reality regarding effective methods to limit the total future harm of human climate change impacts. A significant action that can immediately be implemented, needing no technological development or growth of production and use of a technology, is the ending of energy use that, while potentially enjoyable or popular or profitable, is not required to live a decent healthy helpful (unharmful) life.
Technological developments that require less energy consumption should be the priority. Less energy use would reduce the harm done during the transition from harmful unsustainable energy systems to harmless sustainable energy systems.
- It's not bad
Eclectic at 19:15 PM on 12 July, 2025Jlsoaz @426 :
quite possibly it would be hard to justify the effort of delving into & explaining the various aspects of "Attribution".
As you say, the question of Attribution is of interest to some ~ but it is rather difficult to handle such a fuzzy field. Calamitous weather events are multi-factorial in origin, and with a large percentage of chaos (as is all weather).
Maybe one could point to a 10% through to 50% causation coming from Global Warming . . . but even those percentages would have little influence on climate-change Deniers, and probably little persuasive effect on the average Politician or the Man-in-the-street.
The long-term effects of sea level rise, plus the bogeyman of increased migration of Third World refugees (from increasingly distressed regions) would ~ I strongly suspect ~ be more likely to stimulate public demand for greater action in tackling our Global Warming problem.
- Do Americans really want urban sprawl?
One Planet Only Forever at 12:23 PM on 21 March, 2025Regarding nigelj’s comment and expanding onto other points.
Walkable development does not require expensive high-rise buildings. But it can be expensive to redevelop built cities to be walkable. However, the bigger issue is the ways that misunderstandings can be exploited by people who want to impede efforts to develop sustainable improvements.
Walkable development can be effective with multi-use buildings less than 10 stories high. The lower floors could be commercial uses with the upper floors being residential. (Note: This NFSA blog post from 2020 states that the International Building Code – It is not International. It only applies in regions of the US that choose to adopt it. But that is another matter – defines a high-rise as, “a building with an occupied floor located more than 75 feet (22,680 mm) above the lowest level of fire department vehicle access.”)
Very walkable cities developed before ‘car-based sprawl’ and ‘downtowns filled with skyscrapers’ became misleading symbols of superiority.
Cities that developed based on the desire for ‘car sprawl’ and ‘downtown office skyscrapers’, like Calgary, Alberta (where I live), are very expensive to ‘re-develop to be walkable’. That is unfortunate because those cities are at a competitive cost disadvantage if they do not re-develop.
People living in ‘car-sprawl’ cities ‘need’ less expensive housing due to the high cost of ‘car ownership’ (internet searching will find many estimates that it costs more than $10,000 per year to be a car owner). Those cities also have higher costs to build and maintain their sprawling public service infrastructure (roads, water mains, sewer mains, power distribution ...).
The ‘car sprawl’ cities have also developed a cultural attitude that resists sensible changes, like the change to be ‘a more walkable city’.
There is a global collective that develops misunderstandings in opposition to efforts to limit the harm done by fossil fuel use. A massive percentage of Calgary’s wealth potential is from ‘limiting the limiting of harm done by fossil fuel use’. That ‘opposition to learning to be less harmful’ includes political misleading messaging to promote misunderstandings about actions like carbon pricing. The following article presents a connection between opposition to carbon pricing and opposition to walkable cities.
There is powerful opposition in Calgary to efforts to increase density and redevelop already built areas to be more walkable and higher density. The following articles are examples. They do not represent all of the Calgary opposition to ‘learning to live less harmfully’.
Calgary Herald - Legal fight against city's blanket rezoning decision rages on, headed for appeal
CTV News Calgary - Glenmore Landing redevelopment defeated by vote at Calgary council
Note that the area councillor supported the development and mentioned her attempts to address misunderstandings. The development was opposed by councillors of other areas of the city who repeated misunderstandings about the proposed development. The following article is about a different council member attempting to more officially investigate and address those misunderstandings.
CBC News - Calgary city councillor wants review on impacts of false information
The suggestion that the popularity of misunderstandings was a serious concern prompted misunderstandings in response
Calgary Herald - Opinion: Is a Ministry of Truth coming to Calgary?
The Calgary opposition to ‘walkable 15-minute’ development is almost certainly a key part of the unjustified global collective that opposes ‘learning to be less harmful and more helpful to Others’ (a ‘big-tent’ collective of misleading promoters of a diversity of misunderstandings, including climate science misunderstandings).
And the ‘walkable 15-minute’ misunderstandings are related to efforts opposed to better understanding of climate science (refer back to The Hub article link above). More walkable implies less car use, which would mean less potential for benefit from fossil fuel use (note that the Calgary councillor also wanted misunderstanding regarding Calgary’s rapid transit system development to be investigated).
The following article mentions the international conspiracy theory promotion of misunderstandings regarding 15-minute walkable development.
And the global group coordinating that ‘opposition to learning’ is also likely heavily involved in the opposition to other harm limiting actions like New York City’s Congestion Pricing (see this NYC ABC news item - Trump administration extends deadline for New York City to end congestion pricing)
There are a multitude of problems to be addressed and corrected by efforts to develop sustainable improvements. But almost all of the problems can be understood to be parts of a global collective that wants to benefit by developing and promoting misunderstandings to limit ‘learning to be less harmful and more helpful to Others’.
- Skeptical Science New Research for Week #11 2025
michael sweet at 01:39 AM on 14 March, 2025This paper documents the hazard of increasing ground water level inland caused by sea level rise. They say this hazard has not beern considered before. Ground water inland near the sea rises when sea level rises. This can cause flooding even if sea walls or dunes are in place and can cause damage many kilometers inland. Even before areas are flooded drainage systems fail, sewage systems can flood and building foundations can be damaged.
In Florida, where I live, I have heard of large condominiums failing with loss of life and bathrooms in restaurants not flushing at high tide. Fresh water supplies are compromised in many areas.
- Sabin 33 #12 - Do solar panels work in cold or cloudy climates?
Bob Loblaw at 06:19 AM on 23 January, 2025Evan @ 6:
On a rooftop installation, you probably end up putting panels on more than one roof section, which would be oriented in different directions. That would even out the power production through the day. But if you have lots of roof surfaces to choose from (more than you want covered in panels), then choosing which ones to use gets challenging.
The time of day question is an interesting one. Where I live, the electricity rates are broken into peak, mid-peak, and off-peak hours, and the time periods are 7pm-7am, 7am-11am, 11am-5pm, and 5pm-7pm.
- If you're reading carefully, you'll notice that there are four time periods, but only three rate levels.
- 7pm-7am is always off-peak. Time to charge the electric car.
- 11am-5pm is mid-peak in winter, but peak in summer (A/C season here).
- 7am-11am and 5pm-7pm are peak in winter (go-to-work, return-from-work times), but they are mid-peak in summer.
- Current costs are $0.076 off-peak, $0.122 mid-peak, and $0.158 peak, so we're looking at differences of about a factor of 2.
...so I'd agree there are real possibilities to optimize the solar panel installation to get maximum cost savings. And hopefully the utility company has set rates so that peak rates are when the grid can most benefit from extra power. Maximizing local production during the hot part of the day in summer also means that there is less need for transmission infrastructure, as the power is produced where it is needed for A/C.
The common single-orientation leave-it-alone setup is pointing south, set at "latitude tilt". (Zero is flat. 45° works for 45° latitude. 60° is a lot of tilt, and starts to run into the fact that at 60° latitude the sun is well above the horizon for a lot of the day (and rises in the NE and sets in the NW, so something pointing due south is shaded part of the day!) In high latitudes, a flat panel works best.
Optimizing runs into more detailed calculations that simple rules-of-thumb don't do well at. I've done such calculations at a research site where we ran some instrumentation off solar-powered battery setups. It happened to be a research station where we collected the direct and diffuse radiation measurements needed to do the local optimization. (By coincidence, NW of where you are in Minnesota.)
Where I am now, we considered doing a rooftop solar installation, but in winter our south-facing roof area is partly shaded by the house next to us. Roof geometry is not good (and small yards make ground-based solar impractical).
- Skeptical Science New Research for Week #1 2025
Bob Loblaw at 01:13 AM on 8 January, 2025Oh, my. More assertions from David-acct.
First of all, let's look at "due diligence".
- You started your diatribe in comment 2 saying "calls to stop misinformation are essentially calls for censorship". The paper listed in the OP, quoted by OPOF does not call "to stop misinformation" - it calls for not ignoring it and acting as if it has no effect. It's even in the title of the paper: "Why Misinformation Must Not Be Ignored". Reading the paper, I see nothing that represents a call to "stop misinformation".
- You did not do due diligence to see if the paper actually called for stopping misinformation.
- You made the same mistake a month ago, in the thread I linked to in comment 3 - misrepresenting a call to counter misinformation as a call to suppress it.
- I'll respond with the same statement I made back then: Cries of "censorship!" are in reality attempts to silence counter-arguments. Typically, those that scream about censorship are the ones that want to suppress open discussion.
- You have now provided a link that can be used to find eTable 1, mentioned in your comment 2.
- First of all, that paper is not the same paper that was referenced in the Ecker paper listed in the OP.
- The paper you referenced is more appropriately referred to as Wallace et al (2023). It is published in a journal titled JAMA Intern Med.
- The paper listed in Ecker is from 2022, and it is an internal working paper for the organization that the authors (presumably) work at: the National Bureau of Economic Research.
- The published version is clearly a later version of the same analysis, but it is not the same paper.
- You have not done due diligence to make sure that the paper you referred to is the same paper that the Ecker group accessed.
- eTable1 is found in the Supplemental Content tab, but you need to download a PDF to get to it.
- eTable 1 is "death counts". It is not "excess deaths", which you referred to in your comment 2. Although you stated that eTable 1 provides "death rates", you then asked "How they could have possibly concluded republican excess death rates were higher than democrat excess deaths when the raw data shows otherwise."
- In order to assess excess death rates, you need to analyze the raw data.
- In order to understand how the authors came to their conclusions, you need to look at how they determined excess deaths.
- They provide some of this in eTable 2.
- They also list some of their results in the table provided in the 2023 paper, under the Figures/Tables tab. There, you see the breakdown of Excess Deaths in Florida and Ohio, broken down into the three time periods they used to assess the raw data: early covid, before open vaccine eligibility, and after open vaccine eligibility.
- In comment 4, you now talk about "per capita death rates". You are not looking at "excess death rates", which is a standard method of assessment when trying to isolate one factor from many.
- I stand by what I said in comment 3: It is quite possible that your interpretation of the "raw data" is using a biased pooling of the data that hides the relationship you don't want to see.
- By looking only at raw death rates, regardless of cause, you fail to isolate the cause that creates excess deaths above the normal background rate.
The "raw data" in eTable 1 does not show what you think it shows. It shows that more Democrats died in the 25-84 age classes from all causes. It does not provide a breakdown by time period (essential for evaluating the effects of different vaccine availability), and does not even mention the time period that the data covers (whereas other data in the paper tells us that they have broken the data down into different time periods).
You close with "You will be surprised how often I am correct when you perform a basic level of due diligence. "
- You have criticized Ecker et al for something they did not say ("calls to stop misinformation". )
- You have got the wrong version of Wallace et al when you referenced "raw data".
- You picked a "raw data" table that does not assess excess death rates.
Frankly, the level of "due diligence" that you have illustrated in your work is pretty poor. In comment 3, I closed by asking questions whether you were spreading misinformation. Now that I have further details on your level of "due diligence" and can see the data you are claiming supports your position, I can see that what you have said here does indeed represent misinformation.
...and yes - based on your history here - I would be very, very surprised to discover that you are "often correct". Nearly every time you comment, there are details you have left out that discredit your opinion.
- The forgotten story of Jimmy Carter’s White House solar panels
One Planet Only Forever at 06:17 AM on 4 January, 2025Eric (skeptic) @5,
Regarding your point that “Some cost per metric ton of CO2 seems appropriate.” There are many other ‘externalities’ to be considered in order for EROI evaluations to not result in unsustainable harmful developments. But I will limit my response to carbon pricing and include points regarding the 1970s.
The appropriate carbon pricing value depends on the circumstances being evaluated. An example evaluation is provided in the Queen’s Gazette’s: The Conversation - “Carbon pricing alone is not enough to meet Paris Agreement targets”: By Sean Cleary, Queen's University, and Neal Willcott, Queen's University, December 20, 2023. It includes the following:
“We found that while carbon pricing on its own could limit global warming to 2.4 C, the global price would have to rise dramatically and rapidly to accomplish this. The price would have to start at $223.31 per tonne in 2023 and increase to $435.55 per tonne by 2045.
“While such an abrupt global policy change is unlikely, the price would not need to be so high if it was accompanied by other measures, including regulations that provide clarity and stability regarding green investments, clean technology subsidies and financing mechanisms (such as those facilitating transition investing by companies).”
Note that the above pricing is in Canadian dollars. And the evaluation’s methodology would result in an even higher pricing, and/or more significant other measures, being needed to achieve a 1.5 C limit. For comparison, the IPCC evaluation indicates (based on Google’s current AI summary) that the carbon price required to limit the harm to 1.5 C is US$170 (~ CAN$230) by 2030 and US$430 (~ CAN$590) by 2050.
However, it is important to understand that a correction of what has developed is required. And earlier and more significant ‘effective harm limiting action’ reduces the required magnitude of future corrective actions. So, an appropriate carbon price for starting the correction in the 1970’s would be lower. However, it could be argued that in the 1970’s there was an understandable possibility of limiting the harm done to be below 1.0 C. And achieving a lower level of future harm would require higher pricing. And most important is understanding that to properly develop sustainable improvements the developed actions, and corrective actions, need to be effectively harmless. A related essential understanding is that reducing undeserved (obtained in ways that are harmful) perceptions of superiority or advancement is ‘not harmful’. That objective understanding would require even higher pricing and more significant ‘other measures’, even in the 1970s.
The real challenge is getting people to appreciate that what has been developed is massively harmful and undeniably unsustainable (proven by the Stockholm University: Stockholm Resiliency Centre’s evaluation of Planetary Boundaries - linked here). In many cases the developed perceptions of superiority are massively undeserved. And the magnitude and required rate of the required corrections of developed perceptions of superiority and advancement increases as the required corrections are delayed by successful misinformation campaigns promoting misunderstandings and limiting awareness.
- Stop emissions, stop warming: A climate reality check
MA Rodger at 04:19 AM on 27 December, 2024rkrolph @8,
The quote you provide comes from a 900 word essay entitled 'Progressive myths harm the honest discourse' by Michael Huemer, a professor of philosophy at the University of Colorado at Boulder. The essay is really no more than an advert for his book 'Progressive Myths' (Amazon preview here).
In both book and essay he rails against "political activists" saying that "Nearly every piece of information they disseminate is a distortion or outright lie," and also that their influence is pervasive. In the essay he cites three exemplar "lies" promulgated by such "political activists." The three exemplars given are:-
(1) Women earn just 82 cents for every dollar that men earn for the same work;
(2) Police shootings show a marked racial bias against Black Americans;
(3) Global warming is an existential threat to America and the world.
These are, of course 'progressive' lies as are the nine "myths" featured in his book (according to this book review) and with Huemer apparently a 'libertarian' (according to the reviewer of the book who does say but not convincingly Huemer "also addresses falsehoods from the far right"). With the subject of the book being titled "Progressive Myths", some significant bias should bring no surprises. The Amazon book review linked above shows the book's Part VI containts three chapters:-
19 The Global Warming Consensus.
20 Existential Climate Risk.
21 Mask Science, which presumably is about spread of the recent pandemic.
(I should point out that, as I am a more-progressive less-libertarian Brit sat on the other side of the pond, I would consider the egregious lies and denials spread by 'libertarians' in the US should be far more of an issue and a concern. Thus I see the book as the lesson of Matthew 7:3-to-5 at play here.)
With that preamble from me, is there any merit to the notion of "global warming is an existential threat to America and the world" being nothing but a "progressive myth," as Huemer says? Is it indeed a lie? And do "Virtually no serious scientists think that global warming is an existential threat"?
The first thing required to be clear is what is meant by "existential threat."
There are some lunatics who talk of an "existential threat" to humanity, apparently suggesting that the Homo Sapiens species could become extinct. But such a notion is not being considered by Huemer.
The future exisitence of "America (USA) and the world" is the issue at hand. In the Amazon book review linked above which was lilely written by Huemer, the question is put "Is global warming really going to destroy human civilization?" Put another way, could we be** stoking a collapse of the USA and/or enough of the sovereign states of the world to collapse the world economic order. Note that more will be in play that AGW itself. Without collapsing the entire world order, the remaining sovereign states will almost certainly be arguing over resources, with the environmental impacts of AGW thus precipitating political conflict and thus further chaos.
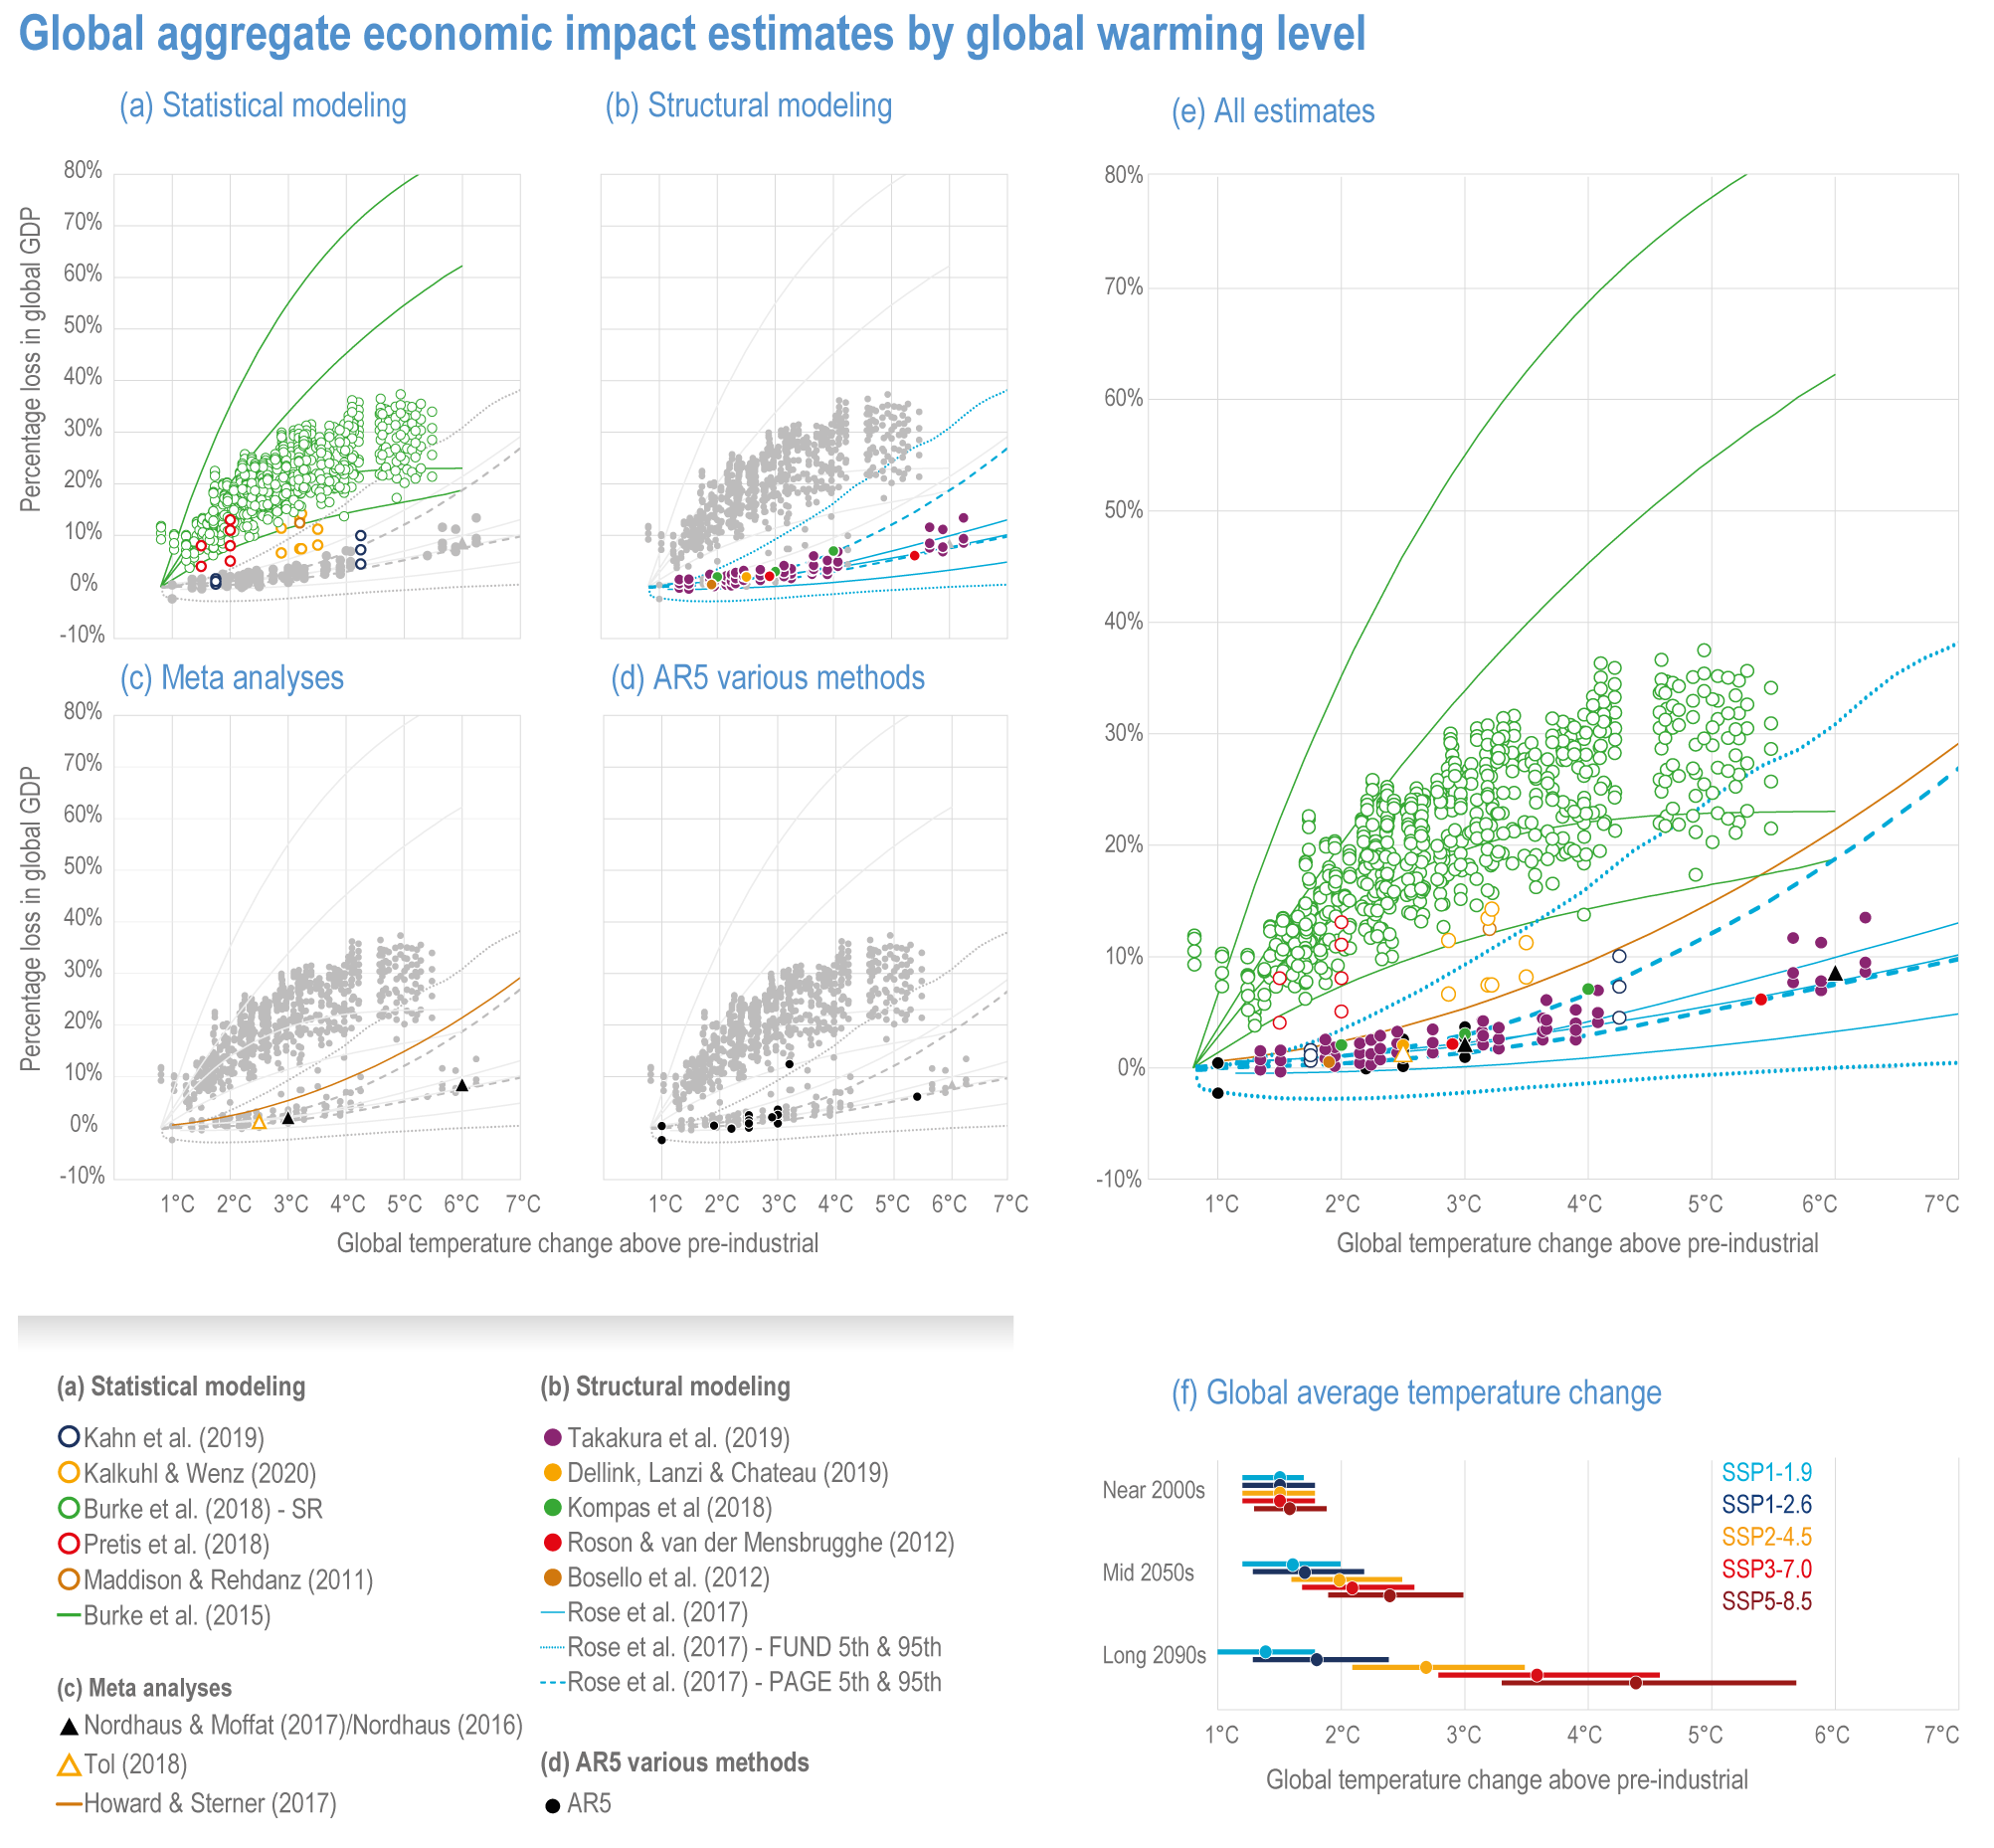
(** There is considerable uncertainty with the climate effects of AGW, even when a global level of warming is a given. There is thus a lot of uncertainty even before the level of AGW is converted into a measure of economic impacts.) The evident uncertainties within any assessment of the economic damage from AGW means assessment has to account for a less-than precise answer. The average of the potential results does not really provide a worthy assessment. It would be properly some assessment of the worst likely outcome.
And that leads to the work apparently setting-out what will be the financial impacts of AGW. In the most recent IPCC AR6 the conclusion is that no identifiable range of economic impacts globally is apparent due to the varying methodologies producing such a wide range of results. This range has increased since the limited analyses reviewed in AR5. Further complications include there being non-linear impacts with increasing AGW and there will be significant regional variation.
But to at least put some numbers to it, the range shown in AR6 for +4ºC of AGW is +3% to +33% with the CI ranging from negative to +66%. (Note the authors of these lower evaluations do come under fire and the likes of Richard Tol are well known for presenting a denialist stance.) This range compares to the "2.5% of GDP by 2100" stated by Huemer without any mention of the level of AGW assumed. It also compares with the range given in AR5 Box 3.1 "These incomplete estimates of global annual economic losses for temperature increases of ~2.5°C above pre-industrial levels are between 0.2 and 2.0% of income (medium evidence, medium agreement)."
There are many difficulties facing these researchers trying to set some sort of economic cost to AGW, mitigated or unmitigated, some examples being:-
☻ The 2100 time-frame usually chosen ignores some very serious issues, not least Sea Level Rise over multi-century timescales. Greenland melt down will become inevitable at some point below 2ºC AGW if it continues at that level. Thus it becomes a certainty for continuing AGW of +2ºC to resultant +7m SLR over a millennium or so. At +4ºC, there would be an additional +8m SLR from other land ice loss.
☻ There are many saying the undeveloped nations will see negative economic growth under unmitigated AGW. This may well not have such a big simplistic impact on global economic growth as the deveolped world accounts for the vast majority of the global economy. So if say Madagascar were to melt into the Indian Ocean and disappear, the global economy shrinks by just 0.1%. But also the 30 million inhabitants would thus be looking for some sort of future beyond their lost homeland. Some may see such migrations boosting economies elsewhere while others may see it as a more significant annual cost than the $500/head/y lost from their present day autochthonic productivity.
☻ The potential size of unmitigated AGW has been reduced in the minds of some researchers because the world has turned against using coal. This is argued because there are insufficient non-coal FFs to create much more than +3ºC AGW. Yet such an assumption remains to be fully argued out.
And do "Virtually no serious scientists think that global warming is an existential threat"? There is another philosopher who talks as though no scientist could seriously say it is not an exisitential threat. "In the worst-case scenarios in scientists’ climate models, human-caused climate change is a threat to the continued existence of many species and to human society as we know it."
To conclude, Huemer presents a predictably denialist (and he insists he is not an AGW denialist) with his outlandish pronouncements entirely out-of-kilter with him being a growed-up philosopher and all.
- Stop emissions, stop warming: A climate reality check
nigelj at 05:49 AM on 25 December, 2024rkolph@8
You said: "Virtually no serious scientists think that global warming is an existential threat. "
Some well qualified scientists do think climate change is an existential threat to humanity:
phys.org/news/2023-10-life-earth-existential-threat-climate.html
You said "Mainstream researchers anticipate global warming contributing perhaps a quarter percent to the excess death rate by mid-century and costing us 2.5% of GDP by 2100, making global warming less serious than many other world problems that have received far less attention."
Note that no researchers are named. You invariably find its the economist William Nordhaus. Just look up his wikipedia entry and read the expert criticisms of his DICE eoconomic model of climate change, near the end of the article. His assumptions are often unrealistic and he leaves out entire aspects of climate change like sea level rise.
One thing. He assumes quite high levels of economic growth in the future will offset climate problems. However economic growth has slowed relentlessly in developed countries since the 1970s until presently, with every sign developing countries will follow that trend later this century, and we live in a world of finite resources, with many fast being depleted and we have many countries with aging demographics and market saturation. This suggests future global economic growth will be low.
And thats before you consider the negative impacts of climate change on economic growth. Some experts calculate it will be considerably more than Nordhaus assumes:
"The largest impact of climate change is that it could wipe off up to 18% of GDP off the worldwide economy by 2050 if global temperatures rise by 3.2°C, the Swiss Re Institute warns."
www.weforum.org/stories/2021/06/impact-climate-change-global-gdp/
18% is huge and would severely impact the world. And this is still based on middle range warming estimates, and assumes critical tipping points won't be crossed.
- Stop emissions, stop warming: A climate reality check
Evan at 22:34 PM on 24 December, 2024rkolph@8
I repeatedly hear from top climate scientists that the scope and severity of climate change is proceeding faster than climate scientists thought it would X years ago. One of the top climate researchers, Prof. Richard Alley of Penn State, is on record saying that sea level rise could be 15 ft of more by 2100. That statement alone is sufficient to counter the positive outlook presented in the Daily Breeze.
If you watch videos of Prof. Alley's talks, you will quickly learn that he is a very measured and disciplined scientist who carefully chooses his words. He is not an alarmist. For him to say that you can not rule out sea level rise of 15 to 20 ft is alarming.
Prof. Alley has also researched past climatic changes and notes that if we push the system hard enough it can switch states in a matter of years through Abrupt Climate Change. The previous link is to a paper that is behind a paywall, but if just read the abstract visible on the website, you get the idea. Abrupt climate changes are hard to predict, but have happened before, and could likely happen again, given just how hard we're pushing the system.
How hard are we pushing the system?
Typical ice-age cycles see the predominant greenhouse gas, CO2, change by about 100 ppm over 100,000 years, causing a fluctuation of sea level by 400 ft! We are currently increasing atmospheric CO2 concentrations by 2.5 ppm/yr, year after year after year. In just 40 years, we increase CO2 by the same amount that natural processes require 1000's of year to do.
The idea that the human effect on the climate will be mild and managable are wishful thinking. We are actively damaging our life-support systems, but making precise predictions about how this will play out is difficult.
My recommendation is that you google "Richard Alley Climate Change" and start watching vidoes of his talks. You will learn a lot with which to counter the myth that the effects of climate change will be mild and managable.
- CO2 effect is saturated
MA Rodger at 21:57 PM on 9 December, 2024CallItAsItIs,
I note your comment @844 replying to my comment @841, crossed with my own @845, so the ball is perhaps in my court.
And perhaps I should be sure to give you the chance of providing a numerical answer in this to-&-fro.
As you do not appear to be a numbers sort-of-guy (which is strange for a physics PhD), I would be surprised if you could put some sort of value on the proportion of υ2-excited CO2 molecules in air that would emit a photon in the 15 micron band as the "numerical calculation" to demonstrate such a proportion is majorly complex & difficult. I've seen a proportion of 1-in-50,000 simplistically calculated. But the take-away is that it is massively small as, simplistically, the average relaxation time for an excited CO2 molecule to emit a 15-micron photon is measured in tenths of a seconds while such a CO2 molecule will be on average impacted by other air molecules in a matter of microseconds. Thus this transmission of excitation via photon→CO2→photon cannot by itself satisfy Kirchoff's law αλ = ελ.
And it also does not explain the measure 15-micron IR flying round the atmosphere.
But let us not get hung-up on the applicability or otherwise of Kirchoff's law.
You seem entirely positive about the applicability of Schwartzschild's equation, telling us @823 "the Schwartzschild equation is the correct equation to solve in order to determine the spectral intensity Iλ." Schwartzschild's equation (dIλ/ds = nσλ[Bλ(t)-Iλ]) tells us Iλ will not be effectively snuffed out when the path-length of the IR from the ground is reached. Rather, with constant temperature Iλ is also constant (Iλ = Bλ(t) = Planck's Constant) and in the atmosphere Iλ will slowly drop with the lapse rate (we can calculate it as just a 0.13% drop in 10m which is longer than the path length of 15-micron radiation at sea level, and a 50% drop by about 5,000m), and on until CO2 thins allowing the path-length to reach infinity with IR being shot out into space. (Note that Kirchoff's law differs from this situation solely because it applies to a constant temperature.) So to satisfy both the Schwartzschild equation (and Kirchoff's law), we need a new source of excited CO2 molecules to prevent the IR flux being snuffed out so quickly.
So, to set you a question CallItAsItIs with a numerical answer.
Given both Schwartzschild's equation and measurements show there is no extinction of 15-micron IR in the atmosphere, there must be some extra source of υ2-excited CO2 molecules. Therefore, how big is that extra source of excited CO2 relative to the IR as a source? Roughly?
(As a PhD-wielding engineer, this extra source ???→CO2→photon comes as no surprise to me.) - The planet is ‘on the brink of an irreversible climate disaster,’ scientists warn
wilddouglascounty at 10:27 AM on 8 November, 2024My issue is that we are missing the point when we are saying that climate change CAUSES anything. Specifically, good science has established the following causal links:
Fossil fuel emissions (FFE) > changed atmospheric chemistry > increased temperatures(IT).
FFE > IT > more frequent, severe droughts>more extreme wildfires
FFE > IT > more frequent, severe flooding caused by increased water in atmosphere
FFE > IT > poleward shift of species habitats
FFE > IT > increased glacial melt>sea level rise, exacerbated by expansion of water volume by it being warmer
FFE > IT > warmer oceans > coral bleaching, myriad other effects
FFE > increased acidification of oceans>plankton die-offs>myriad other effects
Where is the causal link to climate change? "Climate change" is an abstraction that has been reified to give it causal qualities that it doesn't have. This reified abstraction has been given false attribution qualities that properly belong to fossil fuel emissions.
People understand that anabolic steroids enhance performance of athletes, and injecting fossil fuel emissions into the air is juicing the atmospheric chemistry in exactly the same manner. Folks will understand this causal link in exactly the same way if we only use the term "climate change" as the OUTCOME of fossil fuel emissions, not the CAUSE of the changes that are taking place. That belongs to fossil fuel emissions.
- Climate Risk
Bob Loblaw at 00:58 AM on 5 November, 2024Paul @ 5, 7:
I wouldn't say that Curry has flipped - but I have to admit that I have not being paying a lot of attention to her and I have never had the impression that she has a coherent, logical, consistent position on much related to climate science. She would have to actually hold a position in order to be able to flip away from it. She has a history of broadcasting all sorts of whack-a-doodle stuff (calling it "interesting") - but in a way that she can deny she supported it (or opposed it) when the cards line up.
So, in that tweet, what the heck is she really claiming she has been saying for over a decade now? Only the contents of David Wallace-Wells' tweet, which says little? If you interpret his tweet as saying that there are other factors besides CO2 driving the current warming trend, and stopping CO2 emissions will have little effect, then maybe that fits her history of obfuscation and attacks on climate science as we know it. But is that what David Wallace-Wells really means?
We could try to find David Wallace-Wells' article at The Conversation. Not hard. It's here. Want more detail? The article at The Conversation links to the actual paper it is based on. It is here.
I have not read the paper in detail - it is moderately long and technical - but I can get the gist of it. It certainly does not support any argument that CO2 levels are less important than presented in the IPCC reports and positions. What the paper does seem to present is an argument (from model simulations) that the expected drop in CO2 levels after reaching net zero - due to fast parts of the carbon cycle continuing to remove CO2 - will be offset by other slow feedbacks in the climate system that will cause continued warming.
The paper uses the Australian Community Climate and Earth System Simulator Earth system model (ACCESS-ESM-1.5), which appears to include a number of slow-response feedbacks related to ice, ocean circulation, etc. (The paper provides references that explain that model in more detail, but the details are not apparent from a quick read of the current paper.)
So, the gist of this new paper seems to be that slow feedbacks often not included in many models will make things worse than expected, once net zero is reached. They also indicate that the longer we wait to reach net zero, the worse things will be.
This may fit into Curry's Uncertainty Monster scenario ("See, I told you there were things the models didn't get right!), but it is an uncertainty that will bite us in the posterior regions - not Curry's favoured "everything uncertain will fall to our benefit".
I would not be surprised if Curry hasn't actually read the paper (or maybe even the Conversation article), and just saw what she wanted to see in the tweet - without actually understanding it.
- 4 Hiroshima bombs worth of heat per second
MA Rodger at 21:14 PM on 9 October, 2024One Planet Only Forever @52,
The difference (4 bombs & 9 bombs) is indeed due to a different EEI numbers which are increasing with time. The OP uses 8Zj/y. The 1.12Wm^-2 quoted by philalethes @48 is 18Zj/y. But even that could be now out-of-date.
The actual EEI wobbles a lot and through 2019 12-month average CERES number is 1.30Wm^-2.
The quoted 'EEI (from 2019) = 1.12 W/m²' value presumably comes from Loeb et al (2021) 'Satellite and Ocean Data Reveal Marked Increase in Earth’s Heating Rate' which puts it as "1.12 ± 0.48 W m−2 in mid-2019," this based on a linear (OLS) fit through CERES data, a linear rise 2000-19 backed by the OHC data for the same period. The CERES linear fit gave a +0.05Wm^−2/year increase in EEI, the OHC +0.04Wm^−2/year, both with big error bars (making the results barely statistically significant at 2sd).
While we now have had a few more years of looking at EEI, the 2000-to-date OLS thro' the CERES data is still yielding the same basic result suggesting today a value of 1.37Wm^-2/y. But the point of such an analysis (which as a strict linear value would point to AGW starting only in 1995) is to work towards an attribution of the increasing EEI.
(The EEI numbers presented by the ClimateChangeTracker EEI page stretches back to 1985 when estimates of EEI were cooling due to volcanic eruptions (El Chichón 1982 & Pinatuba 1991). Within the wobbles, the latest 12-month average (to June 2024) is +0.95Wm^-2.)
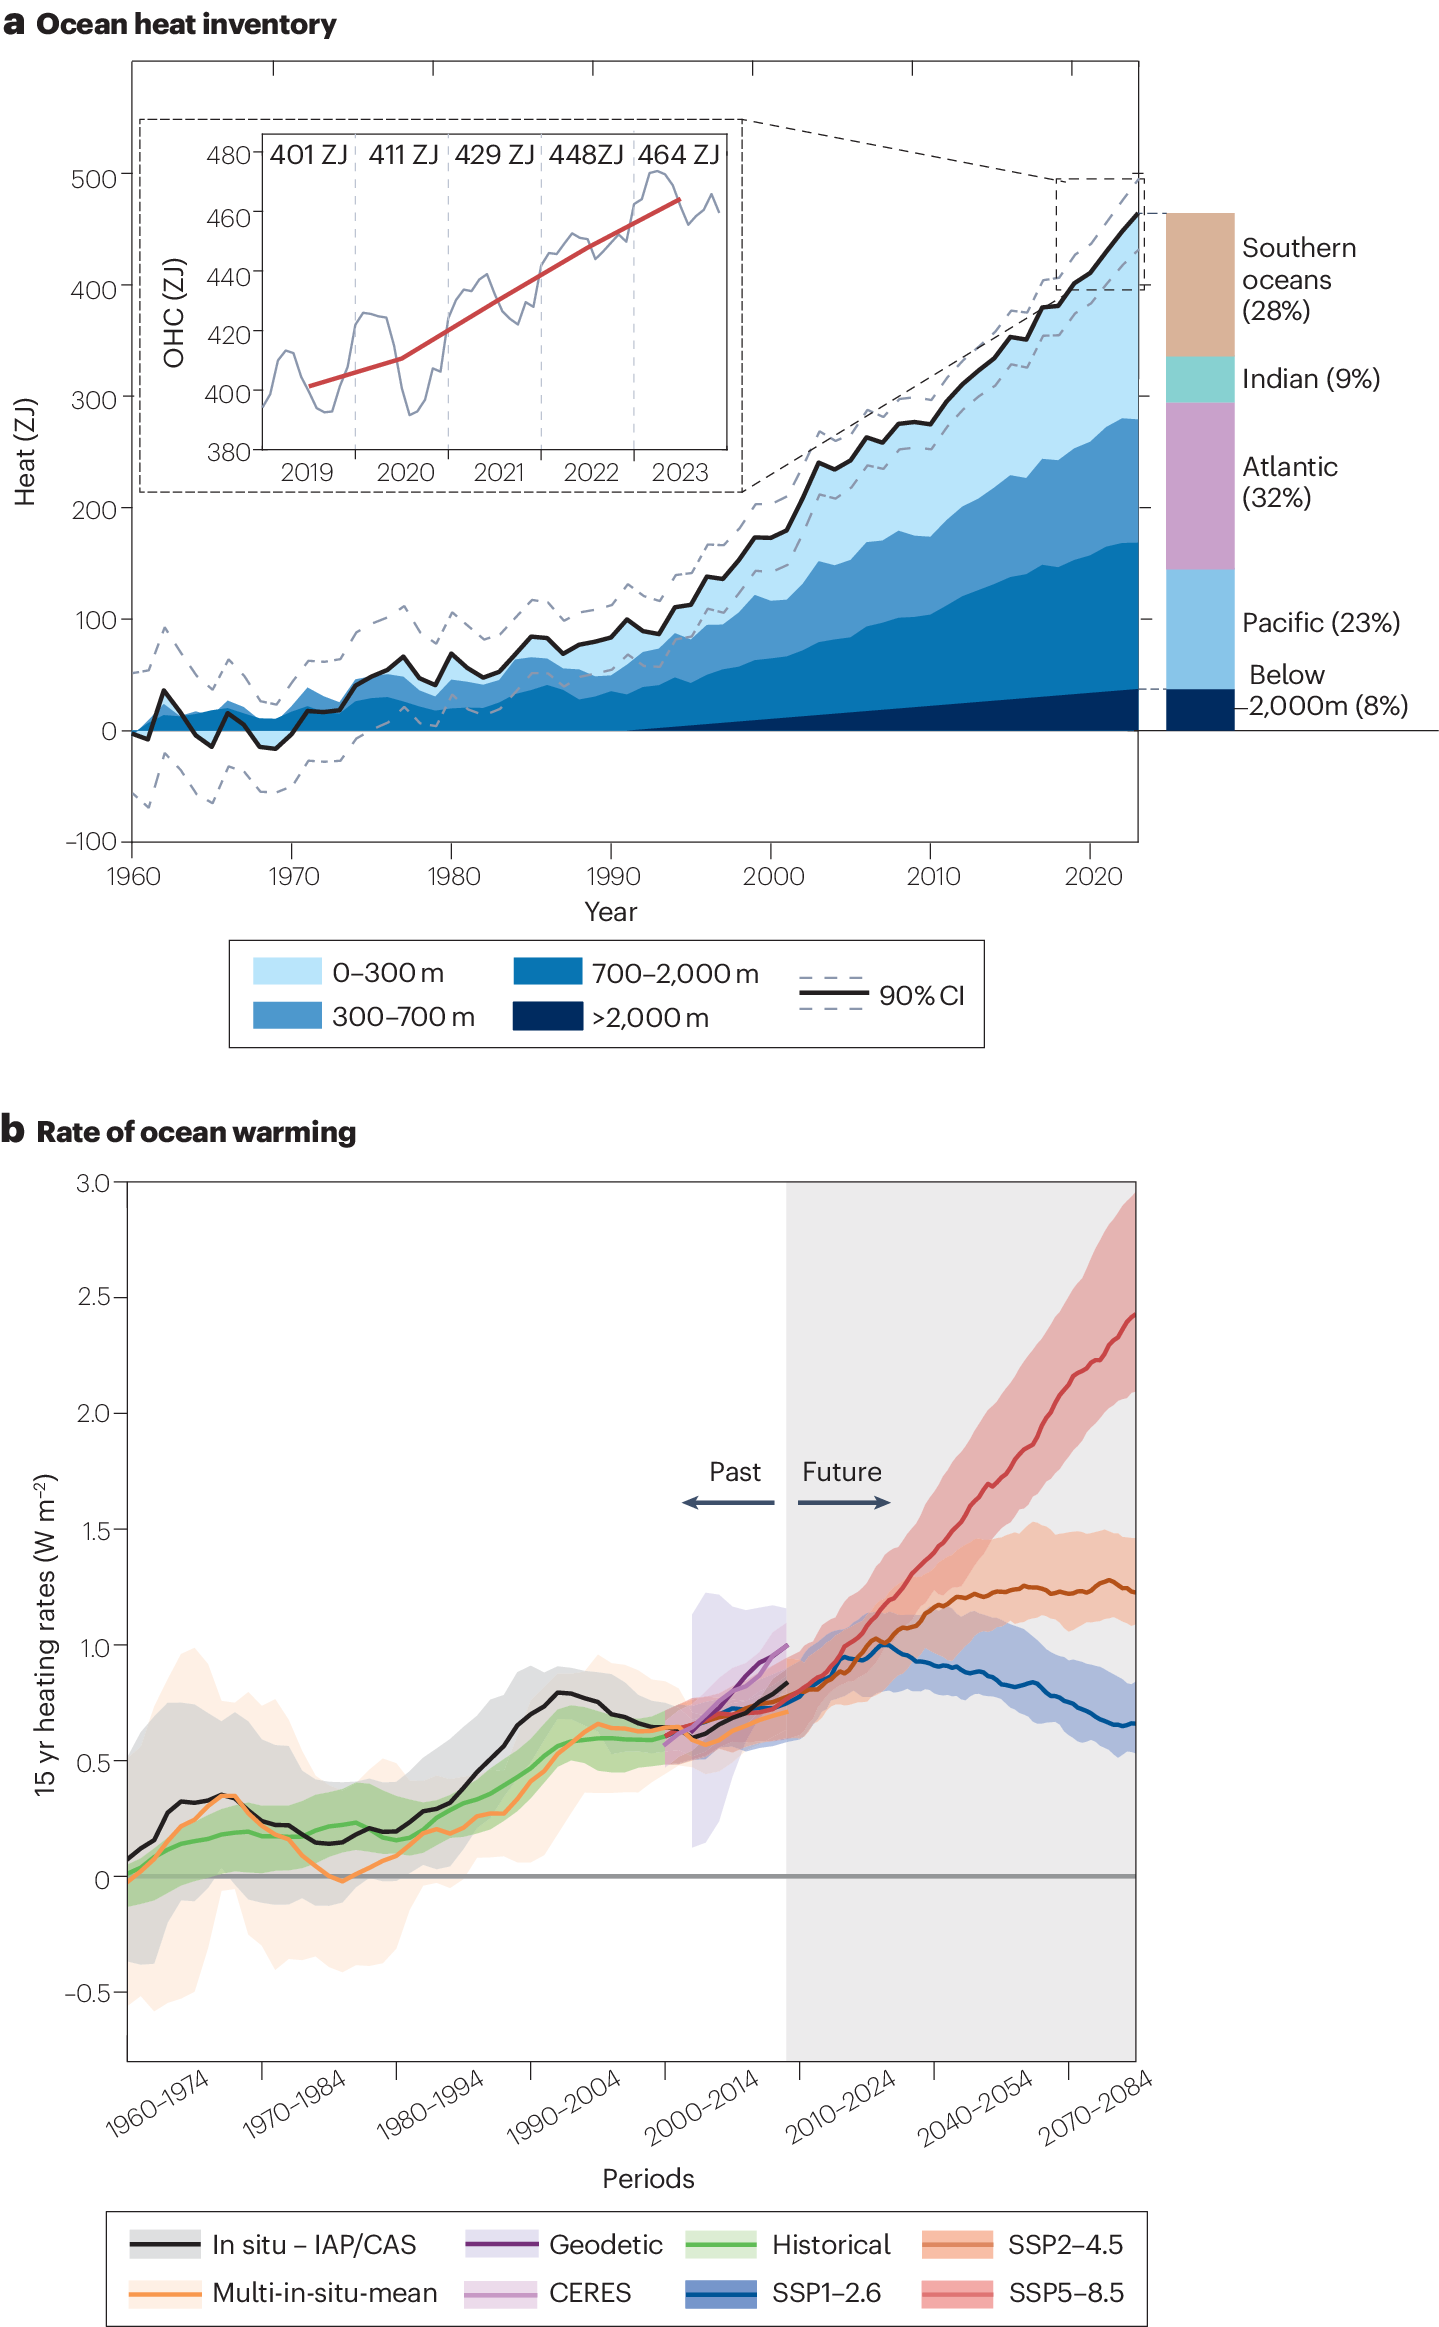
Reconciling CERES numbers with longer in-situ OHC data isn't entirely achieved with such OHC data significantly lower, although OHC calculated from sea level (geodetic) data gives a good match to CERES. The graphic below is from Cheng et al (2024). Note numbers in the insert in graph suggests 2020-23 OHC rising at 17.7Zj/y.
- Just have a think: Arctic Sea Ice minimum 2024. Three degrees Celsius warming now baked in?
Eclectic at 12:50 PM on 27 September, 2024Jim Hunt @2 ,
you were, two or three days ago, crossing swords with the amiable skeptics at WUWT blog, about Arctic ice.
It seems they feel that a sort-of flat-lining of minimum Arctic sea-ice extent during the past decade . . . is a disproof of the contemporary reduction in Arctic sea-ice volume . . . which in turn demonstrates that there will be no further ice melt as sea-level continues to rise ~ the ongoing rise which in turn disproves that global warming is occurring. (If I have understood their argument correctly.)
And since global warming is not continuing, despite rising measurements by worldwide thermometers, then the whole AGW thing is a hoax and can be ignored.
Or something like that.
And if Plan Denial eventually crumbles, then the WUWT skeptics will develop "concepts of a plan" to deal with the non-problem. [Please excuse contemporary 2024 political joke.]
- What should you do to prepare for the climate change storm?
One Planet Only Forever at 02:06 AM on 5 September, 2024Here is some additional information for TWFA, and others who have developed and share misunderstandiings like they have, to thoughtfully consider and respond to.
Today, NPR published the following report: “Coastal flooding is getting more common, even on sunny days”. It is a detailed evidence-based report about the current and future reality regarding the impacts of recent rapid sea level rise due to global warming caused by human activities on this planet. It includes the following quotes:
"The costs of high-tide flooding are enormous. Even a few inches of water can make neighborhoods inaccessible to some residents, including those who use wheelchairs or rely on strollers to transport young children. And standing water can also snarl commutes, block emergency vehicles and cause secondary flooding if sewers back up into buildings or overflow into natural bodies of water."
"Sea levels don’t rise at the same rate everywhere, and the effects of high-tide flooding are even more pronounced in places where sea levels are rising most rapidly, the report notes. In the last 25 years or so, the number of days with high-tide flooding has increased by a whopping 250% or more in many regions, including along the Gulf of Mexico, and in the Mid-Atlantic and the Pacific Islands."
"And there’s no reprieve in sight, as global temperatures continue to increase and sea levels continue to rise. The average number of annual high-tide flood days for the U.S. is expected to top 45 days by mid-century. Local governments in many coastal areas are racing to upgrade infrastructure to withstand salt water, improve sewers and drainage and budget for the costs of damage and disruption from high-tide flooding."
"While high-tide flood forecasts do not consider flooding from storms, the same sea level rise that is driving more sunny day floods also exacerbates coastal storm flooding, as residents of Florida, Georgia and South Carolina experienced following Hurricane Debby. The storm came ashore in Florida as a weak Category 1 hurricane and was quickly downgraded to a Tropical Storm, but storm surge and rain has nonetheless caused catastrophic flooding across the Southeast, in part because rising seas mean the ocean is closer to the built-up coastline."
- What should you do to prepare for the climate change storm?
scaddenp at 09:36 AM on 23 August, 2024Oceanfront is fine - if you are on hard rock a few metres above max high tide level. Beachfront - not so much. Soft sediment erodes easily in storm surges and of course, rising tide. TWFA - what data about sealevel rise happening right now are you disputing is true? What data is the basis for your predictions?
- What should you do to prepare for the climate change storm?
One Planet Only Forever at 08:40 AM on 23 August, 2024Nigelj @2 and Michael Sweet@3,
Thank you for researching and sharing the evidence that clearly contradicts TWFA’s poorly justified opinion that “in our lifetimes ... nobody will have abandoned ... their beachfront homes or estates due to climate”.
Based on a short time doing unbiased investigation and thoughtful consideration I offer the following additional evidence contradicting or weakening TWFA’s poorly justified opinions expressed @1:
- many island nations, like the Maldives, are already suffering destruction and forced escape/migration due to climate change impact induced sea level rise.
- The feet of the Statue of Liberty are more than 150 feet above current sea level ... so ... weird statement.
- The Battery Park City Authority is planning major costly mitigation actions (BPC NEW LOOK: STORM SURGE BLUES link here) to try to ensure that “Battery Park will still be there”. Those mitigation/adaptation actions are a costly distraction that would not have been needed if climate change impacts had been reduced sooner with a lower level of peak total impact like 1.0 C achieved. If those mitigation were not required then all that money/effort could have been expended to genuinely improve the future of Battery Park.
- The Obama homes at the Vineyard and Hawaii both appear to be situated high enough to not be at risk of storm surge damage “during our lifetimes” even if ‘our lifetime’ is the 100 year lifetime of a new born today, as long as global warming impacts are limited to 2.0 C. Of course, if ‘our’ is regarding humanity’s lifetime of potentially many millions of years then those homes are likely not high enough.
A final note: Warren Buffet’s actual statement and the context of it are well presented by Investopedia here. Not quite what TWFA opined.
- What should you do to prepare for the climate change storm?
michael sweet at 08:16 AM on 23 August, 2024I visited the outer banks in North Carolina 18 months ago. We stayed in a house on third Street. It was one and a half blocks to the beach. First Street and half of second street were gone.
This week this video was widely on mainstream news of another house there falling in the ocean. I saw a community on the Chesapeake Bay where the houses were uninsurable and a fishing island there is trying to get the feds to spend millions to prevent their island from washing away (a hopeless task).
I saw a video on YouTube of farmers in Vietnam who used to raise rice and now grow salt water fish and crabs. Another foot of sea level rise will overtop their levies and they will become refugees.
The lowest houses are beginning to be washed away world-wide. Insurance rates in Florida and other USA beach front are artificially held down by the government.
- What should you do to prepare for the climate change storm?
nigelj at 07:02 AM on 23 August, 2024Climate change could indeed make properties uninsurable and hard to sell. From stuff.co.nz:
"Homes on parts of New Zealand’s coast will begin losing access to affordable insurance within 15 years, according to a stark new report. Wellington will be hit first, and Christchurch hardest, but all four major cities will be affected, according to new research led by climate and insurance specialist Belinda Storey for the Deep South National Science Challenge.By 2050, at least 10,000 homes in our biggest cities will be effectively uninsurable, however spiking premiums and policy exclusions could start being felt as soon as a decade from now, it concluded."
"In Wellington, just 12cm of sea level rise could see average premiums more than quadruple for about 1700 homes, the report estimates – if insurers fully priced the increased risk into policies. At those levels, people may effectively find they have no insurance cover, said Storey."
Ten to fifteen years is not far away. So it may pay to research the risks in your area now, and sell well before you suddenly find insurance is unavailable. I would say that when insurance companies start increasing premiums to high levels, or refusing cover at any price it could also happen suddenly without much warning. Decision making ruminates away for a long period then reaches sudden tipping points like other things in life..
- 2024 now very likely to be warmest year on record
Eclectic at 09:35 AM on 31 July, 2024Michael Sweet @4 :
Tamino may well be correct about a statistically-valid acceleration of global warming. However, the time-span he uses is rather short ~ and he has not yet published a formal head-to-head statistical analysis of the discrepancy between the Tamino computational statistics versus the EE [Eclectic Eyecrometer]. The EE is renewably-powered by slide-rule.
Even today - years later - Tamino's claim of sea-level-rise acceleration is continually ruffling feathers at the WUWT Academy of Citizen Scientists.
My underlying point was that the commenter Killian (above) should not get excited by very short-term changes ~ and most especially when those changes involve data analysis in the absence of any clear-cut alteration in drivers of climate change.
- 2024 now very likely to be warmest year on record
Killian at 21:14 PM on 30 July, 2024I find the long-term climate thinking to be outdated. Changes are coming far faster than in the past and should be expected to continue to come even more quickly. A ten-year, twenty-year or thirty-year period to call a trend is now dangerously slow, IMO. Looking at the yearly graph above, I eyeballed pullbacks from extreme highs and they have not been large except after the 2016 El Nino - about .2 degrees. Otherwise, they have been more like 0.1 to 0.12 degrees. (Again, eyeballing here so don't @ me if these are a little off.)
This was a somewhat strong EN, but not massive. I would be surprised by a large reduction in temps after the massive gains of 2023/'24. In fact, given we are at +1.6-ish, the most we could expect would be a fall to 1.47 or so. It is unlikely even two years of falling temps would go below 1.35, and I think that very unlikely. From a risk standpoint it is best to assume the pullback, if any, will be no lower than about 1.45 and we will be permanently above 1.5C by 2027 or 2028.
To add to this, the ASI is looking like tissue paper right now. An August bad for retention (GAC's, a CAA/Siberia dipole, generally strong Pacific-to-Atlantic wind regime, high August insolation) will definitely see levels below 4.0 m sq km, and with n solid pack anywhere in the basin now, we'll likely see that, anyway. As per my EN/ASI hypothesis (since supported by research in 2018 and 2021), all this extra ocean heat is going to manifest as ASI lows, imo, making these high temp scenarios all the more likely.
Cheers
- Fact Brief - Does breathing contribute to CO2 buildup in the atmosphere?
One Planet Only Forever at 05:52 AM on 19 May, 2024Great brief rebuttal of the ridiculous belief that breathing contributes to increased CO2 levels in the atmosphere.
A minor nit-pick with a suggested better presentation added in italics:
The CO2 we breathe is part of a balanced carbon exchange between the air and the earth. In contrast, burning fossil fuels injects oxidized carbon, CO2, into the atmosphere that has been stored underground in hydrocarbon molecules for millions of years, causing a rapid buildup.
Tragically, the popularity of absurd beliefs requires efforts to 'change the minds' of people who are easily tempted to believe nonsense when the alternative is 'learning about the need to stop trying to benefit from being unjustifiably more harmful'.
The first Open Access Notable presented in "Skeptical Science New Research for Week #20 2024" - Publicly expressed climate scepticism is greatest in regions with high CO2 emissions, Pearson et al., Climatic Change - highlights that regions benefiting from high harmful CO2 impacts have higher percentages of the population willing to believe nonsense.
I live in Alberta so I was not surprised by the research results regarding climate skepticism ... and I am painfully aware that nonsense beliefs like 'breathing contributes to the CO2 problem' can be persistently popular among 'highly educated people' who have developed interests that conflict with being less harmful.
- The science isn't settled
Bob Loblaw at 00:51 AM on 11 May, 2024I agree with Eclectic that TWFA seems to be getting some rather bad information from dubious sources. Given that TWFA often seems to just jump to a different "talking point" when challenged on his interpretation or argument, it seems that he lacks understanding of exactly what point his snippets of information are supposed to represent.
As an example, after arguing about the features of the Jevrejeva sea level reconstruction, in comment 99 I pointed to a RealClimate post that shows the Jevrajeva methodology is suspect. In comment 100, TWFA did not make any attempt to justify the use of Jevrajeva - instead, he made a bogus general argument about trends and processing, and did a "Look! Squirrel!" about comparing 1600 with 1750. After I commented in #101, he continued with more Just Asking Questions.
I will attempt to respond to TWFA's comment 102 in two ways. First, to address his general question about past climates, what we know, and what does it tell us.
- The information we have about past climates is limited, and often requires use of proxies (geological records, tree rings, ice cores, etc.) That does not mean we "know nothing". though. In essence, the proxies are the result of past climates, rather than direct measurements of the temperature, precipitation, etc.
- By understanding the physics of climate (including physics of solar output, etc.), we can use the evidence we do have about past climates to determine what factors were playing a role at that time. And we can compare that to what we can directly measure about those factors now.
- ...and we see that the best explanation for current trends must include greenhouse gas changes (mostly CO2 from fossil fuel use) to get things anywhere close to right. Other factors were active in the past to a sufficient degree to cause changes we see in the past - but they are not sufficient now to cause the changes we are seeing now.
- To directly respond to TWFA's "I don't understand how what is now deemed to be abnormal can be so determined if prior normal cannot be",
- We can determine what "prior normal" was - at least to some limited extent. But that limited extent contains a range of uncertainty due to our limited information. (Even today, we have limits on what is measured.)
- When we interpret our evidence of the past, we have to include that uncertainty range. Hence Eclectic's question in comment 98: the broad mauve band versus the smooth calculated curve in the graphs that were being discussed.
The second approach I'll take is by analogy. A thought experiment.
- Let's assume I am on trial for stealing money from TWFA's bank account.
- The prosecution has shown evidence of an electronic transfer of $10k from his account to mine on a particular date last month, and evidence that this transfer was initiated for a login from my IP address. At the time, TWFA was on vacation in central Africa, with no internet access.
- I have presented evidence that TWFA's bank account balance in the past has gone up and down by thousands of dollars from month to month. I do not have information about individual transfers in the past, but I do have evidence of TWFA's approximate income and typical monthly expenses.
- I argue that this past range of bank balances raises doubt that I stole the money. How can we be sure that some expense that existed in the past did not cause the removal of $10k?
- On cross, the prosecution presents detailed records that show each transaction for the past year (when detailed records are available). None of the historical expenses that cause $10k changes in the older historical bank balances were happening during the period I am accused of stealing money. They again point out that the current detailed records include a transfer to my account.
- The judge ends up saying "it's settled - guilty as charged".
Climate scientists have spent a lot of time looking at past climates, using the available (albeit limited) evidence. We've spent time to understand the physics, analyze the data, and determine the range of effects that have caused past climate changes. And now we've looked in detail at the role of CO2, and we are observing the effects of increased CO2 that are in broad agreement with theory.
There are things we still want to learn (always), but the fact that CO2 is a greenhouse gas, has caused most (if not all) the warming in the recent past, and will continue to cause warming in the future is settled science.
- The science isn't settled
Bob Loblaw at 22:15 PM on 9 May, 2024It probably comes as no surprise that TWFA is relying on the Jevrejeva sea level reconstruction. It is probably the least reliable one, and a 2013 post at RealClimate discussing the state of knowledge of sea level rise has provided detailed discussion of the methodology and its problems.
Two paragraphs from that RealClimate post:
The one curve that does not show an unprecedented recent rate in Gregory et al. is the data of Jevrejeva et al. (2008). That contrasts with our treatment of the same data in Rahmstorf et al. 2011 (Fig. 5), where we applied a stronger and more sophisticated smoothing (as compared to the running average used by Gregory et al) which lowers the temporary high peak in the rate around 1950. This peak is not found in any of the other data sets, and as shown in Fig. 2 above, it makes the Jevrejeva data run outside the grey range found by combining all contributions.
I think this peak is spurious and results from the fact that the data of Jevrejeva et al. cannot be considered an estimate of global-mean sea level on such relatively short time scales (a couple of decades). For example, in this data set the North Atlantic data (including Arctic and Mediterranean, overall 16.6% of the global ocean area) provide 31% of the global average and are weighted four times as strongly as the Indian Ocean, although the latter is larger (19.5% of the global ocean). The Northern Hemisphere is weighted more strongly than the Southern Hemisphere, although the latter has a greater ocean surface area. (For more on the Jevrejeva weighting scheme, see our reader’s exercise below.) That is not to say that other tide-gauge based estimates guarantee a properly area-weighted global sea-level history, but it means that Jevrejeva et al. are guaranteed to not represent an area-weighted global mean, while e.g. Church and White (2006, 2011) are making a decent attempt at representing a global mean.
Follow down that RealClimate post to the section titled "A reader’s exercise: the “virtual station method” of Jevrejeva et al" for further details.
Perhaps TWFA will illuminate us on why he prefers that Jevrejeva analysis, but I won't hold my breath.
- The science isn't settled
Eclectic at 16:36 PM on 9 May, 2024TWFA @90 (and others) :
Yes, the two graphs are somewhat different ~ and they both contradict your claims. (How do you disbelieve your own eyes?)
Your Jevrejeva Figure 1 shows not only a great deal of jagged variation in the main black line (which is quite to be expected in averaged measurements at different dates) . . . but also shows the broad mauve bands above & below the averaged measurements in the pre-1850 region.
TWFA, what do you suppose that very broad mauve band means? ~ For one thing, it means that the smooth calculated curve is merely a convenient approximate fit. Also, that the smooth curve is not imposed by Divine Will upon that wiggly graph in order to show TWFA a 5mm sea level fall (& rise) between 1700 and 1800.
TWFA, in this thread please do not raise all that Conspiracy Theory stuff ~ it is difficult to have an intelligent discussion about real things, if you choose instead to wander off into Conspiracy Crazy Land.
The phase out of Fossil Fuels is not (and cannot) be carried out "overnight". It is looking like it will take maybe 40 years or more ~ and so your precious plastic shopping bags will be available for quite some time yet. No need for alarm or panic.
- The science isn't settled
Eclectic at 14:16 PM on 9 May, 2024TWFA @90 (etcetera) :-
Your second graph clearly does not support your claim in @88 that: "...sea levels began to rise in 1750, when James Watt was twelve years old..." Indeed that graph shows sea level falling until about 1860 (when James Watt had been dead forty years).
And your first graph ( Jevrejeva; Figure 1 ) shows no support for your wild claim, whatsoever. Please consult your optometrist, urgently.
TWFA, it appears you are regurgitating some wild claims from some third-party source. Where is that source ~ and how did they get it all so very wrong?
- The science isn't settled
Eclectic at 12:58 PM on 9 May, 2024TWFA @88 ,
The paper Jevrejeva et al., 2008 does not support your wild claims.
Did you actually read that paper? It appears you did not look at Figure 1, and it appears you did not look at Figure 3.
Nor does it appear that you read or understood the Conclusion of Jevrejeva ~ which states in its final sentence :- "However, oceanic thermal inertia and rising Greenland melt rates imply that even if projected temperatures rise more slowly than the IPCC scenarios suggest, sea level will very likely rise faster than the IPCC projections [Meehl et al., 2007]"
TWFA ~ where do you get your strange ideas from?
- The science isn't settled
TWFA at 11:59 AM on 9 May, 2024Come on, 2 buckets a day is 730 a year, and now you're bitching that it's a thousand a year instead, like that changes anything, it's all within an order of magnitude of my first 365 estimate, why didn't you just go right to 100,000 a century for greater effect?
The point is we KNOW such methods work and have been effective, not just on the coast, but improved insulation, hydroponics and gee, maybe agriculture will come back in thenorthern climes.
The Venetians have been dealing with rising water since the 5th century, on the other hand we only have an alleged 97% certainty that by adjusting the atmospheric content of CO2 up or down by a fiftieth of a percent from the four tenths of a percent it is now that we can control the temperature of the entire planet and avoid having to buldoze all that sand.
Besides, according to the Jevregeva data in '08 and refined in '14 the sea levels stopped receding and began to rise in 1750, when James Watt was twelve years old and over a century before our emissions were even measurable, see Fig. 1
Jevrejeva '08 - The science isn't settled
Eclectic at 11:15 AM on 9 May, 2024TWFA @85 ,
the Obamas' expensive mansions have something like 10 feet (or more) of elevation . . . and judging by expected sea-level rise, the Obama grandchildren may well need to sell (or abandon) the mansions when they themselves reach the age of 100 years or thereabouts. Yes, it's a sad problem when super-rich families have to move house ;-) And perhaps you could spare some thoughts & concerns for the poorer folks who live on the coastlines of the world?
TWFA . . . please use more mathematics, and less sour grapes.
- The science isn't settled
scaddenp at 07:40 AM on 9 May, 2024"a five gallon bucket of sand tossed upon your acre of oceanfront property every day will keep up with 8" of sea level rise over the next century."
I think that example is problematic.
8" = 200mm -> 2mm per year. Global sealevel rate is currently 3.4mm and accelerating.
Check your maths on the 5gal of sand. I make that 19L or 19,000 cubic cms. 1 acre = 40470000 cm2 19,000/40470000 isnt remotely keeping up with 2mm/year of sealevel. Out of curiousity, where did you find this statement about the 5gal bucket? Sounds like a source bent on misinformation.
Where do you get your sand? At a sustained 4mm/year of sealevel rise, your beachs vanish.
Sand or any other easily mined material is also highly erodable - without an expensive seawall, wave action will take it away.
And finally, the real point. Adaption is not free. It costs to make those changes. Why are you so confident that adaption is cheaper than just converting energy sources to renewables, especially as renewables+storage has better LCOE than FF?
- The science isn't settled
TWFA at 03:52 AM on 9 May, 2024I still get hung up on the plane example, not sure anybody is framing it correctly.
If you consider the plane to be built upon an aeronautical theory of AGW and is predicted with 97% certainty by those who designed it to be airworthy and get you to your destination, which would be surviving changes in the climate by preventing them altogether using a human controlled CO2 thermostat to control the temperature of the verses planet... verses choosing an alternative, far more pedestrian and proved means of transportation to climate survival that has worked for thousands of years, namely innovation, adaption and migration, which would you choose?
For example, a five gallon bucket of sand tossed upon your acre of oceanfront property every day will keep up with 8" of sea level rise over the next century.
- At a glance - Is the CO2 effect saturated?
Bob Loblaw at 23:43 PM on 23 April, 2024Theo:
Taking a quick look at that paper, I see it refers to Angstrom's work in 1900 to support their "saturation" argument. This is already discussed in the Advanced tab of the detailed "Is the CO2 effect saturated?" post that this at-a-glance introduces. Short version - we've learned a few things since Angstrom wrote his paper in 1900.
Searching the recent paper for "saturation", it seems that they are using the typical fake skeptic approach that applies the Beer-Lambert law (which is exponential in nature, and a standard part of radiation transfer theory) to the atmosphere as a whole. That is - they look at whether or not IR radiation can make it through the atmosphere in a single pass.
To nobody's surprise, this turns out to not be the case - IR radiation in the bands absorbed by CO2 rarely makes it directly from the earth's surface to space. The energy in the photons needs to go through a series of absorption/re-emission cycles as it gradually works its way up through the atmosphere. When these processes are included in the calculations, it turns out that this particular flavour of the "saturation" argument falls flat on its face, and adding more CO2 (compared to our current levels) does indeed have an effect.
Executive Summary: the authors of that paper have no idea how the greenhouse effect works, as Eclectic has stated.
Read the full rebuttal here for more discussion - and the details of the Beer-Lambert Law are also discussed in this SkS blog post.
Elsevier is usually considered a reputable publisher, but they screwed up on this one. The rapid passage from "received" to "accepted" is indeed a red flag. The journal - Applications in Engineering Science - is clearly an off-topic journal for this paper. On the page I link to, it mentions "time to first decision" as 42 days, and "review time" of 94 days. If you click on "View all insights", you get to this page that also gives "Submission to acceptance" as 77 days, and "acceptance to publication" as five days. The seven days for this paper (from "received" to "accepted") is, shall we say, a bit shorter than usual?
It is worth noting that several other papers in the same issue also have very short times between "received" and "accepted". Of the four I looked at, none of them had any indication that the authors were asked to revise anything, which is rather unusual. Someone at that journal is in a rush.
(If you click on "What do these dates mean?", below the title/author section of the web page for the appear, it specifically states that "received" is the date of the original submission, and they will say "revised" if a more recent version is submitted - e.g. after review.)
- How extreme was the Earth's temperature in 2023
nigelj at 07:08 AM on 18 April, 2024Some explanations for the unusual global warming levels in 2023:
James Hansen thinks the anomalously high global surface temperature in 2023 are due to AGW + El Nino + Aerosols reductions. I can't find the related commentary, and have to go by memory, but Hansen suggests that the quite abrupt reductions in shipping aerosols in 2023 added to reductions in industrial aerosols over the last ten years warmed the oceans and this energy comes out after a time delay and it all came out in 2023. Perhaps someone has the details of his suggestion and comments on its credibility.
El ninos release ocean heat that has been building up. I note that the high sea surface temperatures are in the northern oceans are away from the centre of el nino activity.
From NASA: Five Factors to Explain the Record Heat in 2023. But what caused 2023, especially the second half of it, to be so hot? Scientists asked themselves this same question. Here is a breakdown of primary factors that scientists considered to explain the record-breaking heat ( I have cut and pasted the key statements only):
The long-term rise in greenhouse gases is the primary driver.
The return of El Niño added to the heat.
Globally, long-term ocean warming and hotter-than-normal sea surface temperatures played a part.
Aerosols are decreasing, so they are no longer slowing the rise in temperatures.
Scientists found that the Hunga Tonga-Hunga Ha‘apai volcanic eruption did not substantially add to the record heat.
earthobservatory.nasa.gov/images/152313/five-factors-to-explain-the-record-heat-in-2023
From PBS News: ‘We’re frankly astonished.’ Why 2023’s record-breaking heat surprised scientists. A range of factors including general warming due to human-caused climate change, the El Niño climate pattern, record-low Antarctic sea ice and others — contributed to 2023’s record-breaking heat, but they don’t tell the full story. Schmidt said more work has to be done to fully understand why the year was so hot.
“In 2024, we’ll be seeing whether this persists or whether it kind of goes back to a normal pattern,” he said. “And that will be kind of telling as to whether 2023 was just a very unusual combination of things that all added up to what we saw, or whether there’s something systematically different going forward.” (Seems like good comments to me)
From Copernicus:
Some alternative suggestions on 2023 warming including changes in regional wind patterns over the northern parts of the oceans bringing heat to the surface:
atmosphere.copernicus.eu/aerosols-are-so2-emissions-reductions-contributing-global-warming
(This is not a reference to el nino, but to other changes in wind patterns to the north. For me it raises the question of caused the changes in wind patterns)
Clearly there is no definitive answer yet on why 2023 was so unusually warm ( ditto 2024 thus far). As scientists say next years data will help illuminate the causes.
- A data scientist’s case for ‘cautious optimism’ about climate change
nigelj at 05:10 AM on 4 April, 2024William @ 38
"At what point - would you start to not trust a climate alarmist - if deaths continue to fall or not rise for another 40 years - would you think maybe we should not trust those who make these predictions and fuel the narrative. Or do they just get a forever pass - and you will always accept more predictions - even though the people and movements who made them before have always been wrong."
Scientists are making the best predictions and projections they can. The best evidence they have says heatwaves have already become significantly more frequent and intense (refer last IPCC report), and that this situation will get worse over time particularly as warming gets above 2 degrees C. I see no reason to doubt them. The predictions are rational, logical and evidence based. I am a sceptical sort of person but Im not a fool who thinks all predictions should be ignored or that everything is fake or a conspiracy.
Scientists generally predict heatwave mortality will increase and be greater than reducing deaths in winter due to warmer winters, as per the reference I posted @34. What scientists cannot possibly predict is what advances there might be in healthcare and technology that might keep the mortality rate low. All we know is there will likely be further improvements in healthcare and technology, but quantifying them is impossible and it would be foolish to assume there will be massive improvements. We have to follow the precautionary principle that things could be quite bad.
If warming over the next 20 years causes less harm than predicted mitigation policies can be adjusted accordingly. This is far better than just making wild assumptions that global warming would be a fizzer.
Please appreciate that contrary to your comments elsewhere, multiple climate predictions have proven to be correct. Just a few examples:
theconversation.com/20-years-on-climate-change-projections-have-come-true-11245
www.politifact.com/factchecks/2022/oct/25/charlie-kirk/many-climate-predictions-do-come-true
"I think people just want to believe things will be terrible and there are primed believe end of days narratives."
Some people yes. Other people think things will always be fine. Both are delusional views. I would suggest the vast majority of people between those extremes have a more rational, nuanced view and that they look at the overall evidence. Polling by Pew Research does show the majority of people globally accept humans are warming the climate and we need to mitigate the problem.
"Yes - anything could happen in the future and deaths and damage levels could rise again- but it is nor healthy to ignore the present - or trust people that wilfully distort it."
I'm not ignoring the present or past. The mortality rate from disasters has mostly fallen over the last 100 years and that looks like robust data. I didn't dispute this above. I dont recal anyone disputing it. However you cant assume that trend will always be the case. The climate projections show deadly heatwaves are very likely to become very frequent and over widespread areas, and so obviously there is a significant risk the mortality rate will go up.
It's almost completely certain that at the very least considerably increased resources will have to go into healthcare, air conditioning, adaptation, etc,etc. This means fewer resources available for other things we want to achieve in life. Once again its not all about the mortality rate per se. So when I look at the big picture there is a strong case to stop greenhouse gas emissions and transition to a new zero carbon energy grid.
- A data scientist’s case for ‘cautious optimism’ about climate change
michael sweet at 23:01 PM on 2 April, 2024William,
Once you build the wind and solar generators you don't have to buy fuel to run them every day so they are cheaper than fossil fuels. You continue to only measure the cost of the renewable side. Who cares if it costs L1.4 trl to build out renewables if the cost of fuel is L3 trl? The article I linked included storage for enough power so that there would be no shortages, you just didn't read it. Fossil or nuclear backup are not necessary.
I remember 10 years ago the IPCC report suggested that Global Warming would eventually cause sea level rise that endangered houses near the sea, wildfires and droughts that caused massive relocations of people. I wondered if I would see these damages in my lifetime. I expected to live about 25 years.
We see all these things happening now, only 10 years later. They are no longer future projections. Wildfires are destroying entire towns and massive amounts of forrest. Unprecedented droughts and floods are making it harder for farmers to turn a profit. Millions of climate refugees are already trying to access the Global North because they can no longer make a living due to climate change. The damages we currently see are much, much higher than scientists projected only 10 years ago. 40 years ago they thought the great ice sheets would take thousands of years to melt as much as they have already melted now. No-one thought that all the coral reefs worldwide would be dying off as we see today.
We do not need to wait 40 years to see these problems. You are blind to what is happening before your eyes.
- A data scientist’s case for ‘cautious optimism’ about climate change
Eclectic at 21:32 PM on 2 April, 2024William @4 , @5 :
William, you are again failing to think logically.
The people of the Global North are fairly well accustomed to deal with the cold. ( Even in harsh Greenland during the Medieval Warm Period, the farmers kept their cattle in the barn for 5 months of the year. Later, a 0.5 degreeC temperature cooling did not cause their societal collapse ~ that collapse was due to socio-economic changes.)
The coming problems of further global warming do affect the people of the impoverished "South". The poor cannot afford house airconditioning ~ even if the national electricity prices were halved. And airconditioned barns . . . are a fantasy. Like the idea of solar panels for barn coolers. And most of the poorest are a long, long way from (expensive) transmission lines.
Yes, agricultural scientists have done some good work in breeding for more heat-resistant staple crops. But nature imposes genetic limits, and there is no Get-Out-Of-Jail-Free card to ultimately save the day.
And the increasing sea level rise will also contribute to mass migrations. Think of "border crises" and demagogues ranting against them thar furriners. It will get a lot uglier than now.
William, you are intelligent enough to know all this. Please put aside your Motivated Reasoning, and skip past all the Denial, Anger, and Bargaining (and the Depression stage, too) . . . and move on to the Acceptance that real action needs to be taken against AGW.
- A data scientist’s case for ‘cautious optimism’ about climate change
William24205 at 19:51 PM on 2 April, 2024Eclectic 3,
Yes there are and most ;likley will be more heatwaves - but there are also fewer cold waves. Cold kills more than heat, so there has been a net reduction in direct weather deaths. Ignoring the ( larger number ) of cold deaths averted is similar to an anti vaxxer only focussing on the side effects of vaccines.
There is relatively quite a lot of time to deal with rising sea levels should it be needed .
I am not dismissing everything you say , climate change could of course become a significant problem - but it could not. My concern is : a lot of people one side of the debate , will never recognise it is not the problem they say it is.
Deaths from weather related disaster could be 9.99995% down - and it would make no difference . they will always say - but in the future....they might rise. saying something could happen in the future is of course unfalsifiable.
We should recognise that over the last 40 years - a lot/most/all of the doomsday predictions have not occurred. Crop yields have improved, disasters deaths are down, direct weather deaths are down.
How many years more of benign outcomes would it take for you or others to change their mind - or at least consider the crisis was overhyped.
I am open minded , I think we should take precautionary action - but for the most part it should be of dual benefit, cutting pollution at the same time - and also a cost benefit analysis and feasibility study should be done. Net Zero is an arbitrary target - that does not take anything else into account. Governments will not achieve it , because it is too expensive and the people will not put up with the economic pain it could bring.
- A data scientist’s case for ‘cautious optimism’ about climate change
michael sweet at 08:11 AM on 2 April, 2024The cost benefit has been done. It has been determined that if we switch to all renewable energy it will cost much less for energy than if we continue using fossil fuels. The linked article finds for the USA that renewable energy will cost $993 billion per year in 2050 while fossiil fuels will cost $2,513 billion per year for energy alone. When you add in the health costs (millions of people die every from fossil pollution) and the climate costs the fossil energy costs $6,791 billion per year while renewable costs are unchanged. The question is why do you want people to spend so much more for fossil energy when it costs 7 times the renewable energy cost and so many people die every year from the pollution?
The IEA reports that in 2022 83% of all new buiild power in the world was renewable energy (primarily wind and solar). These generating stations are being built because they are the cheapest power in the world. Since both wind and solar get cheaper every year, you are advocating spending much more money on more expensive fossil power.
These homeowners in Massachusetts wasted $600,000 building sand dunes to protect their homes from sea level rise. There are trillions of dollars of homes in the USA alone that are threatened with distruction from sea level rise alone. When you add in the stronger hurricanes and other storms, drought starving South Africa and other places and unprecedented firestorms worldwide already causing trillions of dollars of damage and you want to just let it get worse instead of trying to staunch the bleeding? Talk about penny wise and pound foolish!!
From Politico today:
Property insurers see escalating losses from climate disasters
Wildfires, floods, droughts and other "secondary perils" are becoming more frequent — and costing insurers more money.
I guess you don't read the newspaper.
I note that peak oil is near. The USA fracking craze is ending. The best plays have all been tapped out and the older wells are rapidly slowing down. All the easy, quality coal has been mined. In 20 years there will not be enough fossil energy for the world even if we drill baby drill. How old are you that you think you don't require renewable energy which will be around forever instead of fossil fuels which are already running out.
- Just how ‘Sapiens’ in the world of high CO2 concentrations?
res01 at 02:45 AM on 30 March, 2024Skeptical Science Team, Eclectic @42, et. al,
Recent paper by P. Bierwith (2024)* notes, "There is now substantial evidence that permenant exposure to CO2 levels in the future will have significant effects on humans." The article goes on to summarize recent findings; all of which generally support the subject article here. I find though the article does contain a few "technical errors" as it was written with the knowledge as it was best known a few years back, it is in no way unnecessarily "alarmist." The problem I believe is that to some the subject itself is "alarmist", and in truth it should be.
To address Eclectic's concern a bit more succinctly; the human body's CO2 compensary mechanisms have been considered in the papers being questioned. Basically, though the body can compensate for very high levels of CO2 for short periods of time, eventually these mechanisms will "give out" over time as one is continually immersed in even mildly elevated levels of CO2; the effect becoming noticeable around 800-1200 ppm. The general effects are bone dimeneralization, calcification of soft tissues, and neurological agitation which will give rise to a range malidies not favorable for human health and well being.
*P. Bierwith, (2024), "Long-term carbon dioxide toxicty and climate change: a critical unapprehended risk for human health. Australian National University. https://www.researchgate.net/publication/311844520_Long-term_carbon_dioxide_toxicity_and_climate_change_a_critical_unapprehended_risk_for_human_health
- Climate - the Movie: a hot mess of (c)old myths!
Eclectic at 10:31 AM on 29 March, 2024Steveeeej @36 :-
Hmm, you have three questions, not just a couple.
Eh, that sounds like I am qualified to answer you, on math alone ;-)
And I would reply a tad differently from John Mason @37.
Seriously though (and answering in reverse order) . . . .
"What is the goal?" Er . . . you don't say what you mean by that. I'm guessing you mean the goal of achieving a better world than it would be after rising to 2 or 3 degrees (Celsius) hotter than the present. That hot world would have much more of heat waves /droughts /floods /and sea level rise . . . and salinization of a big bunch of fertile farmland . . . and consequently have hundreds of millions of desperate migrants seeking other countries to live in. ~That might be tolerable for Texas . . . but most of the rest of the world would find it all a bit troublesome. And expensive.
"How much money would ....?" Again, I'm guessing you mean the cost of fixing most of the warming now (i.e. by say 2060 or 2070?) versus the cost of letting things rip as per "business as usual". Were you thinking the cost in dollars, or the cost in human misery & massive social disruption? Or both? Some rich people only think of cost in the $ today, rather than total/long-term. Strangely, they call themselves "Realists".
"Was there ever a period in the earth's llfe span when the climate wasn't changing?" Er, what is the relevance of your question? #When you are holding your hand of cards at poker, do you decide how to play your cards according to the hand you are holding right now ~ or do you play your cards according to a hand of cards you held yesterday evening?
- CO2 lags temperature
RBurr at 08:51 AM on 15 March, 2024The analogy was cute, that the observation that CO2 rises lag temperature rises, means that the Temp rise causes the CO2 rise, is a bit like saying that chickens do not lay eggs because they have been observed to hatch from them. I would submit that, by the same token, opining that CO2 increases cause global warming is a bit like saying that chickens to not hatch from eggs, because they they’ve been observed to lay them.
This all suggests (as inferred) a co-dependent process.
However, this overlooks the same thing that MOST public blogs overlook, and that is the quantum mechanical mechanism on IR radiation (per greenhouse warming theory) has never been proven, and is actually false. New research indicates the fundamental error in the theory, presumes that Heat is ADDITIVE (eg. The Earth’s energy ‘budget’). The quantum process for Thermal transference is not additive. It is a function of frequency resonance. This is why microwave ovens work. Solar heating occurs because the spectrum of frequencies included in sunlight (which reaches the Earth’s surface) sets the maximum temperature which the recipient object may reach. An object in an oven set to 400 degrees will never reach 500 degrees no longer how long it is in the oven, because heat transference is not additive over time. The low energy IR waves received by CO2 molecules will naturally dissipate into the atmosphere with negligible net effect upon the atmosphere, but will never cause planetary ‘heating’ because, per thermodynamic law, no object can heat something beyond the temperature it possesses. Irradiated CO2 molecules can never heat the earth beyond the temperature frequency that already exists within the earth, which generated the IR light waves to begin with. IR Radiation does not raise the temperature of the Earth. The greenhouse warming theory is flawed. THAT is why the universally accepted historical record shows zero correlation between atmospheric CO2 levels and average temperature over the entirety of the past 4 Billion years. Zeroing in on the last 400k or 800k years, and pointing to an anomaly amounts to cherry picking, which disregards the other dynamics in play, such as Milankovitch Cycles. Note: Ozone depletion CAN increase surface temperatures because the range of UV frequencies that reach the surface is expanded. - Is Nuclear Energy the Answer?
John ONeill at 07:32 AM on 24 February, 2024'Nuclear is not economic' - the 17 countries building new nuclear missed your memo.
'..takes too long to build..' Mean construction time was 7.5 years, with a long tail. Countries involved in a concerted buildout do rather better - Japan averaged less than 5 years, China and South Korea less than 6. Sheffield Forgemasters, one of the few companies qualified to make reactor pressure vessels, has just demonstrated a new method of ion beam welding, letting them weld around the girth of an RPV ring in one day. This weld, on a 4 metre diameter, 200 mm thick piece, with very tight inspection requirements, would normally take up to a year. RPVs have been one of the bottlenecks for nuclear growth. Other solutions, such as the heavy water reactors used in India, don't have RPVs.
'..there is not enough uranium.' This was the perceived reality when the industry was just starting up - and when Cold War bomb-making led to a frantic search for uranium reserves, since enriching to 90% U235 bomb-grade uses up far more feedstock than does the 3-5% used in light-water reactors, or the natural uranium used in mainly Canadian and Indian heavy water reactors. At the time, it was also assumed that energy demand would keep growing at 1960s rates, and that most of the growth would be from nuclear. L Ron Hubbard's famous graph of human energy use rising sharply from a low base, as fossil fuel reserves are used up, and dropping equally sharply back to pre-industrial levels, was used by Peak Oil doomers to predict a coming crash, to be followed by unending scarcity. In fact, Hubbard original graph showed nuclear growing as fast as fossil fuel energy, completely replacing it, and then maintaining that level indefinitely. Plans were in place to switch to fast reactors, converting the 99.3% U238 of natural uranium to fissile plutonium, and to use thorium, 3x more abundant again, as fissile U233. This effort stalled when demand fell, and uranium proved to be much more abundant than thought. Until recently, global production has been well below demand, due to oversupply causing very low prices. Many high grade mines, like MacArthur River in Saskatchewan, were closed during the drop in demand after Fukushima, with the word's third and fourth largest users, Japan and Germany, temporarily shutting their whole industries. With demand now booming, these mines are reopening, and new prospecting has resumed. (Many nuclear operators are on long-term contracts, and have existing stocks, so are not immediately affected.)
Hubbard's fossil peak has been slower to arrive than expected, and so has the nuclear growth he expected to replace it. Long term though, I expect his insight to be accurate. The drive for increasing energy use is still there - nobody wants to stay poor (religious orders aside). The down-ramp on fossil use will be steeper than the rise, as climate concerns spread. Can weather-based energy fill the gap? Not judging by the view out my window (mid summer, 8/8ths cloud cover, national wind fleet at 1/3 of capacity).
I've read some of Mark Jacobson's papers - all the way back to his cover article on Scientific American, in 2009. Before him, there was Amory Lovins' vision of a 'soft path' energy future, very influential on Jimmy Carter's policy. The two were actually diametrically opposite in their prescriptions. Lovins decried the cost and energy waste of the transmission grid, calling for efficiency ('negawatts'), small-scale, local wind and solar, backed by fluidised bed coal. Jacobson wants a maximal grid, moving greatly overbuilt wind and solar across continents, with probably battery backup, no biofuels or combustion energy, no new hydro. Neither prescription has done well when put into practice in reducing emissions. US CO2 emissions per capita hardly changed from the 70s to the 2000s, only falling with the switch from coal to gas (though increased methane leakage may have negated some of the climate benefit). Widespread, government-sponsored wind and solar growth, most notably in Germany, has bought a rapid rise in installation, but though the individual solar plants and wind turbines became much cheaper, their integration into the grid led to increasing power costs, while fossil fuel use persisted at a higher level than on grids that had already switched to nuclear for largely economic reasons.
Some countries whose governments had declared that nuclear power would cease have reversed course, and plan new build - notably Japan, South Korea, Sweden, and Italy. Others - Germany, Spain, Switzerland, Taiwan, which had 20 to 40% of their power from nuclear - currently persist in de-nuclearising. Russia is building plants in Turkey, Egypt, Iran, India, Bangla Desh, and shortly Hungary. Russia, United Arab Emirates, Iran, and possibly soon Saudi Arabia, are building nuclear plants at home because it displaces gas, which earns much more money as exports. Japan and South Korea are building nuclear for the opposite reason - it makes power much more cheaply than imported liquefied natural gas, at East Asian prices. The important question for the future is whether nuclear can take more than a toehold share in countries like India, Pakistan, South Africa, and Indonesia, where energy use is rising fast, and coal is now the chosen option.
- It's only a few degrees
michael sweet at 00:42 AM on 19 January, 2024Retired guy at 10:
Arhennius predicted in 1896 (that is 1896, not a typo) that warming would be greater at night than during the day, greater in winter than summer and greater at high latitudes. Perhaps the scientists do not emphasize this point since it has been discussed so long by those who pay attention.
This sounds like another attempt by deniers to grasp at straws to try to minimize the problem. I have seen a lot of articles that say that high temperatures at night make it much harder for people to live in hot areas because there is no time to recover from the daily heat. Likewise many plants in temperate areas require night time cold to produce fruit (think apples, peaches, cherries, grapes and nuts). Of course sea level rise will be greater since Greenland and the Antarctic will melt faster when they are warmer.
The deniers have nothing so they make up stuff to argue about.
- Skeptical Science New Research for Week #2 2024
michael sweet at 06:18 AM on 14 January, 2024Zekie Hausfather posted a summary of 2023 on Carbon Brief today. He put a summary of the temperature record on Climate Brink. The Carbon Brief article contaiind more data about sea level rise, climate records, sea ice and glacier melt and a few other things. They are written for lay people to read. They are very informative. The Climate Brink article is shorter.
He says that the reason that 2023 was so not is not known. The predictions of the 2023 temperature from a year ago were much too low. He says he thinks the volcano and aerosols have too small an effect to account for 2023 but so does a typical El Nino. We will have to wait for more data to find out the scientific reason.
The Climate Brink article would make a good OP here at SkS. The Carbon Brief article is longer than OPs usually are here.
- At a glance - Is the CO2 effect saturated?
Just Dean at 09:44 AM on 11 January, 2024I think this is where data from paleoclimatology can help as well. Three recent studies have looked at the earth's temperature vs CO2 during the Cenozoic period, Rae et al., Honisch et al., and Tierney et al. . Each of those show that the temperature of ancient earth continues to rise as CO2 increases. As I understand it the first two are based solely on proxy data while the Tierney effort includes modeling to try and correlate the data geographically and temporally.
All of these are concerned with earth system sensitivities that include both short term climate responses plus slower feedback processes that can take millenia, e.g. growth and melting of continental ice sheets. Both Rae and Honisch include reference lines for 8 C / doubling of CO2. In both cases, almost all the data lie below those reference lines suggesting that 8 C / doubling is an upper bound or estimate of earth's equilibrium between temperature and CO2. Also notice that there quite is a bit of spread in the data.
In contrast, when Tierney et al. include modeling they get a much better correlation of T and CO2. They find that their data is best correlated with 8.2 C / doubling, r = 0.97. Again, this represents an equilibrium that can take millenia to achieve but does to my way of thinking represent "nature's equilibrium" between T and CO2.
In these comparisons, the researchers define changes in temperature relative to preindustrial conditions, CO2 = 280 ppm. For Tierney's correlation then on geological timescale, the temperature would increase by 8.2 C at 560 ppm. At our present value of 420 ppm there would be 3.7 C of apparent warming potential above our 1.1 C increase already achieved as of 2022, i.e., global warming in the pipeline if you will.
Bottom line, based on paleoclimatological data, there is no apparent saturation level of CO2.
- A New 66 Million-Year History of Carbon Dioxide Offers Little Comfort for Today
nigelj at 05:38 AM on 13 December, 2023The information on earth system sensitivity of 5 - 8 degrees C is very sobering. There are many accounts of what a 6 degree world is like easily googled and its very inhospitable for humans and other species. Because ESS develops on long time frames we might adapt to some extent, but that doesn't really make it any less inhospitable.
This is one authors depiction of a 6 degree world based on available research. The description is based on such a world developing over the next couple of centuries and a failure to curb emissions, but even if it takes thousands of years as a result of ESS, many of the outcomes would be similar.
"Special coverage is given to the positive feedback mechanisms that could dramatically accelerate climate change. The book explains how the release of methane hydrate and the release of methane from melting permafrost could unleash a major extinction event. Carbon cycle feedbacks, the demise of coral, the destruction of the Amazon rainforest, and extreme desertification are also described, with five or six degrees of warming potentially leading to the complete uninhabitability of the tropics and subtropics, as well as extreme water and food shortages, possibly leading to mass migration of billions of people."
The IPCC seems to have focused most attention on warming and sea level rise rates by 2100. We have projections of around 3 degrees C of warming and worst case about 5 degrees, and SLR around 1 metre with a worst case 2 metres. The details on longer term trends several centuries into the future, or millenia into the future like earth system sensitivity, are buried away in their reports or not given much attention.
The IPCC have a chart buried in their reports showing a worst case of about 10 degrees C by about 2300 if equilibrium climate sensitivity turns out to be high and we just go on burning fossil fuels. Likewise by 2300 SLR could be well over 2 metres. This may be somewhat attenuated by the impacts of renewable energy already reducing projected coal use, but it would still be a big number and theres a lot of SLR already baked in even if we stop warming right now.
I wonder if this focus on year 2100 is a deliberate psychological strategy to focus on our immediate future. If they focused on the longer term trends there might be a risk that people would say why worry that won't effect me or my children.
However warming of for example 3 degrees by 2100 and one metre or so of SLR doesnt sound very scary to some people, while numbers like 5- 8 degrees longer term and SLR of 10 - 20 metres are obviously intuitively far more scary and certainly get my attention. Clearly we do need a focus on year 2100, for obvious reasons, because its in our lifetimes and adaptation would be very costly, but I wonder if a bit more attention on longer term time frames would have really shown people the huge scale of change we are facing.
- At a glance - Evidence for global warming
nigelj at 06:17 AM on 29 November, 2023We have many ways of measuring global warming. Urban areas, rural areas,oceans, the middle, and upper atmosphere. Sea level rise is also an indication of warming. All these show a similar warming trend. How much more do people want to be convinced? There really isn't any part of the planetary system left to measure.
If we were reliant purely on land surface data in cities for example, I would be scepetical. One data set might be flawed. But the chances of so many multiple data sets all being flawed and in the same direction is effectively zero.
Sarah Palin seems like a typical example of a lay person who thinks she knows better than the climate experts. Of course its good to discuss things and question if the experts are right, but remember the experts know things you dont know and small details are important in science.
Another expample of someone out of their depth is John Clauser, a physicist with a nobel prize in quantum physics and an outspoken anthropogenic climate change sceptic despite the fact he has never published any research related to climate change or formally specialised in something like atmospheric physics. It hasn't stopped him telling everyone that climate science is all wrong. He has made many indisputably false statements sometimes by using very out of date information. So even scientists outside their area of expertise can fool themselves. Good commentary here:
www.realclimate.org/index.php/archives/2023/11/clauser-ology-cloudy-with-a-chance-of-meatballs/
- 2023 SkS Weekly Climate Change & Global Warming News Roundup #44
michael sweet at 02:39 AM on 8 November, 2023I don't think Hansen is worried about thousands of years in the future. He has been saying for decades that aerosols are reflecting a lot of energy back into space, cooling the planet. Reducing fossil fuel use reduces aerosols. The loss of aerosols causes rapid warming. Hansen projects that 1.5C will be exceeded by 2030 and 2.0 C will be exceeded by 2050. He is concerned about changes that will occur while people alive now are still around, about 100 years. He is concerned about multimeter sea level rise by 2100. If Hansen is correct about aerosols the next 30 years will have substantial extra heating.
I respect Zeke and Mann but their explainations for the extreme heat the past 6 months are pretty weak. While the current temperatures are inside the error bars for the models, the temperature this year is extraordianrily hot comnpared to all previous years. I note that the IPCC generally emphasizes what a consensus of scientists think is the minimum amount of change in the climate and temperature. That means that a majority of scientists think it will be worse than the IPCC projections.
The scientists who project damages substantially exceeding the IPCC reports are in the minority. It is very concerning to me that they exist at all. Especially since the last 6 months have been so hot and next year is projected to be even hotter. El Nino does not usually strongly affect temperature until the end of the year.
I agree that "it's important to communicate the incredible challenges we face but without instilling in people's minds the idea it's already a lost cause." But politicians still are not taking action seriously.
What is the IPCC defination of "consensus". It has to be a lot higher than 50%. Is it 80%, 90%? They must have it written down somewhere.
- John F. Clauser: the latest climate science-denying physicist
michael sweet at 12:47 PM on 27 October, 2023TWFA:
There are mountains of evidence that climate science has predicted in the past that can be currently reviewed. For example, climate scientists predicted that hurricanes would increase in force in the future. Just yesterday the city of Acapulco was destroyed by a hurricane of greater force than any previously occuring in the East Pacific Ocean. That was predicted in advance. Hansen predicted the future increase in temperature in his testimony to congress in 1989. His predictions have proven to be accurate.
You are asserting that people who have correctly predicted climate change for the past 100 years cannot be believed in their predictions for the next 20 years. Why do you think that scientists who have correctly predicted changes in the past will suddenly become unable to make correct predictions now? For the most part the predictions of scientists have been correct. A few things, like the increasing force of hurricanes, and sea level rise, have been underestimated by scientsts.
The time when
"until such time as the real world data and not just the modeled projections show it is clearly being being affected by our behavior"
was reached decades ago. The predictions made during the 60's and 70's have been validated by data. You are claiming that we can never predict anything because we do not remember what was predicted correctly in the past. The people at SkS remember the past projections and know that they validate the current projections.
- John F. Clauser: the latest climate science-denying physicist
nigelj at 06:46 AM on 9 September, 2023The IPCC reports are clearly conservative leaning. However the latest IPCC report does project warming at around 4 - 5 degrees by end of this century at BAU (Business as usual emissions) and SLR (sea level rise) worst case up around 1 - 2M end of this century. And it will go on rising after that if we do nothing.
There are lower SLR projections out there and a small number of higher projections by people like Hansen at around 4M end of century, but his is very speculative. So Im not sure that the IPCC are being excessively conservative on the key numbers.
For me SLR projections of 1 - 2M end of this century look very worrying with the potential to cause massive problems. Even although 2M is worst case and low probbaility the impact is potentially huge so such a scenario should be guiding or mitigation response. If people cant see all this and feel motivated to take serious action, then I'm not sure they would change their attitude if the number was 4M anyway.
So obviously the IPCC should robustly communicate the climate problem, but I think we are at risk of scapegoating the IPCC for the lack of strong mitigation response, when the culprit is really peoples complacency, due presumably to numerous factors from vested interests, resistance to change, psychological barriers, ideological views, the denialist campaign etc,etc.
- Climate Confusion
One Planet Only Forever at 04:24 AM on 5 September, 2023Markp,
Your comment @40 contains the following helpful point: "In fact, one of our first mirror test sites was either on or adjacent to a local airport's land and their permission was required, and it was given."
This is helpful because it appears to establish that, along with your earlier mention of being very familiar with 'climate related finance', you appear to be 'invested' in a 'mirroring enterprise'.
Mirrors may be a helpful measure, along with other actions that increase the reflection of sunlight, to reduce the current degree of human impacts on global warming. They could be a part of the broad diversity of helpful actions. But they are unlikely to be 'the primary solution'.
Project Drawdown (at drawdown.org) developed by Paul Hawkin (author of The Ecology of Commerce) is an informative resource. It lists and evaluates climate impact reduction solutions. In their words "Project Drawdown’s world-class network of scientists, researchers, and fellows has characterized a set of 93 technologies and practices that together can dramatically reduce concentrations of greenhouse gases in the atmosphere." But their list of solutions includes helpful actions that do not reduce ghgs like the one they evaluated that seems close to your 'mirror' application - Green and Cool Roofs (Linked to Project Drawdown).
Maybe you should get in touch with Project Drawdown to get your idea added to their list of evaluated solutions.
However, I am pretty sure about what the primary solution is. And it is not covered by Project Drawdown. It is not a 'new idea'. It requires nothing new to be built. And it requires no alteration of any developed activities. It is:
Reduced Consumption - especially by the people who have over-developed levels of consumption (who consume 'beyond necessary consumption') - especially the reduction of types of consumption that are ultimately undeniably unsustainable like fossil fuel use (which cannot be continued to be 'enjoyed by everyone' centuries into the future even if there were no harmful impacts).
- Climate Confusion
Markp at 22:43 PM on 3 September, 2023For Rob: I know I have not provided much data to back what I've been saying, but that's mainly because I was going on the assumption that you may already be aware of the data that could support me. In other words, I don't think what I've said is uncontroversial from a data point of view, but I do accept that it might be controversial from the point of view of making those holding a mainstream view (and I know that's vague) uncomfortable.
I disagree with little of what you say about climate in this last post. From your list of 8 items, only 1,4 and 5 are problematic in my view. Unfortunately, those few items are weighty:
"A lot is happening towards decarbonization" is vague enough to require examples to qualify the statement. There has definitely been a lot of talk about decarbonization, but as 2022 saw global emissions hit a new high of 36.8 Gt, according to the IEA's report "CO2 Emissions in 2022" one has to ask what decarbonization achievements, what action, in place of mere talk, can we point to. Renewable energy production plus use of EVs, heat pumps and who knows what else saved about 550 Mt. Fine. But this growth rate (growth of renewable contribution) won't hold up. So when you say "a lot" is happening, what's that really mean? And could you give just a few bullets on how you think we'll achieve net zero by 2050?
I'm also curious to know how much your vision of "net" zero relies on offsetting schemes, because I don't trust them and fear that they are being relied on too much for comfort.
As for what happens to the rising temperatures in a net zero 2050, we'll have to wait and see.
I'm certainly with you on breaching 2C by 2050, but since I've got little hope we'll be anything close to net zero by then (for whatever net zero is actually worth as long as we've got all the offestting nonsense thrown in there) it looks worse to me than to you.
Finally, and to change the subject a bit, I think the talk about models went too far. I'm not saying models are bad, just that they're being relied on too heavily in certain important cases. And as my primary experience (nearly 30 years now) has been in the financial arena for many "quant" strategies where, in that industry it is painfully common to see wonderful quant investment funds with great backtested results finally have some real money thrown at them and start a live track record, only to see the live returns look nothing like the lovely return characteristics of those backtests, I confess a lot of my skepticism comes from just that type of environment. Still, when we continually see news reports with headlines running "Researchers present shocking new data that climate change is happening much faster than expected" and the previous expectation was based on models, I don't feel at all surprised. I've just had a look at the "myths" section of Skeptical Science specifically at the models myth and I also see there that most of the argument seems to be toward trying to convince climate deniers who say models are all wrong that GW is real. That's clearly not me.
For Eclectic: I don't think I've written too much, do you? I know people these days don't like to read anything longer than a twitter post, but I don't think your assessment here is fair. I've tried to keep it short, in fact. Like I said, I assumed, and maybe wrongly(?), that you folks had a decent understanding of the data already, and could follow commentary like mine that took a broader look at things rather than fussing over citations and decimal points because I'm not claiming anything that boils down to a disagreement over small measurements but has been more about one's basic orientation: some of you seem to be wearing rose-colored glasses in my view, like too many people are.
As for the mirror concept, if the goal were to limit global temperature rise to 2C by 2100 we would need about twice the surface area of the contiguous USA. Although these reflectors would be useful in many instances, like on rooftops, parks, outdoor markets, reservoirs, etc., the main idea is for them to be used in agricultural settings because there's a lot of agricultural land, and because the reflectors would bring both local benefits to the crops by cooling, saving water and increasing yield, and contribute to global cooling. How to do that on a large scale is a problem that needs to be worked out. Any cropland managed by tractors and other large machines would either need to involve reflectors that would be removed from time to time for those machines to do their work, which wouldn't be easy, or they'd need to be placed so as not to interfere with those machines, perhaps by having them suspended vertically alongside crops rather than horizontally over them. And of cource, horizontal coverage would not involve blocking all available sunlight as to choke off photosynthesis, but as most crops can thrive with up to 30% shading, it would be placed intermittently. Anyway, this is the rough idea. Reflectors made from PET and aluminum cans from landfill provide more than enough for this level of scale, but other reflector constructions/materials could pop up as well. If you feel this isn't the type of detail you'd like to see, I'm not allowed to offer more. Not to protect technology or profits, because this comes from a nonprofit, but simply because I'm not authorized. As some of you know, the science takes time. We're working on it.
If that surface area seems "too big" as in "nobody will go for that" I can certainly feel that, but what choice have we got? The Earth is big. We can do it. We've got 4 million miles of roads in the USA. When cars first got started, nobody would have thought that possible. All of our climate "solutions" are by nature on a grand scale. Nothing to do about that as far as I know. And why people might balk at lots of mirrors/reflectors when they seem to think DAC (or your solution of choice) can clean (enough of) the entire atmosphere, I'm stumped.
- Climate Confusion
Markp at 05:22 AM on 3 September, 2023Hello
No, I'm not at all advocating that individuals adjusting their lifestyles are the answer, far from it (I'm surprised to hear this from you!), but it is something that must be done. Average people pushing the politicians and business leaders to act is necessary as well, because as we can see, without that they'll continue making targets and holding discussions that don't get us anywhere.
This is going to come down to us agreeing to disagree, I guess, for example regarding the IPCC and all the supposed "progress" we've made. I know that most people in climate science (scientists and others) think like you, that a lot has been done, etc. I just don't buy it. We've certainly managed to elevate the overall knowledge of GW among everyone - people from all walks of life (not with the honesty and clarity that is needed in my opinion, but...). But that has not translated into the kind of action we need by a LONG shot. It's politics and it's scientific reticence (i.e. David Spratt) and many other reasons, but it's there, staring us all in the face. Maybe I'm just speaking here to the optimists, 45-years of experience or not. I don't know. But if you think you shouldn't take me seriously because of my attitude towards models re "the end of temp rise" I'll just reiterate that it's not just me but people like James Hansen who have expressed those opinions. Just look at his latest tidbit: "Equilibrium Warming = Committed Warming?" where he writes in the 4th paragraph: "...climate science should be focused on data. That's the way science is supposed to work. However [the] IPCC is focused on models. Not just global climate models, but models that feed the models, eg. Integrated Assessment Models that provide scenarios for future GHG levels...sometimes the models contain hocus-pocus. As we mention in our current paper, they can assume, in effect, that 'a miracle will occur.'" And as you know, he's not the only one to criticise the overreliance on models. I'm assuming you are all familiar with Spratt and Dunlop's "What Lies Beneath."?
At the end of the day, scientists are no different from anyone else in this world where we all have to struggle for survival and protect our jobs and reputations and do things we have to do but may not believe in. Research isn't done for fun or for pure curiosity unless one bankrolls one's own laboratory, which few do. It's done to support the money, make a product, build a name for oneself, etc.
So people like (unnamed) set up for-profit companies as sidelines in addition to their responsibilities with their universities and, look what he just did: sold Carbon Engineering for over $1B. Nice. Ka-ching. You can't sell simple solutions for that kind of money, can you? And Climeworks, when are they going to have an IPO and cash-out, for worthless DAC? And this is all because the IPCC said "We MUST do this!"
An extremely important statement from the foreward of "What Lies Beneath" is from Hans Joachim Schellnhuber, professor of theoretical physics, etc., long list of credentials, when he said we are running out of time and so "...it is all the more important to listen to non-mainstream voices who do understand the issues and are less hesitant to cry wolf [than for example those scientists working with the IPCC]".
I work with those non-mainstream scientists because they are the ones who seem to be cutting through the BS towards real solutions that give us more than hopium.
Let me just ask you, and I am trying to be fair to the scientists in climate, generally speaking, because I imagine the vast majority are really doing their best. They aren't free to do what they might if they weren't trapped in the system we all are trapped in. (I know one who is a physicist but works with the IPCC on policy and he told me once "You have to trust your institutions, Mark"!!! Really. I trust the post office to deliver a letter. I don't trust politicians to solve global disasters that require those in power taking home less money.) But let me ask: if scientists really have been trying as hard as they could for decades now to come up with ways to stop rising heat and protect life on Earth as fast as possible, why has nobody else but a man who left his academic career at Harvard behind in order to found a nonprofit been able to come up with the solution staring us each in the face every morning when we brush our teeth, involving mirrors? Could it maybe have anything to do with the fact that it is just not very sexy? Honestly, I cannot understand or explain it any other way. And I've seen big-wig scientists in the climate sphere hear of this and say "where's your peer-reviewed research?" instead of just turning their brains on and thinking about the idea first. "Hey, makes sense, pretty obvious, actually...could be some complications, but overall, interesting idea..." (Kudos to Eclectic on this one) No, instead they just wanted research to back up the idea that ice will melt in a hot frying pan.
Well...would have been more fun over a beer. Take care.
- It's not bad
jlsoaz at 06:23 AM on 14 August, 2023Hi -
As has been remarked by others, arguably this "It's not bad" response is good, but may be trying to cover too much ground. In particular, I'm here to request that the team consider writing a response to the related or subordinate myth(s), which are in my opinion arguably the most important myths not yet debunked on this site, that
- nobody has died from climate change,
- any claim of increased deaths can't be attributed to climate change.
- and, therefore, calling this a "climate emergency" is exaggerating, alarmist and hysterical.
I believe the science here would fall in the area of social science or biological sciences (i.e.: discussing increased mortality above what is expected per time period, and whether it is attributable, under established scientific practices, to climate change). There are peer reviewed publications out there which may give some idea and basis for a proper rebuttal, though admittedly we could use more of such publications to lean on in the face of such arguments. A couple of examples:
https://www.nature.com/articles/s41558-021-01058-x
Article
Published: 31 May 2021
The burden of heat-related mortality attributable to recent human-induced climate change
1. I think these two links relate to the same study published in Nature in 2021:
LINK
Global Study Evaluates Heat-Related Deaths Associated with Climate Change
By David Richards
2.
Also in 2021, this may be a completely different study (I can't tell for sure at a glance. It seems to have been published in The Lancet Planetary Health.
LINK
World’s largest study of global climate related mortality links 5 million deaths a year to abnormal temperatures
08 July 2021
https://www.thelancet.com/journals/lanplh/article/PIIS2542-5196(21)00081-4/fulltext
Global, regional, and national burden of mortality associated with non-optimal ambient temperatures from 2000 to 2019: a three-stage modelling study
Prof Qi Zhao, PhD
Prof Yuming Guo, PhD
Tingting Ye, MSc
Prof Antonio Gasparrini, PhD
Prof Shilu Tong, PhD
Ala Overcenco, PhD
et al.
Show all authors
Open AccessPublished:July, 2021DOI:https://doi.org/10.1016/S2542-5196(21)00081-4
---------
These above are just one or two recent examples. There are probably other credible-seeming ones if the team is able to look, in preparing a rebuttal, and they may vary as to which climate change impacts (heat, drought, rise in sea level, increased storms, etc.) have what mortality increase (or decrease, in some isolated cases, I suppose is possible) figures associated with them. As to "associated", I think it's to the scientific papers to clarify what the correct approach is.
Anyway, to simplify, please take a look at what I believe to be arguably the most important myth not yet addressed on this site. - A Frank Discussion About the Propagation of Measurement Uncertainty
MA Rodger at 18:52 PM on 11 August, 2023Nigelj @13,
The paper Frank (2019) did take six months from submission to gain acceptance and Frontiers does say "Frontiers only applies the most rigorous and unbiased reviews, established in the high standards of the Frontiers Review System."
Yet the total nonsense of Frank (2019) is still published, not just a crazy approach but quite simple mathematical error as well.
But do note that a peer-reviewed publication does not have to be correct. A novel approach to a subject can be accepted even when that approach is easily show to be wrong and even when the implications of the conclusions (which are wrong) are set out as being real.
I suppose it is worth making plain that peer-review can allow certain 'wrong' research to be published as this will prevent later researchers making the same mistakes. Yet what is so often lost today is the idea that any researcher wanting publishing must be familiar with the entirety of the literature and takes account of it within their work.
And for a denialist, any publication means it is entirely true, if they want it to be.
In regard to the crazy Frank (2019), it is quite simple to expose the nonsense.
This wondrous theory (first appearing in 2016) suggests that, at a 1sd limit, a year's global average SAT could be anything between +0.35ºC to -0.30ºC the previous year's temperature, this variation due alone to the additional AGW forcing enacted since that previous year. The actual SAT records do show an inter-year variation but something a little smaller (+/-0.12ºC at 1sd in the recent BEST SAT record) but this is from all causes not just from a single cause that is ever accumulating. And these 'all causes' of the +/-0.12ºC are not cumulative through the years but just wobbly noise. Thus the variation seen do not increase with variation measured over a longer period. After 8 years in the BEST SAT record is pretty-much the same as the 1-year variation and not much greater at 60 years (+/-0.22ºC). But in the crazy wonderland of Pat Frank, these variations are apparently potentially cumulative (that would be the logic) so Frank's 8-year variation is twice the 1-year variation. And after 60 years of these AGW forcings (which is the present period with roughly constant AGW forcing) according to Frank we should be seeing SAT changes anything from +17.0ºC to -12.0ºC solely due to AGW forcing. And because Frank's normal distributions provides the probability of these variations, we can say there was an 80% chance of us seeing global SAT increases accumulating over that 60 years in excess of +4.25ºC and/or decreases acumulating in excess of -3.0ºC. According to Frank's madness, we should have been seeing such 60-year variation. But we haven't. So as a predictive analysis, the nonsense of Frank doesn't begin to pass muster.
And another test for garbage is the level of interest shown by the rest of science. In the case of Frank (2019), that interest amounts to 19 citations according to Google Scholar, these comprising 6 citations by Frank himself, 2 mistaken citation (only one by a climatological paper which examines marine heat extremes and uses the Frank paper to support the contention "Substantial uncertainties and biases can arise due to the stochastic nature of global climate systems." which Frank 2019 only says are absent), a climatology working-paper that lists Frank with a whole bunch of denialists, three citations by one Norbert Schwarzer who appears more philosopher than scientist, and six by a fairly standard AGW denier called Pascal Richet. That leaves a PhD thesis citing Frank (2019)'s to say "... general circulation models generally do not have an error associated with predictions"
So science really has no interest in Frank's nonsense (other than demonstrating that it is nonsense). - 2023 SkS Weekly Climate Change & Global Warming News Roundup #29
nigelj at 07:17 AM on 29 July, 2023wilddouglascounty
"When the severity and frequency of extreme weather increases, the sea level rises and gets more acidic, wildlife populations move and wildfires abound, it is not because of Climate Change. It's because fossil fuel use that has changed the atmospheric and oceanic chemistry, allowing it to store more heat, changing the climate. Everyone who watches the weather needs to be reminded of that, too."
I'm sympathetic to what WDS wrote and what OPOF says. One reason. Apparently the link between fossil fuels and climate change is not mentioned in the IPCC summary for policy makers (or rarely mentioned I just forget which), because the oil exporting companies lobbied vigorously to keep it out. And in hindsight I've noticed our news media doesn't explicilty mention the link very often.
The counter argument is that almost everyone on the planet must know by now that fossil fuels are the main cause of climate change in recent decades. You would have to live a very isolated existence not to have heard by now.
But I think the link should always be mentioned more often and when appropriate. ( I hear what BL is saying) Reinforing the facts is arguably a good idea and cannot be a bad idea.
- 2023 SkS Weekly Climate Change & Global Warming News Roundup #29
wilddouglascounty at 15:01 PM on 24 July, 2023The term "climate change" has buried the lead for too long, so it's time to correct this. When Sammy Sosa, Barry Bonds and Mark McGuire were not voted into the Baseball Hall of Fame, it was not because of Home Run Change, it was because of Performance Enhancing Drugs. And everyone who watches baseball knows that.
When the severity and frequency of extreme weather increases, the sea level rises and gets more acidic, wildlife populations move and wildfires abound, it is not because of Climate Change. It's because fossil fuel use that has changed the atmospheric and oceanic chemistry, allowing it to store more heat, changing the climate. Everyone who watches the weather needs to be reminded of that, too.
It's time to stop using euphemisms that don't explicitly connect the changing climate to fossil fuel use so that folks understand in the same way that folks understand the role of performance enhancing drugs in sports. Everyone needs to be reminded of the role fossil fuels has in climate change, just as they know about the role of performance enhancing drugs in turbocharging the natural talents of the users. Whenever discussing any of the things related to Climate Change we should make that link explicit by using phrases like:
- Fossil fuel induced Climate Change
- Increased greenhouse gases from Fossil Fuel use
- Climate Change caused by Fossil Fuel use
- Changed atmospheric chemistry through the widespread use of fossil fuels
and the like. And if someone says that you're politicizing the weather, tell them that this isn't just political; it's based on overwhelming scientific evidence. Refer them to the IPCC or skepticalscience websites if they are still deniers, and change the focus to how to become more energy efficient first, replace fossil fuel use with renewables second, and nurture local ecosystems third. We don't have a choice but to make things super-clear if we are to have a chance to turn the ship away from almost unimaginable disasters for future generations.
- At a glance - Empirical evidence that humans are causing global warming
walschuler at 00:39 AM on 20 July, 2023This brief greenhouse gas theory history omits the very important paper, "On the Influence of Carbonic Acid in the Air Upon the Ttemperature of the Ground,"the first true model of the effect, the hand-calculated model by Svante Arrhenius published in 1896. It modeled the atmosphere as a single layer and the effect of setting the concentration of CO2 to 2/3 of the value at his time, and at values up to 3 times higher, for 10 degree latitude steps both north and south, for 4 seasons and for the annual mean. His results for this simple model were within a factor of 10 of current calculations and measurements as the value has grown. His interest was in explaining newly discovered evidence of ancient ice ages.
You also omit Horace-Benedict de Saussures' important measurements (in "Continuation du Voyage Autour du Mont-Blanc," Chapter XIII, Voyages dans les Alpes VII, 1779, S . Fauche, Neuchatel, pp353-355, and pp365-367). The first demonstrates the existence of "chaleur obscure" (="dark heat" = infrared radiation) and its reflection and concentration, using metal mirrors, just like visible light. The second records measurements of the greenhouse effect temperature rise in a cubic foot wooden box, insulated on all but one side with blackened cork, and that side closed by two layers of glass. He placed thermometers between the glass layers and inside and outside the box, and traveled the assembly from sea level up to high altitude in the Alpes, measuring the temperatures inside and outside the box as he went. He ascribes the decrease of temperature with altitude to the increasing transparency of the air as you ascend. I made a translation from the French which is available upon request. Fourier refers to this work in the paper of 1827 cited above.
- How big is the “carbon fertilization effect”?
daveburton at 01:45 AM on 14 July, 2023Eclectic wrote, "Daveburton @22 ~ Please explain more of your first chart [ IPCC's decadal Carbon Flux Comparison 1980-2019 ]. The natural sink flux figures… show a rather steady proportionality to the total carbon emissions."
Glad to. Any two things which steadily increase are thereby correlated. There's only a possibility that the relationship might be causal if there's a possible mechanism for such causality.
There's no possible mechanism by which the rate at which CO2 emerges from chimneys could govern the rate at which CO2 is taken up by trees & absorbed by the oceans, or vice-versa, so the relationship cannot be causal — just as this famous relationship is not causal:

Eclectic wrote, "The land sink shows about 30-35% of total emissions, while the sum of land & ocean remains around 55-60%."
Yes, I usually say "about half," as in, "If our CO2 emissions were cut by more than about half then the atmospheric CO2 level would be falling, rather than rising."
It is important to recognize that the relationship is merely coincidental, not causal.
Eclectic wrote, "as the decades progress, the natural carbon sink flux in absolute terms rises with the rising emissions ~ but does not show a proportional increase."
The rate at which natural processes, such as ocean uptake, uptake by trees and soil ("greening"), and rock weathering, remove CO2 from the air, is affected in minor ways by many factors, but in a major way by only one: the current amount of CO2 in the air.
Our CO2 emission rate does not and cannot affect the natural removal rate, except indirectly, in the long term, by being one of the most important factors which affect the amount of CO2 in the air.
Eclectic wrote, "looking back in time ~ as the atmospheric CO2 level decreases, the size of the natural sink flux decreases also."
That is correct. It will also be correct looking forward in time, when CO2 levels are falling, someday.
Eclectic wrote, "this directly contradicts your hypothesis of 'if emissions were halved ... atmospheric CO2 level would plateau.'"
If you'll allow me to use "halved" as a shorthand for "reduced to the point at which emissions merely equal current natural removals, rather than exceed them," then those two statements are both correct, and perfectly consistent. It's pCO2 (level), not the rate of CO2 emissions, which (mostly) governs the rates of all the natural CO2 removal from the atmosphere.
Of course there are also minor factors which affect the removal rates. For instance, as we've already discussed, a 1°C rise in water temperature slows ocean uptake of CO2 by roughly 3%. Conversely, a rise in air temperature accelerates CO2 removal by rock weathering. (Sorry, I don't have a quantification of that.) But the main factor which controls the rate of CO2 removals is pCO2.
Eclectic wrote, "While the nutritive components of some food crops may reduce slightly as CO2 rises…"
Oh boy, another rabbit hole! That's the Loladze/Myers "nutrition scare."
It is of little consequence. That should be obvious if you consider that crops grown in commercial greenhouses with CO2 levels as high as 1500 ppmv are as nutritious as crops grown outdoors with only 30% as much CO2.

≥1500 ppmv CO2 is optimal for most crops. That's why commercial greenhouses typically use CO2 generators to raise daytime CO2 concentration to well above 1000 ppmv. It is expensive, but they go to that expense because elevated CO2 (eCO2) makes crops much healthier and more productive. (They don't typically supplement CO2 at night unless using grow-lamps, because plants can't use the extra CO2 without light.)
If elevating CO2 by >1000 ppmv doesn't cause crops to be less nutritious, then elevating CO2 by only 140 ppmv obviously doesn't, either.
Better crops yields, due to eCO2 or any other reason, can cause lower levels (but not lower total amounts) of nutrients which are in short supply in the soil. But that doesn't happen to a significant extent when agricultural best practices are employed.
I had an impromptu online debate about the nutrition scare with its most prominent promoter, mathematician Irakli Loladze, in the comments on a Quora answer. If you're not a Quora member you can't read it there, so I saved a copy here. He acknowledged to me that food grown in greenhouses at elevated CO2 levels is as nutritious as food grown outdoors.
Faster-growing, more productive crops require more nutrients per acre, but not more nutrients per unit of production.
Inadequate nitrogen fertilization reduces protein production relative to carbohydrate production, because proteins contain nitrogen, but carbohydrates don't. Likewise, low levels of iron or zinc in soils cause lower levels of those minerals in some crops. So, it is possible, by flouting well-established best agricultural practices, to contrive circumstances under which eCO2, or anything else which improves crop yields, causes reduced levels of protein or micronutrients in crops.
But farmers know that the more productive crops are, the more nutrients they need, per acre. Competent farmers fertilize accordingly.
Or, for nitrogen, they may plant nitrogen-fixing legumes — which benefit greatly from extra CO2.
If you don’t fertilize according to the needs of your crops, negative consequences may include reductions in protein and/or micronutrient levels in the resulting crops. The cause of such reductions isn't eCO2s, it's poor agricultural practices.
The nutrient scare is an attempt to put a negative "spin" on the most important benefit of eCO2: that it improves crop yields.
Eclectic wrote, "it is (as you state) beyond argument that higher CO2 benefits overall crop yield & plant mass."
That's correct. Moreover, agronomy studies show that for most crops the effect is highly linear as CO2 levels rise, until above about 1000 ppmv (which is far higher than we could ever hope to drive outdoor CO2 levels by burning fossil fuels). That linearity is obvious in the green (C3) trace, here:

That improvement is one of several major reasons that catastropic famines are fading from living memory.
If you're too young to remember huge, catastrophic famines, count yourself blessed. Through all of human history, until very recently, famine was one of the great scourges of mankind, the "Third Horseman of the Apocalypse." But no more. This is a miracle!
https://ourworldindata.org/famines

Ending famine is a VERY Big Deal, comparable to ending war and disease. Compare:
● Covid-19 killed 0.1% of world population.
● 1918 flu pandemic killed about 2%.
● WWII killed 2.7%.
● The near-global drought and famine of 1876-78 killed about 3.7% of the world population.
Eclectic wrote, "other CO2/AGW concomitant effects of increased droughts /floods /heat-waves can be harmful to crop yields in open-field agriculture. [And especially so for the staple crop of maize.]"
Well, let's examine those one at a time.
Heat-waves. Overall, temperature extremes are not worsened by the warming trend. Heat waves are slightly worsened, but by less than cold snaps are mitigated. That's because, thanks to "Arctic amplification," warming is disproportionately at chilly high latitudes, and it is greatest at night and in winter. The tropics warm less, which is nice, because they're warm enough already.
1°C is about the temperature change you get from a 500 foot elevation change. (That's calculated from an average lapse rate of 6.5 °C/km.)
On average, 1°C is similar in effect to a latitude change of about sixty miles, as you can see by looking at an agricultural growing zone map. Here's one, from the Arbor Day Foundation:

From eyeballing the map, you can see that 1°C (1.8°F) = about 50-70 miles latitude change.
James Hansen and his colleagues reported a similar figure: "A warming of 0.5°C... implies typically a poleward shift of isotherms by 50 to 75 km..."
1°C is less than the hysteresis ("dead zone") in your home thermostat, which is the amount that your indoor temperatures go up and down, all day long, without you even noticing.
In the American Midwest, farmers can fully compensate for 1°C of climate change by adjusting planting dates by about six days.

Floods. Theoretically, by accelerating the water cycle, climate change could increase the frequency or severity of floods. But the effect is too slight to be noticeable. AR6 says no change in global flood frequency is detectable:

Droughts. Droughts have not worsened. In fact, the global drought trend is slightly down. Here's a study:
Hao et al. (2014). Global integrated drought monitoring and prediction system. Sci Data 1(140001). doi:10.1038/sdata.2014.1

Here's the U.S. drought trend (the bottom/orange side of the graph):
https://www.ncei.noaa.gov/access/monitoring/uspa/wet-dry/0

Not only does climate change not worsen droughts, it has long been settled science that eCO2 improves plants' water use efficiency (WUE) and drought resilience, by improving CO2 stomatal conductance relative to transpiration. So eCO2 is especially beneficial in arid regions, and for crops which are under drought stress.
Maize (corn) has been very heavily studied. Even though it is a C4 grass, it benefits greatly from elevated CO2, especially under drought stress. Here's a study (one of many):
Chun et al. (2011). Effect of elevated carbon dioxide and water stress on gas exchange and water use efficiency in corn. Agric For Meteorol 151(3), pp 378-384, ISSN 0168-1923. doi:10.1016/j.agrformet.2010.11.015.
EXCERPT:
"There have been many studies on the interaction of CO2 and water on plant growth. Under elevated CO2, less water is used to produce each unit of dry matter by reducing stomatal conductance."
Here's a similar study about wheat:
Fitzgerald GJ, et al. (2016) Elevated atmospheric [CO2] can dramatically increase wheat yields in semi-arid environments and buffer against heat waves. Glob Chang Biol. 22(6):2269-84. doi:10.1111/gcb.13263.
However, I agree with you that putting a monetary value on the benefits of CO2 for crops is difficult. In part that's because the price of food soars when it's in short supply, and plummets when it's plentiful. So, for example, if we were to attribute, say, 15% of current crop yields to CO2 fertilization & CO2 drought mitigation, and value that 15% using current crop prices, we would be underestimating the true value, because absent that 15% boost the prices would have been much higher.
- How big is the “carbon fertilization effect”?
daveburton at 15:36 PM on 13 July, 2023Rob wrote elsewhere, "greening is now turning into 'browning.' ... fertilization [has now been] overwhelmed by other effects... In other words, the greening has now stopped," and here, "You were making the claim that natural sinks were removing more of our emissions, and that is not the case by any stretch of the imagination.""
Here's AR6 WG1 Table 5.1, which shows how natural CO2 removals are accelerating:
https://www.ipcc.ch/report/ar6/wg1/downloads/report/IPCC_AR6_WGI_Chapter_05.pdf#page=48
Here it is with the relevant bits highlighted:
https://sealevel.info/AR6_WG1_Table_5.1.png
Or, more concisely:
https://sealevel.info/AR6_WG1_Table_5.1_annot1_partial_carbon_flux_comparison_760x398.png
: 2.0 ⇒ 2.6 ⇒ 2.9 ⇒ 3.4 PgC/yr")
(Note: 1 PgC = 0.46962 ppmv = 3.66419 Gt CO2.)
As you can see, as atmospheric CO2 levels have risen, the natural CO2 removal rate has sharply accelerated. (That's a strong negative/stabilizing climate feedback.)
AR6 FAQ 5.1 also shows how both terrestrial and marine carbon sinks have accelerated, here:
https://www.ipcc.ch/report/ar6/wg1/downloads/report/IPCC_AR6_WGI_Chapter05.pdf#page=99
Here's the key graph; I added the orange box, to highlight the (small) portion of the graph which supports your contention that, "greening is now turning into 'browning.' ... fertilization [has now been] overwhelmed by other effects... In other words, the greening has now stopped."
https://sealevel.info/AR6_FAQ_5p1_Fig_1b_final2.png
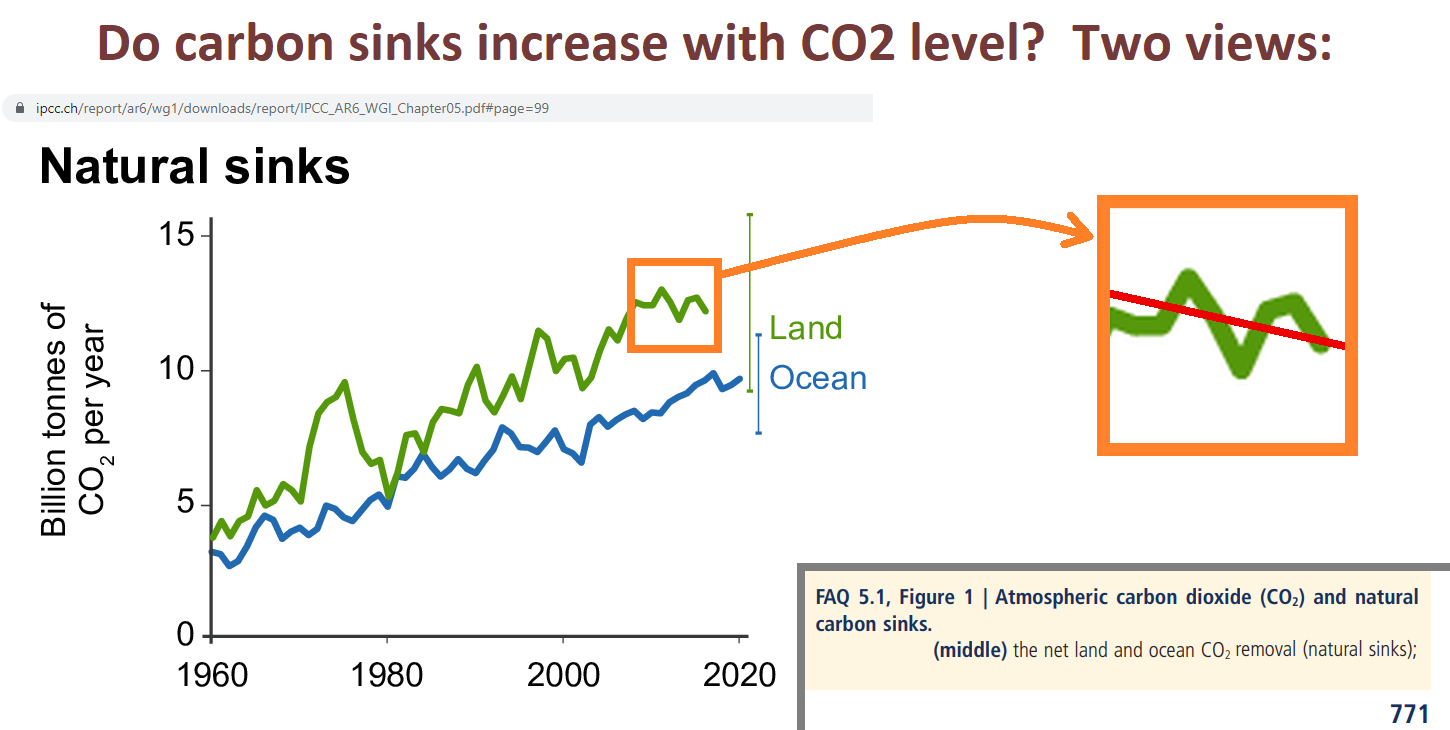
Here's the caption, explicitly saying that natural removal of carbon from the atmosphere is NOT weakening:

The authors did PREDICT a "decline" in the FUTURE, "if" emissions "continue to increase." But it hasn't happened yet.
What's more, the "decline" which they predicted was NOT for the rate of natural CO2 removals by greening and marine sinks, anyhow. Rather, if you read it carefully, you'll see that that hypothetical decline was predicted for the ratio of natural removals to emissions.
What's more, their prediction is conditional, depending on what happens with future emissions ("if CO2 emissions continue to increase").
Well, predictions are cheap. My prediction is that natural removals of CO2 from the atmosphere will continue to accelerate, for as long as CO2 levels rise.
The "fraction" which they predict might decline, someday, doesn't represent anything physical, anyhow. (It is one minus the equally unphysical "airborne fraction.") Our emission rate is currently about twice the natural removal rate, so if emissions were halved, the removal "fraction" would be 100%, and the atmospheric CO2 level would plateau. If emissions were cut by more than half then the removal "fraction" would be more than 100%, and the CO2 level would be falling.
I wrote elsewhere, "This recent study quantifies the effect for several major crops. Their results are toward the high end, but their qualitative conclusion is consistent with many, many other studies. They reported, "We consistently find a large CO2 fertilization effect: a 1 ppm increase in CO2 equates to a 0.4%, 0.6%, 1% yield increase for corn, soybeans, and wheat, respectively.""
If you recall that mankind has raised the average atmospheric CO2 level by 140 ppmv, you'll recognize that those crop yield improvements are enormous!
Rob replied, "If you actually read more than just the abstract of that study you find this on page 3: 'Complicating matters further, a decline in the global carbon fertilization effect over time has been documented, likely attributable to changes in nutrient and water availability (Wang et al. 2020).'"
Rob, I already addressed Wang et al (2020), but you might not have seen it, because the mods deemed it off-topic and deleted it. Here's what I wrote:
Rob, it's possible that your confusion on the greening/browning point was due to a widely publicized paper, with an unfortunately misleading title:
Wang et al (2020), "Recent global decline of CO2 fertilization effects on vegetation photosynthesis." Science, 11 Dec 2020, Vol 370, Issue 6522, pp. 1295-1300, doi:10.1126/science.abb7772
Many people were misled by it. You can be forgiven for thinking, based on that title, that greening due to CO2 fertilization had peaked, and is now declining.
But that's not what it meant. What it actually meant was that the rate at which plants remove CO2 from the atmosphere has continued to accelerate, but that its recent acceleration was less than expected. (You can't glean that fact from the abstract; would you like me to email you a copy of the paper?)
What's more, if you read the "Comment on" papers responding to Wang, you'll learn that even that conclusion was dubious:
Sang et al (2021), "Comment on 'Recent global decline of CO2 fertilization effects on vegetation photosynthesis'." Science 373, eabg4420. doi:10.1126/science.abg4420
Frankenberg et al (2021), "Comment on 'Recent global decline of CO2 fertilization effects on vegetation photosynthesis'." Science 373, eabg2947. doi:10.1126/science.abg2947
Agronomists have studied every important crop, and they all benefit from elevated CO2, and experiments show that the benefits continue to increase as CO2 levels rise to far above what we could ever hope to reach outdoors. Perhaps surprisingly, even the most important C4 crops, corn (maize) and sugarcane, benefit dramatically from additional CO2. C3 plants (including most crops, and all carbon-sequestering trees) benefit even more.
Rob also quoted the study saying, "While CO2 enrichment experiments have generated important insights into the physiological channels of the fertilization effect and its environmental interactions, they are limited in the extent to which they reflect real-world growing conditions in commercial farms across a large geographic scale."
That's a reference to the well-known fact that Free Air Carbon Enrichment (FACE) studies are less accurate than greenhouse and OTC (open top container) studies, because in FACE studies wind fluctuations unavoidably cause unnaturally rapid variations in CO2 levels. So FACE studies consistently underestimate the benefits of elevated CO2. Here's a paper about that:
Bunce, J.A. (2012). Responses of cotton and wheat photosynthesis and growth to cyclic variation in carbon dioxide concentration. Photosynthetica 50, 395–400. doi:10.1007/s11099-012-0041-7
The issue is also explained by Prof. George Hendrey, here:
"Plant responses to CO2 enrichment: Much of what is known about global ecosystem responses to future increases in atmospheric CO2 has been gained through Free-Air CO2 Enrichment (FACE) experiments of my design. All FACE experiments exhibit rapid variations in CO2 concentrations on the order of seconds to minutes. I have shown that long-term photosynthesis can be reduced as a consequence of this variability. Because of this, all FACE experiments tend to underestimate ecosystem net primary production (NPP) associated with a presumed increased concentration of CO2."
Rob wrote, "It does seem that you're claiming CO2 uptake falls with increasing temperature.""
That is correct for uptake by water. Or, rather, it would be correct, were it not for the fact that the small reduction in CO2 uptake due to the temperature dependence of Henry's Law is dwarfed by the large increase in CO2 uptake due to the increase in pCO2.
Rob wrote, "But it's unclear to me how you think this plays into the conclusion that CO2 levels would 'quickly normalize' over the course of 35 years" and also, "You also claimed CO2 concentrations would quickly come down (normalize) once we stop emitting it. This is also not correct unless you're using 'normalize' to mean 'stabilize at a new higher level'."
Perhaps you've confused me with someone else. I said nothing about CO2 levels "normalizing."
I did point out that the effective half-life for additional CO2 which we add to the atmosphere is only about 35 years. I wrote:
The commonly heard claim that "the change in CO2 concentration will persist for centuries and millennia to come" is based on the "long tail" of a hypothetical CO2 concentration decay curve, for a scenario in which anthropogenic CO2 emissions go to zero, CO2 level drops toward 300 ppmv, and carbon begins slowly migrating back out of the deep oceans and terrestrial biosphere into the atmosphere. It's true in the sense that if CO2 emissions were to cease, it would be millennia before the CO2 level would drop below 300 ppmv. But the first half-life for the modeled CO2 level decay curve is only about 35 years, corresponding to an e-folding "adjustment time" of about fifty years. That's the "effective atmospheric lifetime" of our current CO2 emissions.
Rob wrote, "Dave... The fundamental fact that you disputed is that oceans take up about half of our emissions."
That reflects two points of confusion, Rob.
In the first place, our emissions are currently around 11 PgC/year (per the GCP). The oceans remove CO2 from the atmosphere at a current rate of a little over 2.5 PgC/year. That's only about 1/4 of the rate of our emissions, not half.
More fundamentally, the oceans are not removing some fixed fraction of our emissions. None of the natural CO2 removal processes do. All of them remove CO2 from the bulk atmosphere, at rates which largely depend on the atmospheric CO2 concentration, not on our emission rate. If we halved our CO2 emission rate, natural CO2 removals would continue at their current rate.
Because human CO2 emissions are currently faster than natural CO2 removals, we've increased the atmospheric CO2 level by about 50% (140 ppmv), but we've increased the amount of carbon in the oceans by less than 0.5%, as you can see in AR5 WG1 Fig. 6-1.
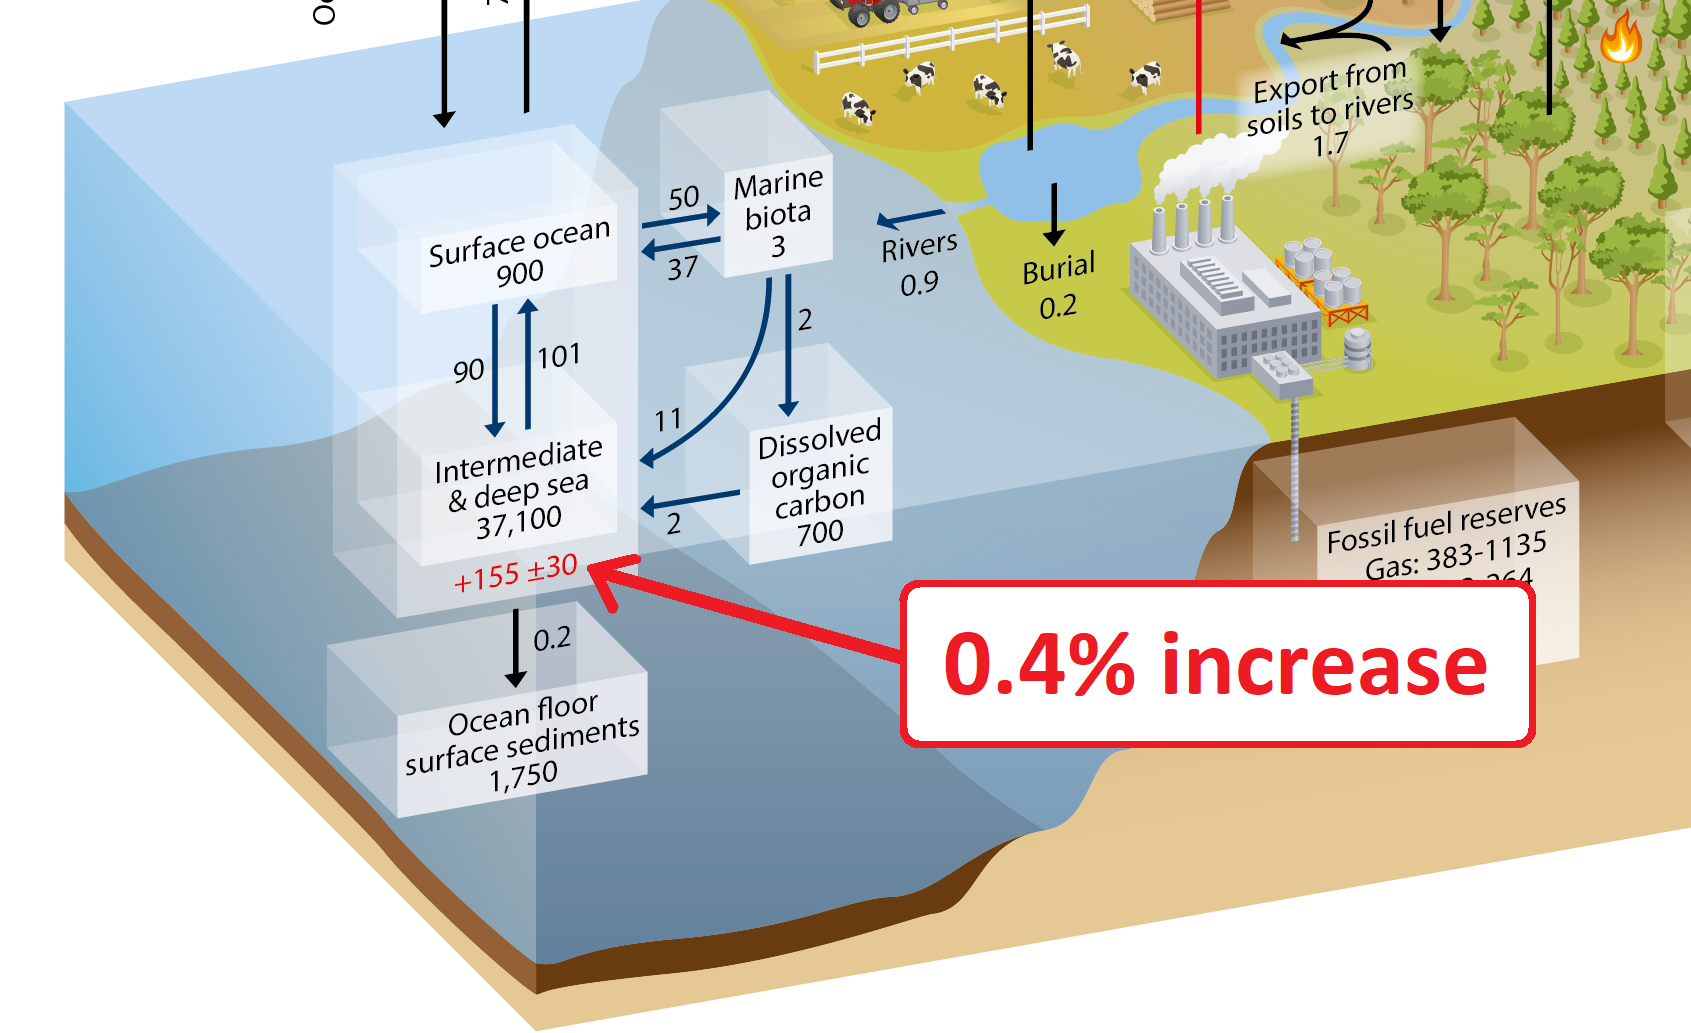
Sorry, this got kind of long. I hope I addressed all your concerns.
- How big is the “carbon fertilization effect”?
daveburton at 08:56 AM on 13 July, 2023Rob, in answer to your first question, Bob is correct: they use different units.
Both the graph and the "plug in suitable values" calculation (above) are for freshwater, but that hardly matters. CO2 is noticeably less soluble in saltwater, but the effect of temperature on CO2 solubility is nearly identical. Here's the same calculation with salinity 35 (typical seawater), for a 1° temperature increase (from 288K to 289K):
Bob is also correct that ocean chemistry is more complicated than that, in part because most of the dissolved CO2 immediately dissosiates into various ions. Here's a good resource on ocean chemistry:
http://www.molecularmodels.eu/cap11.pdf
What's more, in the oceans, biology generally trumps chemistry, and that is certainly true for CO2 uptake. Some people think that the capacity of the oceans to take up CO2 is limited to surface water by ocean stratification. But that's incorrect, beause the "biological carbon pump" rapidly moves CO2 from surface waters into the ocean depths, in the form of "marine snow."
The higher CO2 levels go, the faster that "pump" works. Here's a paper about it:
https://www.science.org/doi/reader/10.1126/science.aaa8026
Once carbon has migrated from the ocean surface to the depths, most of it remains sequestered for a very long time. Some of it settles on the ocean floor, but even dissolved carbon is sequestered for a long time. For instance, it is estimated that the AMOC takes about 1000 years to move carbon-rich water from high latitudes to the tropics, where it can reemerge. That is obviously far longer than the anthropogenic CO2 emission spike will last.
Due to the temperature dependence of Henry's Law, a 1°C increase in temperature slows CO2 uptake by the oceans by about 3%. That's a slight positive feedback: more CO2 in the air increases water temperatures, which slows ocean uptake of CO2. But it is very minor, because a 50% (140 ppmv) rise in atmospheric CO2 concentration accelerates CO2 uptake by the oceans by 50%, which obviously dwarfs 3%. That's the main reason that ocean uptake of CO2 continues to accelerate despite the temperature dependence of Hanry's Law.
- Hansen predicted the West Side Highway would be underwater
daveburton at 21:53 PM on 12 July, 2023Bob Ludlow wrote
[Contents snipped]
"You have no objective criteria to declare that The Battery and Honolulu are "the best" at representing anything other than local effects..."
The Battery has 1825 months of sea-level measurements. No other NOAA Atlantic site has that much. Only San Francisco has more, but it has only 1404 months of measurements since the 1906 earthquake. The downside to The Battery's measurement record is its high (atypical) rate of subsidence, which roughly doubles the local ("relative") sea-level trend there.
There are some European sites with longer, better Atlantic / North Sea / Baltic measurement records, and Australia has an excellent Pacific measurement record, but there are substantial delays getting data for those locations. My sealevel.info stie pulls data from NOAA frequently, so it's much more up-to-date.
Some of the European sites, have recorded a slight acceleration; it was most noticeable at Brest, which saw a 0.0 mm/year trend in the19th century, but a 1.6 mm/year trend since then, though there are substantial gaps in ther record.
Several German sites have particularly excellent measurement records; here's one of them:

In the Pacific, Honolulu has 1421 months (>118 years) of continuous sea-level measurements, without even a single missing month. Just as importantly, Honolulu is a near-ideal measurement site, near the middle of the world's largest ocean, on an "old" island with near-zero vertical land motion, small tides, and (unlike most places!) almost no seasonal cycle. What's more, its mid-Pacific location is near the pivot point of the east-west Pacific "teeter-totter," so it is little affected by ENSO "slosh." That is, El Niño and La Niña don’t affect sea-level there much at all. It really is a superb dataset.
Bob continued, "Just because they have long records does not mean that they accurately reflect regional or global trends."
That's true. As I've mentioned, NYC's sea-level trend is atypical, because of the high rate of subsidence there.
However, if subsidence / uplift are due to very long term processes, like PGR, there's reason to hope that they are fairly consistent over the duration of the measurement record. In that case, even if the linear trend is greatly affected by uplift or subsidence, the acceleration won't be. (Of course, that doesn't work in places, like Manila, where changing local factors, like groundwater pumping, cause varying subsidence.)
So it should not surprise you that, even though The Battery and Honolulu have seen quite different linear trends over the last century, the measured acceleration in both places is very similar (negligible).
Bob wrote, "You are clearly picking locations to try to tell the story you want to tell."
That's a false accusation. You just find the data surprising, so you make baseless accusations, without evidence. That is not conducive to constructive dialogue, nor to learning.
If you think I chose unrepresentative sites, or sites with inferior quality measurement data, then YOU tell me what sites YOU think are better, and why.
Bob wrote, "As for your quadratic fits: it has been pointed out to you over the past 10 years that quadratic fits mean nothing when the underlying data does not resemble a quadratic relationship."
Nobody competent makes that claim in the context of sea-level analysis.
If there were a step-change in some climate system input, then you could look for a step-acceleration as a consequence. But there's been nothing like that. The radiative forcing trend from CO2 has been very gradual, and strikingly linear (just barely more than linear) for the last forty years. It's been quite gradual for much longer than that.
Quadratic regression is the cannonical way of detecting gradual acceleration. It's how Church & White did it, and how every competent sea-level analyst since then has done it. When Hogarth reported that, "sea level acceleration from extended tide gauge data converges on 0.01 mm/yr²," that's what he was talking about.
- Hansen predicted the West Side Highway would be underwater
daveburton at 06:58 AM on 11 July, 2023Philippe Chantreau wrote, "I will respond to Dave Burton on the CO2 fertilization thread on the part of this latest post regarding that subject."
Will you please provide a link to your comment to me, Philippe?
[Major snip]
Rob Honeycutt wrote, "1) That is not an image that appears in AR6, not with the added orange box. Thus you're co-opting their work to infer conclusions they do not make."
That's incorrect.
Since we're onto the next page of comments now, here's the image again:
https://sealevel.info/AR6_FAQ_5p1_Fig_1b_final2.png
If you enlarge it you can see, in fine print, the URL that will take you to where you can find it in chapter 5 of AR6:
https://www.ipcc.ch/report/ar6/wg1/downloads/report/IPCC_AR6_WGI_Chapter05.pdf#page=99
I added the orange box to highlight the (small) part of the image which supports your contention that, "greening is now turning into 'browning.' ... fertilization [has now been] overwhelmed by other effects... In other words, the greening has now stopped."
AR6 directly contradicts your contention, Rob. In fact, it does so in the caption on that very figure:
They could not have been clearer in stating that natural removal of carbon from the atmosphere is NOT weakening.
The authors did PREDICT a "decline" in the FUTURE, "if" emissions "continue to increase." But that hasn't happened yet, and the "decline" which they predicted was NOT for the rate of natural CO2 removals by greening and marine sinks, anyhow. Rather, that hypothetical decline was predicted for the ratio of natural removals to emissions, and their prediction is conditional, depending on what happens with future emissions ("if CO2 emissions continue to increase").
Well, predictions are cheap. My prediction is that natural removals of CO2 from the atmosphere will continue to accelerate, for as long as CO2 levels rise.
The "fraction" which they predict might decline, someday, doesn't represent anything physical, anyhow. (It is one minus the equally unphysical "airborne fraction.") Our emission rate is currently about twice the natural removal rate, so if emissions were halved, the removal "fraction" would be 100%, and the atmospheric CO2 level would plateau. If emissions were cut by more than half then the removal "fraction" would be more than 100%, and the CO2 level would be falling.
Rob, it's possible that your confusion on the greening/browning point was due to a widely publicized paper, with an unfortunately misleading title:
Wang et al (2020), "Recent global decline of CO2 fertilization effects on vegetation photosynthesis." Science, 11 Dec 2020, Vol 370, Issue 6522, pp. 1295-1300, doi:10.1126/science.abb7772
Many people were misled by it. You can be forgiven for thinking, based on that title, that greening due to CO2 fertilization had peaked, and is now declining.
But that's not what it meant. What it actually meant was that the rate at which plants remove CO2 from the atmosphere has continued to accelerate, but that its recent acceleration was less than expected. (You can't glean that fact from the abstract; would you like me to email you a copy of the paper?)
What's more, if you read the "Comment on" papers responding to Wang, you'll learn that even that conclusion was very dubious:
Sang et al (2021), "Comment on 'Recent global decline of CO2 fertilization effects on vegetation photosynthesis'." Science 373, eabg4420. doi:10.1126/science.abg4420
Frankenberg et al (2021), "Comment on 'Recent global decline of CO2 fertilization effects on vegetation photosynthesis'." Science 373, eabg2947. doi:10.1126/science.abg2947
Agronomists have studied every important crop, and they all benefit from elevated CO2, and experiments show that the benefits continue to increase as CO2 levels rise to far above what we could ever hope to reach outdoors. Perhaps surprisingly, even the most important C4 crops, corn (maize) and sugarcane, benefit dramatically from additional CO2. C3 plants (including most crops, and all carbon-sequestering trees) benefit even more.
Bob Loblaw wrote, "...I have no way of knowing whether our daveburton is the same Dave Burton seen in the discussions at Tamino's... The other Dave Burton's name shows up quite a few times, although he does not comment."
Yes, I'm the Dave Burton who Tamino intermittently criticizes. Unfortunately, when I try to comment on his blog, he nearly always deletes my comments, so I stopped trying. Suffice to say, if you like being misled, you should enjoy his blog. (Example.)
- Hansen predicted the West Side Highway would be underwater
Bob Loblaw at 22:34 PM on 7 July, 2023daveburton @ 29:
You seem to be under some serious delusions as to what the words "best", and "accurate" really mean.
You have no objective criteria to declare that The Battery and Honolulu are "the best" at representing anything other than local effects. Just because they have long records does not mean that they accurately reflect regional or global trends. You also state:
Beware of "global" sea-level analyses which use varying mixes of measurement locations. As you can see from the striking difference between Oahu and New York, sea-level trends vary considerably from one location to another.
So, you admit that single locations do not provide global trends - yet you seem to be arguing that the "best" way to get global trends is to ignore most of the other data.
You are clearly picking locations to try to tell the story you want to tell. That is not "accurate".
As for your quadratic fits: it has been pointed out to you over the past 10 years that quadratic fits mean nothing when the underlying data does not resemble a quadratic relationship. It does not matter if you "accurately" calculated the quadratic fit when the underlying physics says "not quadratic".
This discussion is also getting off topic for this rebuttal of Hansen's statement. If you want to continue to discuss sea level, there are better places here at SkS. Here are two SkS posts that provide some of the material from Tamino that I referred to earlier.
Has sea level rise accelerated since 1880?
- Hansen predicted the West Side Highway would be underwater
michael sweet at 21:19 PM on 7 July, 2023DaveBurton:
You are wastiing our time here with your obvious, deliberately incorrect graphs. I note that Tamino specifically addressed your deliberate mistakes as long as a decade ago. You have been wrong for over a decade and you are not informed enough to realize it. You have no excuse for your false claims. Neutral observers wonder why you persist in your obviously false claims for so long.
No-one here will give your garbage a second consideration. You will not convince anyone with your absurd claims. You need to go back to WUWT where they do not care about being lied to.
Every scientist who studiies sea level rise states that sea level rise has accelerated substantially. When you are alone claiming something and everyone who studies the topic professionally states that you are wrong you need to realize that you are not Galileo, you are simply wrong. Look at the pictures of fish in the streets all over the world.
You should go away. You contaminate a scientific site with pretend analysis.
- Hansen predicted the West Side Highway would be underwater
Eclectic at 09:10 AM on 7 July, 2023Indeed, Daveburton, the sea level is a complex subject. I applaud the detailed work you have done on some aspects of it.
Nevertheless, Dave, you have taken a relatively short-term look at some trees ~ while entirely failing to look at the forest. And failing to take a commonsense look at the underlying physics : the causes of long-term changes.
I am fairly sure you are not the Flat-Earth Scientist who completely discounts the role of CO2 in climate & consequent sea level changes (despite you consciously /subconsciously "trailing your coat" at the start of post #29 ).
My worry (for you) is that you have been "captured" by Motivated Reasoning . . . and that for a number of years now, you have not climbed out of the rabbit-hole.
So . . . good luck for self-examining your inner emotions & motivations. A scientific thinker must rise above his inner bias.
As OnePlanet says, it is the half-truths which are the danger [to one's own self, especially].
- Hansen predicted the West Side Highway would be underwater
Rob Honeycutt at 12:48 PM on 6 July, 2023I'm reasonably certain this is the same Dave Burton, Bob. I've come across him many times over the years. He operates the sealevel.info website. He's making the exact same claims. He's an IT guy who fancies himself an expert on sea level rise.
- Hansen predicted the West Side Highway would be underwater
Bob Loblaw at 10:50 AM on 6 July, 2023Oh, my. Commenter daveburton is certainly sending a lot of information our way. I am going to focus on his sea level acceleration claims in comment #10. In that comment, he links to two US locations (The Battery, in the NYC area, and Honolulu) for tide/sea level data, and gives us some quadratic equations to make a claim that sea level rise is negligible, and not much of a worry for the future.
Most regular readers here will also be familiar with Tamino's blog. Although Tamino has not been particularly active recently, over the years he has done a number of posts on analysis of sea level data. It turns out that a lot of those posts have the name "Dave Burton" showing up in them, either as a source of information that Tamino is debunking, or (on a few) as a commenter.
Now, I have no way of knowing whether our daveburton is the same Dave Burton seen in the discussions at Tamino's, but there is a similarity: they both like using The Battery and Honolulu stations as examples, and they both like fitting quadratic equations and arguing that there is little or no evidence for acceleration in sea level rise. To avoid confusion, I'll refer to the Dave Burton that is discussed at Tamino's as "the other Dave Burton".
I don't have the space or time to try to re-write everything that Tamino has written, so I'll just link to a few of his posts on the matter (well, nine) and provide very brief summaries.
The first Tamino post is from 2012, titled Unnatural Hazards. The other Dave Burton's name shows up quite a few times, although he does not comment. Tamino looks at The Battery data, plus a global sea level data set, and demonstrates why a quadratic fit is unsuitable. He also shows clear acceleration in the data. To provide a little graphic input for this comment, I'll included two of Tamino's figures:
A graph of the seasonally-detrended sea level at The Battery:

And a graph showing the rate of sea level change:
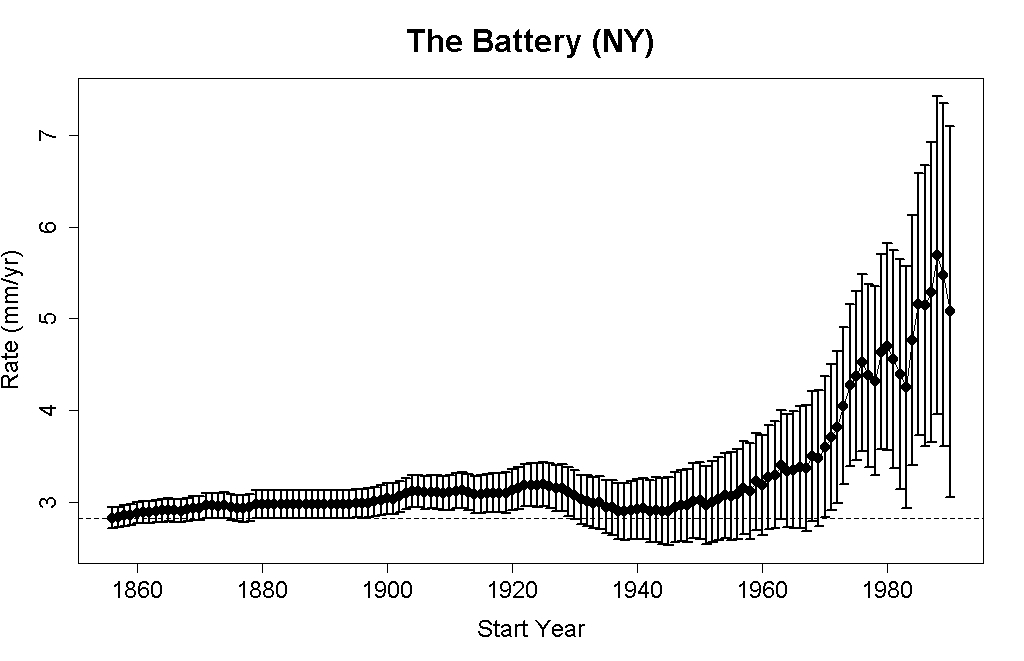
I"ll let you decide if you think this shows acceleration. Read Tamino's post for further details.
The next Tamino post isn't until October 2019. He had five posts from October to December, covering the following:
- Sea Level Rise. This post looks at acceleration in several global data sets, finding it present. The other Dave Burton comments extensively, and claims that "Honolulu is a nearly ideal place for sea-level measurement". He uses a quadratic equation to look for acceleration (and basically says it isn't significant).
- The next Tamino post is on Sea Level Acceleration. This post was prompted by the comments from the other Dave Burton on the previous post. Tamino looks at San Diego, Key West, Boston, St. Petersburg (FL), and Honolulu. Honolulu is the only one without acceleration. Tamino uses changepoint analysis to look for changes in linear trend. (Spoiler alert: he finds changes.)
- Further comments from the other Dave Burton lead to Tamino's next post, on Sea Level Accleration Denial. Tamino goes into more detail on the folly of the other Dave Burton's quadratic analysis, and explains more aspects of statistical testing for acceleration.
- Tamino's final October post is on Sea Level: Eastern North America. This post only has a passing mention of the other Dave Burton, but it is another excellent analysis along the entire east coast from the Caribbean to Canada.
- In December, we see another post on A Century and More of Sea Level Acceleration. Also only a passing mention of the other Dave Burton, but this post looks at several different sea level data sets, and includes more acceleration analysis.
It isn't until November 2021 that we see another Tamino post where the other Dave Burton is mentioned. This one is titled North Carolina Sea Level Rise: Problem Not Solved. (The other Dave Burton first came on the scene, arguing against forcing North Carolina developers to include future rapid rising sea levels in their planning.) Tamino quickly followed the first November post with another, titled Sea Level at Wilmington, NC (and other places). This adds another North Carolina station to the analysis.
And finally, in February 2022, Tamino posted on Sea Level Denial, where the other Dave Burton's name comes up again. This post has further looks at Wilmington, Cedar Key, Pensacola, and Key West.
Again, our daveburton posting here may not be the same as the other Dave Burton, but the arguments are much the same - and rife with the same errors. Let's hope that our daveburton can read Tamino's posts and learn from them The other Dave Burton certainly did not.
- Hansen predicted the West Side Highway would be underwater
One Planet Only Forever at 08:00 AM on 6 July, 2023daveburton,
I will try to limit how much I repeat any of the assistance others have provided to increase your awareness and improve your understanding of the issues. I will try to focus on aspects of your response @10 that have not yet been addressed.
I think it may be best to respond in reverse as follows.
Regarding: "Assumption #2: You seem to think that the CO2 level controls sea-level."
That is a misunderstanding of my comment. I am aware of and understand the following Common Sense Consensus knowledge:
Increased CO2 levels will result in a warmer global average surface temperature resulting in the reduction of the amount of water that is stored as ice supported by land (melting of ice supported by water does not change the level - unless the melting of that ice accelerates the flow of land supported ice to the ocean). Most of the water that is no longer "ice supported on land" will drain into the oceans resulting in a higher sea level (and this process will take a long time to reach a balanced state after CO2 levels stop increasing).
In addition to the sea level change due to melted ice, an increased level of CO2 in the atmosphere will result in an increased average temperature of the oceans. And water expands as it warms resulting in a higher average sea level in addition to the melted ice impact.
Regarding: "Assumption #1: You assume that there's such a thing as "a locked-in doubling of CO2.""
I was not assuming anything. I was presenting a hypothetical situation for consideration. That situation is a case where CO2 levels reach 560 ppm and stay at that level due to continued human impacts.
Simply asking what the sea level will be when CO2 levels reach 560 ppm will result in a vast range of answers. There are a diversity of cases where CO2 levels reach 560 ppm that would have significantly different expected maximum sea level rise. They include the following:
- CO2 rapidly reaching 560 ppm and continuing to rapidly increase. That will produce a low amount of sea level increase at the moment that 560 ppm is reached. But it would cause a much higher level in the distant 'balanced condition' of the future that will be established at some significant time after CO2 levels are no longer being increased.
- CO2 levels slowly reaching 560 ppm and continuing to slowly increase. That would result in a higher sea level when 560 ppm is reached that in case 1. But if the same 'maximum ppm level' as in case 1 is reached then the long term sea level rise would likely be comparable to case 1.
- CO2 level increases to 560 ppm then is held steady by continued human impacts (a locked in level of CO2). This is the case I was referring to. Indeed you misunderstood my comment.
- CO2 levels rise to 560 ppm and then are rapidly reduced by human industrial CO2 removal or other human impact changes that result in reduction of CO2 levels rather than a steady level of 560 ppm. This is closer to what an ethical consideration would conclude. The more ethical conclusion is that CO2 levels should not be allowed to reach 560 ppm. And human actions to remove CO2 from the atmosphere are required even though the CO2 levels do not reach 560 ppm.
Finally regarding your opening statement: "...why are you asking me "about the human origins of global warming"? My comment had nothing to do with that."
I was not asking a question. I was pointing out that the information you provided did not affect the conclusion of the OP. Your comment could be considered to be an attempt to use a 'new twist' of the "Hansen got it wrong" claim.
That raises a new question. Why did you make the claim you made @8?
- Hansen predicted the West Side Highway would be underwater
daveburton at 07:39 AM on 6 July, 2023Rob wrote, "that greening is now turning into 'browning.'"
Well, here's what AR6 shows:
Some people point to that little orange box and say that greening has ceased. That reminds me of the folks who say that the it's not as warm as the 2015-16 El Nino, so warming has ceased.
Philippe wrote, "There is probably a better thread for this argument,"
I agree. I was just trying to address OnePlanet's remark about a "locked in" CO2 level.
Philippe wrote, "There is only one factor that truly controls how green any region can be: water availability."
That's a common misconception. Elevated CO2 levels greatly improve plants' water use efficiency (WUE) and drought resilience. That's why elevated CO2 is especially beneficial for crops when under drought stress. It has been heavily studied by agronomists. Here's a paper about wheat:
Fitzgerald GJ, et al. (2016) Elevated atmospheric [CO2] can dramatically increase wheat yields in semi-arid environments and buffer against heat waves. Glob Chang Biol. 22(6):2269-84. doi:10.1111/gcb.13263.
Philippe wrote, "The experiences that have shown a CO2 fertilization effect were done in very controlled conditions and involved extremely high concentrations (800 ppm and up)."
That's incorrect. All major crops have been studied, and all benefit from elevated CO2. It is true that the greatest benefits accrue at 1000 ppmv or higher, but even modest CO2 increases significantly improve crop yields.
This recent study quantifies the effect for several major crops. Their results are toward the high end, but their qualitative conclusion is consistent with many, many other studies. They reported, "We consistently find a large CO2 fertilization effect: a 1 ppm increase in CO2 equates to a 0.4%, 0.6%, 1% yield increase for corn, soybeans, and wheat, respectively."
This study evaluated pine trees:
Idso, S., & Kimball, B. (1994). Effects of atmospheric CO2 enrichment on biomass accumulation and distribution in Eldarica pine trees. Journal of Experimental Botany, 45, 1669-1672.

As you noted, the effect is greatest with CO2 >800 ppmv, but, as you can see, even a much smaller CO2 increase has a substantial effect.
Rob wrote, "This entire paragraph is patently absurd and completely fabricated."
It is 100% factual, Rob. I'm surprised that you didn't already know it.
These figures are from that same AR6 Table 5.1 excerpt which I already showed you:
average CO2 removal rate in the 2010s = 2.7707 ppmv/yr
average CO2 removal rate in teh 2000s = 2.3481 ppmv/yr
These figures are from Mauna Loa:
average CO2 level in the 2010s = 399.91 ppmv
average CO2 level in the 2000s = 378.84 ppmv
(399.91-378.84) / (2.7707-2.3481) = 49.86
So a 50 ppmv increase in CO2 level accelerates the natural removal rate by about 1 ppmv/year.
49.86 / 2.1294 = 23.42 ppmv increase yields a +1 PgC removal rate increase.
I encourage you to do the calculations yourself for any other time period of your choice.
If you have the natural removal rate as a function of CO2 level (which we do), it is trivial to simulate the CO2 level decline if emissions were to suddenly cease. I wrote a little Perl program to do it; email me if you want a copy.
Rob wrote, "if true, the oceans would just continue to suck up all the atmospheric CO2 and we'd live on a frozen planet."
That's incorrect. The system progresses toward equilibrium, which is below 300 ppmv, but not zero.
Rob wrote, "rather that starting from a prior where all the published science is getting it wrong, and making stuff up... you don't have the requisite training to fully grasp the topic"
Rob, it's not necessary to resort to ad hominem attacks. I'm happy to document things that are surprising to you. You need but ask. Everything I've written is well-supported.
Rob wrote, "take some time to fully familiarize yourself with Henry's Law."
Due to the temperature dependence of Henry's Law, a 1°C increase in temperature slows CO2 uptake by the oceans by about 3%. But a 50% (140 ppmv) rise in atmospheric CO2 concentration accelerates CO2 uptake by the oceans by 50%. That's the main reason that ocean uptake of CO2 continues to accelerate.
- Hansen predicted the West Side Highway would be underwater
michael sweet at 07:27 AM on 6 July, 2023Dave Burton:
I note that the last time Carbon dioxide was over 400 ppm the sea level was more than 20 meters higher than current sea level.
Your sea level graphs are obviously flawed. A simple eye ball look at the data from the Battery in New York shows that at the start of the time period the data is above the fit line and at the end of the time period the data is way above the fit line. That means that the line does not fit the data and some sort of curved line is needed because the rate of sea level rise is increasing over the time period you chose.
In addition, you have cherry picked two single locations to do your calculations without justifying your choice.
Fortunately, Tamino did an analysis of sea level rise before he stopped posting analysis. (Tamino is a professional statistical data analyzer who has published on sea level rise). He analyized "the data for every tide gauge station in region 3 which had at least 360 months’ data (at least 30 years), at least 120 months of which (10 years of which) are since the year 2000 — after all, we do want to know what’s happening now. That leaves 10 stations". Since he used all the available data his data is not cherry picked like yours is.
Here is one of his graphs of the rate of sea level rise on the East coast of the Gulf of Mexico:

We see immediately that sea level rise does not follow a straight line but varies over the 100 year time from of analysis. Of particluar interest is the dramatic increase in sea level rise since 2010.
The dramatic increase in sea level rise observed since 2010 holds true for an analysis of the entire globe. Your analysis using a linear fit is simply incorrect and cherry picked.
I note that the rate of rise since 2010 is more than double all the previous rates.
We would expect that if the carbon dioxide content of the atmosphere remains above 400 ppm that the sea level will rise 20 meters plus. The question is only how fast the sea will rise. We see the rise is rapidly increasing every year now. Your linear fit deliberately hides the observed rise.
I note that the change in CO2 concentration in the atmosphere has rapidly increased over the past 50 years so one would expect the sea level change to rapidly increase over that time period. Including the data back to 1900 with a linear fit just hides the recent rapid increase in sea level rise.
Does anyone know how Tamino is doing?
- Hansen predicted the West Side Highway would be underwater
daveburton at 03:51 AM on 6 July, 2023Thanks for fixing those links, Rob. We were obviously typing simultaneously; you beat me to it by 7 minutes.
However, nothing I wrote was misleading. If you "follow the link to the actual IPCC page to read the full" table, you'll see that it shows exactly what I said it shows: as atmospheric CO2 levels have risen, the natural CO2 removal rate has sharply accelerated. (That's a strong negative/stabilizing climate feedback.)
The commonly heard claim that "the change in CO2 concentration will persist for centuries and millennia to come" is based on the "long tail" of a hypothetical CO2 concentration decay curve, for a scenario in which anthropogenic CO2 emissions go to zero, CO2 level drops toward 300 ppmv, and carbon begins slowly migrating back out of the deep oceans and terrestrial biosphere into the atmosphere. It's true in the sense that if CO2 emissions were to cease, it would be millenia before the CO2 level would drop below 300 ppmv. But the first half-life for the modeled CO2 level decay curve is only about 35 years, corresponding to an e-folding "adjustment time" of about fifty years. That's the "effective atmospheric lifetime" of our current CO2 emissions.
Moreover, it is not correct to say that "the ocean takes up about half of our emissions." Our emissions are currently around 11 PgC/year (per the GCP). The oceans remove CO2 from the atmosphere at a current rate of a little over 2.5 PgC/year, but they are not removing some fixed fraction of our emissions. If we halved our emission rate, natural CO2 removals would continue at their current rate.
Because human CO2 emissions are currently faster than natural CO2 removals, we've increased the atmospheric CO2 level by about 50% (140 ppmv), but we've increased the amount of carbon in the oceans by less than 0.5%, as you can see in AR5 WG1 Fig. 6-1. (It's not a problem for "sea dwelling creatures.")
In the oceans, biology generally trumps chemistry, and that is certainly true for CO2 uptake. Some people think that the capacity of the oceans to take up CO2 is limited to surface water by ocean stratification. But that's incorrect, beause the "biological carbon pump" rapidly moves CO2 from surface waters into the ocean depths, in the form of "marine snow."
The higher CO2 levels go, the faster that "pump" works. Here's a paper about it:
https://www.science.org/doi/reader/10.1126/science.aaa8026
Once carbon has migrated from the ocean surface to the depths, most of it remains sequestered for a very long time. Some of it settles on the ocean floor, but even dissolved carbon is sequestered for a long time. For instance, it is estimated that the AMOC takes about 1000 years to move carbon-rich water from high latitudes to the tropics, where it can reemerge. That is obviously far longer than the anthropogenic CO2 emission spike will last.
- Hansen predicted the West Side Highway would be underwater
daveburton at 17:24 PM on 5 July, 2023One Planet, why are you asking me "about the human origins of global warming"? My comment had nothing to do with that.
As for your first indented question, it appears that you've made two unjustifiable assumptions:
Assumption #1: You assume that there's such a thing as "a locked-in doubling of CO2."
If I understand you correctly, that means you think CO2 added to the atmosphere just stays "locked in" there, forever, and the longer we add CO2 to the air the higher the level will rise. Is that what you think?
If that's what you think, you're mistaken. CO2 doesn't just stay in the atmosphere. Nature is rapidly removing CO2 from the air, into other carbon reservoirs. The only reason the atmospheric CO2 level is nevertheless rising instead of falling is that we're adding CO2 to the air even faster than nature is removing it.
But it's becoming harder and harder to keep up with natural CO2 removals, because they're accelerating. This is an excerpt from AR6 WG1 Table 5.1, showing how the removals are accelerating:
LINK (Note: 1 PgC = 0.46962 ppmv = 3.66419 Gt CO2.)
At the current 420 ppmv level (i.e., 135-140 ppmv above a 280-285 ppmv baseline), those negative feedbacks already remove an average of about 5.5 PgC per year (= about 2.6 ppmv), and for each 20-25 ppmv increase in atmospheric CO2 concentration those removals accelerate by another 1 PgC/year.
With our current emission rate, the CO2 level is only rising by about 5.1 PgC/year (+2.4 ppmv). So it won't take much of a CO2 level increase before natural removals match our current emission rate: just (20 to 25 ppmv/PgC) × 5.1 PgC = (102 to 128) ppmv.
420 + (102 to 128) = 522 to 548 ppmv. That's the "plateau level" beyond which the atmospheric CO2 level cannot rise, unless our emissions increase further. If we were to continue our current anthropogenic emission rate indefinitely (or until the coal runs out), we'd still not quite reach 560 ppmv.
Assumption #2: You seem to think that the CO2 level controls sea-level. But the data do not support that assumption. Most coastal measurement sites have seen negligible acceleration in sea-level trend over the last century, even as the atmospheric CO2 level rose by 115 ppmv.
Here are the best long U.S. Atlantic and Pacific measurement records, respectively:
https://sealevel.info/MSL_graph.php?id=Battery&c_date=1923/6-2024/12
https://sealevel.info/MSL_graph.php?id=Honolulu&c_date=1923/6-2024/12
Both show a statistically insiginficant acceleration of 0.006 mm/yr² (± at least twice that) over the last century.
Hogarth studied many long measurement records, and concluded, "Sea level acceleration from extended tide gauge data converges on 0.01 mm/yr²"
That's very, very slight.
To calculate the effect of that acceleration use the following quadradic formula:
y = B + M·x + (A/2)·x²
where:
x is elapsed time
y is position or sea-level after time x
B is initial position or sea-level
M is current rate
A is acceleration
So (choosing some fairly typical values) if:
M = 1.5 mm/yr
A = 0.01 mm/yr²
x = 100 yrs
And if the trends were to continue:
y = B + 100·1.5 + (0.01/2)·100²
= B + 150 + 0.005·10000
= B + 150 + 50
= 200 mm = 7.9 inches
6" of that 8" is from the linear trend, and 2" of that 8" is due to acceleration.
However, there's a subtle twist. When acceleration is estimated by quadratic regression, we're fitting a quadratic curve to the measurement record to date. Extending that curve is the projection. But the curve's slope matches the linear tread at the midpoint, not at the end.
So, to find y (sea-level) 100 years from NOW, we should use x = 100+(L/2), where L is length of the measurement record.
So if we have a 100 year measurement record, to calculate the accumulated effect of the acceleration 100 years from now we should use x=150, not x=100.
Remember our formula:
y = B + M·x + (A/2)·x²
That last term is the effect of acceleration; using x=150 we get:
(A/2)·x² = 0.005·150² = 0.005·22500 = 112.5 mm = 4.4 inches.
So, an acceleration of 0.01 mm/year² is still negligible, but it's a "slightly bigger negligible."
A warming climate is know to have effects which both increase and decrease sea-level. Based on the negligible effect that the last century's CO2 increase and consenquent warming has had on sea-level trends, it is clear that, so far, the effects which increase and decrease sea-level must be similar in magnitude, and roughly cancelling.
So the assumption that a particular CO2 level "locks in" a particular sea-level is not justifiable. - 97% consensus on human-caused global warming has been disproven
michael sweet at 11:47 AM on 5 July, 2023Duran3d:
As has been pointed out, a consensus is a supermajority of those consulted. For IPCC reports they usually state what the consensus is for the least amount of harm from the discussed issue. For example, the IPCC sea level rise projections are set at what a consensus thinks are the minimum rise expected. That means that a large majority of scientists who study sea level rise think sea level rise will be greater than the IPCC consensus. Trying to minimize something that has already been minimized is not a consistant argument.
Claiming that it must be a unanimous consensus will not get you any traction here at Skeptical Science.
- Hansen predicted the West Side Highway would be underwater
One Planet Only Forever at 05:44 AM on 4 July, 2023daveburton,
Your observation does not change the conclusion that "..., we can stop using this conversation from 1988 as a reason to be skeptical about the human origins of global warming."
But it raises interesting questions you may be able to answer.
How much sea level rise at the West Side Highway would be 'locked-in (occur in the future)' by a 'locked-in' doubling of CO2 to 560 ppm?
What would the expected high tide levels be relative to the elevation of the lowest point of the West Side Highway?
And what flood levels and frequencies of flooding would likely be the result?
Note that in May of 2017 portions of the West Side Highway were flooded due to heavy rain and an inability to drain the areas quick enough. The level of such flood events are higher if the water level that they drain into is higher.
Also note that Hurricane Sandy (2012) also flooded many parts of New York.
- Hansen predicted the West Side Highway would be underwater
daveburton at 01:56 AM on 4 July, 2023It appears that Hansen added that "assuming CO2 doubled" caveat later. Many years later he claimed to recall that that's what he had said to Reiss back in 1988, but there doesn't seem to be any contemporaneous evidence of it.
Moreover, his claim doesn't pass the smell test, not only because of the implausibility of remembering such details years later, but also because in 1988 the atmospheric CO2 concentration was less than 352 ppmv, and it was rising by only 1.63 ppmv or +0.476% per year. For the CO2 level to reach 570 ppmv by 2028 would have required a wildly accelerated average annual increase of ((570-352)/40) = 5.45 ppmv or +1.21% per year.
The rate of CO2 level rise did accelerate, but only slightly. Over the last decade the atmospheric CO2 concentration has increased at an average rate of 2.45 ppmv or +0.603% per year.
With only five years to go before 2028, the average sea-level at The Battery in Manhattan has risen by only about 6.7 inches (some of which is due to subsidence), and the "West Side Highway" (Henry Hudson Parkway) is still about ten feet above mean sea-level. - Cranky Uncle: a game building resilience against climate misinformation
peppers at 00:56 AM on 19 June, 2023 Hi gentlemen. Rob, I start my logic from our worlds increase from 1 to 8 billion people. I dont know of anywhere this is made up or in dispute. I then premise that this describes mankinds addtional use of resources, including increased use that has elevated Co2. I will pause there until we are agreeing these premises are in agreement, but I will hint that this is a remarkable change in approaching this topic. If we do not agree that our population has rocketed up from 1 to 8 billion ( 8 billion reached November 22, 2022 ) in 200 years, after never going over 1 billion in the prior 180,000 years of human history, then we cannot really go to the next step of my ideas (thx).
Eclectic, hi. I understand infant mortality to be the measurement of human suffering over the large picture. That is how it is posed. I know it sounds off base and we should discuss cancer or heart disease, etc. But infant mortality has been the real beast to our existence. 50% in roman times, peaking to 62% I think in south american in 800AD. It has been at 50% in many place on earth into the mid 1800's. Today it is under 1% in the US, and about 4.35% globally with the third world locations providing the offsets of up to 8.5%. I posted a chart earlier on this thread.
Surprisingly, or not surprisingly, the eradication of infant mortality, the leap of our lifespans and the shear amount of people who now live to be an adult produces a chart that is an exact mirror to the hockey stick chart used to show our rise in Co2.
I hesitate to go further, but I will hazard it. If you see what I am referring to, much like the rise of people on earth to 8 billion; there is no going back. The world is different. The world is already different and there is no going back and the United Nations estimates we will continue to increase to just about 9.5-10B around the end of this century and then it will taper off on increasing.
I have not explored expectations of any decline but if it is expected I would imagine it would involve several hundreds of years. And only find a moderating level of some kind and not return to 1B.
- 2nd law of thermodynamics contradicts greenhouse theory
EddieEvans at 07:58 AM on 7 June, 2023scaddenp at 07:01 AM on 7 June 2023
2nd law of thermodynamics contradicts greenhouse theory
I've forgotten how to use this board and answer. I'm not clear on what you don't understand. The blanket analogy is a common metaphor because the Earth's heat is being trapped by greenhouse gases, not unlike Venus.
I understand that the Earth warms and cools, primarily, by the Malankovich Cycles and trapped greenhouse gases. Is someone saying otherwise, and if so, how do they explain worldwide glacier melt and sea level rise?
- At a glance - How reliable are climate models?
Eclectic at 22:26 PM on 30 May, 2023PSBaker @1 ~ you are quite right to say that the uncertainties re rainfall are making for a less relatable message to non-specialists [such as me ! ].
Rising sea level, rises in severity & duration of heat waves/ droughts/ floods are all important in the medium term. But a broad-brush picture of what the future holds, is quite sufficient for "us" to base our policy decisions on.
Mathematical delineation of uncertainties is relevant to the scientific specialist ( and especially to the hydrologist re rainfall variation) . . . but uncertainties are, for the rest of us, probably not worth addressing, unless you feel something misleading or nefarious is being concealed by their omission.
- 10 year anniversary of 97% consensus study
michael sweet at 02:54 AM on 26 May, 2023John Kerry was quoted addressing the British Parliment as saying:
"“If you have five tipping points, and two of them involve the potential of metres, literally multiple metres, double digits of sea level rise, that’s as good a definition of catastrophe as you can achieve.
“And the reality is that that is where we are headed unless we do more about it. Now, why do I have this measure of optimism and of our capacity? Because it is within our capacity."
I thnk in addition to multiple meters of sea level rise there are other potential consequences of climate chnge that would qualify as "catastrophic". Perhaps we could make a list.
I saw a projection of a billion climate refugees or more under some conditions. For me that is way past catastrophic.
How many human deaths in one year , or cumulative, before it counts as catastrophic? Only one if it is a close friend or relative.
What conditions do others here think would count as catastrophic. Perhaps we could find a consensus, Undoubtedly we all have different conditions that have to be met for the problem to be catastrophic.
I remember when the IPCC AR5 came out in 2014 with a list of severe consequences. I wondered at the time if I would live to see sea level rise causing damage, widespread fire storms, heat conditions killing millions etc. I was 56 at the time and thought I would live another 30 years. Now, only 8 years later, we see these problems already happening around the world. I can only imagine what it would be like in 2100 if we do not take as strong action as possible immediately.
In my experience, persons who ask for definations of catastrophic want to minimize the actions we take to try to avoid the already begun catastrophic climate change.
- 10 year anniversary of 97% consensus study
Eclectic at 23:03 PM on 16 May, 2023Michael @10 ~ yes, points taken.
But the question of time scale : that's probably best viewed by the usual legal yardstick of "reasonable" ~ that which would be reasonably expected over a reasonable timespan in reasonably predictable circumstances, as viewed by a reasonable person (or better, by a reasonable climate scientist). Does that sound reasonable?
A future sea level rise of 1 meter has been closely estimated as displacing around 230 million people. Presumably a rise of 2 meters would displace well over twice that number, and would destroy a far greater amount of fertile farmland into the bargain. Perhaps not a problem if occurring over 2,000 years ~ but not-quite-unbearably-catastrophic if occurring over the more reasonably likely timespan of 200 years.
In short, the term "catastrophic" is nearly useless.
Beg to differ on (your) suggestion of catastrophe definition by dollar scale. Too much room for endless wrangling there, whether the figures be $10 Trillion or $50 Trillion or $500 Trillion (not to mention if these figures are additional costs or partly-substitute costs +/- dependence on future unknowable technologies). Besides, oooooodles of zeros can have a stultifying effect on the average mind [such as mine].
Dollar scale is inferior to scale by Deaths & Displacements & Destroyed farmlands.
- 10 year anniversary of 97% consensus study
michael sweet at 21:32 PM on 16 May, 2023Is it "catastrophic" if sea level rises 2 meters in 1000 years, or do we have enough time to adjust? It would be catastrophic if sea level rose 2 meters in 5 years. You need an amount and a time. I think a cash amount is easiest to start with. Since it is a forecast you need a percentage chance. If the chance of catastrophe is only .01% most people would not care.
Is it more likely than not that climate damages worldwide exceed $10 trillion before 2050 or $50 trillion by 2100?
You could have a single value or two possible catastrophes. Or you could do human cost:
Is it more likely than not that Climate Change will result in over 100 million refugee by 2050? Or perhaps over 50 million deaths?
I think items like ecological damage are too hard to estimate. Single items like likely sea level rise are too specialized.
Scientists would have to offer heir opinion on topics that are not heir specialty. For example Zeke Hausfather gives good temperature descriptions, we want his thoughts on the chances of catastrophe. We only want opinions from experts, not just the man on the street or some paid fossil shill.
- 10 year anniversary of 97% consensus study
Eclectic at 12:15 PM on 16 May, 2023Perhaps "catastrophic" should only be used when quantified by % .
# 100% catastrophic = the Sun goes supernova
# 90% catastrophic = moon-size asteroid strikes Earth
# 30% catastrophic = sea level rises 2 meters
# 20% catastrophic = Floridian gets re-elected President
# 5% catastrophic = price of gasoline exceeds $8 per gallon
# 0.1% catastrophic = earthquake tsunami destroys New York.
Something along those sorts of lines. Quantification essential.
You can't intelligently manage to talk about it, if you can't measure it.
- Why the food system is the next frontier in climate action
One Planet Only Forever at 03:08 AM on 2 May, 2023Evan @6,
I briefly reviewed the 2014 Research Article you pointed/linked to (note it is almost 10 years old). I would update my previous comments to add that human actions causing increased N2O in the nitrogen cycle are to be considered the same way I refer to impacts on the carbon cycle. And I would add that there are other good reasons for more aggressive reduction of nitrogen cycle impacts than climate change (refer to Planetary Boundaries).
I will also clarify that reducing methane emissions from rice is still an opportunity for reducing the peak level of ghg impacts even if that methane could be considered to be ‘part of the natural carbon cycle (an action that does not increase the amount of carbon in the carbon cycle the way that burning fossil fuels or leaks of methane from fossil fuel operations or permafrost melting do).
More specifically, the report’s evaluated floor level of non-CO2 emissions from food production and consumption (Global total 7 GtCO2e/year by 2050 with more if population continues to grow beyond 2050 and also influenced by 'potential changes of attitudes towards being less harmful') appears to be based on the perceived willingness of the UK population, at the time the report was prepared, to learn and be less harmful consumers. And the evaluated UK willingness is extended globally with all people expected to want develop to live in ways comparable to the less harmful ways that the UK population was evaluated to be willing to live.
The following is a quote from the “Options and barriers to mitigating food system non-CO2 emissions - Agriculture” section of the Research Article:
“For both N2O and CH4, socioeconomic and environmental circumstances dictate the extent to which changed agricultural technologies and practices can deliver cuts in emissions at a systems level. Stakeholders suggested that important factors influencing uptake of mitigation options affecting the UK revolve around cost, dominant practices, the aging farming community and attitudes of ‘young farmers’, existing infrastructure, cultural norms, changing climate as well as a feedback linked to levels and patterns of consumption.”
A quote from the “Options and barriers to mitigating food system non-CO2 emissions - Consumption” section of the Research Article:
“Within the UK consumption-based scenarios, the most significant dietary change considered was a 70% per capita cut in meat consumption, with the deficit replaced with rises in other food types. However, even with changes to per capita meat consumption, absolute emissions levels are driven by population growth (consistent across the scenarios) as well as growth in per capita consumption levels. Population growth per se strongly constrains N2O mitigation, as crops for consumption and for feed for livestock continue to require manure or mineral fertilizer. Barriers to changing patterns of consumption are confirmed through consumer focus group analysis: moderate changes in meat consumption (20% per capita) were considered in line with financial pressures to reduce expenditure given the context of the 2009–2012 recession, whereas a 70% reduction was perceived too substantial a change for many [Citation33].”
That indicates that the evaluation was (likely unwittingly) biased by accepting questionable opinions like ‘the higher cost of being less harmful is a valid reason to be more harmful’ and ‘the developed popularity of eating more meat is a valid reason to not reduce meat consumption’. Note that I tried to present both of those points in a way that highlights that populist political misleading messaging significantly caused those attitudes to develop to be so influential that they compromise the evaluation and the way it is reported.
Quote from “Discussion - Implications for cumulative GHG emissions”
“Finding ways of reliably reducing non-CO2 emissions will become increasingly pressing as global demand for food rises. A wide range of feasible CH4 mitigation options were put forward by stakeholders, taken from the literature and quantitatively assessed during the scenario process, providing evidence for greater scope for achieving substantial CH4 mitigation than for N2O. This, coupled with the much longer lifetime of N2O compared with CH4 as well as the influence of carbon cycle feedbacks in raising the GWP of CH4 from 21 to 34, highlights the critical importance of fully exploiting CH4 mitigation potential whilst increasing the research effort towards developing agricultural systems that can minimize N2O production.”
That indicates that if the developed research bias is corrected there could be more reduction of N2O resulting in a lower ‘floor level’.
Quote from “Discussion - Implications for managing and mitigating CO2”
“The focus here on non-CO2 reinforces other studies that identify the existence of an emissions floor, further emphasizing an urgent need to mitigate CO2 emissions where it is most feasible and quickest to do so. The higher the non-CO2 floor, the more rapidly CO2 emission cuts are needed within the constraints of a chosen climate target. Conversely, relying on a low or non-existent emissions floor suggests a larger CO2 budget is available, again relaxing the rates of mitigation for a chosen climate change target, delivering a more palatable but less realistic assessment of the climate change challenge.”
This emphasizes that the learning from the report is that more rapid efforts to reduce fossil fuel use are required.
Quotes from the “Conclusion” of the research article:
“A continuation of absolute growth in global N2O emissions, despite assuming optimistic mitigation has, because of cumulative emissions, direct implications for how urgently and deeply to cut both CO2 and CH4 for an assumed climate target.”
This reinforces the need for more research to reduce N2O and the need to more aggressively cut CO2 and CH4 unless new research develops viable ways to rapidly reduce N2O.
“As energy systems become decarbonized, global non-CO2 emissions largely associated with food consumption and production will increase in the share of annually produced GHGs. Emphasizing the importance of making cuts in food-related emissions highlights an urgent need for policymakers in Annex B nations to consider not only technological and supply-side interventions, but tackle the thorny issue of levels and types of consumption. Unlike large-scale infrastructure developments, measures tackling consumption and demand have the potential to cut emissions of CO2 and non-CO2 alike in the short term and could improve the diminishing chances of remaining within the carbon budget commensurate with the 2ーC threshold.”
That highlights the need for policymakers to “tackle the thorny issue of levels and types of consumption” because the reports conclusion is that current over-developed populations are not as willing to be less harmful as they should be.
A quote from the “Future perspectives” part of the research article:
“If the challenges posed by climate change are to be overcome, at least in part, a meeting of minds to define problems can offer new, much needed insights. This is already emerging in some quarters, with an increase in interest from research funders around the food–water–energy nexus as well as a rise in the number of researchers keen to engage in genuinely interdisciplinary activity. Of course disciplinary research may, out of necessity, continue to dominate, but the emerging expertise in interdisciplinary research needs support and encouragement given the extent of the systemic and complex challenges facing society.
"The climate change challenge becomes ever more urgent each year, with time limiting the options available for mitigating emissions to be largely those that can deliver change in the short term. Perhaps with agronomists, biologists, engineers, political and social scientists working increasingly in single units, systemic ‘solutions’ to the climate challenge can be found. Specialists in demand and consumption require the same prominence in the portfolio of research endeavour as technologists, physical scientists and engineers. Only then will resilient options be derived and ultimately implemented in a timescale befitting of the scale of change facing society.”
- Extreme heat waves in Europe may be linked to melting Arctic sea ice
Bob Loblaw at 10:57 AM on 1 April, 2023Thanks for the link, Gordon. For future reference, when you provide a quote like that one, it really helps if you give a proper link to the source, rather than leaving people guessing.
I can find that quote on page 22. There is very little context there. They repeat the 40,000 number on page 37, where they say:
Gallagher Re estimates that as many as or more than 40,000 excess deaths were recorded between June and August from heat-related activity in the region, which particularly hit the UK, France, Spain and Portugal. This was conducted based on national-level mortality analysis.
and then again in the appendix tables on page 52. In none of those cases do they provide any further details on the analysis method.
Without details on the analysis method, there isn't much hope in trying to come up with an explanation of why they attribute European summer deaths to heat, and other spikes are attributed to other causes. The original quote you provided does state that this was a "preliminary estimate", which suggests that it was not as thorough as they would like.
You may wish to read this Reaclimate post on heat-deaths vs cold-deaths under a warming climate. It mentions that winter mortality rates in Europe are normally higher - but hopefully an "excess mortality" assessment would take this into account.
The Eurostat link in comment #1 does not tell us if the 19% "sharp rise" in December 2022 is within a normal range of variability for December, and it does not tell us if they use individual monthly averages for each "excess death" calculation, or an average over several months, a full year, or several years. The quote I gave in comment #2 contains values for four other peaks in the past three years - two in April, and two in November. That suggests that they might not be making monthly base/reference calculations - but it's really hard to tell.
Methodology is critically important in these sorts of calculations.
- CO2 effect is saturated
MA Rodger at 18:41 PM on 24 March, 2023Gootmud @680,
Responding to the individual detail of your post not addressed so far:-
☻ The blanket analogy is not useful when the detailed mechanism of AGW is considered. The temperature of the air against the outer blanket will remain effectively constant when extra blankets are added. The emission-to-space altitude of the planet at the CO2 IR-emitting frequencies (and thus the temperature which dictates the level of emission-to-space) varies with the level of CO2 in the atmosphere. CO2 is well-mixed up to 50km and more.
☻ Convection is not a great player in cooling the planet. The atmospheric cells of the troposphere are responsible for the trade winds and if convection were significant, these would be premanently of super hurricane strength. It takes about two weeks for a packet of air to rise to the tropopause in these cells and potentially half the convection is seen in cyclones which are relatively rare events.
☻ Pretty-much all CO2 molecules excited by IR lose their excitation through collision. There are many many more CO2 molecules excited by collision and the level of IR-emission is thus determined by air temperature which sets the level of collision.
☻ Sympathetic emission from an excited CO2 molecule (your laser effect) occurs at all altitudes.
☻ The greenhouse effect from increased CO2 is not linear except when CO2 levels are very small. For higher levels, the relationship is rougly logarithmic. This the forcing resulting from CO2 levels increasing 200ppm to 400ppm would roughly equal that of 2,000ppm to 4,000ppm. There is actually a boost above that logarithmic relationship for high levels of CO2, beginning at ~1,500ppm, as an emissions frequency at around 10 microns begins to be significant. In this, you may find Zhong & Haig (2013) 'The Greenhouse Effect & Carbon Dioxide' a useful read.
- The Big Picture
Bart Vreeken at 21:31 PM on 22 March, 2023N R N P @168
Shall I have a try in answering your questions? I live in The Netherlands and here we have the same kind of discussions. Excuse me in advance for my English, it seems to be horrible.
A. Changing for the worse?
I hope we do agree that the earth is warming. It's an on going process and we (science) expect that it will go on for a much longer time. So it gives a lot of changes in the climate almost everywhere.
A key point is that the continents and the oceans are warming in a different speed. The oceans are warming much slower. This has consequences. When the atmosphere warms up it can contain more water vapor. But the less warming ocean can't deliver enough water vapour to keep the more warming continents humid enough. As a result there is more risk for drought at many places.
An other thing is that the air whole circulation will change. It means that local climates can change more than the global average. Wet climates can turn to dry climates, but also the other way round. Our agriculture, infrastructure and houses are not (always) prepared for that.
As you know, a warmer climate makes the sea level rise. The warmer water in the ocean expands, the ice sheets and mountain glaciers are melting to a certain extent. This sea level rise will give a lot of problems in many coastal areas. Here in the Netherlands the protection against the sea is very well organized, we can manage the first one or one-and-a-halve meter in this century. When it gets more we have a problem, but we are already try to prepare for that. Other countries, including deltas in Asia and parts of the US are less protected and will have large problems before 2100. By the way, it's not only the sea level rise there. Many of these places have also subsidence of the land, but these two come together and the problems are coming much faster then without sea level rise.
And then there is the unpredictable part. We don't know exactly how the ice sheets will react. Maybe there are mechanisms for a quick decline of parts of the ice sheets. In that case we have less time to prepare for it.
Of course, there can also be places where the climate gets better, or at least in a part of the year. And at least, we will need less fuel for warming the houses. (but more electricity for cooling in the summer.)
An interesting point is the direct effect of the increasing CO2 level to the vegetation and the agriculture. Plants can grow faster with that. Remote sensing shows something like 'global greening'. But it's a mixture of natural response and increasing agriculture. The last thing is tricky when water recourses are limited. And as we have seen, the increasing risk for drought is a cause for concern by itself. Maybe you know the story of the Aral See?
Then your question B) changing because of human activities?
Yes, we can be sure about this. We could calculate the effect of increasing CO2 hundred years ago and it's just what happening. Other possible factors, like changing sun power don't have much effect, these changes are too small. The less known part is how the atmosphere reacts (water vapor, clouds), how the ocean circulation reacts, how ice sheets react in detail.
"C) why this time it is different than the changes that have taken place?"
The changes are going very fast now, and as I said, the houses, the infrastructure, the agriculture and the water supply are not prepared for these changes. And there is the risk for sudden, even faster changes (tipping points). - The Big Picture
Bart Vreeken at 05:57 AM on 22 March, 2023Hi Rob @153
"the gravitational effects from the Greenland ice sheet are not going to reduce the Netherlands' risk from sea level rise."
Looks like you still don't understand the topic completely. I stated that only 12.5% of the meltwater of Greenland comes to the Netherlands. So yes, the gravitational effect does reduce the risk from sea level rise in NL a little.
"You were not the first to create temperature bars on a graph"
When I started with that I hadn't seen it anywhere else. But of course I can't oversee everything. I didn't research the complete Internet then. My remark about the inspriration for the Climate Stripes was just my opinion, just a site remark and not my main message of @131. You make it more important then it was.
- The Big Picture
Rob Honeycutt at 05:29 AM on 22 March, 2023Bart... "You already do."
Yes. I tend to take exception when people accuse others without justification.
I also notice a pattern here where you don't fully research your claims once you've determined what you want to believe. You were not the first to create temperature bars on a graph, and the gravitational effects from the Greenland ice sheet are not going to reduce the Netherlands' risk from sea level rise.
When you make claims like these it's very important to take the time to be thorough and accurate with what you're stating, and I don't see that you're taking the time to do that.
- The Big Picture
peppers at 02:50 AM on 21 March, 2023HI One World, and also Rob made some sea level comments as well.
Im sorry I don’t have more time, and some of you commit large swaths of time here and I appreciate that.
Using NASA data, presuming they have the best resources and equipment, satellites and those argo sea probes et al. to gather original data, they show sea level rising since 1993 to be 3.8 inches.
https://sealevel.nasa.gov/
But what I think you are trying to indicate, and what the graphs show mostly, are that the rate of sea rise increases as the warming continues higher and higher. An exponential effect is presented. So taking past temperature increases will not explain future expected gains. It is either an exponential increase or the suggestion is that the increase is delayed so that as we go up in temperature, the rise happens decades later and there is a build.
I think we have finished with the run away suggestions for nature. The train bearing down on a child and all that. I see that as tactics to get people to listen and pay attention, but nothing true in our environment. Nature balances. She reacts. This Co2 rise is a reaction and right now she is reacting to this human population boom, which is unprecedented in history. And all the energy use associated with all these new counts of people on earth, living longer and healthier than ever, this is increasing Co2 counts and enriching our surface world in all the ways Co2 can do that.
Nasa used 4-5 scales to predict sea rise, 1. tracking if nothing is done, 2. some is done and 3. complete zero new emissions is achieved ( which cannot happen until the population levels out in 60 or so years ).
By 2100 there is Nasa modeling of .4 to .8 meter rise, using the data set of 2. some is being done. Doing what we can will be instrumental in keeping high tide from being higher than usual in that future time. I’ve tries to stay with the median predictions, so this is not discrepancy conversation of the outer 5%’s.
Science American believes no new storms are made but the severity of moisture based storms may increase by 2-4 miles per hour. The threat of sea rise is about the most serious threat.
I understand better where you are coming from. I still have the higher philosophical orientation to grapple with.
If mankind has finally achieved the goal of conquering the mission of dreams pondered throughout the pain filled ages, of solving misery and pain and finding medical success beyond any expectations. Is this worth it? A sea level rise?
The highest gain has been with infant mortality, which has plummeted from the high middle ages at 400-500 per thousand to 5.5 infants per thousand today. Think of all the occasions of birth deaths which also took the mother too, to quantify misery. That and antibiotics alone have caused this phenomenon of Co2 rise. Life spans have increased 61%, living conditions have soared, medicine is in a wonderland of abilities and birth to adulthood stats are beyond anyone’s wildest dreams. The question is; is that worth a side effect of sea level rising a foot and a half, maybe 2 feet at high tide.
This endeavor appears to goad and cajole and shame people using fossil fuel and I suppose that is the fastest way to get attention. But I do not believe it to be honest. This appears to be unwittingly human caused and one must decide if it is worth the subsequent consequences ahead. It is not from derelict and wanton people, it is from the results of scientific achievement, sought after for ages and finally achieved within the science that coincided with the industrial revolution. The origin of this is important to be able to consider context to this issue. If I were there and had the choice in my hands, I’d have us standing exactly where we were today. Reducing Co2 is still important, but I wouldn’t be bullying any brothers from any mothers over this. It is important, but not that important all things considered.
More than 100 comments found. Only the most recent 100 have been displayed.
More than 100 comments found. Only the most recent 100 have been displayed.


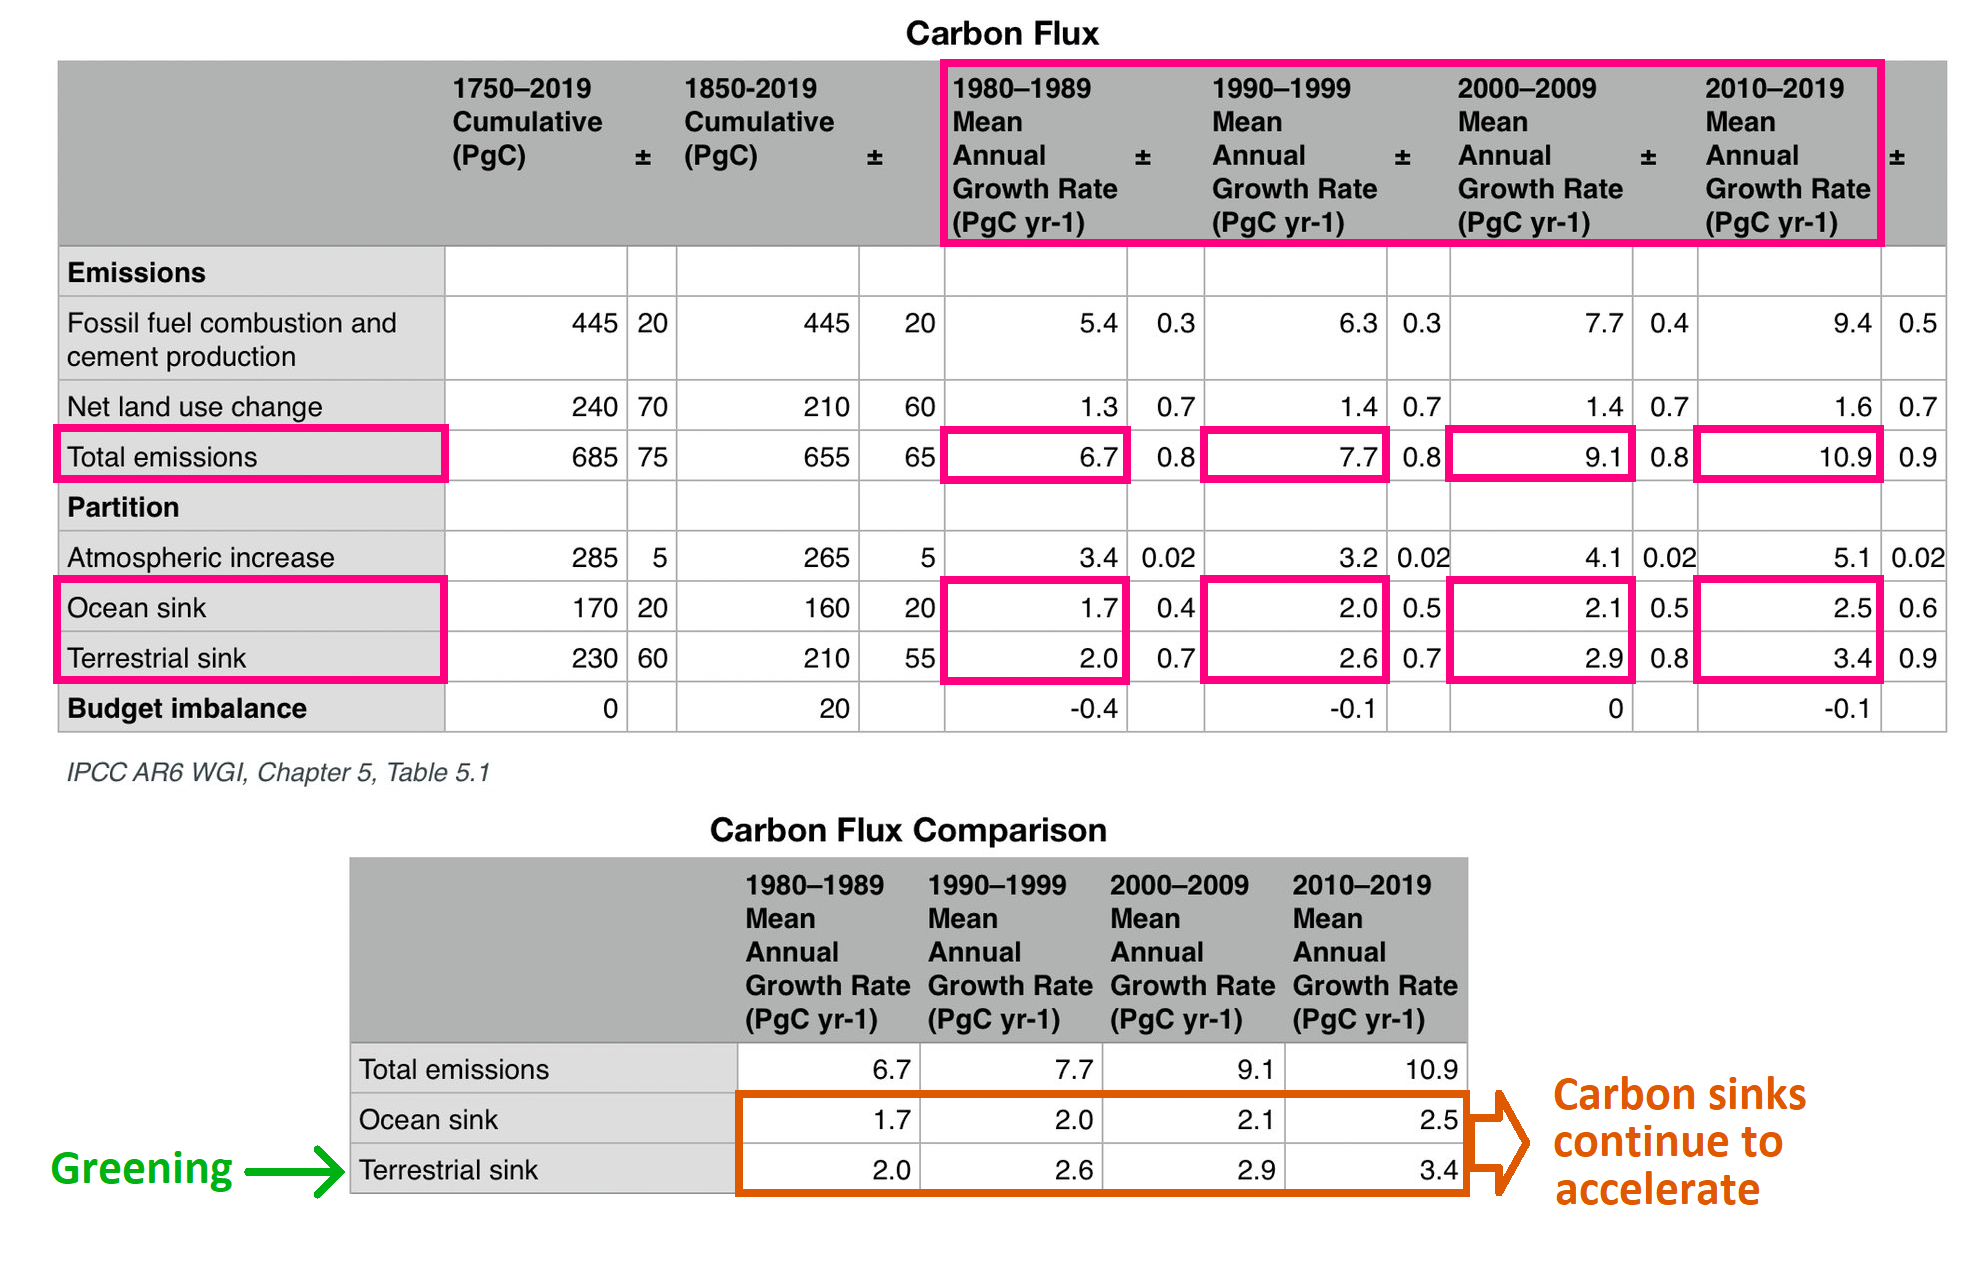
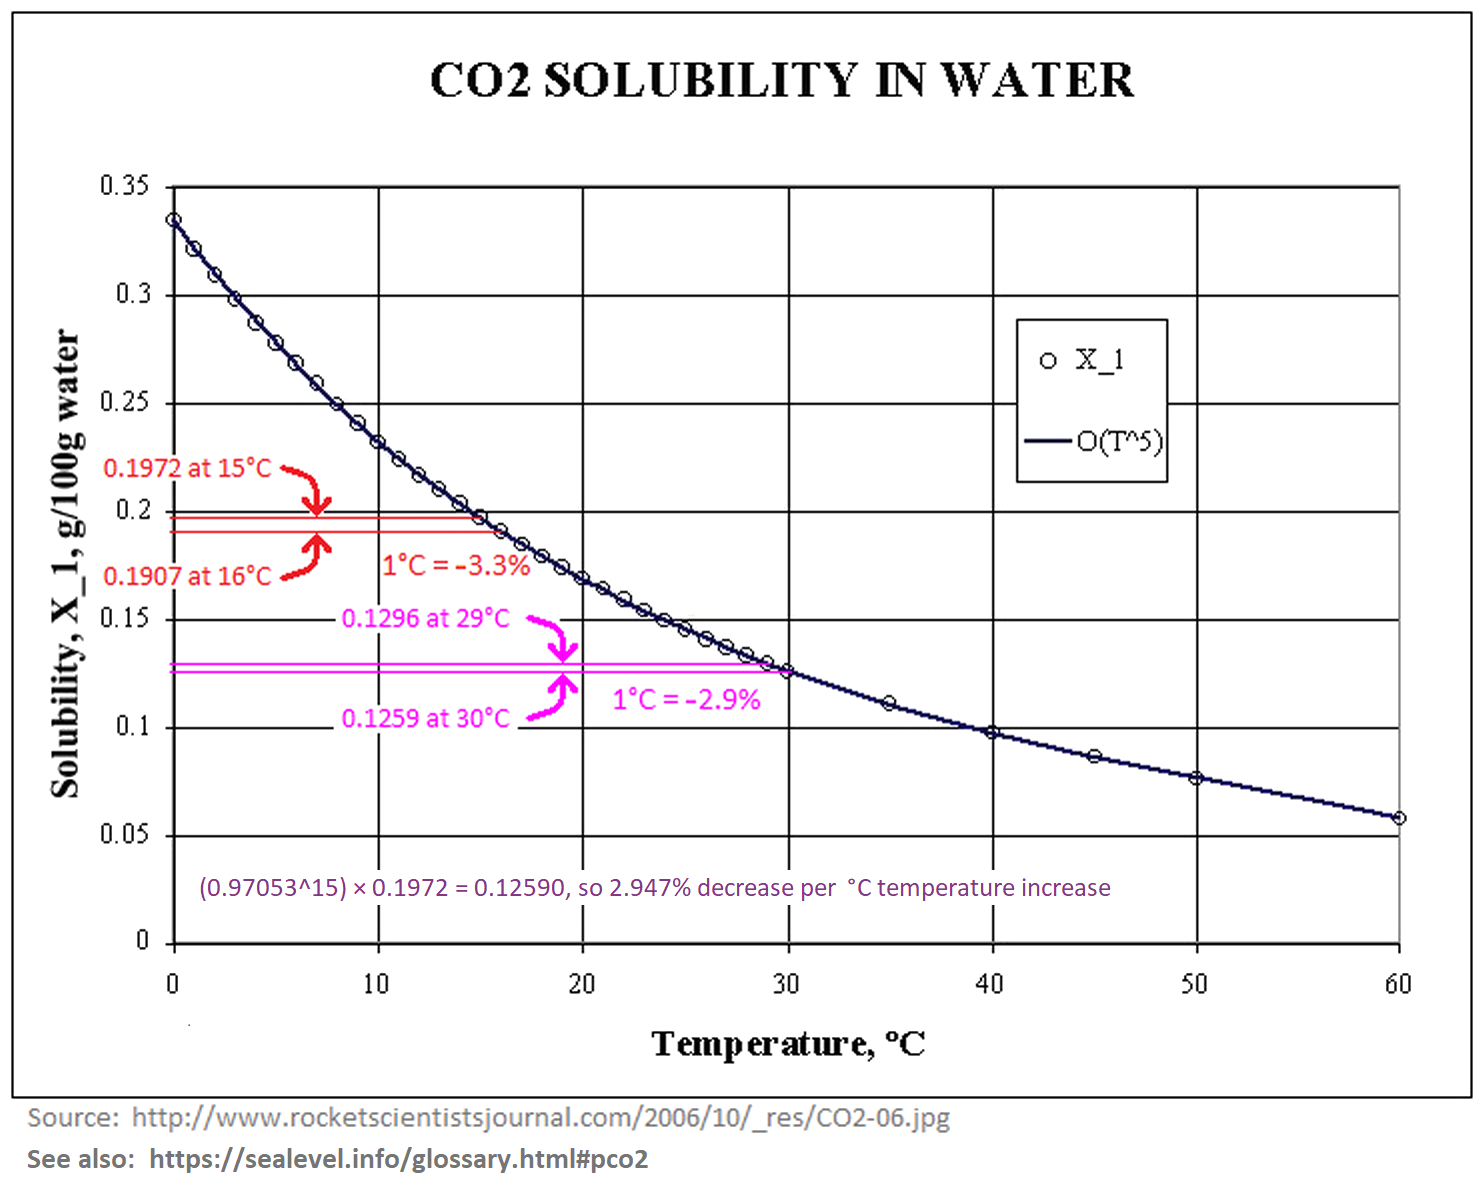
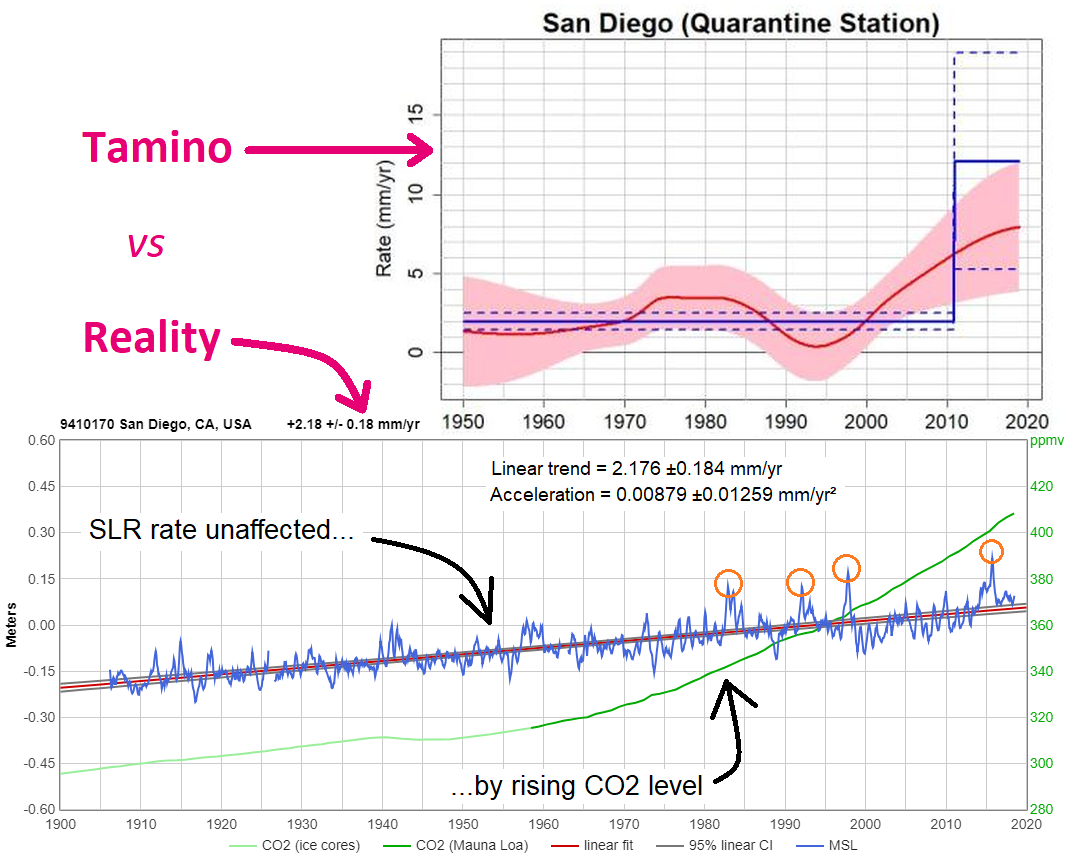
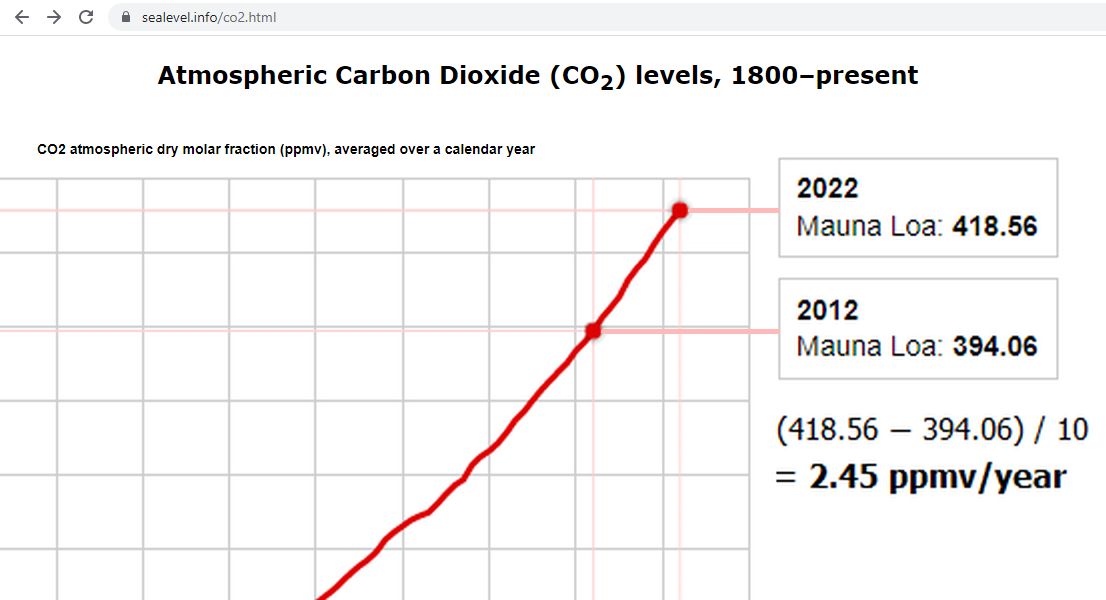
THE ESCALATOR

(free to republish)