


 Arguments
Software
Resources
Comments
The Consensus Project
Translations
About
Support
Arguments
Software
Resources
Comments
The Consensus Project
Translations
About
Support
![]()
![]()
![]()
![]()
![]()
![]()
![]()
![]()
![]()
![]()


![]()


Latest Posts
- Pinning down climate change's role in extreme weather
- 2024 SkS Weekly Climate Change & Global Warming News Roundup #17
- Fact Brief - Is Antarctica gaining land ice?
- Simon Clark: The climate lies you'll hear this year
- Skeptical Science New Research for Week #17 2024
- Water is at the heart of farmers’ struggle to survive in Benin
- At a glance - The difference between weather and climate
- India makes a big bet on electric buses
- 2024 SkS Weekly Climate Change & Global Warming News Roundup #16
- EGU2024 - An intense week of joining sessions virtually
- Skeptical Science New Research for Week #16 2024
- How extreme was the Earth's temperature in 2023
- At a glance - Is the science settled?
- What is Mexico doing about climate change?
- 2024 SkS Weekly Climate Change & Global Warming News Roundup #15
- Fact Brief - Did global warming stop in 1998?
- Skeptical Science New Research for Week #15 2024
- EGU2024 - Picking and chosing sessions to attend virtually
- At a glance - The Pacific Decadal Oscillation (PDO) is not causing global warming
- Climate Adam: Is Global Warming Speeding Up?
- 2024 SkS Weekly Climate Change & Global Warming News Roundup #14
- Gigafact and Skeptical Science collaborate to create fact briefs
- Skeptical Science New Research for Week #14 2024
- How can I make my retirement plan climate-friendly?
- At a glance - Global warming and the El Niño Southern Oscillation
- A data scientist’s case for ‘cautious optimism’ about climate change
- 2024 SkS Weekly Climate Change & Global Warming News Roundup #13
- Skeptical Science New Research for Week #13 2024
- You can start applying for the American Climate Corps next month
- At a glance - Human fingerprints on climate change rule out natural cycles
Comment Search Results
Search for solar radiation
Comments matching the search solar radiation:
- Climate - the Movie: a hot mess of (c)old myths!
Eclectic at 15:33 PM on 3 April, 2024Jimsteele @83 :
Certainly the ocean skin surface is the gateway through which heat enters & leaves the ocean. (Other than the large flux of solar radiation which penetrates deeply into the ocean ~ we scuba divers can definitely see that occurring ! )
But as I mentioned above, the skin surface dynamics do not disturb the long-term equilibrium of energies, over the course of days and years. Surely that is obvious to you. Please do not confuse & distract yourself with the ephemeral fluctuations in the surface few microns of oceanic water.
Also ~ do not distract yourself with thinking about the different heat fluxes in the tropic / temperate / and polar zones of the planet. Those zones have their own long-term equilibrium positions, and their existence (and fluctuations) won't change the medium-term equilibrium of the total planet.
Second ~ please educate yourself about the paleo history of Earth . . . and its "iceball" phases. Yes, the paleo evidence indicates low armospheric CO2 produces "iceball" oceanic freezing. In addition to that evidence, the basic physics of Earth's planetary orbital distance and the incident solar radiation on Earth . . . indicate that the Earth's oceans would become meters-deep in ice, if the atmospheric "greenhouse" effect were to disappear.
Jim ~ you would lose all scientific credibility if you assert that the so-called greenhouse effect does not exist. Please step back from the brink . . . and reconsider your position.
- Climate - the Movie: a hot mess of (c)old myths!
Eclectic at 12:13 PM on 3 April, 2024Jimsteele @76 :
You have answered incompletely. Have I missed something basic in physics or in logic ? e.g. ~
Solar shortwave radiation -> ocean
ocean heat -> atmosphere by molecular vibration and by IR radiation
atmospheric heat -> ocean (predominantly by molecular vibration, but a small component of IR radiation too)
CO2 -> greenhouse effect -> lower atmosphere warming [lapse rate]
Ergo, CO2 provides a large (but indirect) amount of ocean warming.
?
- Climate - the Movie: a hot mess of (c)old myths!
Eclectic at 11:02 AM on 3 April, 2024Jimsteele : help me understand your position.
m
At the most basic level :- solar radiation at visible wavelengths does penetrate 10's of meters into the ocean. (As a scuba diver, I can vouch for this.)
At other wavelengths, into the infrared & longer, there is shallow or deep penetration, but the actual penetration flux is tiny in comparison to the visible light. (That includes the infrared flux radiated from CO2 in the lowermost few meters of atmosphere.)
Then we have a large flux of energy (both out of and into the ocean) from molecular vibrations at the ocean/air interface ~ vibrations of molecules of water / water vapor / nitrogen / and oxygen. I have not chased down the magnitude of such flux into and out of the ocean ~ but presumably that magnitude is huge.
In summary ; the ocean receives heat predominantly from light energy and from conduction from the atmosphere. CO2 molecules have only a very tiny direct ocean-warming effect ~ but arguably a huge indirect warming effect through CO2's action as a greenhouse gas warming the planet's atmosphere.
Have I understood that correctly ?
- Climate - the Movie: a hot mess of (c)old myths!
scaddenp at 07:44 AM on 3 April, 2024jimsteele - well I havent heard that myth for a decade or so. So solar output isnt increasing but solar heating is?? I suggest that go over to Science of Doom who dealt with subject exhaustively in 2010. (4 parts in the end) If that doesnt convince you then I wont waste my time.
- Climate - the Movie: a hot mess of (c)old myths!
Charlie_Brown at 02:15 AM on 30 March, 2024Two Dog @32
The reason for a plateau in the temperature data in the 50’s, 60’s, and 70’s (the 40’s were relatively hot, so a setup for part of the reason for a plateau) was large increases in air pollution, primarily sulfates, that reduced solar radiation incident on the Earth’s surface. SO2 control systems were installed to prevent acid rain and that cleaned up the sulfates. Don’t be fooled by data cherry-picked for the short term to mislead about the global warming over the longer term of 150 years.
We know that current warming is not, not even in part, caused by the same historical factors observed in the temperature record because none of those historical factors are supported by the evidence. E.g., it is not the Milankovitch orbital cycles around the sun that caused ice ages in the past. Meanwhile, man-made increases in GHG concentrations have never happened before in the history of the planet. The mechanism of warming from increasing GHG is well understood and well supported by evidence. - CO2 lags temperature
Charlie_Brown at 09:26 AM on 16 March, 2024RBurr @ 654
1) CO2 lags temperature rise at the end of an ice age because CO2 evolves from ocean waters as the temperature rises. This is Henry’s Law. In that case, temperature rises first due to the Milankovitch Cycles. Note that ice age temperatures cool slowly and warm rapidly. Modern CO2 emissions are different because they come from burning fossil fuels. Therefore, temperature rises as a result of CO2. Cause and effect in both cases is clear in both cases, and different in both cases.
2) The quantum mechanical mechanism on IR radiation that explains the greenhouse warming theory has been proven. It is based on fundamental principles of energy balance and radiant energy transfer and has been verified by massive amounts of data, cross-checks, and validation.
3) The Earth’s energy “balance” is fundamental:
Input = Output + Accumulation
Output is reduced as greenhouse gases increase. Thus, energy accumulates.
4) Your description of quantum mechanics does not make sense. Quantum mechanics is fundamental to the specific frequencies (i.e., wavelengths) that are absorbed and emitted by CO2, CH4, and H2O. There is a huge amount of energy carried by IR radiation. It is naturally emitted (not dissipated) and lost to outer space by IR. By the overall global energy balance at steady state:
Input solar = Reflected solar + Emitted IR
Accumulation is zero at steady state, as before CO2 emissions of the industrial revolution.
5) The hot object in this case is the sun at about 5800 Kelvin. That is more than hot enough to warm the earth. The temperature profile is 5800 K of the sun to 288 K (60F) of the Earth 217 K of the lower stratosphere to 2 K of outer space. Increasing CO2 reduces the energy loss to space at specific wavelengths (e.g., approx. 13-17 microns). The absorptance/emittance lines in that range increase, meaning that energy is emitted from a cold 217 K instead of a warm 288 K. This upsets the energy balance. The balance is restored by accumulating energy until the surface temperature increases enough to make up the reduction by CO2. Nothing about this violates either the 1st or 2nd law of thermodynamics. Some mistake the 2nd law by describing the energy balance being at steady state, but the steady state was upset by increasing GHG.
6) Neither the Milankovitch Cycles nor the Schwabe Cycles (sunspots) explain the cause of modern global warming. The long-term Milankovitch Cycles have not been in a period of significant change for the last 12,000 years after warming from the last ice age. Measured radiosity data from the sun show that short-term Schwabe Cycles have not changed significantly either and do not explain modern warming.
- CO2 lags temperature
RBurr at 08:51 AM on 15 March, 2024The analogy was cute, that the observation that CO2 rises lag temperature rises, means that the Temp rise causes the CO2 rise, is a bit like saying that chickens do not lay eggs because they have been observed to hatch from them. I would submit that, by the same token, opining that CO2 increases cause global warming is a bit like saying that chickens to not hatch from eggs, because they they’ve been observed to lay them.
This all suggests (as inferred) a co-dependent process.
However, this overlooks the same thing that MOST public blogs overlook, and that is the quantum mechanical mechanism on IR radiation (per greenhouse warming theory) has never been proven, and is actually false. New research indicates the fundamental error in the theory, presumes that Heat is ADDITIVE (eg. The Earth’s energy ‘budget’). The quantum process for Thermal transference is not additive. It is a function of frequency resonance. This is why microwave ovens work. Solar heating occurs because the spectrum of frequencies included in sunlight (which reaches the Earth’s surface) sets the maximum temperature which the recipient object may reach. An object in an oven set to 400 degrees will never reach 500 degrees no longer how long it is in the oven, because heat transference is not additive over time. The low energy IR waves received by CO2 molecules will naturally dissipate into the atmosphere with negligible net effect upon the atmosphere, but will never cause planetary ‘heating’ because, per thermodynamic law, no object can heat something beyond the temperature it possesses. Irradiated CO2 molecules can never heat the earth beyond the temperature frequency that already exists within the earth, which generated the IR light waves to begin with. IR Radiation does not raise the temperature of the Earth. The greenhouse warming theory is flawed. THAT is why the universally accepted historical record shows zero correlation between atmospheric CO2 levels and average temperature over the entirety of the past 4 Billion years. Zeroing in on the last 400k or 800k years, and pointing to an anomaly amounts to cherry picking, which disregards the other dynamics in play, such as Milankovitch Cycles. Note: Ozone depletion CAN increase surface temperatures because the range of UV frequencies that reach the surface is expanded. - ClimateAdam: The Vlog Brothers on geoengineering
Markp at 22:49 PM on 24 August, 2023This is a reasonably well-done video by Adam, but there are some points that need to be made.
As many people have learned, the IPCC has done a pretty lousy job of informing the public, and the scientific views it presents have been warped both by the scientists themselves (the dreaded "scientific reticence" effect) as well as the politicians from 195 member countries that have veto power on much of the content released to the public which can be generally characterized as very, very conservative. In other words, it's way worse than they tell us, and their "solutions" not nearly as effective as they tell us. Adam and his friend Miriam are both, from what I can tell, very much cheerleaders for the IPCC. Not surprising: they are fresh out of university and so in that sense have not spent much (any?) time in the real world of working scientists, so their current YouTube careers aside, they may not want to annoy the IPCC-dominated narrative on all things climate.
Two big issues: 1) we need geoengineering more than they tell us, and 2) there is more to geoengineering than SAI.
1) Like so many climate scientists under the spell of the IPCC, (for many reasons which take too long to unpack here) Adam and Miriam accept the logic that the only necessary thing to do in order to reverse GW is to reverse GHGs, in other words, get rid of them. That's a little bit like having your doctor tell you that in order to cure your tobacco-caused cancer, you just need to stop smoking. Fighting the cause isn't always guaranteed to bring about a result in a timely manner. Reducing GHGs, yes, but who is doing that? Miriam said something like international agreements like Paris have "already reduced warming by 1C" and I say huh? All the talk of international agreements sounds good but isn't our reality, as anyone looking at our world's biggest problems today knows in an instant. Our "efforts" to reduce emissions are nowhere. It's not happening. Targets and discussions aren't enough. The point that people behind geoengineering make is: emissions reduction is not and WILL NOT happen fast enough to stop our ecosystem from collapsing. Additionally, carbon removal methods, whether nature-based or mechanical, have huge scaling problems. Yes, nature has dealt with CO2 in the past, but not like what we have now. They are very slow, are not always even feasible (tree-planting a perfect example, look at the studies) and have other issues such as water constraints making them impossible at scale. And mechanical CO2 removal is even worse. When it works, it's fast, but unscalable, with DAC being the most obvious case. So after the IPCC cheerleading stops, we have to face the music. We don't have time to rely only on the method of "turn off the tap and clean up the mess."
2) Geoengineering (you heard Adam slip in "SRM" as well, Solar Radiation Management, a type of geoengineering) is almost always equated with just ONE currently discussed method, which is Stratospheric Aerosol Injection, or SAI. That's because it's got a lot of billionaire-potential!
SAI is NOT more than a theory at this point, however. But you won't find that mentioned by many of its proponents. It is not the only way to go, is not loved by many (unbiased) climate scientists, has oodles of scientific problems to overcome if it would even work, and so is NOT the end of the geoengineering or SRM story. So Nigelj's characterization above, which makes it seem that SAI is ready-for-take-off, is wrong.
I will admit that, like the VAST majority of actual movement on climate we have seen, geoengineering efforts have a lot in common with disaster capitalism, and so should be checked out very thoroughly. Making money off of GW is the most effective thing we humans have done to date, which is a crime against humanity. Period. Governments now throwing large sums of money out for grants only on very narrowly-defined work chokes real progress. What we forget is that scientists have to get paid. Who pays them? Why? Most scientific research is arguably being funded by those who are expecting a product to patent and sell if things go well. Scientists are NOT always out there trying to find the fastest most practical fix here. The more tech that goes into it, the better. The more career-building we can get out of it, the better. That's why we see people talking about, of all things, space mirrors, as if simply putting them on the ground here to do what clouds and snow do is out of the question. There are people promoting that very idea and it has vastly more promise than any other geoengineering solution but is largely ignored (but that's changing) because it doesn't create billionaires and cannot be weaponized.
Like many things, this discussion has so much more to it than meets the eye. We need to think, REALLY think, and be realistic, and stop listening so much to government institutions (or their cheerleaders) that have almost never served anyone other than the powerful very well.
- Increasing CO2 has little to no effect
Rob Honeycutt at 03:05 AM on 2 July, 2023manuel2001nyc... You've got quite a mishmash of errors embedded into all of your questions here. It seems quite a mess to untangle, but here are a few of examples:
"...absortiom / IR (14/16) emission) by a molecule of CO2 from IR comming from the sun(day)..."
Incoming energy from the sun is higher frequency and does not interact with CO2.
Your questions 1 and 2 are completely indecipherable to me. Maybe others understand what you're trying to get at.
"...it seems termal IR emitted by the sun overpass IR emmitted by the Earth. is this right?"
Here again, you're not understanding that incoming energy is not primarily in the IR spectrum. There is some short wave IR but it doesn't have a lot of effect. CO2 interacts with LWIR (long wave IR).
Your question 4 is also hard to decipher but also seems to contradict your own statement in question 2.
"someone has made calculations on how much themal IR (earth surace) and how much IR from sun is absorved by CO2?"
Same problem here. Incoming energy is in the short wave frequencies, primarily in the visible light spectrum.
Here's a diagram that may help you:

"6) as CO2 accounts for 0.035% how we can explain their impact in global warning?"
Simple answer, yes. This question has been repeatedly asked and answered essentially the same way for well over 150 years.
- 2nd law of thermodynamics contradicts greenhouse theory
Likeitwarm at 07:00 AM on 14 June, 2023scaddenp 1549 and sysop
"how far a photon of appropriate wavelength would travel up through the atmosphere on average before encountering a CO2 molecule"
Depending on the humidity it might get caught first by H2O. It could travel 3 inches or 300 inches. I haven't calculated the odds. I guess it would be like shooting into a flock of birds to see if you hit one.
I read somewhere that the maximum amount of earths radiation that is of an appropriate wavelength to react with CO2 is about 16% of the total. I think that is attributed to John Tyndall.
"what did likeitwarm think would happen to that energy?"
If the object was inert and isolated from the rest of the universe and emitted to a perfect reflector/re-emitter and absorbed this redirected energy, Its temperature would not change. In order to emit it must lose energy and it would just regain that energy back at absorption. I think it would need an external input to rise in temperature.
"I do not believe we should be destroying the world economies..."
I think is has been shown in the development of all economies to-date that cheap energy is key. Solar and wind energy have been shown that they are anything but cheap and dirtier to build, at this time. I do acknowledge that we need incentive to work on new technologies but I think we are turning off fossil and nuclear energy too soon. China certainly doesn't give a hoot about global warming.
I really feel this thread could get way off topic fast and needs to go to some general discussion. These things are not the science, but affect the science or are affected by the science.
These articles are not science but the problems noted in them will be solved by it, eventually. I just wonder how soon?
https://hbr.org/2021/06/the-dark-side-of-solar-power
https://www.forbes.com/sites/michaelshellenberger/2021/06/21/why-everything-they-said-about-solar---including-that-its-clean-and-cheap---was-wrong/?sh=3c94bf1c5fe5
https://daily.jstor.org/the-downside-to-renewable-energy/ - 2nd law of thermodynamics contradicts greenhouse theory
EddieEvans at 06:06 AM on 7 June, 2023Likeitwarm
It sounds like the energy captured by greenhouse gases changes the Earth's energy balance. Without the greenhouse gases, Earth would freeze. From the page, "he Second Law does not state that the only flow of energy is from hot to cold - but instead that the net sum of the energy flows will be from hot to cold. That qualifier term, 'net', is the important one here. The Earth alone is not a "closed system", but is part of a constant, net energy flow from the Sun, to Earth and back out to space. Greenhouse gases simply inhibit part of that net flow, by returning some of the outgoing energy back towards Earth's surface.
The myth that the greenhouse effect is contrary to the second law of thermodynamics is mostly based on a very long 2009 paper by two German scientists (not climate scientists), Gerlich and Tscheuschner (G&T). In its title, the paper claimed to take down the theory that heat being trapped by our atmosphere keeps us warm. That's a huge claim to make – akin to stating there is no gravity."
More though, it seems that melting albedo on the Arctic Sea allows solar radiation to warming the ocean, which is something else to consider. I'm not a scientist, just interested.
- CO2 is not the only driver of climate
Bob Loblaw at 07:54 AM on 9 May, 2023piotr @ 73:
I am not sure what your "not directly" statement refers to. I presume that the Martin Mlynczak quote is the one in comment 69. To put it simply, the thermosphere and the earth's surface respond to solar radiation in very different ways. You can read about the thermosphere on Wikipedia. Note that the thermosphere is at very high altitudes (>80km), and its temperature structure is the result of the absorption of UV radiation. It also has very low density, so even though average kinetic energy is high ("temperature") it does not hold a lot of heat. It is not strongly linked to the surface, which is heated by the absorption of solar radiation over the full spectrum.
This paper by Lean, Beer, and Bradley (1995) shows in figure 2 that variations in total solar irradiance are much less than for the UV range (in %).

To use the 4W/m2 drop in that figure, you need to first reduce it by a factor of 4 (area of a sphere vs. area of a circle), and then adjust for global albedo (0.3), giving an overall forcing of only about 0.7 W/m2. Sustained over only a period of about 50 years, this is not going to have a major cooling effect on its own.
You say that "it noticeabl[y]e cooled large parts of the no[r]thern hemisphere", which I presume is a claim with respect to surface temperature responding to these solar variations. You then throw in volcanic effects. You seem to grossly overestimate those solar effects, though - with no references to any supporting information. If you look at this SkS post, the first figure shows that reconstructed global temperatures for that period are much smaller than your claimed "decrease up to 1.5°C".

In your second paragraph, you start talking about "The past 10.000 years where up and downs in global mean temperature like +/- 2°C for dozen decades, even for nearly 2000 years - as we can reconstruct with little data-points." This starts to wander into the last glacial period, where Milankovitch cycles start to play a role. You are mixing together a lot of different forcing mechanisms, as if they are all equivalent in some fashion.
You then start into urban heat island effects, and finish off with a couple of paragraphs that represent an argument from incredulity. If you actually want to learn something about temperature reconstructions from proxies, Wikipedia has a decent article on this, too. The Wikipedia page also has a graph that shows even less variation in temperature than the one above:

The numbers you are throwing around in your "just imagine" scenarios seem to be ones that you have a lot of confidence in. The problem is that they also appear to disagree with broad swaths of the scientific literature. You appear to be claiming that science is unsure of what happened in the past - but you are. It seems highly unlikely that you are correct.
If you want to have any credibility here, you are going to have to provide references to the numbers you post. This is not a site where you will be permitted to post a lot of unsubstantiated opinion. As you are a new user here, I strongly suggest that you read the Comments Policy.
- CO2 is not the only driver of climate
Eclectic at 05:51 AM on 9 May, 2023Piotr @73 ,
Wind & ocean currents move heat energy around the planet - and so there is a considerable "averaging" effect on global temperatures. Even today, you do not need thousands of observation stations in order to assess changes in global temperature. Analysis shows that less than 100 stations are needed (if well-distributed, of course) to give a closely accurate picture of conditions.
A so-called Grand Solar Minimum is not actually very grand ~ studies such as Feulner & Rahmstorf, 2010 and Anet et al., 2013 indicate that a GSM produces a global cooling of around 0.3 degreesC. (Other studies indicate slightly smaller changes.) And this is because our Sun is a very stable star, with a very stable output of radiation. Very little variation.
Even the Little Ice Age was not spectacularly cold ~ a global cooling around 0.5 degreesC . . . which had been helped along by a number of cold winters from volcanic eruptions.
There have been periods of decades of marked cooling in the neighborhood of Greenland earlier in the Holocene, as a result in temporary changes in ocean currents. But these had little effect on average global temperature (the planet is big, and there is a vast amount of tropical ocean). The one exception is the millennium of strong cooling (the "Younger Dryas" ) about 12,000 years ago ~ and this was a one-off event produced by the single event of melt/discharge of the Laurentide Ice Sheet situated in Canada.
Piotr, you seem to have a wrong idea about earlier warm periods (of the Holocene) such as the so-called Minoan / Roman / Medieval Warm Period ~ these were only very slight changes, around 0.3 degreesC or smaller. These were only tiny "blips" on the general slow cooling from the Holocene Maximum temperature (slow cooling owing to the Milankovitch Cycle).
Possibly you have been misled by reports based on Arctic region temperature estimates (the Arctic shows bigger swings than the average global temperature).
- At a glance - The greenhouse effect and the 2nd law of thermodynamics
Charlie_Brown at 03:30 AM on 9 May, 2023My next attempt. I hope this is getting better. I changed the first part quite a bit to emphasize that the key problem with G&T, often overlooked, is their assumption that the input solar and output IR radiation are balanced (see Fig 32). I think these are worthwhile revisions. The structure seems fact-myth-fallacy-fact because I wanted to begin by separating the 1st & 2nd laws, but bring back the 1st law facts to seal the deal. Please feel free to edit and use the input as you deem suitable.
The 1st law of thermodynamics is conservation of energy. The 2nd law describes limitations on how energy can be used in forms of heat and work. It is difficult to express without introducing the concept of entropy - a state of disorder that is hard to understand. Instead, the 2nd law can be expressed practically in the form of statements and corollaries. One translation of the Clausius statement is: “It is impossible to operate a cyclic device in such a manner that the sole effect external to the device is the transfer of heat from one heat reservoir to another at a higher temperature” (Wark, Thermodynamics, 4th ed., 1983). A key phrase is “sole effect external to the device.” A cyclic device can be a heat engine and the classic example is a refrigerator that requires adding external energy, electricity, to make it work. Gerlich & Tscheuschner’s paper describes modern global warming theory as a perpetual heat engine that transfers heat from the cold stratosphere and the warm surface. That would violate the 2nd law, but that is an incorrect description of global warming. They assume that the radiant energy input from the sun is equal to the radiant heat loss to space and the system is “radiatively balanced”. That would be true for the greenhouse effect before the industrial revolution but increasing greenhouse gases (GHG) upsets the balance and causes global warming.
Some take the myth even further to claim that thermal radiation cannot transfer energy from a cold body to a warmer one. Gerlich & Tscheuschner steer the discussion into distraction by emphasizing the technical distinction between heat and energy. Consider two walls facing each other. All objects above absolute zero radiate energy. The warm wall radiates more energy toward the cold wall, but the cold wall still radiates some energy toward the warm wall. The debate amounts to whether it is energy or heat that moves towards the warm wall.
Conservation of energy for any defined system is:
Input = Output + Accumulation
The global system can be defined as from the Earth’s surface to the top of the atmosphere. The input to the global system is the sun. The surface temperature is regulated by balancing heat input from the sun with heat loss from the top of the atmosphere toward space. When balanced, accumulation is zero. There are three output energy pathways: 1) Infrared (IR) radiation from the surface at wavelengths that are transmitted directly to outer space (the transparent range). 2) IR radiation from GHG in the colder atmosphere at wavelengths that are emitted by GHG, and 3) solar energy reflected by clouds and the surface. As the concentration of CO2 increases, energy output to space (path 2) is reduced. This upsets the global energy balance. Energy accumulates and the surface temperature rises. As the surface temperature rises, energy output from the surface through the transparent range (path 1) increases until the balance is restored. This is how global warming works. - At a glance - The greenhouse effect and the 2nd law of thermodynamics
Charlie_Brown at 08:09 AM on 7 May, 2023Here is my next attempt for the At-A-Glance section. It is 356 words. I will start by copying the "Myth" from the top of the main page. That saves trying to paraphrase it in the discussion.
"The atmospheric greenhouse effect, an idea that many authors trace back to the traditional works of Fourier 1824, Tyndall 1861, and Arrhenius 1896, and which is still supported in global climatology, essentially describes a fictitious mechanism, in which a planetary atmosphere acts as a heat pump driven by an environment that is radiatively interacting with but radiatively equilibrated to the atmospheric system. According to the second law of thermodynamics such a planetary machine can never exist." (Gerhard Gerlich)
The Clausius statement of the 2nd law of thermodynamics is: “It is impossible to operate a cyclic device in such a manner that the sole effect external to the device is the transfer of heat from one heat reservoir to another at a higher temperature” (Wark, Thermodynamics, 4th ed., 1983). The myth claims that back radiation or downward infrared (IR) radiation emitted by greenhouse gases (GHG) is the mechanism that increases the temperature of the Earth’s surface. Since that would not be possible according to the 2nd law, the myth concludes that global warming is false. However, the myth overlooks the fact that the sun is the external energy source that drives global warming and outer space is the external cold reservoir. The sole external effect is transferring heat from the hot sun to cold outer space. If heat loss to space is reduced, the planet will get warmer. Some take the myth even further to claim that thermal radiation cannot transfer energy from a cold body to a warmer one. Consider two walls facing each other and that all objects above absolute zero radiate energy. The warm wall radiates more energy toward the cold wall, but the cold wall will still radiate some energy toward the warm wall.
The 1st law of thermodynamics is conservation of energy – input = output + accumulation. The global system can be defined as from the Earth’s surface to the top of the atmosphere. The input to the global system is the sun. The surface temperature is regulated by balancing heat input from the sun with heat loss from the top of the atmosphere toward space. There are three output energy pathways: 1) infrared (IR) radiation at wavelengths that are transmitted from the surface directly to outer space (the transparent range). 2) IR radiation at wavelengths that are emitted by GHG in the cold atmosphere, and 3) solar energy reflected by clouds and the surface. As the concentration of GHG increases, energy output to space (path 2) is reduced. This upsets the global energy balance. Energy accumulates and the surface temperature rises. As the surface temperature rises, energy output from the surface through the transparent range (path 1) increases until the balance is restored. This is how global warming works.
- Two attempts to blame global warming on volcanoes
Bob Loblaw at 03:21 AM on 6 April, 2023I had presumed that JohnSeers' question @ 49 was with respect to the direct heating effects of undersea volcanoes, rather than any indirect effects associated with CO2 emissions, etc.
Oceans are an important mechanism of heat transfer. Globally, tropical and subtropical regions absorb much more solar radiation than they emit back to space, so they show a net gain via radiation. Polar and sub-polar regions are the opposite - they lose more by IR emission to space than they absorb from solar radiation.
The climate system re-balances those regions of gain/loss by transporting energy poleward, and this happens via circulation in both the atmosphere and the oceans. Ocean currents such as the Gulf Stream, etc. move large amounts of energy.
And both land areas and ocean floors show vertical heat transport from the interior of the earth to the surface - but as discussed in the link I gave in comment #50, the amounts are small. And as pointed out in comments, to argue that current surface warming is the result of this flux of heat from the earth's core (via volcanoes or regular conduction) would require massive undetected increases in that geothermal heat flux.
Ain't happening, and anyone arguing that it is (without evidence) can be assumed to be badly uninformed (or mis-informed).
- From the eMail Bag: the Beer-Lambert Law and CO2 Concentrations
Charlie_Brown at 07:45 AM on 27 December, 2022Scruffy @29
Bob’s example illustrates the concept of a diminishing effect of increasing CO2, but as I challenged in @1 and Bob agreed in @2, it is insufficient to fully explain the complexity of the saturation effect. I prefer using the figure that Bob @7 reproduced from SpectralCalc.com for me to explain the saturation effect not as cylinders or cells in series, but as absorption lines (absorptance = 1 – transmittance) in parallel where strong lines reach an absorptance of 1.0 at low CO2 concentrations while weak absorption lines contribute to increasing absorptance with increasing concentration.
It is much better to interpret the Beer-Lambert Law by looking down at the atmosphere from space than it is to look up from the surface. The common view of Beer’s Law considers attenuation of the energy emitted from a surface. For example, measure the energy emitted from a source, travels through gas such as CO2, and reaches the end of a cell. The NIST spectrum provides the results for the specified set of conditions using this approach. However, the energy that reaches the end of the cell from the original source does not include re-radiated energy. That is because IR absorbed by CO2 in the cell is re-radiated in all directions, mostly to the cell walls where it is absorbed by the cell walls. The geometry of the measurement cell, unlike the open atmosphere, precludes re-radiated energy.
You say “NO energy will be radiated into space in the CO2 absorption spectra - that atmosphere is completely opaque at those frequencies.” This should be clarified to say that none of the original source energy (photons) from the surface will be radiated into space because it will be absorbed and re-radiated along the path length toward space. However, all molecules above absolute zero vibrate and radiate energy. CO2 at all levels of the atmosphere will radiate energy. At the uppermost atmospheric layer containing sufficient CO2 molecules, energy radiated by CO2 will radiate to space in the CO2 absorption band, precisely because absorption lines have a value great than 0. Kirchhoff’s Law provides that absorptance = emittance (with the caveat of being at thermal equilibrium, which allows for energy transfer between molecules by collision or conduction in addition to radiation.)
Bob’s experiment in the original post demonstrates why it is better to view the effect of Beer’s Law on radiant energy escape to space by looking down from space. The atmosphere in the tropopause at an altitude of about 10-20 km is thin and cold. There is a lot of distance between CO2 molecules. The key is that there is a very long path length available, sufficient to bring many of the absorptance lines in the CO2 band to 1.0. With increasing CO2 concentration, even the absorptance of very weak lines becomes significant.
Your description of the overall global heat balance is incorrect. Increasing CO2 will cause more heat to be absorbed closer to the surface, and this will lower the temperature of the tropopause. This is part of a special and complicated signature of global warming by CO2. It actually reduces emittance to space, aggravating the greenhouse effect rather than offsetting it. The greenhouse effect is driven by the temperature profile of the upper atmosphere. What happens in the troposphere below the tropopause, including convection, conduction evaporation, and condensation, just moves heat around within the troposphere. You mention the effect of water vapor, which also exacerbates global warming as a positive feedback effect. The role of clouds is complicated. High, cold cirrus clouds can increase warming while low, warm, thick clouds can reflect solar energy. All of this is discussed in detail elsewhere, and is beyond the scope of a single rebuttal. But if you have any more specific questions that are stumbling blocks for your understanding, I will try to address them as succinctly as possible.
- Skeptical Science New Research for Week #50 2022
peterklein at 07:12 AM on 16 December, 2022I mostly became mostly aware of the climate and global warming issue about the time that Al Gore began beating the drum (even while he continued to fly globally in his private jet). Since then, I've read about climate change and climate modeling from many sources, including ones taking the position that ‘it is not a question if it is a big-time issue, but what to do about it now, ASAP?’.
In the past few weeks, it appeared to me there has been a of articles, issued reports, and federal government activity, including recently approved legislation, related to this topic. While it obviously has been one of the major global topics for the past 3+ decades, the amount of public domain ‘heightened activity’ seems (to me) to come in waves every 4-6 months. That said, I decided to write on the topic based on what I learned and observed over time from articles, research reports, and TV/newspaper interviews.
There clearly are folks, associations, formal and informal groups, and even governments on both sides of the topic (issue). I also have seen over the decades how the need for and the flow of money sometimes (many times?) taints the results of what appear to be ‘expert-driven and expert-executed’ quantitative research. For example, in medical research some of the top 5% of researchers have been found altering their data and conclusions because of the source of their research funding, peer ‘industry’ pressure and/or pressure from senior academic administrators.
Many climate and weather-related articles state that 95+% of researchers agree on major climate changes; however (at least to me) many appear to disagree on the short-medium-longer term implications and timeframes.
What I conclude (as of now)
1. This as a very complex subject about which few experts have been correct.
2. We are learning more and more every day about this subject, and most of what we learn suggests that what we thought we knew isn't really correct or at least as perfectly accurate as many believe.
3. The U.S. alone cannot solve whatever problem exists. If we want to do something constructive, build lots of nuclear power plants ASAP (more on that to follow)!
4. Any rapid reduction in the use of fossil fuels will devastate many economies, especially those like China, India, Africa and most of Asia. Interestingly, the U.S. can probably survive a 3 or 4% reduction in carbon footprint annually over the next 15 years better than almost any country in the world, but this requires the aforementioned construction of multiple nuclear electrical generating facilities. In the rest of the world, especially the developing world, their economies will crash, and famine would ensue; not a pretty picture.
5. I am NOT a reflexive “climate denier” but rather a real-time skeptic that humans will be rendered into bacon crisps sometime in the next 50, 100 or 500+ years!
6. One reason I'm not nearly as concerned as others is my belief in the concept of ‘progress’. Look at what we accomplished as a society over the last century, over the last 50, 10, 5 and 3 years (e.g., Moore’s Law is the observation that the number of transistors on integrated circuits doubles about every two years!). It is easy to conclude that we will develop better storage batteries and better, more efficient electrical grids that will reduce our carbon footprint. I'm not so sure about China, India and the developing world!
7. So, don't put me down as a climate denier even though I do not believe that the climate is rapidly deteriorating or will rapidly deteriorate as a result of CO2 upload. Part of my calm on this subject is because I have read a lot about the ‘coefficient of correlation of CO2 and global warming, and I really don't think it's that high. I won't be around to know if I was right in being relaxed on this subject, but then I have more important things to worry about (including whether the NY Yankees can beat Houston in the ACLS playoffs, assuming they meet!).
My Net/Net (As of Now!)
I am not a researcher or a scientist, and I recognize I know far less than all there is to know on this very complex topic, and I am not a ‘climate change denier’… but, after
also reading a lot of material over the years from ‘the other side’ on this topic, I conclude it is monumentally blown out of proportion relative to those claiming: ‘the sky is falling and fast’!
• Read or skim the book by Steven Koonin: Unsettled: What Climate Science Tells Us, What It Doesn't, and Why It Matters /April 27, 2021; https://www.amazon.com/Unsettled-Climate-Science-Doesnt-Matters/dp/1950665798
• Google ‘satellite measures of temperature’; also, very revealing… see one attachment as an example.
• Look at what is happening in the Netherlands and Sri Lanka! Adherence to UN and ESG mandates are starving countries; and it appears Canada is about to go over the edge!
• None of the climate models are accurate for a whole range of reasons; the most accurate oddly enough is the Russian model but that one is even wrong by orders of magnitude!
• My absolute favorite fact is that based on data from our own governmental observation satellites: the oceans have been rising over the last 15 years at the astonishing rate of 1/8th of an inch annually; and my elementary mathematics suggests that if this rate continues, the sea will rise by an inch sometime around 2030 and by a foot in the year 2118… so, no need to buy a lifeboat if you live in Miami, Manhattan, Boston, Los Angeles, or San Francisco!
• Attached is a recent article and a Research Report summary.
Probably the most damning is the Research Report comparison of the climate model predictions from 2000, pointing to 2020 versus the actual increase in temperature that has taken place in that timeframe (Pages 9-13). It's tough going and I suggest you just read the yellow areas on Page 9 (the Abstract and Introduction, very short) and the 2 Conclusions on Page 12. But the point is someone is going to the trouble to actually analyze this data on global warming coefficients!
My Observations and Thinking
In the 1970s Time Magazine ran a cover story about our entering a new Ice Age. Sometime in the early 1990s, I recall a climate scientist sounding the first warning about global warming and the potentially disastrous consequences. He specifically predicted high temperatures and massive floods in the early 2000’s. Of course, that did not occur; however, others picked up on his concern and began to drive it forward, with Al Gore being one of the primary voices of climate concern. He often cited the work in the 1990’s of a climate scientist at Penn State University who predicted a rapid increase in temperature, supposedly occurring in 2010 and, of course, this also did not occur.
Nonetheless many scientists from various disciplines also began to warn about global warming starting in the early 2000’s. It was this growing body of ‘scientific’ concern that stimulated Al Gore's concern and his subsequent movie. It would be useful for you to go back to that and review the apocalyptic pronouncements from that time; most of which predicted dire consequences, high temperatures, massive flooding, etc. which were to occur in 10 or 12 years, certainly by 2020. None of this even closely occurred to the extent they predicted.
That said, I was still generally aware of the calamities predicted by a large and diverse body of global researchers and scientists, even though their specific predictions did not take place in the time frame or to the extent that they predicted. As a result, I become a ‘very casual student’ of climate modeling.
Over the past 15 years climate modeling has become a popular practice in universities, think-tanks and governmental organizations around the globe. Similar to medical and other research (e.g., think-tanks, etc.) I recognized that some of the work may have been driven by folks looking for grants and money to keep them and their staff busy.
A climate model is basically a multi-variate model in which the dependent variable is global temperature. All of these models try to identify the independent variables which drive change in global temperature. These independent variables range from parts per million of carbon dioxide in the atmosphere to sunspot activity, the distance of the earth from the sun, ocean temperatures, cloud cover, etc. The challenge of a multi-variant model is first to identify all of the various independent variables affecting the climate and then to estimate the percent contribution to global warming made by a change in any of these independent variables. For example, what would be the coefficient of correlation for an increase in carbon dioxide parts per million to global warming?
You might find that an interesting cocktail party question to ask your friends “what is the coefficient of correlation between the increase in carbon dioxide parts per million and the effect on global warming?” I would be shocked if any of them even understood what you were saying and flabbergasted if they could give you an intelligent answer! There are dozens of these climate models. You might be surprised that none of them has been particularly accurate if we go back 12 years to 2010, for example, and look at the prediction that the models made for global warming in ten years, by 2020, and how accurate any given model would be.
An enterprising scientist did go back and collected the predictions from a score of climate models and found that a model by scientists from Moscow University was actually closer to being accurate than any of the other models. But the point is none were accurate! They all were wrong on the high side, dramatically over predicting the actual temperature in 2020. Part of the problem was that in several of those years, there was no increase in the global temperature at all. This caused great consternation among global warming believers and the scientific community!
A particularly interesting metric relates to the rise in the level of the ocean. Several different departments in the U.S. government actually measures this important number. You might be surprised to know, as stated earlier, that over the past 15 or so years the oceans have risen at the dramatic rate of 1/8th of an inch annually. This means that if the oceans continued to rise at that level, we would see a rise of an inch in about 8 years, sometime around 2030, and a rise of a foot sometime around the year 2118. I suspect Barack Obama had seen this data and that's why he was comfortable in buying an oceanfront estate on Martha's Vineyard when his presidency ended!
The ‘Milankovitch Theory’ (a Serbian astrophysicist Milutin Milankovitch, after whom the Milankovitch Climate Theory is named, proposed about how the seasonal and latitudinal variations of solar radiation that hit the earth in different and at different times have the greatest impact on earth's changing climate patterns) states that as the earth proceeds on its orbit, and as the axis shifts, the earth warms and cools depending on where it is relative to the sun over a 100,000-year, and 40,000-year cycle. Milankovitch cycles are involved in long-term changes to Earth's climate as the cycles operate over timescales of tens of thousands or hundreds of thousands of years.
So, consider this: we did not suddenly get a lot more CO2 in the atmosphere this year than we had in 2019 (or other years!), but maybe the planet has shifted slightly as the Milankovitch Theory states, and is now a little closer to the sun, which is why we have the massive drought. Nothing man has done would suddenly make the drought so severe, but a shift in the axis or orbit bringing the planet a bit closer to the sun would. It just seems logical to me. NASA publicly says that the theory is accurate, so it seems that is the real cause; but the press and politicians will claim it is all man caused! You can shut down all oil production and junk all the vehicles, and it will not matter per the Theory! Before the mid-1800’s there were no factories or cars, but the earth cooled and warmed, glaciers formed and melted, and droughts and massive floods happened. The public is up against the education industrial complex of immense corruption!
In the various and universally wrong ‘climate models’, one of the ‘independent’ variables is similar to the Milankovitch Theory. Unfortunately, it is not to the advantage of the climate cabal to admit this or more importantly give it the importance it probably deserves.
People who are concerned about the climate often cite an ‘increase in forest fires, hurricanes, heat waves, etc. as proof of global warming’. And many climate deniers point out that most forest fires are proven to be caused by careless humans tossing cigarettes into a pile of leaves or leaving their campfire unattended, and that there has been a dramatic decrease globally on deaths caused by various climate factors. I often read from climate alarmists (journalists, politicians, friends, etc.), what I believe are ‘knee-jerk’ responses since they are not supported by meaningful and relevant data/facts, see typical comments below:
• “The skeptical climate change deniers remind me of the doctors hired by the tobacco industry to refute the charges by the lung cancer physicians that tobacco smoke causes lung cancer. The planet is experiencing unprecedented extreme climate events: droughts, fires, floods etc. and the once in 500-year catastrophic climate event seems to be happening every other year. Slow motion disasters are very difficult to deal with politically. When a 200-mph hurricane hits the east coast and causes a trillion dollars in losses then will deal with it and then climate deniers will throw in the towel!”
These above comments may be right, but to date the forecasts on timing implications across all the models are wrong! It just ‘may be’ in 3, 10 or 50 years… or in 500-5000+ before the ‘sky is falling’ devastating events directly linked to climate occur. If some of the forecasts, models were even close to accuracy to date I would feel differently.
I do not deny there are climate related changes I just don’t see any evidence their impact is anywhere near the professional researchers’ forecasts/models on their impact as well as being ‘off the charts’ different than has happened in the past 100-1000+ years.
But a larger question is “suppose various anthropogenetic actions (e.g., chiefly environmental pollution and pollutants originating in human activity like anthropogenic emissions of sulfur dioxide) are causing global warming?”. What are they, who is doing it, and what do we do about it? The first thing one must do is recognize that this is a global problem and that therefore the actions of any one country has an effect on the overall climate depending upon its population and actions. Many in the United States focus intensely upon reducing carbon emissions in the U.S. when of course the U.S. is only 5% of the world population. We are however responsible for a disproportionate part of the global carbon footprint; we contribute about 12%. The good news is that the U.S. has dramatically reduced its share of the global carbon footprint over the past 20 years and doing so while dramatically increasing our GDP (up until the 1st Half of 2022).
Many factors have contributed to the relative reduction of the U.S. carbon footprint. Chief among these are much more efficient automobiles and the switch from coal-driven electric generation plants to those driven by natural gas, a much cleaner fossil fuel.
While the U.S. is reducing its carbon footprint more than any other country in the world, China has dramatically increased its carbon footprint and now contributes about 30% of the carbon expelled into the atmosphere. China is also building 100 coal-fired plants!
Additional facts, verified by multiple sources including SNOPES, the U.,S. government, engineering firms, etc.:
• No big signatories to the Paris Accord are now complying; the U.S. is out-performing all of them.
• EU is building 28 new coal plants; Germany gets 40% of its power from 84 coal plants; Turkey is building 93 new coal plants, India 446, South Korea 26, Japan 45, China has 2363 coal plants and is building 1174 new ones; the U.S. has 15 and is building no new ones and will close about 15 coal plants.
• Real cost example: Windmills need power plants run on gas for backup; building one windmill needs 1100 tons of concrete & rebar, 370 tons of steel, 1000 lbs of mined minerals (e.g., rare earths, iron and copper) + very long transmission lines (lots of copper & rubber covering for those) + many transmission towers… rare earths come from the Uighur areas of China (who use slave labor), cobalt comes from places using child labor and use lots of oil to run required rock crushers... all to build one windmill! One windmill also has a back-up, inefficient, partially running, gas-powered generating plant to keep the grid functioning! To make enough power to really matter, we need millions of acres of land & water, filled with windmills which consume habitats & generate light distortions and some noise, which can create health issues for humans and animals living near a windmill (this leaves out thousands of dead eagles and other birds).
• So, if we want to decrease the carbon footprint on the assumption that this is what is driving the rise in the sea levels (see POV that sea levels are not rising at: www.tiktok.com/t/ZTRChoNTg) and any increase in global temperature, we need to figure out how to convince China, India and the rest of the world from fouling the air with fossil fuels. In fact, if the U.S. wanted to dramatically reduce its own carbon footprint, we would immediately begin building 30 new nuclear electrical generating plants around the country! France produces about 85% of its electrical power from its nuclear-driven generators. Separately, but related, do your own homework on fossil fuels (e.g., oil) versus electric; especially on the big-time move to electric and hybrid vehicles. Engineering analyses show you need to drive an electric car about 22 years (a hybrid car about 15-18 years) to breakeven on the savings versus the cost involved in using fossil fuels needed to manufacture, distribute and maintain an electric car! Also, see page 14 on the availability inside the U.S. of oil to offset what the U.S. purchases from the middle east and elsewhere, without building the Keystone pipeline from Canada.
Two 4-5-minute videos* on the climate change/C02/new green deal issue, in my opinion, should be required viewing in every high school and college; minimally because it provides perspective and data on the ‘other’ side of the issue while the public gets bombarded almost daily by the ‘sky is falling now or soon’ side on climate change!
* https://www.prageru.com/video/is-there-really-a-climate-emergency and
https://www.prageru.com/video/climate-change-whats-so-alarming - CO2 effect is saturated
Bob Loblaw at 01:22 AM on 21 November, 2022Further minor note:
The radiative-convective model work of Manabe et al does include both IR radiative transfer and solar radiation. This is necessary for a proper energy balance model. The stratospheric heating seen in the above figures is largely due to ozone absorption of UV radiation.
MODTRAN, as linked to earlier in comments, focusses on IR radiation.
- From the eMail bag: A Review of a paper by Ellis and Palmer
Bob Loblaw at 03:43 AM on 9 October, 2022The albedo argument of Ellis and Palmer is an odd one. They explicitly state in their section 3.2 that they think it is incorrect to consider the albedo effect as a global one. In discussing the common approach to albedo feedback amounts, and comparing it to the CO2 feedback, they state:
The strength of the albedo feedback was calculated as being in the same range, or about 3 W/m2 over the full interglacial cycle (Hansen et al., 2012, Fig. 5c and p12). This figure was derived by equating albedo with sea levels, and therefore with ice extent, which spreads the albedo effect out across the entire globe in a similar fashion to the calculation for CO2. But this is likely to be an erroneous procedure.
They go on to argue that their localized "one day, one latitude" calculation of radiative effects is the proper one to use. They conclude one paragraph with:
As Fig. 3 clearly demonstrates, interglacials are only ever triggered by Great Summer insolation increases in the northern hemisphere and never by increases in insolation during the southern Great Summer, so why spread the influence of albedo across the entire globe?
To put it simply, the change in local or regional albedo represents one part of global albedo. To address the question of how much solar radiation the globe absorbs (which is the proper question for looking at global climate), you need to consider all of the globe - each latitude, each day, and each individual surface cover. The contribution of a single location is directly proportional to the area it covers - as a fraction of the total area of the planet.
Global changes in global albedo, caused by large white ice sheets replacing dark forests (or the reverse), is an important feedback. When climate science speaks "albedo feedback", it is this large scale issue that they mean, not Ellis and Palmer's local microclimate one.
The Rapp et al unpublished paper that MA Rodger refers to is an interesting side note. It still focuses on albedo and high-latitude insolation. It at least considers the entire year, not just the summer solstice, but it's efforts at modelling still are extremely simplistic - empirical fits between ice volume and variations in solar input. No actual climate model to provide precipitation inputs or melt processes, or glacier dynamics models to accumulate ice and move it from zones of accumulation to zones of melt.
The Rapp et al paper also seems to be rather confused about CO2 as a feedback vs. CO2 as a forcing. They argue against a straw man: that mainstream climate science thinks that CO2 is supposed to force the glacial/interglacial cycles. (It does not.) CO2 is one feedback. The overall CO2 level influences whether climate will respond to Milankovitch cycles by producing glacial/interglacial cycles, but it does not cause the individual glacial/interglacial periods. A world at 200 ppm CO2, a world at 300 ppm CO2, and a world at 450 ppm CO2 will not respond to orbital changes in solar insolation in exactly the same way.
- How not to solve the climate change problem
Bob Loblaw at 02:45 AM on 25 August, 2022For what it is worth, RealClimate also has an older post (March 2020) on bad papers in the "Climate change is caused by solar radiation" subject area. Triggered by the retracted Zharkova paper, but a broader discussion.
- CO2 effect is saturated
Eclectic at 19:51 PM on 9 August, 2022CloudySky @653 (and recent others) :
You yourself will be "heavily funded" [your quote] by the Nobel Committee for Physics, just as soon as you publish your scientific paper showing that the surface temperature of Venus [about 460 degreesC] is due to your secret newly-discovered physics (which excludes greenhouse effects).
(The incident sunlight i.e. solar irradiation at Venus is amost exactly twice that at Earth.)
Perhaps a double-header Nobel Prize is coming your way, CloudySky? You could also garner the Nobel Prize for Medicine, if you can show that Venus's feverish temperature is due to an . . . ah . . . ahem . . . Venereal condition.
I hope your legislators vote to cool the charade of global warming, by at least 1 degree.
- It's the sun
Bob Loblaw at 04:35 AM on 9 August, 2022HK @ 1303:
Those numbers are consistent with other sources.
Note that the shorter wavelengths do not reach the earth's surface. They are absorbed in the upper atmosphere - e.g., by ozone in the stratosphere. Absorption of radiation is what heats the stratosphere, as seen in this image I linked to in another thread last week (from Manabe and Weatherald, 1967):
This page, from highly-respected radiation instrumentation company Kipp and Zonen, gives a breakdown of atmospheric transmission of various wavelengths.
https://www.kippzonen.com/Knowledge-Center/Theoretical-info/Solar-Radiation
The shorter UV-B and UV-C wavelegnths are either mostly or completely absorbed before reaching the surface. A table from that page:

The low amounts of energy in those short wavelengths - plus the low amounts that penetrate past the stratosphere - are the main reason that climate "skeptics" look for indirect effects, such as cloud formation, cosmic rays, etc. (They are still looking...)
- Taking the Temperature: a dispatch from the UK
One Planet Only Forever at 08:17 AM on 26 July, 2022Fixitsan @42 (and other comments),
Thank you for accepting that averaging larger amounts of data provides a clearer indication of long-term trends like the impacts of increasing CO2 levels. That understanding leads to awareness that the surface temperature impact of increased CO2 in the atmosphere is best seen by the trend of the global 30-year moving average (the global version of the one for CET presented on the Wikipedia page I linked to @40). Also, the 30-year ‘global average’ is understandably the better indication of the trend than any regional 30-year average.
I have more to share regarding CO2 and temperatures. But the following will hopefully help explain the comments I will make.
We appear to agreed that many people appear to be uninterested in putting the effort into pursuing the most logical explanations for the ever increasing evidence of what is going on. Learning requires a willingness to change your mind based on ‘new information and evidence’. It can require giving up on developed (status quo) beliefs and actions (no matter how popular, profitable or enjoyable they are).
The following 6 minute BBC Reel item “The psychology behind conspiracy theories” is informative. Watch it. Think about it. Then watch it again. Then seriously consider the possibility that you are resisting learning for some reason(s).
When there is a lot of evidence, as there is regarding climate science (especially since the first IPCC Report in 1990), the understanding still improves as additional evidence is obtained. But the fundamental understanding developed by 1990 is very unlikely to change ‘statistically significantly’ due to new evidence. And the observations you make regarding CET are not ‘new evidence’ (btw, Why is your focus on anything other than what the CET 30-year average trend since 1990 indicates?)
Many other comments have been helpful (they really are), but I will only refer to a few of them.
Bob Loblaw @47 provides a great overlay of the history of CO2 levels and global average surface temperature (GAST). But the 30-year moving average temperature line looks even more like the CO2 line.
You can use the SkS Temperature Trend Calculator to see the 30-year GAST trend for the GISS v4 (the temperature dataset Bob Loblaw used). Choose GISTEMPv4 and set the follow: Start date = 1880; End date = 2023; Moving average = 360 months (30 years). The GISTempv4 30-year moving average increases between 1920 and 1950, and after 1965 (note that there is no ‘levelling off’ in a 600-month moving average). What is happening in the CET is similar. But local conditions can be understood, and expected, to vary relative to the global trend. The term ‘vary’ leads to the next points.
Many variables affect the GAST. It isn’t just the CO2 levels. Increased CO2, primarily due to fossil fuel use, is known to be ‘the major factor’. However, additional variables affecting GAST are already well understood (with more being learned – because – well that’s science for you). They include:
- Aerosols (see nigelj @45)
- Other ghgs in the atmosphere, not just CO2
- ENSO (el Nino, la Nina)
- Solar radiation levels
- Milankovitch (Orbital) Cycles
In addition to variables affecting GAST, there are other factors affecting local climates including:
- ENSO (it affects regional climates as well as being large enough to affect the GAST)
- Atlantic meridional overturning circulation AMOC
The AMOC is weakening due to Global Warming. That could mean cooler winters in the CET region even with increased Global Warming due primarily to increased CO2, due primarily to human activity (primarily fossil fuel use).
So ... it is not wrong to say “Increased CO2 = increased GAST”. All that needs to be understood is that CO2 due to fossil fuel use is only the primary part of the 'increasing GAST and resulting Climate Change' problem.
Closing with a brief bit about the future of the Maldives due to increasing GAST. Reviewing the Climate Central Map of “Land projected to be below annual flood level in 2050” (a detail you missed or misunderstood when commenting about bridges near Edinburgh) you can see that only ‘most of the Maldives’ will be expected to be annually flooded by 2050 (using the default settings). More of the Maldives would be annually submerged in subsequent decades. Mind you, with the default settings, even by 2100 there are still little bits of the Maldives above the annual flood level. A related understanding is that people playing marketplace games can make 'very bad bets'.
A related understanding is that people playing marketplace games can make 'very bad bets', like investing in fossil fuelled pursuits, or buying in the Maldives (like the unfortunate people on Kona, the Big Island, Hawaii who chose to buy property and live in areas that are now under lava).
- Skeptical Science New Research for Week #28 2022
One Planet Only Forever at 08:15 AM on 15 July, 2022“Communication of solar geoengineering science: Forms, examples, and explanation of skewing” is interesting with some points meriting some consideration. I have not thoroughly read the item. But I have read enough to make the following critical observations (making no mention of points I consider worthy of consideration). I will carefully read the entire document to see if my initial impressions presented below need to be revised.
1. The author appears to have sought out examples that fit their desired conclusions. Then they played some games to get a 'best fit'. They provide no examples of the opposite of the type of examples they chose to focus on.
2. The author appears to be unaware that there is an important distinction between solar radiation modification (SRM) and medical treatments (they make many subjective comparisons between SRM and medical treatments - like "This important distinction can be clarified by analogy. Despite its own risks and negative side effects, chemotherapy is sometimes used to treat cancer."). Most medical treatments by something like:
- initial rigorous testing on non-humans,
- if the non-human treatment passes that initial testing then testing is done on a small number of carefully selected humans,
- if that testing is passed then testing is done on a larger and broader population,
- if that testing is passed then testing is done on an even larger and broader population.
And medical treatment tests are often done for a long periods of time to potentially discover unanticipated long-term consequences. COVID-19 vaccine testing was an exception to the longer-term testing of other medical treatments because of the clear evidence of the risk of significant harm done by COVID-19 infections.
There do not appear to be any non-planetary objects to meaningfully experiment SRM on. There are not hundreds of planets to have the second testing run on. There are not thousands of planets to have subsequent testing done on. There is this only one planet that, without humans messing it up by behaving like an asteroid, should be habitable for humanity for 10s of millions of years.
It is absurd to suggest that it is acceptable to run a global experiment on the planet. It is especially absurd to suggest the ‘need for, and benefit of, an SRM global experiment’ because leaders will not do what needs to be done (disappoint a portion of the global population that believes it is superior). Global Leadership needs to rapidly end the continued forcing of CO2 and other ghgs into the atmosphere )(which is an unacceptable global experiment that is not ‘mitigated’ by additional global scale experimentation).
3. The conclusions by the author regarding reasons for concern about how scientific presentations on SRM may be interpreted fails to mention the potential for political leaders (policy-makers) to be tempted to consider the potential for SRM to be a ‘solution’. The author appears to be unaware that some policy-makers have already exhibited a willingness to seek excuses for increasing harm to be done to future generations by the global leadership of the current generation failing to effectively reduce the harm being done. Some political game players may even selfishly consider it acceptable to delay the reduction of harm done, do more harm, because ‘future generations should be able to develop and use SRM’.
That said, climate science is complex. And the diversity of action plans in response to the undeniable harm being done deserve consideration - never losing focus on the need to limit the harm done, and never forgetting how unexpectedly harmful human actions can be.
- Clouds provide negative feedback
Likeitwarm at 02:02 AM on 13 July, 2022Being a layman, it seems to me that the normal water cycle cools the surface through conduction and evaporation. That energy is eventually released to the upper atmosphere through convection and condensation of cloud formation. Low warm clouds in turn will block more radiation from the sun keeping the ground cooler, negative feedback: Johannes Mulmenstadt et al 6/3/2021 paper.
"As the atmosphere warms, part of the cloud population shifts from ice and mixed-phase (‘cold’) to liquid (‘warm’) clouds. Because warm clouds are more reflective and longer-lived, this phase change reduces the solar flux absorbed by the Earth and constitutes a negative radiative feedback."
See an article about this paper "Cooling effect of clouds ‘underestimated’ by climate models, says new study"
This process seems that it would cause self regulation of the temperature of the atmosphere preventing the possibility of the atmosphere from ever overheating and becoming uninhabitable, i.e. runaway warming. Maybe in a repeating cycle such as more co2=>more warming=>More h2o=>more warm cloud cover=>more cooling=>less co2=>less heating=>less h2o=>less warm cloud cover=>more heating=>more co2 and so on. This seems that it could cause long periods of heating and cooling, maybe decades. Let me know where I'm wrong.
I always thought it was cooler on cloudy days than sunny days. - What role for small modular nuclear reactors in combating climate change?
JHBrewer at 05:36 AM on 27 May, 2022There are two main "political" arguments against nuclear reactors as an avenue to decarbonization of our electrical power supply:
1) They are too expensive and take too long to build, whereas solar and wind are cheap and quick.
2) They are dangerous because of the possibility of radioactive materials escaping into the environment.
Let's examine these arguments:
A modest wind farm costs about $15M, takes about 2 months to install and generates about 15 MW of power when the wind blows. That's $1/W at best. The installation is quick because wind turbines are being mass-produced in factories already. It would take a lot longer if every wind farm had to be built "from scratch" the way reactors have been in the past. The USA has been adding about 20 GW/year of wind capacity, and now has a net wind capacity of around 150 GW at a net cost of around $150 billion. To reach the total national power requirement (490 GW) should take about 17 years and cost about another $340 billion. We may want to increase the total capacity to account for windless days.
Prototypes of the proposed SMRs (Small Modular Reactors) are now under construction. Once factories are built to mass produce them the way wind turbines are, proponents predict, a new 300 MW SMR can be turned out every 4 years (per factory) at a cost of about $1.5 billion each. Thus it would take over a thousand new SMRs at a cost of around $1.7 trillion to take over the capacity now supplied by other means. Worse yet, if there were only one supplier with one factory, it would take 4,000 years. So obviously we'd need 100 such factories to get it done soon enough to help.
Of course, the operating lifetime of a reactor is at least half a century; wind turbines last at most half that long before they need replacing. But my "back of the envelope" estimates tentatively agree with the RE claims. Let's do both, and install appropriate power where needed.
Now, as to the hazards of radiation... please see https://citizendium.org/wiki/Radiation_Hazards
- It's the sun
Bob Loblaw at 23:57 PM on 5 April, 2022krit242 @ 1298:
The argument that short wavelengths of solar radiation have a large effect on climate is usually tied to the "it's cosmic rays" argument. The total amount of energy at those shorter wavelengths is very limited - although individual photons have more energy at shorter wavelemgths, there are just a lot fewer photons. A large percentage change in a small number is still a small number.
As for cosmic rays, Skeptical Science has a page for that, too.
The review I linked to at 1297 looks at a paper that tries to argue in favour of "indirect" solar effects - i.e., effects that are related to "something unknown" that is not the direct heating/energy input from variations in solar output. (Spolier alert: it's not a good paper.)
- It's the sun
Pepper at 11:20 AM on 5 April, 2022Total solar radiation has a huge impact on climate change, according to the scientific article below: Combine the data below with the closure of the ozone hole over the past 20 years, and that in itself could explain global warming. All hot in the last 25 years. They estimate that the Sun was responsible for 45–50% of global warming and 25–35% of global warming in 1980–2000. It may have played a key role in continued climate change over the past century. It also pointed out that the impact of solar on climate change over the same period was much stronger than what some theoretical models had predicted.
- The Climate Shell Game
jan at 01:24 AM on 25 March, 2022@Evan #31
Many power utilities will certify that they use "green energy credits" to ensure the power used for cars comes from renewables.
People are often subject to tempting keywords. 100% certainty that your electrical outlet is currently supplying electricity from "green sources" is only if your house is off-grid + connected to your PVe/Wind/Hydro power production system. Otherwise, your distribution company supplies a mix of energy from sources that are currently providing this energy. Just to be sure.
Also, getting a lot of EV's on the road sends the right signal to the company's making them and to the company's powering them. Hard to know where to start, but I think we need to just jump in and get things going whereever we can.
Shouldn't this discussion be scientific? This is just a chaotic shooting into a dark approach. No hypothesis verification.
I think they call this the chicken or the egg problem. :-)
For common people - yes.
If you want to run a stable distribution grid you need:
- the stable source of energy production for 24/7/365 operation (any time, any weather conditions). Today they are - Nuclear, Coal, Natural gas, Hydro (dams). You can't control the sun (irradiation, clouds) or wind (atmospheric pressure).
- for unstable energy sources you need storage with sufficient capacity. More unstable weather, more capacity for the storage.
- all the sources must be able to deliver power quality conditions (Variation in voltage magnitude, frequency, transient voltages and currents, harmonic content for AC)
- solve challenging demands for the transmission losses. More warm conditions = more losses = need more energy production. Note: I have done a study in Slovakia power grid how weather conditions have a heavy impact on the transmission losses (in period 1964-2019). And I can responsibly say that this is a very modern power grid vs UK or US.
So, we have heavy challenges:
- transform existing energy production from the fossil fuels, including YoY increment of energy production
- upgrade the obsolete power grids to keep existing power demand
- in parallel create new energy production capacities for new electric charging points (EVs, trucks, busses, ...). You can't build up these points anywhere.
- create new power grids for the new energy sources, including new transition stations, ...
- and keep it all orchestrated to achieve a sustained power supply. This is really tricky now (see below)
- and in Europe, we have an additional heavy variable - to cut off from Russia natural gas - one of the important resources for Europe power production and power grid sustainability.
Finally yes - it is about chicken or the egg:
- you can't decrease emissions with EVs charged from Coal, Oil or Natural gas power plant energy sources.
- stabilize the obsolete power grid or new demand in the existing obsolete grid.
It's similar to enjoying a healthy diet that you're preparing on a coal fire stove.
Power production needs an order. No chaotic solutions.
Some useful information:
- Jan/2021 - Europe was near heavy Blackout due to power supply failure that is suspected to have originated in Romania disrupted the Continental Europe Synchronous Area. Its frequency dropped to 48.75 Hz (target frequency 50Hz), which caused the South-East area to be separated from the rest of the grid. This disruption and a lack of operating reserves in France nearly caused a Europe-wide blackout. Luckily, the automatic activation of power stations throughout Europe and the automatic initiation of contracted load shedding in Italy (1000 MW) and France (1300 MW) kept the grid stable and prevented a blackout. This incident shows the fragility of the grid and the real possibility of a Europe-wide blackout, which we need to prevent.link
- IPCC AR6 - The latest IPCC report suggests that average wind speeds over Europe will reduce by 8%-10% as a result of climate change.
- UK’s renewables share drops to 35.9% in Q3 2021 on slow winds
- Spain's solar energy crisis: Thousands os Spaniards bankrupt after investing in solar panels
- SkS Analogy 2 - Ferrari Without Gas
One Planet Only Forever at 07:57 AM on 10 March, 2022Excellent idea to use the engine and fuel analogy.
I had previously seen the 'quilt' analogy of how the CO2 was like down filling in a quilt, reducing how much heat below the quilt excapes.
That quilt analogy would be harder to use to explain how incoming solar energy and the ghgs worked for the Snowball Earth condition.
It may help to add the point about the majority of solar radiation, incoming and reflected, not being infrared and, as a result, not being absorbed by the ghgs.
Maybe something like:
Global warming occurs because infrared radiation emitted from the surface of the Earth (warmed by absorbing solar radiation that is mainly in frequencies that are not absorbed by greenhouse gase) is captured by greenhouse gases in the atmosphere, increasing the temperature of the atmosphere and making the surface warmer than it would be without the greenhouse gases in the atmosphere.
- It's albedo
Bob Loblaw at 09:04 AM on 3 March, 2022I have been watching this discussion for a while, and I too have a really difficult time understanding what blaisct's real purpose or argument is. With respect to albedo, it seems as if he is implying that albedo causes the change in climate, while ignoring the possibility that other factors are changing the climate and albedo is responding to that - the classical albedo feedback that is a standard part of climate science.
I have access to some high temporal resolution surface radiation data from a continental location. Let's look at four graphs of daily values:
January radiation and albedo:
...and the same location in July
Let's talk about the last two first. It's a mostly sunny day. with some morning cloud and mid-day scattered cloud. Global radiation peaks at over 1000 W/m2. There is a strong diurnal pattern to albedo - lowest in mid-day (less than 0.2), and highest around sunrise and sunset (around 0.3).
Then let's compare these to the first two, from January. A similar day in the sense of morning cloud and afternoon clear skies, but global radiation is much lower - (peaks at about 300 W/m2). Albedo is quite different - it drops from about 0.9 in the morning to
I also know a bit about the temperatures on each day. In July, it was much cooler in the morning and evening, and hottest in the early afternoon. January was much, much colder.
Should I assume that the differences in albedo have caused those temperature differences? After all, there is a strong correlation: albedo drops, and temperature rises. Very high albedo? Very cold temperatures!
...but all I have done is shown that winter is colder than summer, so you can get snow on the ground instead of agricultural crops. After all, the energy input from solar radiation in January peaks at 30% of what it was on that July day, even if we don't account for the higher January albedo and shorter daylight period.
And the diurnal cycle in July? It is well-known and well-documented that surface albedo shows variability with solar zenith angle in clear skies. The sun is high in the sky at solar noon (which is about 1pm clock time on these graphs), and low in the sky at sunrise and sunset. It's not the albedo that is driving temperature differences: it is the change in solar input.
Nothing surprising here. Albedo differences are the result of other factors that affect weather and climate.
I think the same applies to blaisct's humidity and cloud arguments. There is nothing that I can see in his comments that gives any evidence that albedo or humidity are the driving force behind changing climate - they can (and are more likely to be) the result of a changing climate. A feedback, not a forcing.
- 2022 SkS Weekly Climate Change & Global Warming News Roundup #7
MA Rodger at 22:43 PM on 27 February, 2022Santalives @28,
You now present a third pile of nonsense here at SkS. At least you show a level of consistency. Coe et al (2021) 'The Impact of CO2, H2O and Other “Greenhouse Gases” on Equilibrium Earth Temperatures' is as ridiculous as the other two you presented.
Coe et al (2012) claims that it addresses the issue of Equilibrium Climate Sensitivity (ECS) which, as is well known, has not been well-nailed-down by science for four decades now. So it would be quite a feat if there was even a smidgeon of promise in this paper to some contribution to the asssessment of ECS.
I could set out why this is an entirely non-scientific paper that well deserves its place in the trash can but in your ignorance you would likely see this as "one side" being disrespectful to "the other side".
So instead let me address what these numpties Coe, Fabinski & Wiegleb are doing that is so badly wrong.
The crux of the ignorance presented within Coe et al (2012) begins to congeal in their Section 1.4. Here they derive entirely on their own** a value called “n” the “energy retention factor” given "a" the "atmospheric absorptivity" (or the proportion of surface radiation gets to space through a clear atmosphere. By using HITRAN to derive "a" (the calculated percentage of surface radiation that reaches space through that clear atmosphere), they derive "n" by balancing "a" against the radiation that has to reach space to balance the incoming solar warming.
(**Note the one citation presented by the numpties for this grand work, Wilson & Gea-Banacloche [2012], is a total misrepresentation.)
The process they use runs as follows.
If a black body of 288K (representing the surface temperature) was in equilibrium with today's absorbed solar energy which equates to a 255K black body, they calculate that the energy out into space would be just 61.5% of the 288K black body radiation.
Thus, they derive for today's atmosphere (with a=a0) n.a0 = 38.5% of the surface radiation will be absorbed by the atmosphere. However, they also calculate using the grown-up HITRAN database, that the transmission through today's clear atmosphere of such 288K black body radiation would be a0 = 73.0% allowing them to derive in their Section 2.7 a value for "n"; n = 52.7%.
And this incredibly simplistic method allows all the sceintific effort over the last four decades attempting to derive accurate ECS values to be sidestepped. Even the complex impact of clouds on this finding is sweetly side-stepped because, as they tell us in their Section 5.1, clouds are already accounted for in the derivation of "n".
And all this is their own work. No supporting evidence. What clever numpties are these Coe, Fabinski & Wiegleb.
Of course, there are feedback mechanisms to be negotiated and the numpties calculate (using simplistic assumptins) feedback values for water vapour (+18%) and the wavelength change in the radiation from a warmer world (-5%) with a net result feedback of (1.18 x 0.95 =) +12%.
They then calculate the impact of differing levels of CO2 GHGs on the absorption of surface radiation through a clear atmosphere to calculate direct warming from a doubling of CO2 (400ppm to 800ppm) of +0.45ºC (when the science is irrefutably sure the value is +1.0ºC) and thus with a feedback of +12%, they can derive ECS = +0.5ºC (when the science says +1.5ºC to +4.5ºC).
Of course, the GH-effect doesn't work in anything like the manner assumed by Coe et al (2012) so all these numpties Coe, Fabinski & Wiegleb are doing is advertising their own stupidity.
- SkS Analogy 1 - Speed Kills: How fast can we slow down?
MA Rodger at 21:10 PM on 19 February, 2022Santalives @40/41,
❶ You use the term "back scatter radiation" and you may be forgiven for using it as the term even appears in the title of Seim & Olsen (2020). But the term is not correctly used. Backscatter concerns the physical reflection of radiation. The radiative effects being modelled involves only absorbtion and re-radiation. The peer review should have been down on this like a ton of bricks but evidently the paper was not properly subject to such review.
❷ You are correct that Seim & Olsen (2020) reference the IPCC (although rather sloppily) to support their description of the GH mechanism. However, Houghton et al (1997) 'An Introduction to Simple Climate Models used in the IPCC Second Assessment Report' does not provide such description (and why should it, it is desribing model representation, not what the model represents). Again, peer review should have been onto this non-reference like a ton of bricks.
There are further references provided for their description of the GH mechanism.
The first is a text book Benestad (2006) 'Solar Activity and Earth's Climate'. The full text is available on-line but not downloading for me. The content pages are available and it is Section 5.4.3 which would provide a description of the GH mechanism, but this section is not being very come-hitherish.
So to the last reference provided by Seim & Olsen (2020) which is Pierrehumbert. (2011) 'Infrared Radiation and Planetary Temperature'. It is no surprise to see zero support for the Seim & Olsen (2020) description of the GH mechanism. Instead we find the following description of the GH mechanism.
"An atmospheric greenhouse gas enables a planet to radiate at a temperature lower than the ground's if there is cold air aloft. It therefore causes the surface temperature in balance with a given amount of absorbed solar radiation to be higher than would be the case if the atmosphere were transparent to IR. Adding more greenhouse gas to the atmosphere makes higher, more tenuous, formerly transparent portions of the atmosphere opaque to IR and thus increases the difference between the ground temperature and the radiating temperature. The result, once the system comes into equilibrium, is surface warming."
So yet another non-reference within Seim & Olsen (2020) has slipped through the peer review, as did the silly description provided by Seim & Olsen (2020) itself.
And if this is how the GH mechanism operates, does the wonderful experiment of Seim & Olsen (2020) in any way demonstrate the GH mechanism? Or is it just demonstrating a pair of numpties playing climate-change-denial in a lab?
- It's albedo
nobodysknowledge at 21:28 PM on 12 February, 2022Thank you for your presentation of the Dübal and Vahrenholt 2021-paper blaisct. I think there is a good overall agreement to the CERES data presented by Loeb et al 2021. I have commented this at Science of Doom.
The Dübal and Vahrenholt paper, Radiative Energy Flux Variation from 2001–2020, have got some attention. And for good reason. It is an important discussion. But there are some problems with some of the claims that are made.
«Radiative energy flux data, downloaded from CERES, are evaluated with respect to their variations from 2001 to 2020. We found the declining outgoing shortwave radiation to be the most important contributor for a positive TOA (top of the atmosphere) net flux of 0.8 W/m2 in this time frame.»
According to the CERES data they present (TOA all sky), the trend is LW out 0,28 W/m2/decade (cooling), SW out -0,70 (warming), and solar reduction 0,03 (cooling), wich gives a TOA warming trend of 0,39 W/m2/dec. So far so good. And in good agreement with Loeb et al 2021. EBAF Trends (03/2000-02/2021) 0.37 + 0.15 Wm-2 per decade.
«The declining TOA SW (out) is the major heating cause (+1.42 W/m2 from 2001 to 2020).»
Trend SW out all sky -0,70 W/m2/dec withsolar reduction included (0,70 W/m2/dec TOA warming). Gives 1,40 W/m2 over 20 years. This major heating is composed of SW clear sky heating trend of -0,37 W/m2/dec and a SW cloudy sky heating trend of -0,78 W/m2/dec. In the TOA radiation energy bridge-chart (figure 14) this is shown as SW clear sky increase of 0,15 W/m2 and SW cloudy areas increase of 1,27 W/m2. And the solar change impact is -0,17 W/m2 for 20 years. A great difference between trend and energy bridge-chart.
Loeb et al has a SW TOA heating of 0,63W/m2/dec through albedo change, with clouds increasing absorbed SW Flux 0,44W/m2/dec and surface increased absorption 0,19W/m2/dec. In good agreement with Dübal and Vahrenholt. EBAF Trends (03/2000-02/2021) 0.68 + 0.12 Wm-2 per decade.
«It is almost compensated by the growing chilling TOA LW (out) (−1.1 W/m2).»
But as we have seen, the trend is only 0,28 W/m2/dec. This is composed of LW TOA flux clear sky 0,04W/m2/dec and LW cloudy sky 0,35 W/m2/dec. How can they claim so big «chilling» longwave cooling? It looks like they use the startpoint and endpoint of a graph, and that the «chilling» cooling at TOA was for the year 2020 relative to 2001. In the TOA radiation energy bridge-chart (figure 14) this is shown as LW clear sky increase of 0,46 W/m2 and LW cloudy areas increase of 0,64 W/m2. I think what is presented in the bridge-charts is close to cherrypicking.
Loeb et al EBAF Trends (03/2000-02/2021) -0.31 + 0.12 Wm-2 per decade
The Dübal and Vahrenholt calculations for cloudy areas are clearly showing how thinning of clouds is the greatest component of global warming for the last 20 years, and probably for 40 years when we read the papers of M Wild and other cloud scientists. So when some say that the AGW is the cause of all global brightening or of all increase in water vapor, they are not taking the attribution problem serious. Increasing surface and atmospheric temperatures is contributing a lot, but there is a great complexity behind all this.
- It's albedo
MA Rodger at 23:36 PM on 10 February, 2022blaisct @115,
And concerning your second question - "If all the global warming, GW, came from CO2 radiative forcing alone would not a graph like @111 be flatter...?"
The 'graph @111' is Fig 3 of Dübal & Vahrenholt (2021) and specifically shows a quite-dramatic reduction in albedo 2001-20 with a trend of -0.70Wm^-2/decade. Fig 1 shows a reduction in solar of -0.03Wm^-2/d. Thus Figs 1 & 3 matches Loeb et al (2021) Fig 2d with Absorbed Solar 2002-20 given as +0.67Wm^-2/d. Loeb et al Fig 2d also presents an attribution of this increased absorbed solar warming 2002-20, ☻ 60% cloud albedo, ☻ 7% water vapour, ☻ 4% GHGs, ☻ 26% surface albedo, ☻ 3% aerosol. And note also that Loeb et al Fig 2a shows this 'quite-dramatic' effect occurs almost totally 2013-20.
To explain this attribution; if 4%+7% of this increase-in-Absorbed Solar (decrease-in-albedo) is attributed to GHGs, this means additional GHGs+water-vapour is directly preventing solar being otherwise reflected away and instead directly absorbed by the increased GHG+water-vapour. The underlying cause for the water vapour increase is of course AGW.
Your question implies that you consider there is something other than AGW and increased CO2 driving a significant part of this increase-in-Absorbed Solar (decrease-in-albedo) 2002-20. I don't think I could agree.
Loeb et al does identify the geography of the various components of the net EEI, mapping them out in Fig 3 and pointing to the Surface effect being "greatest in areas of snow and sea-ice, where significant declines in coverage have been observed in recent decades." It is, of course, easy to see that the ice-loss is due to AGW.
And for the biggest component, Cloud, Loeb et al says "Regional trends in net radiation attributable to changes in clouds are strongly positive along the east Pacific Ocean, while more modest positive trends occur off of the U.S. east coast and over the Indian, Southern, and central equatorial Pacific Oceans." Is this the finger print of AGW? If it isn't, it would require an alternative causation.
If AGW is the cause, note that the increase-in-Absorbed Solar (decrease-in-albedo) 2002-20 is mainly occuring 2013-20 which matches the global temperature record showing 70% of the 2002-20 warming occurred in the period 2013-20.
So without further explanation, I see no reason to expect a "flatter" slope from CO2-forcing alone, the slope being presumably all down to AGW.
- How much has nuclear testing contributed to global warming?
Bob Loblaw at 11:16 AM on 25 January, 2022Clay Hansen:
I was able to open the link in your first comment. It does not make your argument stronger.
A few key errors:
- Equations 2 and 3 are incorrect. You have assumed that energy in = energy out (solar vs earth's emissions to space).
- It takes time for the earth-atmosphere system to respond to an imbalance between energy in and energy out.
- The speed at which it responds depends on the heat capacity.
- For the atmpsphere only - ignoring land or water - the e-folding time is on the order of 200 days.
- If you include the ocean mixed layer (60 to 70m depth), we are talking a decade or two for it to respond to an energy imbalance.
- The deeper ocean takes even longer.
- It is impossible to model temperatures on an annual basis without inclduing these heat capacity issues and non-equilibrium conditions.
- Equation 4 is incorrect. You have assumed that the energy in can be calculated from the difference between the σT4 terms for solar (6000K) and terrestrial (assuming about 255K or 288K, you don't specify) along with a "shape factor".
- No such constant "shape factor" can be used for both sources (solar, terrestrial).
- σT4 for solar temperature gives a flux at the surface of the sun. The earth is not located that close to the sun. You need to account for the difference in area between a sphere with the radius of the sun, and a sphere with a radius of the earth's distance from the sun.
- The solar radiation received from the sun also needs to be reduced by a factor of 1/4 to account for the area of the earth as a sphere vs the area of the earth as a disk.
- The solar radiation absorbed by the earth also need to account for global albedo.
- You may claim that your shape factor accounts for this - but the "shape factor" for solar radiation (which is simple geometry) is vastly different from any "shape factor" for earth's emissions to space, and you only have one "shape factor".
- Since the solar "shape factor" is purely geometric, it will not vary over time as you assume in equation 5b.
Given these fundamental errors in the first equations of your model, the rest is nonsense. I did not bother to try to follow the rest of your mathematics, as the initial assumptions are fundamentally wrong.
- How weather forecasts can spark a new kind of extreme-event attribution
wilddouglascounty at 15:05 PM on 12 January, 202215 Eclectic:
Global warming is a measurement that tracks one effect of an increased amount of greenhouse gases present in the atmosphere. The reason it is always important to take causality back to greenhouse gases is for the same reason we take the cause of an enhanced performance back to the ingested steroids instead of attributing that enhanced performance to the improved statistics that that performer has now.
If it were increased solar activity that was warming the planet say 1.5 degrees Celsius, you would have to look at the physics of the increased radiative output of the sun, just we look at the physics of increased heat retention provided by greenhouse gases, and calculate how the sun, not greenhouse gases or other components of the energy balance created the net increase.
We know quite a bit about the physics of solar irradiation and its warming component in the energy balance equation, just as we know quite a bit about the physics of greenhouse gas heat retention in that same equation, right? Both could cause the exact same amount of global warming, but the physics of both, being different and testable, are distinguishable, which is why we have concluded that the GW should have an "A" in front of it, not an "S" right?
- From the eMail Bag: the Beer-Lambert Law and CO2 Concentrations
Bob Loblaw at 12:08 PM on 12 January, 2022The original emailer has sent in a follow-up to the Skeptical Science contact page, asking about black-body radiation and differences between emissions at 255K and 288K. A temperature of 255K is the commonly-cited radiative temperature at which the earth-atmosphere system emits IR radiation to space, while 288K is the commonly-cited global mean temperature for the earth's surface. The difference is a measure of the role of the atmosphere - the greenhouse effect - and this difference is predicted to continue to rise as atmospheric greenhouse gases continue to increase.
The blog post focuses on atmospheric absorption, not emission, but atmospheric absorption by CO2 is a key factor in the greenhouse effect. So, how might that temperature difference - 288K at the surface, 255K at high altitude - affect this process?
A few of the comments to the post touch on aspects of IR emission, and in figure 2 and comment #10 I mentioned Planck's Law, which governs radiation emission. Figure 2 was intended to show the difference between solar (5800K) and terrestrial (255K) sources of radiation, but does not touch on differences for the range of temperatures within the earth-atmosphere system. The recent follow-up email asked to see Planck curves for 255K and 288K (and to see them on a linear scale), so here is that graph:

The horizontal axis is wavelength in μm, and the vertical axis is energy in W/m2/μm.
There are three obvious features:
- At the hotter temperature, the area under the curve is much larger. This area represents the total energy emitted. Hotter sources emit more energy overall.
- At the hotter temperature, the peak happens at a slightly shorter wavelength. Hotter sources shift a larger proportion of their emissions to shorter wavelengths.
- The 288K curve always lies above the 255K curve, so even at a specific wavelength, the hotter source emits more radiation than the cooler source.
The "hotter source" explains why I used a logarithm scale in figure 2. The sun emits a lot more energy than the earth. There is also one more "feature" to figure 2: I scaled the solar output so that instead of giving the intensity at the surface of the sun, where it is emitted, I scaled it down to the value appropriate at the earth's orbit around the sun. That was the only way to get the two lines to graph anywhere close to each other.
So, if we look back at our discussion of the Beer-Lambert Law, what difference does the source temperature have on the absorption of IR radiation? (The original email had mentioned 15 μm, which we see is a little to the right of the peak in the above graph.)
Well, it turns out that the temperature of the source has absolutely no effect whatsoever on the absorption according to the Beer-Lambert Law.
- In the blog post, note that the equations for the Beer-Lambert Law do not have temperature in them.
- You can add a subscript to the Beer-Lambert Law to indicate wavelength, as the absorption coefficent is highly-dependent on wavelength, but it does not matter what temperature the source was at that emitted the radiation.
- It also does not matter what the temperature is at the location the absorbing is happening.
Why is this? Well, there are several factors:
- The Beer-Lambert Law just tells us the probability that a single photon will be absorbed.
- Each individual photon is either absorbed, or not. Do, or do not. There is no try.
- If the photon is absorbed, all the energy goes into the molecule that does the absorbing (and is then transferred to heat all gases through molecular collision).
- If the photon is not absorbed, then the photon will continue along its way, and be transmitted through the atmosphere.
- An absorption coefficient of 0.01 means that there is a 1% chance that a single photon will be absorbed. It does not mean that each photon loses 1% of its energy - it means that 1% of all the photons lose 100% of their energy and the oher 99% lose none.
And all 15 μm photons are the same.
- They travel at the same speed, and they contain the same amount of energy.
- They do not contain more energy if they were emitted from a source at 288K than if they were emitted from a source at 255K.
- The source at 288K that is emitting more total energy at 15 μm is not emitting higher-energy 15 μm photons, it is just emitting more of them.
- The difference between the two curves in the graph above is just that a 288K source emits more photons at all wavelengths, compared to the 255K source. The 288K source can do this because it has more energy (it's hotter!) that can be transformed into radiation.
When CO2 absorbs a 15 μm photon in the atmosphere, it has no way of knowing if that photon was emtited from the surface at 288K, a kilometre away at 270K, or a metre away at 255K. It is just another 15 μm photon carrying the same amount of energy that every other 15 μm photon carries. And that amount of energy just happens to fit nicely into the different energy states that CO2 likes, so it is easy for CO2 to absorb it.
So, the CO2 will absorb the photon, and that heat is added to the local atmosphere, and it does not matter if the location where it is absorbed is warmer or colder than where the photon was emitted.
- How weather forecasts can spark a new kind of extreme-event attribution
Eclectic at 14:47 PM on 11 January, 2022Wilddouglascounty ~ so far in this discussion, my mind has not been subtle enough to discern the effect of the distinction, or difference, that you draw between the concept of global warming vs increased greenhouse gasses in the atmosphere.
To clarify your position: how would you describe the distinction (regarding increase in extreme weather events) in the - strictly hypothetical - case that the current rapid global warming were instead being caused by an ongoing rise in total solar irradiation?
Admittedly there is the crucial difference that such global warming would be beyond direct human intervention in its causation ~ but otherwise the nett effects would mimic AGW. But how would one (i.e. you) draw distinctions in the wording of attribution? And why so?
- From the eMail Bag: the Beer-Lambert Law and CO2 Concentrations
Charlie_Brown at 03:09 AM on 2 January, 2022Bob @ #7
Thank you for providing the graph for HITRAN data. The point that I wanted to make is that increasing CO2 increases the individual high resolution absorption lines in the wings. That is why the effect of CO2 is not “saturated,” but is diminishing with increasing CO2. Moderate transmission programs use algorithms to simplify the detailed line-by-line calculations into an absorption band. Essentially, it is an approach to average the lines within an absorption band, which makes the calculations easier. With this approach, increasing CO2 increases the width of the band, effectively by increasing the inclusion of small lines at the end of the wings.
I have used the version of MODTRAN hosted by the University of Chicago quite a bit, and I find it to be an excellent tool for understanding atmospheric radiation. It is similar to the free demo version from Spectral Sciences, Inc Fortunately, it makes all of the calculations, including Beer’s Law, molar density, temperature, pressure, etc., for you. There is no need to do a lot of math on your own. It is easy to run several cases and plot the Upward IR Heat Flux as a function of increasing CO2. The upward IR heat flux is the energy lost to space. It becomes apparent that the diminishing effect is logarithmic. Because it is an atmospheric radiation model and not an energy balance model, it is a little bit trickier to resolve the overall heat balance to determine the effect on surface temperature, but it can be done. The surface temperature is an input with a default value of 299.7 K for a tropical atmospheric profile and 288.2K for the 1976 U.S Std atmosphere. One can adjust the surface temperature manually, then use trial-and-error to find a surface temperature that causes the overall global energy balance to be closed. This means the upward IR heat flux needs to be constant, since the only other factor in the balance is solar energy in. The logarithmic diminishing effect of increasing CO2 is the same.
- From the eMail Bag: the Beer-Lambert Law and CO2 Concentrations
Bob Loblaw at 02:25 AM on 2 January, 2022CD @ 8:
Well, on your own web site, equation 88.1 is stated to describe the situation when the atmosphere is in "thermal equilibrium". (I assume you mean that temperature is not changing with time, rather than the atmosphere is isothermal.) You also claim that this implies an equality between absorbed radiation and emitted radiation. You are wrong, in more ways than one.
- Conservation of energy applies to all forms of energy. Much of the energy in the atmosphere comes from thermal transfer between the surface (hot) and the air (cooler), and this energy flux extends throughout the troposphere. Additional energy is moved from the surface to the atmosphere as latent heat (evaporation at the surface, condensation in the atmosphere). This is not a "secondary issue".
- The atmosphere is also absorbing some solar radiation, but it is not emitting any radiation at all at those wavelengths. That energy needs to be dissipated by other means - either moved away from where it was absorbed by convection, or emitted as IR radiation at completely different wavelengths. There is no equality between absorbed solar and emitted solar - at any height.
- All radiation energy absorbed in the atmosphere will be shared with all gases at that height (both GH and non-GH gases) by molecular collision. The emission at that height is not dictated by the absorption, but by Planck's Law, which includes temperature and emissivity. Since temperature is affected by all energy fluxes, not just radiation, you cannot assume that other energy fluxes are "secondary" or that radiation absorbed = radiation emitted.
- "Conservation of energy" applies to the total of all gases. Since all gases share thermal energy through collisions, the emission of IR radiation by any single GH gas requires that the temperature of that gas be determined in combination with all other gases. The emitted IR at any height will be the sum of the Planck's Law emissions for all individual gases, and this process does not at all resemble "scattering" or "transmission".
- The absorption of IR radiation at any height is a combination of the absorption of upwelling IR and the absorption of downwelling IR. In an atmosphere with a temperature gradient these will not be equal - in the tropsphere, where temperature decreases with height, upwelling IR is larger than downwelling. The emission will be equal up and down, though, so we immediately see that treating the change in IR radiation as a "transmission/scattering" issue leads to the absurd result that your "scattering" process leads to a case where "scattering" causes more downward IR than is received.
Look at the graphs provided by the MODTRAN web site I mentioned previously. It defaults to "looking down" - i.e., upwelling IR. Choose altitudes of 2, 5, 10 km etc and see how the IR flux decreases as height increases.
Now, repeat with the "looking up" option (downwelling IR). See how the fluxes increase as altitude decreases - i.e., as the IR radiation continues in the downward direction, more and more IR radiation is added to the stream. You cannot interpret this as "scattering with transmission <1". If your theory of the mathematics is correct, this increasing IR radiation requires a transmission coefficient that exceeds 1.
Your mathematics are not correct. They assume things that are not true (absorption = emission, non-radiative energy fluxes are not important).
If you follow the link to Schwarzschild’s equation, you will see that it has independent terms for absoprtion and emission - terms that cover the Beer-Lambert absorption and the Planck emission. This is the correct way to do it.
You started your comments here with the statement that the Beer-Lambert Law does not apply. The argument that you have presented appears to implicitly suggest that Planck's Law also does not apply. You have invented your own theory of radiation transfer, and it has some serious problems.
- From the eMail Bag: the Beer-Lambert Law and CO2 Concentrations
Charlie_Brown at 04:36 AM on 28 December, 2021Bob, thank you for your prompt and detailed reply to my reply. I enjoy technical discussions on the details of the warming mechanism and find few willing to engage at this level. I also think that it is important to have a solid understanding of the concepts to counter claims made by deniers, which often are based on a kernel of truth with explanations that are badly distorted. The concepts are complex, but they can be simplified. One does not have to be a climate scientist expert, university professor, or math whiz to work through them. I am a retired chemical engineer who took some radiation heat transfer courses in college, and have developed most of my thinking about global warming over the last 2 years.
Regarding measurements of attenuation by CO2 in a cylinder, the photons that are absorbed by a CO2 molecule are re-emitted, most likely toward the wall where they will be absorbed and converted to thermal energy. The energy will not be re-emitted from the walls at the same wavelength as emitted by CO2. It is unlikely that they will travel in a straight line and be measured at the end of the cylinder. Beer’s Law of attenuation describes the fate of the photons that are emitted from a source until they strike a target, not what happens with re-emitted photons. This is why I like to describe the atmosphere as layers of shells that have no sidewalls. Multiple stacked cylinders with adjacent, transparent walls is the same thing.
Regarding re-emission, it took me a long time to think through the problem of attenuation of surface IR through layers of the atmosphere and trying to figure out how many layers it would take as half of absorbed/emitted energy does up and half goes down. Finally, I realized that it is unnecessary to start at the surface and think about re-emission, convection, conduction, evaporation and condensation. Global warming is the result of the overall system energy balance, which is simply:
Solar energy in = IR emitted to space from the uppermost emitting layer for each IR wavelength + Accumulation
In the 13-17 micron range, Beer’s Law explains that the uppermost emitting layer is the lower stratosphere for many wavelength peaks emitted by 400 ppm CO2. The uppermost emitting layer for other GHG depends on their molecular density. For water vapor, the uppermost emitting layer is the troposphere, where the temperature is warmer than the bottom of the stratosphere. At wavelengths transparent to GHG, the emitting surface is the earth’s surface. It doesn’t matter how many layers, or cylinders, of 1% or of 90% attenuation are stacked in the lower atmosphere. Again, radiant energy lost to space depends only on the uppermost emitting layer. Where there are CO2 molecules, photons will be emitted at an intensity related to the temperature. There does not need to be conservation of photons from those emitted from the surface. Any imbalance in the photon count will be manifested as thermal energy changes, including by conduction to adjacent non-GHG molecules.
The link that you provided to Schwarzschild’s equation provides excellent descriptions of the essential role of the lapse rate, as well as attenuation. If I am not expressing my thoughts clearly enough, I recommend reading the sections on “Origins of the greenhouse effect,” “Saturation,” and “Applications to climate science” in that linked Wikipedia article.
- It's albedo
MA Rodger at 09:45 AM on 17 December, 2021blaisct @108,
You talk of a "correlation in figure 2(f) CERES 20 years 2 (aka Loeb et al 2021)" which I find most odd as I see no correlation there. The figure 2(f) simply presents an attribution of the increasing IEE 2005-20, the sum of the attributions presented in figs 2(d) & 2(e). I thus fail to see any "conflict" between Fig 2(f) & fig 1. The total of the attributed components presented in fig 2(f) (+0.41Wm^-2/decade) is also the trend for the data shown in fig 2(c), CERES data which differs from fig1 only in that it covers a slightly extended period. I am thus not seeing any "conflict".
And do be aware that the "in situ" (data which is in the main Ocean Heat Content data) is presented as a check on the CERES net values. If there was not a good fit between the OHC & CERES data, the CERES data would be seen as le robust with its use within the analysis thrown into some doubt. So the view that CERES should show less trend than "situ data if GHGs were a significant effect" doesn't stack up at all.
Loeb et al (2021) is saying that CERES shows an increasing trend in downward radiation of +0.65Wm^-2/decade, part balanced by an increasing trend of +0.24Wm^-2 upward radiation, yielding a net downward EEI trend of +0.41Wm^-2. And a 'Partial Radiative Perturbation Analysis' attributes this net EEI trend almost entlrely to factors directly or indirectly resulting from AGW, these factors being:-
+0.25Wm^-2/decade due to cloud albedo (which will comprise a reduction in cloud fraction and an indirect aerosol effect which presumably will be negative through this period).
+0.31Wm^-2/deacde due to increasing water vapour (this due to global warming).
+0.22Wm^-2/decade due to "other" effects (dominated by increased GH gases as well as a small solar variation which would have been negative through the period).
+0.18Wm^-2/decade due to secreasing surface albedo (this shown in polar and mountain ragions and thus again a product of global warming reducing ice/snow cover.
+0.01Wm^-2/decade due to a reduced direct aerosol effect.
-0.53Wm^-2/decade due to a warmer planet increasing outward radiation.
I do not see any correlation between albedo and global temperature, certainly not in Loeb et al (2021). Perhaps you could explain where you see it.
These EEI trends acting since 2005 have collectively added some 0.7Wm^-2 to the EEI over the period to a start-of-period EEI of 0.4Wm^-2. Finally there is a concern that these 2005-20 trends are perhaps not representitive of the long-term trend. One factor not addressed by the analysis is the potential for significant short-term effects due to the situation prior to the period (thus the start-of-period EEI of 0.4Wm^-2 may be a poor start point). Loeb et al do consider short-term effects acting during the period 2005-20 that may abate long-term, specifically the PDO.
- It's albedo
blaisct at 05:08 AM on 15 December, 2021Once again thanks for your comment (MA Rodger and the editor) and the additional papers on the subject. I will try to do better with the links.
The earlier data I was referring to was earthshine 10 years and CERES 10 years which showed that the data for the earths albedo was very noisy and flat. The flat part was what was expected for anthropogenic greenhouse gas , AGH, global warming. My initial understanding of AGH radiative forcing was that AGHs absorbed radiation (got hot) and that the higher the AGH concentration (at constant radiation) the more heat it could hold back thus the temperature would increase but the energy in vs out of the zone where this occurred would be the same (albedo would be flat). My understanding has been expanded to include: AGHs hotter temperature will reduce humidity and thus reduce cloud cover, expose more earth surface to the sun thus reduce earths albedo; therefor, albedo vs time for AGHs may not be flat.
The new (new to me) data I sited Earthshine 20 years showed a decrease albedo from both earthshine and CERES data – my only interest is this report was the agreement with earthshine an CERES data. The editor’s link CERES 20 years 1 and another link CERES 20 years 2 provided a lot more CERES data with different analyses. These three papers are the first time I have seen data showing a decrease in albedo (increase in TOA radiation) vs time. If all climate change was due to AGHs this graph would be flat. Using the CERES 20 years 2 graph for TOA radiation out. (of the three links I chose this one because it has the In Situ data (earth surface temperature)) one can see the good correlation between In Situ data and CERES data

Figure 1
“Comparison of overlapping one-year estimates at 6-month intervals of net top-of-the-atmosphere annual energy flux from the Clouds and the Earth's Radiant Energy System Energy Balanced and Filled Ed4.1 product (solid red line) and an in situ observational estimate of uptake of energy by Earth climate system (solid blue line). Dashed lines correspond to least squares linear regression fits to the data.”
. If there was any AGH global warming mixed In with the TOA (red) data it would have a slope lower than the In Situ data. The report CERES 20 years 1 did look for the AGH flat line signal and found it in the “Clear Sky” LW (long wave) data but nowhere else (1 of four graphs).
Two of these reports put a lot of emphasis on clouds decrease (new to me). (Decrease in cloud cover increased surface exposure to suns radiation and heats the earth more.) The report CERES 20 years 2 also found correlation to Water vapor, trace gases, surface albedo, as well as clouds. Both of these reports express doubts on the current understanding of climate change and make recommendation to further understand what is causing cloud cover to change.
While this new data is interesting and worth following up on it is still very noisy (low R^2) and another 20 years would be better.
I recognize that AGH global warming would promote other forcing including reduce clouds, reduced ice, reduced snow cover all exposing more surface to direct rays of the sun. Other man-made albedo changes can do the same thing. Here are two examples that may relate to the new papers.
Let’s start with the “heat island effect”, UHI. While the global warming from UHI’s lower albedo is small it does have observable effect on cloud formation, CERES 20 years 2.

“Figure 3
Attribution of Clouds and the Earth's Radiant Energy System net top-of-atmosphere flux trends for 2002/09–2020/03. Shown are trends due to changes in (a) clouds, (b) surface, (c) temperature, (d) combined contributions from trace gases and solar irradiance (labeled as “Other”), (e) water vapor, and (f) aerosols. Positive trends correspond to heat gain and negative to loss. Stippled areas fall outside the 5%–95% confidence interval. Numbers in parentheses correspond to global trends and 5%–95% confidence intervals in W m−2 decade−1.”
When air rises from a UHI it is hotter than the incoming air without a source of moisture to saturate it; so, it leaves as dryer air. This air generally rises and moves to the east. Look at figure 3 (a) and see the lower cloud formation change off the coast of east USA, Tokyo, and downwind Europe. With time (1880-2021) the UHI does not get hotter but it gets bigger thus the volume of low moisture air gets bigger. I am not going to argue the significances of the albedo part of UHI other than to recognize it is lower than 1 W/m^2 but not zero. What UHI is not given credit for is what happens downwind to this hotter low humidity air. Does it cool the ocean, reduce the snow line, melt ice, or reduce the cloud cover down wind, since this hot dry air should rise the clouds should be the first target. I can also see a chain of events: Hot low moisture air (from AGHs, UHIs, or other land changes) rises and go downwind, reduces cloud cover, over water the sun heats the ocean, the hotter ocean currents circulate to the poles, and melt some ice.
I’ll leave the quantification of this observable (figure 3 (a)) new (to me) correlation to others. A new UHI contribution to GW will be the albedo effect + the lower cloud effect + any other.
Second, is land use changes such as forest to crop or pasture land or grass land to crop land. Albedo decrease in grass land to crop land change is documented in Grass to Crops. Forest to crop land change increase in albedo is documented in Forest to Crops. Over 205 years the paper Global albedo study calculates that all the pluses and minuses add up to little change in albedo from land use changes. It is assumed (by me) that decreased albedo of a parcel of land means an increase in temperature and vs/vs. The study Amazonia Forest to Crops shows that increasing albedo does not always mean cooler temps. This report shows that when rain forest was replaced with crop land that the temperature increased, the rain decreased, and the cloud cover decreased. The Figure 3 (e) above shows bright red spot for “water vapor” (I assume that is change to lower humidity) in Amazonia. This is not an uncommon effect from replacing forest with crop or pasture land. The report Forest study observes that forests vs crop/pasture conversion gets warmer as the conversion gets south of 35’N latitude.
This unintuitive (to me) observation that an increase in albedo does not always result in a decrease in temperature can be explained by moisture. The resulting temperature depends on a constant enthalpy (total heat in the air= gases + moisture). Enthalpy is usually determined by the albedo (higher albedo lower enthalpy vs/vs); therefore, land exposed to the same albedo (enthalpy) can have a wide range of temperatures depending on the moisture (relative humidity) of the albedo (enthalpy). This relationship has been captured in a psychrometric chart,
(Sorry for the poor quality of this chart)
Example of a rain forest conversion to crop land: Start out with a rain forest at 25’C (bottom scale) go straight up to 90% humidity curve; this is our hot humid rain forest. If we convert this rain forest to crop land with a higher albedo, we move to a lower enthalpy line (anyone will do). The constant enthalpy line run diagonal (upper left to lower right). If the moisture is maintained at 90% the temperature will drop as expected for the higher albedo. Following the same enthalpy line (same albedo) go to a lower humidity curve that may result (and does in Amazonia) and one will see the temperature will increase (even to above the starting rainforest temperature at very low humidity).
A concern is how NASA and the IPCC pair surface temperature data with relative humidity and albedo. The three all connected in enthalpy. A misunderstanding of climate change could occur if Amazonian (rain forest to crop land) high albedo, high temperature, lower humidity type data was included in correlations with Canadian (forest to crop land) lower albedo, cooler temperatures, high humidity, type data. Does anyone know if this has been looked at? The report CERES 20 years 1 has looked at ocean enthalpy correlations. I have not seen any land enthalpy data. - It's the sun
cph at 21:57 PM on 11 November, 2021
Diagram showing the monthly fluctuations in total global cloud cover since July 1983. During the observation period, the total amount of clouds fluctuated from about 69 percent in 1987 to about 64 percent in 2000. The annual variation in cloud cover follows the annual variation in atmospheric water vapor content, which presumably reflects the asymmetrical distribution of land and ocean on planet Earth.
Within the still short period of satellite cloud cover observations, global cloud cover reached a maximum of about 69 percent in 1987 and a minimum of about 64 percent in 2000 (see diagram above), a decrease of about 5 percent. This decrease corresponds roughly to a net change in radiation of around 0.9 W / m2 within a period of only 13 years, which can be compared with the total net change estimated by the IPCC 2007 report from 1750 to 2006 of 1.6 W / m2 for all climate drivers including greenhouse gas emissions from fossil fuel burning(cooresponds to your mentioned 2,5-3W/m² in 2021). These observations leave little doubt that cloud cover variations can have a profound impact on global climate and meteorology on almost every time scale considered.
The total reflectance (albedo) of the planet earth is about 30 percent, which means that about 30 percent of the incident short-wave solar radiation is reflected back into space. If all the clouds were removed, the global albedo would drop to around 15 percent and the short-wave energy available to warm the planet's surface would increase from 239 W / m2 to 288 W / m2 (Hartmann 1994). However, long-wave radiation would also be affected, which emits 266 W / m2 into space compared to the current 234 W / m2 (Hartmann 1994). The net effect of removing all clouds would therefore still be an increase in net radiation of around 17 W / m2. So the global cloud cover has a significant overall cooling effect on the planet, although the net effect of high and low clouds is opposite.
HK: - "but also through its warming effect through its strong greenhouse effect, which is the most important of all positive (reinforcing) feedbacks on a global level."

According to the current status, the net radiation effect of clouds is -19W / m² (Wild 2019) and corresponds very well with + 0.9W / m² per 5% less cloud cover.
High levels of global cloud cover are associated with low global temperatures, demonstrating the cooling effect of clouds. A simple linear fit model suggests that a 1 percent increase in global cloud cover corresponds to a global temperature decrease of about 0.07 ° C.
- Can the economy afford NOT to fight climate change?
sfkeppler at 00:14 AM on 23 September, 2021Economy cannot afford NOT to fight climate change, that’s right! – But how can we effectively fight global warming, if the only alternative given is to reduce energy, the human’s economies vital input? At what extent economy can afford climate action without mutilation of survival?
Yes, we can! – It’s not necessary to stop energy consumption, when fighting global warming by boosting global water cycle. Everybody studying about the carbon impact and its sophisticated relation in the biosphere, with diagnostic results. Utopic thoughts about geo-engineering with unimaginable global impacts. Science should really put the feet on earth!
The global water cycle is the natural way to intervene against global warming! “GAIA”, the auto-regulating hyper-organism, asserts temperature by water circulation. And we should learn more about the different instruments we have to enhance or reduce the fluxes. We know that evapotranspiration in the tropics by solar radiation and direct warming distributes water in the southern and northern hemispheres. We also know that evaporating water cools surfaces and returns as refreshing water. Vapor at the equator produces convection and drafts up to higher regions, where we observe ice-clouds in the uppermost layers of the troposphere. These drift to the poles and bring snow to the higher latitudes by “scratching” the stratosphere with freezing temperatures of -50°C.
It might be quite easy to booster tropical evapotranspiration, by installing artificial evaporators at the eastern coast around the Equator-line. Look at Somalia, were the mangroves have been removed for firewood from our human ancestrals. At the horn of Africa, I am sure we make the Somalian desert disappear! - It's albedo
coolmaster at 02:18 AM on 11 September, 2021BL80:
BL: I know Dr. Wild. I've worked with him in the past.
My google can`t find anything. As long as you do not respond a link, it seems to be a silly lie.
BL: ...it condenses to form cloud, but this is not always the case.
BL: ...So will this "extra" moisture cause more clouds? Maybe. Maybe not.
same problem - no link - no references
BL: I have provided references to published science that shows not all clouds cause cooling when cloud amount increases. I see you have done absolutely nothing to refute the validity of those studies.
I provided this link last week:
https://www.climate4you.com/ClimateAndClouds.htm#Cloud%20data

You see clouds feedback during the last decades triggered by a warming atmosphere measured by satelittes. Do you really think your reference of 1960 is something new to me ?
You still confuse effect and feedback.
This is clouds radiative effect: IPCC AR6 CH. 7.2.1
Without clouds, 47W/m² less solar radiation is reflected back to space globally, while 28W/m² more thermal radiation is emitted to space. As a result, there is a ~20W/m² radiative imbalance at the TOA in the clear-sky energy budget suggesting that the Earth would warm substantially if there were no clouds.
BL: - Summer is only one of four seasons. - local is not global - so that that there
please provide a specific reference to a page number and quote. Otherwise, you are just throwing out...
-— thanks MOD that`s enough ---
- It's albedo
Bob Loblaw at 12:52 PM on 9 September, 2021Coolmaster:
Little of your most recent comment has passed moderation. In what little remains, you double-down on your claim of a strong cooling effect for clouds. Let's examine some actual science.
Note that in comment 70, although I said that the diagrams you provided in comment 69 were "a useful expansion", I also noted that "summary diagrams are summary diagrams - not detailed models."
First, you claimed in #71 that 1% increase in evaporation will lead to a 1% increase in clouds, and you have repeatedly claimed that increasing cloud has a cooling effect. You also said "I look forward to your criticism and assessment", so let's see if you really mean that.
We will start with the consequences of an increase in evaporation, and we'll limit it to the land surface you have talked about (although it doesn't really make any difference to what I will present). What happens when we manipulate surface conditions to increase evaporation?
- Atmospheric water vapour will increase above that surface.
- The atmosphere will probably move that water vapour away from the surface, either vertically (convective mixing) or horizontally (advection due to wind)..
- If conditions are suitable, that extra water vapour may rise to the point where it condenses to form cloud, but this is not always the case. If it does form cloud, the location may be local, but it is more likely to be a long way away.
- As a consequence of increasing evporation, the location where the evaporation occurs will also see less thermal energy transfer to the atmosphere, so temperatures are also affected. As a result, we see changes in both temperature and humidity, and these changes will be carried downwind.
- Downwind, the changes in temperature and humidity will affect the energy fluxes in those other locations - possibly suppressing evaporation (because the overlying air is now cooler and more humid).
Now, if the additional water vapour forms cloud, we have to ask "what kind of cloud?". That depends on where and how the lifting of the air occurred which led to cooling and cloud formation. Cloud types vary a lot. Wikipedia has a nice discussion, and gives us this nice diagram:
")
So, will this "extra" humidity cause more cloud? Maybe. Maybe not. Maybe it will lead to a different cloud type. Maybe it wll lead to a similar cloud type, but at a different altitude. All of this will affect how radiation fluxes will be affected.
Coolmaster's argument then depends on claims that cloud cover will increase, and that the diagrams he has provided show the radiatove flux changes. Let us consider some of the possible radiative changes.
- A change in horizontal extent - but no change in any other cloud characteristics - will affect the ratios between clear sky and cloudy sky. This is easy to estimate.
- We may not have the same cloud type, though. Different cloud types have different radiative properties. High clouds tend to be thin, transparent, and let a lot of solar radiation through. They also may not behave as blackbodies for IR radiation.
- Low clouds are much less transparent. For IR radiation, two properties are important: cloud top temperature controls the IR emitted upward, while cloud base temperature controls the downward flux. Change the vertical temperature profile, or change the bottom or top heights of the clouds, and you change the IR radiation fluxes. This is not determined by cloud area.
None of these details are covered in the diagrams or discussion presented by coolmaster. I will repeat what I said before: summary diagrams are summary diagrams - not detailed models.
Can we find models that do include thse sorts of effects? Yes. I will dig back into two early climate change papers that were key developments in their day. They covered basics that more recent papers do not repeat, so they provide useful diagrams.
The first is Manabe and Strickler, 1964, JAS 21(4), Thermal Equilibrium of the Atmosphere with a Convective Adjustment.
Their figure 7a shows model results that cover different cloud assumptions:

Note that cloud type and height both have significant effects on the modelled radiative equilibrium. (Follow the link to the paper if you need more context.)
The 1964 paper was followed by another in 1967: Manabe and Wetherald, 1967, JAS 24(3) Thermal Equilibrium of the Atmosphere with a Given Distribution of Relative Humidity
They give two figures of interest: 20 and 21:

Again, follow the link to the paper for context (and perhaps larger views of the graphs).
These two figures show responses to changes in cloud amounts, for several different cloud types in their model.
- In figure 20, low and middle cloud have negative slopes (temperature as a function of cloud amount), while high cloud has a positive slope. Increasing high cloud has a warming effect.
- In figure 21, we see three diagrams of equilibrium temperature, for the same three cloud types. Each diagram shows the results for three different cloud amounts (0, 50, and 100%). The diagram on the left is for high cloud, and we see warmer tropospheric temperatures for higher cloud amounts. This is the opposite for middle and low cloud, where increasing cloud amount causes cooling.
So, we can see that climate science has know for over 60 years that different cloud types and heights have significant differences in their role in radiation transfer. The papers I have cited used a one-dimensional radiative-convective model, which is simple by modern standards. Current three-dimensional general circulation models incorporate even more vertical cloud processes, and add the horizontal dimensions that include the horizontal transport of water vapour I mentioned at the start of this comment. They generate cloud internally, based on physics, rather than assuming specific distributions - but the key message is the same:
Cloud amount, cloud type, cloud height, horizontal distribution - all are important in properly assessing the radiative effect of clouds.
Coolmaster's diagrams are nice pictures that help illustrate a few aspects of the complexity of clouds and atmospheric radiation transfer, but they are totally unsuited to the sort of predictive analysis he is trying to perform.
- It's albedo
coolmaster at 10:43 AM on 3 September, 2021Also in response to blaisct's comment #66 posted over on the Urban Heat Island discussion.
The albedo is relative ... and depends primarily on the wavelength of the light that hits the body. We should therefore always specify a wavelength range for Albedo. Otherwise, strictly speaking, the entire spectrum of the sun is decisive. This relativity to the albedo is particularly important for an element as widespread worldwide as H²O.
As water vapor, it absorbs (28W / m²) largely only in the long-wave range and lets most of the visible light pass through.
As liquid water on the surface, it absorbs long-wave and short-wave light very strongly, although as a cloud in the same aggregate state, finely distributed in the atmosphere, it again reflects a high proportion (-47W / m²) of the high-energy, short-wave radiation.
As solid ice or snow on the surface, it reflects short-wave radiation as well as clouds. On the other hand, in the long-wave range it behaves like a black body and a layer of ice over the open sea isolates the one below
warmer water and prevents it from emitting its heat radiation to the atmosphere and space which in turn relativizes the ice albedo effect.
So @bleisct is not that wrong if he ascribes the Earth's albedo a major influence on global temperatures. The atmosphere (and every single component - including CO² molecules) also has an albedo if the solar spectrum is viewed holistically across all wavelength ranges and light refraction and transmission are taken into account as factors. Higher levels of GHG lower earth`s albedo by absorbing ~20% of radiation energy.
@MA Rodger is right when he remarks that the cloud albedo ingeniously has the strongest albedo and the global albedo(change) is of very minor importance over urban areas.
With a global mean surface albedo of 13.5% and net shortwave clear-sky flux of 287 Wm−2 at the TOA this results in a global mean clear-sky surface and atmospheric shortwave absorption of 214 and 73 Wm−2, respectively. From the newly-established diagrams of the global energy balance under clear-sky and all-sky conditions, we quantify the cloud radiative effects(CRE) not only at the TOA, but also within the atmosphere and at the surface.

 cloud radiative effects (CRE)")
When assessing the earth`s albedo, it`s also helpfull to have a look to the different radiation balances from land and sea and the fact that the cloud albedo is very closely interlinked with latent heat flux of evaporation in the radiation balance.
Do not confuse the strongly cooling CRE (-19W / m²) with the warming cloud radiative feedback CRF of ~ + 0.42Wm-2 ° C-1, which is a missing +RF in the above graphic by @Bob Loblaw as is also the radiative forcing of the ice Albedo effect.
.


- It's albedo
Bob Loblaw at 02:35 AM on 15 August, 2021Also in response to blaisct's comment #66 posted over on the Urban Heat Island discussion.
Blaisct:
You continue to make poor choices in the numbers and calculations that you are doing. Going over your latest effort by number:
1. You continue to select an albedo for urban areas that is too low for anthropogenic surfaces, and you have failed to cite a reference for your value. In my comment # 64 on the Urban Heat Island discussion, I gave a reference to several artificial surface materials, all with albedo values that exceed the the value you have chosen. "Urban" areas are a mix of things like grass, roads, houses, etc. You would need to calculate how much of the surface is covered by each type, and work out an albedo for an "urban" area that way. If that is what you have done, you need to show your detailed calcuations on how you arrive at the 0.08 value.
2. There are no assumptions in the 0.31 albedo value for the earth as a whole. That is based on satellite measurements, and includes reflection from the surface, clouds, clear atmosphere, etc. Note that the only part of the surface reflection that reaches space is the part that makes it back out through the atmosphere and cloud cover. To calculate this in a model (which is what you are trying to do), you need to account for spatial variations (and daily/seasonal cycles) of solar input, surface albedo, cloud cover, and atmospheric conditions.
3 to 14. You continue to make unreasonable assumptions about the area that is undergoing a surface change, and how it relates to population. There is no reason to think that they are related through a simple proportion.
15 to 20. You continue to make errors in converting solar output (1367 W/m^2 measured perpendicular to the sun's rays) to an areal average over the surface of the earth. As MIchael Sweet points out, there is a factor of 4 involved, not a factor of 2. I also mentioned this in my earlier comment. If you do not understand why this is the case, then it is difficult to see how you can expect to do any useful calculations. You also need to consider seasonal variations in solar radiation distribution and seasonal albedo.
21. Converting radiative forcing to global temperature change involves looking at the top-of-atmosphere changes (what is seen from space), not surface changes alone. To properly incorporate surface changes into a calcuation, you need to use a much more complicated model of climate response to surface albedo changes.
22. You still get a wildy incorrect answer, due to bad data input and bad assumptions.
I have not bothered to follow the link to the Mark Healey document you mention. If that is the source you are getting your incorrect ideas from, then it is not worth bothering. The result you quote (that albedo changes can account for all the obsvered temperature rise) is completely inconsistent with the science.
Over at RealClimate, they have recent posted several articles on the just-released IPCC reports. One of those summarizes 6 key results. In that post, they provide the following graph from the IPCC report, which shows the estimated temperature response due to a variety of factors over the last 100 to 150 years. "Land use reflection and irrigation" is the second-last bar on the right. Note that the calculated effect is minor cooling, not warming.

Michael Sweet's suggestion to read the IPCC reports is a good one. I often suggest that people start with the first 1990 report, as this covers a lot of the basic climate science principles in a manner that is easier to understand for the non-expert. In the 1990 report, they mention the Sagan et al paper I linked to in my first comment. Google Scholar can probably help you fnd a free copy.
https://science.sciencemag.org/content/206/4425/1363.abstract
- It's albedo
michael sweet at 01:05 AM on 15 August, 2021blaisct:
From here: It is generally a waste of time to do your own calculations. The albedo of urban areas cannot have changed more that 50%. The area of urban areas is less than 1% of the Earth's surface. A 50% change in albedo in such a small area cannot have such a large effect.
For starters you need to devide incoming solar radiation by 4 and not 2 to account for day/night and the curvature of the Earth.
Vacant land converted into farmland has significant (possibly greater) changes in abedo than urban areas and is a much greater part of the Earth's surface. The melting of Arctic ice causes a greater change in albedo than the rural/urban change does. We see that reflected in the Arctic increasing in temperature faster than the rest of the Earth. If urban areas caused 30% of the warming they would all be extremely hot during the day. This is not observed. If your calculations were correct than albedo changes would account for all of global warming and that is not what is observed.
If you look in the just released IPCC report you will undoubtedly find a chapter on albedo change. See what the scientists say. An old saying among grad students is "An hour in the library will save you a week in the lab". See what you can find in the IPCC report and come back here to inform us.
- It's Urban Heat Island effect
MA Rodger at 06:51 AM on 28 July, 2021blaisct @62,
Perhaps repeating some of the criticism @64:-
You say "The IPCC seems to give man-made albedo changes low significance because it is hard to measure and hard to detect change." But difficulty does not appear to be something to dampen your enthusiasm.
Do note that 0.04 albedo is far too low and, while potentially applicable to a sky-pointing piece of asphalt, is not applicable to urban areas. Also note that clouds float above cities forests and oceans alike and they contribute some 75% of the planet's albedo. And also note that the sun sets every evening and never rises to be overhead except at noon in the tropics. You need to divide the tropical noon-day value by four to satisfy the very simple geometry of spheres.

The solar radiation actually reflected spacewards by the Earth's surface is shown in the diagram at 23Wm^-2. If by 2100AD, the planet's urban spread were somehow to reach over 0.7% of the planet's surface area (as the most extreme projection in the graphic @60 suggests is possible) and even if that 0.7% had an albedo of zero, that 23Wm^-2 would only reduce by [23 x 0.007 =] 0.16Wm^-2 which, despite the use of the most exaggerating numbers, is significantly smaller (x10 smaller) for 2100AD than the value you arrive at for today's value. Using more realistic numbers would return an insignificant result (x100 smaller).
- It hasn't warmed since 1998
Vonyisz at 01:51 AM on 21 April, 2021I would have a methodological questions. As this text suggests:
„To claim global warming stopped in 1998 also overlooks a simple physical reality - the land and atmosphere are just a small fraction of the Earth's climate (albeit the part we inhabit). The entire planet is accumulating heat due to an energy imbalance. The atmosphere is warming. Oceans are accumulating energy. Land absorbs energy and ice absorbs heat to melt. To get the full picture on global warming, you need to view the Earth's entire heat content. More than 90% of global warming heat goes into warming the oceans, while less than 3% goes into increasing the atmospheric and surface air temperatures. Nuccitelli et al. (2012) showed that the Earth has continued to heat up since 1998.”
– global warming is not really about temperature, but about the amount of energy.
But this is often misunderstood. Throughout the media, global warming is portrayed as if it could be characterized by changes in temperature.
Q = c * m * ΔT, but here c is not an exact value, consider large pressure and temperature differences
E (pot) = m * g * h, E (kin) = (m * v ^ 2) / 2
And I would have more questions here.
1. What do we refer to the amount of energy? Atmosphere? The kinetic and potential energy of air? With or without hidden heat? (The equivalent potential temperature (theta-e) is the temperature a sample of air would have if all its moisture were condensed out by a pseudo-adiabatic process (i.e., with the latent heat of condensation being used to heat the air sample), and the sample then brought dry-adiabatically back to 1000 hPa.) Surface? How deep? One meter? More? Caves? Groundwater that has a connection to the surface? Top 200 meters of oceans? Or the whole ocean? Energy stored in salinity and depth? Ice? Melting or freezing energy? Potential energy?
1.conc. Average global temperature? Why? When misleading in light of the above: the amount of energy (no matter how we determine what we include in it) is not equal to temperature. Thus, a change in temperature cannot be equal to a change in the amount of energy! Not me saying that. The quoted text does this.
2. We determine what we want to measure. Can it succeed? Can we assign a global average to the temperature of the entire earth? When I buy myself a pair of pants, at least three metrics help me with that. And do we characterize the average temperature of the earth (or rather the total amount of energy) with a single data? Even if we do, what are we going to do with it? What usable speech data does this tell us? This is because exactly what spheres are included in the total energy calculation are closely related to this data. If we calculate this as accurately as we wanted, what can we say about how long this accuracy has been available to us in the past? 10 years ago? 100 years?
2.atm. Do we really measure the temperature and humidity and density of the entire atmosphere? Do we really know the temperature of the earth's surface all over the earth at a depth of one meter?
2.surf. Do we know how much energy is stored in that part of the earth’s surface that is involved in the processes detailed here, absorbs sunlight, and largely heats the atmosphere? Do we know its density? Do we know your specific heat? Do we know its water content? Maybe it's not just the top one that counts? Could it be several meters in some cases? Who can say that? How to calculate? If someone says something, what to expect from him? How do you justify his theory?
2.oce. Do we know the temperature and the amount of dissolved salt everywhere in the oceans? Of course, we don't have an instrument everywhere, we fill in the missing data with approximation calculations. What is the ratio of the total error rate caused by the approximate calculations to the percentage of change to be examined? I read in several places that only the top 200 meters of the oceans matter in terms of global warming. Others write 100 meters. Many people write that the deep ocean has only long-term effects, it doesn’t count in the heat balance in the short term. Why a hundred? Why two hundred? Why doesn't it matter? The limit drawn here seems very arbitrary to me, and in terms of the change in total energy ... it is important to decide and justify: whether or not to include the deep ocean in the energy balance when examining global warming!
2.conc. I see a lot of temperature charts pros and cons. This is how the temperature goes up or how the earth cools. But none of the camps really show how the total amount of energy on earth measured according to the principles detailed above has changed, at least in the last 10-20 years, where perhaps we already have evaluable data in this regard. How can we start a scientific debate without clarifying the framework? The concepts? Principles of repeatable measurements? How is the data processed? Both camps bombard the media with marketing texts that pick it up as raw material and distort it so that it will no longer be completely untraceable to the average person.
3. A degree of warming of the whole ocean is approx. on the order of 10 ^ 24 Joules. Melting the ice of Antarctica would absorb 10 ^ 24 Joules of energy. A degree of warming of the dry air is on the order of 10 ^ 21 Joules. The Sun kisses the Earth with 10 ^ 24 Joules of energy in one year.
Based on these, the scare that the entire Antarctic ice sheet will melt soon seems rather doubtful. This event would eliminate the amount of energy in a whole year of solar radiation (of the same order of magnitude). This needs to be justified! While land ice heats the air when it forms and cools the air when it melts, the formation of coastal ice hanging in the ocean heats both the surface of the ocean and the air, but its melting typically cools the deeper layers of the ocean. Interestingly, land ice can be coastal ice. I hope I use good concepts. The direction of energy as a whole: heat is transferred to the atmosphere from the deeper parts of the ocean. People with CO2 can't warm up the ocean as a whole, just the top few hundred meters. And that is my next question. Are we counting the incoming solar rays and the outgoing infrared rays in the total amount of energy on earth? For example, the city is 35 degrees Celsius in vain if objects are 50-70 degrees Celsius and radiate heat unbearably to humans, while the same 35 degrees in the forest is unpleasant but tolerable because here the temperature of the objects is not higher than the air temperature. Here, the air temperature alone is very misleading. And sorry for the analogy, do we count the energy on the ocean heat transfer road to the total amount of energy on earth? I would like to draw attention to a trap. When the ocean conveyor delivers less energy, the average temperature in the upper part of the ocean is lower, but in this case heat is trapped around the Equator and the poles cool. On the other hand, with higher energy transport, the surface temperature of the oceans increases, most of the excess heat arrives at the poles from around the Equator, so significant warming begins here, more significant than at the Equator. However, the excess heat at the poles also means that the earth's surface can radiate over a larger surface at a higher temperature (T ^ 4). Overall, more heat is dissipated compared to when the capacity of the oceanic strip was smaller, disregarding other factors. I am thinking in particular here that, as soon as the Arctic ice melts in the summer, this process must be taken into account, because the thermal insulating effect of the ice will disappear.
3.conc. Is it conceivable that a change in the latter will affect a change in the distribution of the total amount of energy on earth? Perhaps these and other relevant metrics can bring the understanding and explanation of global warming closer to both experts and the average person? - Skeptical Science New Research for Week #9, 2021
jamesh at 07:01 AM on 5 March, 2021I found doug-bostrom's posting very helpful inasmuch as it focused on several issues that can be discussed in a frendly atmosphere. The first is the warming of our invironment in the US in the years since the end of WW2. at the end of the war we had a population of 14o million. Housing developments were built on what was farm land. Power plants were built, both nuclear fossil fuel. The interstate HWY system was built. plus a lot of secondary roads. Dams were built for the purpose of generating electricity. The Marble canyon dam created the enormus Lake Powel. I don't know the impact of Lake Powel, I leave that to the experts. The St. Lawrence Seaway project was built to genrtate electricity. New power lines were built to transmit all the new power. At least 30 pct of transmited power is lost to the environment. We built shopping centers, high rise buildings, waste water treatment plants which were designed to use the aerobic process, drinking water treatment plants. solid waste disposal methods which were very energy Americans had to pay for all of the above energy intensive projects, so to call them deniers is unfair. The next issue I want to deal with is the measurement of energy in the environment. We have heated up our invironment, and I assume it can be decteded by sattelites, but there is hidden energy which can be computed but not detected. To prove my point I chose to pick a municipal reservoir used for drinking water. Such reservoirs are closely monitored for PH, temp. etc. The water is soft and the goal is to keep it that way. Said reservoir recieves a certain amount of solar radiation every day, which can be estimated. Once the energy is adsorbed by the water it is essentialy in storage, we cannot measure it, and it doesn't matter where we try to measure it, we cannot see it. If we know the temp. of the water we can calculate how much energy is lost through evaporation. When the evaporation process takes place, we still cannot takr a direct measurement of the watervapor. The watervapor will eventually cool and release it's energy. So it looks to me like we have an energy transfer system to which our instruments are totally blind.
- Gillett et al. (2021) global warming attribution study
Bob Loblaw at 07:00 AM on 19 February, 2021jamesh@5:
You are not expressing yourself sufficeintly clearly. For example, you first say
"Dr. Mann in his publication dated 01 April 19 Titled Global-scale temperature patterns and climate forcing"
[emphasis mine], and then you say:
"the atmosphere could not have forced the sequesteration of carbon in the earths sedimentary rocks."
The two uses of the term "force" have entirely different meanings in these contexts.
Mann's statement - and any statement that has to do with CO2 forcing climate changes - is due to the radiative properties of greenhouse gases. They absorb and emit IR radaition, which alters the flows of energy, and do this in such a fashion that the global balance between absorbed solar radiation and emitted IR (to space) is affected. As a result, the earth warms in response to increased atmospheric CO2.
In your second use of the term forced, you seem to be talking about changes in the global carbon cycle. How the carbon cycle responds to the burning of fossil fuels is a different question from how increased atmospheric CO2 alters the radiation transfer.
To claim that CO2 cannot force climate because the atmosphere cannot force geological carbon sequestration is a non sequitur.
There are threads her that discuss the carbon cycle and how we know that the burning of fossil fuels is leading to increased atmospheric CO2. There are other threads where the role of CO2 as a greenhouse gas is discussed, including how the greenhouse gases lead to a warmer surface.
Such confusion in what you write needs to be clarified. We can only know your thoughts by how you express them. If your writing is confusing, we have no way of knowing if you are just expressing yourself poorly, or whether you are failing to understand some aspect of the science. Right now, it looks like there is a lot you do not understand.
- CO2 is not the only driver of climate
MA Rodger at 21:03 PM on 25 January, 2021gzzm2013,
Your request for an answer you can understand on the subject of CO2 as a greenhouse gas have fallen fowl of moderation. While I have already presented an answer for you above @62, perhaps a more detailed explanation would assist you, something which Einstein's 6-year-old could grasp. You also elsewhere insist that the mechanisms of an actual greenhouse and the planet's greenhouse effect are fundamentally different. I will also address the falacy within that argument.
The graph presented @62 shows three traces, Ts, Tmin and a raggedy one inbetween.
Ts is the radation we would expect from a planet with a temperature of +15ºC but no greenhouse effect, +15ºC being the average temperature as the Earth's surface. The raggedy line is a trace of the actual radiation from Earth. The raggedy trace is important as the area beneath it represents the energy radiated out into space. It is what cools the planet.
If the area below the raggedy trace does not equal the area below a similar trace of incoming absorbed radiation from the sun, the temperature of Earth will change until they do become equal.
The size of the Earth's greenhouse effect is represented by the area between Ts and the raggedy trace. About a quarter of that area is the big bite out of the raggedy trace at Wavenumber 666. That big bite is caused by CO2.
So imagine there was no CO2 and the big bite was absent. The area under the raggedy trace is now bigger and no-longer equals to the area under the solar heating trace. So the raggedy trace would become lower as Earth cools to make them equal again. (And a cooler Earth will have a lower Ts trace as well.)
And what makes CO2 even more important than providing directly a quarter of the Earth's greenhouse is that the other three-quarters is down to water vapour in the atmosphere. A cooler planet cannot support the same amount of water vapour in its atmosphere. This increases the height of the raggedy trace along much of its length again making the area underneath unequal to the solar heating trace. The planet thus has to cool even more to put them back in balance, which again reduces the level of water vapour in the atmosphere causing yet more planetary cooling. The upshot is that without CO2 in Earth's atmosphere, the temperature becomes so low that the greenhouse effect pretty-much disappears. That is the power of CO2 in our atmosphere.
And run it the other way by increasing the level of CO2 in the atmosphere, the big bite becomes bigger and Earth has to warm up to shed the extra heat caused by the CO2-enhanced greenhouse.
...
You also argue elsewhere that an actual greenhouse works by preventing convection while the greenhouse-effect works radiatively. You suggest that this difference in operation, one convection the other radiative, makes the term 'greenhouse' inappropriate for a planetry 'greenhouse' effect. Your argument is not actually well-founded.

Both a greenhouse and the 'greenhouse' effect rely on radiative effects to operate. The incoming solar radiation freely passes through the glass/atmosphere while outgoing radiation of a longer wavelength is unable to pass freely back out.
The greenhouse does also require the glass to prevent the heated air within causing convection and so dissipating the elevated solar warming. The atmosphere also acts to generally prevent convection. Of the two, a greenhouse is atually more leaky than the atmosphere which has a very gentle upward convection process (outside serious storms etc which in the grand scheme of things are quite rare). On average it takes over a week for a packet of air to rise the 12km to the top of the troposphere.
- There's no empirical evidence
gzzm2013 at 00:58 AM on 25 January, 2021198 topics and none of them directly address the problem of particulate pollution. Anyone that has been to a number of big cities has noticed the large problem of air pollution by particulates.
Particles in the atmosphere cause scattering of incoming radiation, so the amount of solar radiation that impact the earth's surface is affected, either incoming or outgoing. This means that higher elevations receive more solar radiation including ultraviolet or UV radiation. So why doesn't greater exposure to solar radiation result in higher air temperatures with elevation? The answer is that very little of the atmosphere is heated directly by absorbing solar radiation. As any chemist will explain to you, air is mostly vacuum, void. Instead, most incoming solar radiation is either scattered in the atmosphere or passes through it and is absorbed by the earth. This is why the ground is often warmer than the air surrounding it.
Therefore, what warms the air, is the direct contact with the ground and liquid surface of the ocean, the interface. Solar radiation (e.g. light) will pass through the air.
Temperatures decrease with distance from the earth's surface.
So another factor to be considered is the absorbtion of solar energy by the earth's surface that is clearly changing (in color, material composition, etc) by human activity and natural activity.
- 2021 SkS Weekly Climate Change & Global Warming Digest #1
Dr. S. Jeevananda Reddy at 17:47 PM on 11 January, 2021Negelj
Global Warming: It is an estimate of the annual average part of temperature trend. The trend of 1880 to 2010 is 0.6oC per century in which global warming component is 0.3oC – 1951 to 2100 is 0.45oC – according to linear trend. But in reality it is not so as the energy component is constant over which superposed sunspot cycle. However, the reliability depends up on the data used. For example number of stations in around 1850 were < 100 and by around 1980 [started satellite data collection started around this time] they were more than 6000 and with the availability of satellite data the number of stations drastically come down to around 2500. The satellite data covered both urban-heat-island effect and rural-cold-island effect and showed practically no trend – US raw data series also showed this. However, this data was removed from internet [Reddy, 2008 – Climate Change: Myths & Realities, available on line] and replaced with new adjusted data series that matches with ground data series. Here cold-island effect is not covered. With all this, what I want say is warmings associated with solar power plants is added to global warming. How much?? This needs collection of data for all the solar power stations. Met station covers a small area only but acts like UHI effect – I saw a report “surface temperatures in downtown Sacramento at 11 a.m. June 30, 1998 – this presents high variation from area to area based on land use [met station refers to that point only]. So, solar wind power plants effect covers similar to heatwaves and coldwaves. Here general Circulation Pattern plays main role.
Nuclear Power: Nuclear power production processes contribute to “global warming process” while hydropower production processes contribute to “global cooling process”; the nuclear power production processes don’t fit into “security, safety & economy” on the one hand and on the other “environment & social” concepts; unlike other power production processes, in nuclear power production process different stages of nuclear fuel cycles are counted as separate entities while assessing the cost of power per unit and only the power production component is accounted in the estimation of cost of power per unit; carbon dioxide is released in every component of nuclear fuel cycle except the actual fusion in the reactor. Fossil fuels are involved in the mining-transport-milling conversion-processing of ore-enrichment of the fuel, in the handling of the mill tailings-in the fuel can preparation-in the construction of plant and it decommissioning-demolition, in the handling of the spent waste-in its processing and vitrification and in digging the hole in rock for its deposition, etc. and in the manufacturing of necessary required equipment in all these stages and thus their transportation. In all these stages radiological and non-radiological pollution occurs – in the case of tail pond it runs in to hundreds of years. Around 60% of the power plant cost goes towards the equipment, most of which is to be imported. The spent fuel storage is a critical issue, yet no solution was found. Also the life of reactors is very short and the dismantling of such reactors is costly & risky, etc., etc.
Michael Sweet/ Negelj
In 70&80s I worked and published several articles relating to radiation [global solar and net and evaporation/evapotranspiration] – referred in my book of 1993 [based on articles published in international and national journals]. Coal fired power plants reduces ground level temperature by reducing incoming solar radiation. In the case of Solar Panels create urban heat island condition and thus increases the surrounding temperature. In both the cases these changes depends upon several local conditions including general circulation patterns. Ground condition plays major role on radiation at the surface that define the surface temperature [hill stations, inland stations & coastal stations] – albedo factor varies. Also varies with soil conditions – black soil, red soil. Sea Breeze/land breeze – relates to temperature gradient [soil quickly warm up and quickly release the heat and water slowly warm up and slowly release heat] and general circulation pattern existing in that area plays the major role in advection.
Response to Moderator
See some of my publications for information only:
Reddy, S.J., (1993): Agroclimatic/Agrometeorological Techniques: As applicable to Dry-land Agriculture in Developing Countries, www.scribd.com/Google Books, 205p; Book Review appeared in Agricultural and Forest Meteorology, 67 (1994):325-327.
Reddy, S.J., (2002): Dry-land Agriculture in India: An Agroclimatological and Agrometeorological Perspective, BS Publications, Hyderabad, 429.
Reddy, S.J., (2008): Climate Change: Myths & Realities, www.scribd.com/Google Books, 176.
Reddy, S.J., (2016): Climate Change and its Impacts: Ground Realities. BS Publications, Hyderabad, 276.
Reddy, S.J., (2019a): Agroclimatic/Agrometeorological Techniques: As applicable to Dry-land Agriculture in Developing Countries [2nd Edition]. Brillion Publishing, New Delhi, 372p.
2.1.2 Water vapour
Earth’s temperature is primarily driven by energy cycle; and then by the hydrological cycle. Global solar radiation reaching the Earth’s surface and net radiation/radiation balance at the Earth’s surface is generally estimated as a function of hours of bright Sunshine. Total cloud cover [average of low, medium & high clouds] has a direct relation to hours of bright Sunshine (Reddy, 1974). Cube root of precipitation showed a direct relation to total solar radiation and net radiation (Reddy, 1987). In all these latitude plays major role (Reddy & Rao, 1973; Reddy, 1987). Evaporation presents a relation with net and global solar radiation (Reddy & Rao, 1973) wherein relative humidity plays an important role that reduces with increasing relative humidity. If ‘X’ is global solar radiation received under100% relative humidity then with the dryness [with relative humidity coming down] it may reach a maximum of 2X; and under net radiation also with increasing relative humidity net radiation is reduced. That means water vapour in the atmosphere is the principal component that controls the incoming and outgoing radiation and thus temperature at the Earth’s surface. Thar Desert presents high temperature with negligible water vapour in the atmosphere as maximum energy reaches the earth’s surface. However, these impacts differ under inland (dryness), hill (declining temperature with height – lapse rate) & coastal (wetness) locations and sun’s movement (latitude and declination of the Sun — seasons) (Reddy & Rao, 1973). IPCC integrated these under “climate system” and the advective condition by general circulation pattern [GCP].
Cold-island effect [I coined this, see Reddy (2008)] is part of human induced climate change associated with changes in land use and land cover. Since 1960’s to meet the food needs of ever increasing population, started intensive agriculture – conversion of dryland to wetland; & creation of water resources; etc. In this process increased levels of evaporation and evapotranspiration contributed to raise in water vapour up to around 850 mb levels in the lower atmosphere. Unusual changes in water vapour beyond 850 mb level [for example at 700 mb level] become a cause for thunderstorm activity (Reddy & Rao, 1978). Wet bulb temperature (oC) at the surface of the Earth provides the square root of total water vapour (g/cm2) in the vertical column of the atmosphere; and also wet bulb temperature (oC) is a function of dry bulb temperature (oC), relative humidity (%) and square root of station level pressure (height) relative to standard value in mb [p/1060] (Reddy, 1976). Thus, unlike CO2, water vapour presents a short life with steadily increasing with land use and land cover changes. However, met network in this zones have been sparse and thus the cold island effect is not properly accounted under global average temperature computations. Though satellite data takes this in to account, this data series were withdrawn from the internet and introduced new adjusted data series that matches with adjusted ground data series. Annual state-wise temperature data series in India wherein intensive agriculture practices are existing, namely Punjab, Haryana & UP belt, showed decreasing trend in annual average temperature – cooling. Some of these are explained below:
Reddy (1983) presented a daily soil water balance model that computes daily evapotranspiration, known as ICSWAB Model. The daily soil water balance equation is generally written as:
▲Mn = Rn – AEn – ROn - Dn
In the above equation left to right represent the soil moisture change, rainfall or irrigation, actual evapotranspiration, surface runoff and deep drainage on a given day (n). The term Actual Evapotranspiration [AEn] is to be estimated as a function of f(E), f(S) & f(C), wherein they represent functions of evaporative demand on day n, soil & crop factors, respectively. As these three factors are mutually interactive, the multiplicative type of function is used.
AEn = f(En) x f(S) x f(C)
However, the crop factor does not act independently of the soil factor. Thus it is given as:
AEn = f(En) x f(S,C) and f(S,C) = K x bn
Where f(S,C) is the effective soil factor, K = soil water holding capacity [that varies with soil type] in mm and bn is the crop growth stage [that vary with crop & cropping pattern] factor that varies between 0.02 to 0.24 — fallow to full crop cover conditions (with leaf area index crossing 2.75). Evaporative demand is expressed by the terms evaporation and/or evapotranspiration. Evaporation (E) and evapotranspiration (PE) are related as:
PE = 0.85 x E [with mesh cover] or = 0.75 x E [without mesh cover].
However, the relationship holds good only under non-advective conditions [i.e., under wind speeds less than 2.5 m/sec]. Under advective conditions E is influenced more by advection compared to PE. In the case of PE, by definition, no soil evaporation takes place and thus PE relates to transpiration only – where the crop grows on conserved soil moisture with negligible soil evaporation. With the presence of soil evaporation, the potential evapotranspiration reaches as high as 1.2 x PE or E with mesh cover. McKenney & Rosenberg (1993) studied sensitivity of some potential evapotranspiration estimation methods to climate change. The widely used methods are Thornthwaite and Penman presented 750 mm and 1500 mm wherein Thornthwaite method is basically uses temperature and Penman uses several meteorological parameters (Reddy, 1995).
In this process the temperature is controlled by solar energy but moisture under different soil types [water holding capacity] it is modified. This modified temperature cause actual evapotranspiration and thus water vapour. This is a vicious circle. For example average annual temperature in red soils Anantapur it is 27.6oC; in deep black soils Kadapa it is 29.25oC & in medium soils Kurnool it is 28.05oC. That means, local temperature is controlled by soils.
Reddy (1976a&b) presented a method of estimating precipitable water in the entire column of the atmosphere at a given location using Wet Bulb Temperature. The equations are given as follows:
Tw = T x [0.45 + 0.006 x h x (p/1060)1/2]
W = c’ x Tw2
Where T & Tw are dry and wet bulb temperatures in oC; h is the relative humidity in %; p is the annual normal station level pressure in mb [1060 normal pressure in mb, a constant] ; W is the precipitable water vapour in gm/cm2 and c’ is the regression coefficient.
WMO (1966) presented methods to separate trend from natural rhythmic variations in rainfall and assessing the cycles if any. (Late) Dr. B. Parthasarathy from IITM/Pune used these techniques in Indian rainfall analysis. Reddy (2008) presented such analysis with global average annual temperature anomaly data series of 1880 to 2010 and found the natural cycle of 60-years varying between -0.3 to +0.3oC & trend of 0.6oC per century [Reddy, 2008]. This is based on adjusted data series but in USA raw data [Reddy, 2016] there is no trend. The hottest daily temperature data series of Sydney in Australia shows no trend [Reddy, 2019a]. Thus, the trend needs correction if the starting and ending point parts are in the same phase of the cycle – below and below or above and above the average parts. During 1880 to 2010 period two full 60-year cycles are covered and thus, no need to correct the trend as the trend passes through the mean points of the two cycles.
3.2.4 What is global warming part of the trend?
According to IPCC AR5, this trend of 0.6oC per century is not global warming but it consists of several factors:
a. More than half is [human induced] greenhouse effect part:
i. It consists of global warming component & aerosols component, etc. If we assume global warming component alone is 50% of the total trend, then it will be 0.3oC per Century under linear trend;
ii. Global warming starting year is 1951 & thus the global warming from 1951 to 2100 [150 years] is 0.45oC under linear trend;
iii. But in nature this can’t be linear as the energy is constant and thus CSF can’t be a constant but it should be decreasing non-linearly;
iv. Under non-linear condition by 2100 the global warming will be far less than 0.45oC and thus the trend will be far less than half;
b. Less than half the trend is ecological changes [land use and land cover change] part – mostly local & regional factors:
i. This consists of urban-heat-island effect and rural-cold-island effect;
1. Urban-heat-island effect – with the concentrated met network overestimates warming;
2. Rural-cold-island effect – with the sparse met network underestimates cooling;
2.2.1 Uncertainty on “Climate Sensitivity Factor”
The word “climate Crisis” is primarily linked to global warming. To know whether there is really global warming, if so how much, climate sensitivity factor plays the main role. Climate sensitivity is a measure [oC/(W/m2)] – how much warming we expect (both near-term and long-term) for a given increase in CO2? According to Mark, D. Zilinka (2020), “Equilibrium climate sensitivity, the global surface temperature response to the CO2 doubling, has been persistently uncertain”.
Recent modelling data suggests the climate is considerably more sensitive to carbon emissions than previously believed, and experts said the projections had the potential to be “incredibly alarming”, though they stressed further research would be needed to validate the new numbers. Johan Rockström, the director of the Potsdam Institute for Climate Impact Research, said. “Climate sensitivity is the holy grail of climate science. It is the prime indicator of climate risk.
The role of clouds is one of the most uncertain areas in climate science because they are hard to measure and, depending on altitude, droplet temperature and other factors can play either a warming or a cooling role. For decades, this has been the focus of fierce academic disputes. Catherine Senior, head of understanding climate change at the Met Office Hadley Centre, said more studies and more data are needed to fully understand the role of clouds and aerosols. With this vital disputes how anyone can say there is global warming without solving this issue; so I said “global warming hysteria factor is climate crisis”.
- A 50-Year-Old Global Warming Forecast That Still Holds Up
Bob Loblaw at 12:27 PM on 16 December, 2020John: interesting question. The Budyko-Sellers type models were one-dimensional, looking only at total horizontal energy transport between the equator and poles. (Well, essentialy from pole to pole - the northern and southern hemispheres are not exactly symmetrical.) They considered four energy fluxes:
- Vertical radiation balance (absorbed solar - emitted IR) as a function of latitude. This is essentially top-of-atmosphere, but the models had no vertical dimension or resolution, so IR emissions were a function of surface temperature. (Horizontal radiation transfer can be ignored.)
- North-south transport of atmospheric sensible heat: the energy transfer associated with atmospheric circulation and the temperature of the air.
- North-south transport of atmospheric latent heat: energy associated with atmospheric circulation of water vapour, evaporating water at one latitude and condensing at another.
- North-south transport of ocean sensible heat: ocean circulation and temperatures.
The Budyko-Sellers models used empirical equations that related energy transport to temperature, and did not explicitly have any atmospheric motion or weather. The output provides a latitude-averaged state: you can see the differences in flux and temperature as a function of latitude, but there is no east-west information.The idea is that the equator/pole differences in radiation balance (item 1) are what drives atmospheric circulation and climate differnces - energy needs to get from the equator to the poles to balance (items 2-4).
Hansen's early work, IIRC, used either one-dimensional radiative-convective models (RCM) or full three-dimensional atmospheric general circulation models (GCM).
The RCMs have only a vertical component and do full radiative transfer calculations - but for a globally-averaged state. They have no equator or pole or anything in between.The radiation transfer calculations can be very sophisticated, though.
The 3-D GCM models are like weather models (but very coarse resolution in the early days), so they include N-S changes, E-W differences, and the vertical structure of the atmosphere - and actually calculate atmospheric circulation over time. The model "climate" is the time-averaged model output, just like real climate is time-averaged weather.
So, no Hansen would not have been basing his work directly on Budyko. The modelling approach are quite different - but they all give interesting information about different aspects of climate. The earliest published work that I know of for RCMs was that of Manabe and Strickler (1964) and Manabe and Wetherald (1967), Manabe also moved from RCMs to GCMs. GCMs are loosely based on weather models.
- Arctic Sea Ice Minimum Volumes Video - 2020 edition
Bob Loblaw at 10:37 AM on 6 December, 2020Wilt:
Regarding your first point, keep i mind that large bodies of water in the Northern hemisphere, such as Hudson's Bay and the Great Lakes, already go through seasonal cycles from ice-free to substatially ice-covered. Even an "ice-free" Arctic Ocean will have a lot of ice for a lot of the year.
https://www.glerl.noaa.gov/data/ice/#historical
Yes, penetration of solar radiation into open water is a primary mechanism of feedback for additional warming. Maximum solar radaiation is on June 21, though - not in September when the ice minimum will (most likely continue to) occur.
As for point #2: RealCimate has freqently dicussed the Atlantic Meridional Overturning Circulation (AMOC) and it's potential climate effects. A search there for AMOC turns up several posts over the years. The most recent one is:
- How much has nuclear testing contributed to global warming?
boston745 at 12:49 PM on 27 October, 2020I understand that cosmic rays aren't germain to the articlr directly. However a weakened magnetic field allows more CR energy in. Its possible that the nuclear testing accelerated that weakening.
The problem with compartmentalization by article topic is that no 1 thing is causing global warming. Multiple factors are at play. Thus its difficult to discuss.
The earths orbit around the sun has brought the earth as close to the sun as it gets in a 400,000 year cycle. Thus the earth is receiving about maximum solar radiation. With a weaker field, more solar radiation gets through and thus more absorption.
Cloud cover is also a factor, which is impacted by moisture in the air, aerosols, & CRs. Clouds can reflect energy or keep radiation in like a thermal blanket.
- How much has nuclear testing contributed to global warming?
boston745 at 10:44 AM on 27 October, 2020Why would you remove my post about what chemtrails really are? A combination of airplane aerosol emissions with cosmic rays. A natural phenomenon caused when increase cosmic radiation is incoming from outside our solar system or our sun.
- Is Nuclear Energy the Answer?
michael sweet at 20:20 PM on 19 October, 2020Philippe Chantreau:
Thank you for providing a peer reviewed study to support your question.
Your reference is a summary of current knowledge of "freeze valves". The first paragraph states:
"Reliable mechanical valves that can withstand the corrosive and high-temperature conditions in Molten Salt Reactors (MSRs) have not yet been demonstrated. In their place, freeze valves (sometimes called freeze plugs) represent a unique nuclear design solution for isolating salt flow during operations." my emphasis.
As I stated above, no alloys to manufacture control valves are known that can withstand the extreme heat, corrosion and radiation fields in an MSR. Reactor designers are looking for other ways to control liquid flow. A freeze plug is a system of a thin pipe where a plug of solid salt is allowed to form. This pipe has to have complicated heating and cooling systems. It takes about 15 minutes to form the plug, during which the molten salt cannot be moving, and about 15 minutes to thaw the plug. Most of the small amount of known data and designs about freeze plugs are from the 1960's. Apparently recently MSR developers have started to investigate freeze plugs again because they have been unsuccessful in finding alloys to build mechanical valves.
Freeze valves are apparently not used in any existing chemical or nuclear processes. Therefore the knowledge of their manufacture, use and failure modes is rudimentary. They are complicated and have many failure modes compared to normal mechanical valves. They open and close very slowly in emergencies. The size of pipes used is restricted. Test valves have suffered catastrophic failure.
The conclusion of the paper you cite says:
"Especially because the technical maturity of all solutions to isolate salt flow is so low, it will be important for MSR stakeholders to advance the state of knowledge surrounding freeze valve systems, and other alternatives under consideration, through a combination of physical tests, computational simulations, and design-related studies." my emphasis
I conclude that it is currently unknown how to control the flow of liquid salt in an MSR. It may be possible to develop a solution but it will take significant research, time and testing. Designers tried to avoid freeze plugs because they have many undesirable properties.
Proponents of MSR's have many significant problems that they need to resolve, including the fact that they do not know how to regulate the flow of liquid through the reactor. It will take many years of research to solve these issues, if they can be solved. Suggestions that a design that can be built exists or will exist in the near future are deliberately false.
Many additional problems exist for MSR's. The designs are complicated and only the nost optimistic proponents envision that they can compete with renewable energy in the foreseeable future. If a reactor is ever designed, there will still not be enough uranium in the world to provide more than a small amount (less than 5%) of energy to the grid.
I think it is a waste of money to attempt to develop a reactor where a pilot plant cannot be designed in less than 10 years. It would take at least 5 years to validate the design and then 10 years to build the first commercial reactor. You are looking at 2050 or later for the first commercial reactor which is too late. The uranium problem has no proposed solutions (thorium has additional problems of its own). The money would do much more good used to build a wind or solar farm.
Your reference is very long and technical. I only read about half of it in detail.
- We've been having the wrong debate about nuclear energy
michael sweet at 03:10 AM on 5 August, 2020Nigelj:
At post 3 you say: "For example, Nuclear power is expensive compared to wind and solar and gas, but probably cost competitive with wind and solar and mass storage, at current costs of mass storage."
Connelly et al 2016 (reviewed at SkS here) and the references in it show that the bigger the system the lower the storage cost. This means that an electricity only system requires relatively much more storage than a system that provides all electricity, heating, transportation and industry. That means a system that provides ALL POWER requires much less storage than an electricity only system. They show that a well designed All Power system might require zero storage. Obviously if we want to get to zero carbon dioxide emissions we require an All Power system. Electricity only systems, as nuclear supporters describe, are not helpful in reaching zero carbon emissions.
I wrote that summary specifically to address your complaints that storage for renewable energy would be too expensive. Nuclear supporters, like those on the RealClimate thread you frequent, do not discuss All Power systems because electricity only systems make renewable energy look more expensive. The OP has the same problem since it is written from a nuclear point of view.
I have shown your claims of expensive storage are false as described in the peer reviewed literature. If you want to claim expensive storage you need to find peer reviewed sources to support your repeated, false claims.
Your claims at post 3 " Nuclear power relies on a non renewable fuel, but several of the metals used to make wind and solar power plants will obviously not last for all eternity either" are also false. I have referred you repeatedly to Jacobson 2009 which shows that all the materials to build out renewable energy exist is adequate amounts, except for rare earth elements in the turbines. Since then the turbines have been redesigned so that they do not use excess rare earth elements. By contrast, Abbott 2012 shows that many rare elements in nuclear plants, including uranium, do not exist is sufficient amunts to build out more than 5% of All Power. The nuclear industry has not replied to Abbott which shows they agree with his assessment. In general, renewable plants use common materials which are not in short supply. By contrast, many exotic materials are used in nuclear plants to attempt to counter the extreme conditions of heat, corrosivity and radiation field found in nuclear plants.
If you want to contradict the accepted, consensus science you need to provide references to support your wild claims. Constantly repeating false claims does not make them true.
Nuclear supporters constantly repeat false claims about renewable energy. It does not make nuclear look better to falsely claim renewables have problems.
- Milankovitch Cycles
MA Rodger at 21:24 PM on 29 April, 2020mkrichew @60,
Briefly as we are off-topic, regarding CO2 at altitude, it is effecively well mixed up to 50,000km, the scatter measured at low altitude being simply local influence and more generally the annual CO2 cycle.
What I would add is that the ability of CO2 to "capture the suns rays," something you suggest is significant @56, is very small. Of the absorption bands of CO2, only the 2.9 micron band operates within the wavelength of solar radiation and that at the very tag end of the insolation's frequency distribution.
- YouTube's Climate Denial Problem
dudo39 at 11:05 AM on 5 April, 2020You talk a bit too fast....
"Climate denial" to me is a negative and counter-productive label: To me, Science, by definition, implies arguments on both sides of an issue, and it is somewhat naive to assume that either side is right or wrong.
In so far as climate change / global warming is concerned, to me there is insufficient knowledge and understanding of the sciences behind either one, as well as insufficient reliable/accurate data. Also, it appears to me that the models used to prognosticate the future of the biosphere's thermal balance/imbalance utilize statistical methodologies to manipulate data, and as such the results are nothing more than a prognostication, albeit an opinion, and do not represent a solution to a problem.
Take, for instance, atmospheric H2O content: it is pretty much a fact that it varies over a relatively wide range (say from <<1% to about 3 to 4%) just about anywhere on earth over a period of 24 consecutive hours (no wonder why do temperatures can vary for up to and over 50 C during a 24 hr time span anywhere on earth) . It is also a fact that atmospheric H2O content contributes to over about 65% of the greenhouse effect (GHE). Thus, if in fact the temperature is rising, then more H2O must be being added into the atmosphere: the question is then, what is the net effect of this additional H2O on the thermal balance of the biosphere? Note that while H2O has a warming effect both because of its GHE as a gas and cloud droplets, it also has a cooling effect by the clouds reflecting the incoming solar radiation. As far as I know, this question has not been answered. - CO2 effect is saturated
MA Rodger at 00:00 AM on 12 February, 2020dlen @582,
The difficulty I have with this discussion is that it is attempting to provide an analogy for the GHG mechanism, something which can never be exact because if it were, it would be too complex when its puropse is to be simple to understand.
You say "So the heat energy has to propagate via multiple absorptions to the top layer" with CO2 acting to "hamper this propagation process."
This is not the best of wording. It is true that the planet sheds energy solely by radiation, something like 240Wm^-2 to be in equilibrium. Yet within the planet's energy flows, very little of this outward energy is 'propagated' from the net radiative energy flux from the surface. The surface is only radiating a net 60Wm^-2, of which 40Wm^-2 is the radiation passing through the "the transmission window" (so plays no part in the GHG mechanism) leaving just 20Wm^-2 which "has to propagate via multiple absorptions to the top layer." Joining this surface radiative energy flux as it 'propagates' upward is 100Wm^-2 of convective and insensible heat transport from the surface as well as 80Wm^-2 from direct solar heating of the atmosphere to yield the full 200Wm^-2 being radiated from the atmosphere out into space. And in being able to radiate at atmospheric temperatures, CO2 does not "hamper" the process but instead assists it.Your fouth-last paragraph is entirely wrong. It is not the CO2 which warms the atmosphere (ie the troposphere) and determines its temperature profile. The temperature profile (lapse rate) is well balanced so as to hold convection back from running amok. (We would live in an interesting surface environment without this balance!!) The temperature profile (as opposed to the temperature) is certainly not determined by radiation.
The planet surface and atmosphere does of course have to warm because an increase in CO2 results in it emitting into space from higher cooler parts of the atmosphere. While CO2 is well mixed up to perhaps 50km, the effective emission altitude for CO2 is nothing like that high - more like 10km. And while the whole climate system (up to the tropopause) will warm as a result of increased CO2 to allow the radiative balance to be restored, the flux within the CO2 waveband will still remain smaller than previously, while the flux elsewhere (where the effective emission altitude remains unaffected) will be greater.
- Is Nuclear Energy the Answer?
michael sweet at 14:40 PM on 19 January, 2020Nigelj,
You need to read your own citations.
Claiming that the US National Academy of Science is wrong and saying you will not provide any citations to support your claim is completely unscientific. Their review, published in 2006, is the most up to date consensus report on low level radiation. If you wish to substitute your personal opinion for the National Academy of Science scientific consensus you should stop posting here. This is a scientific site, citations are required.
I read the original paper for your pv magazine citation. I gave you a reference to the paper. They model only wind and solar power for electricity only in the USA. They do not model a renewable energy system that anyone would propose for the USA. They do not model All Power. Nuclear power is not modeled at all in the paper. At the end they speculate that adding nuclear might help but they provide no data or citations to support that wild claim. They do not model costs of their renewable system and they do not give nuclear costs either so speculating that nuclear would lower costs is completely unsupported. I quoted from a peer reviewed paper, you cited a popular magazine.
It is common for nuclear supporters to make up a fake renewable energy system that is very expensive. Then they claim, without data, that nuclear should be added since renewable is so expensive. Even if it were true that renewable was expensive that would not mean that nuclear is reasonable. As Abbott shows, it is impossible to build out more than a trivial amount of nuclear power.
You did not read your reference for nuclear cycling. The first paragraph stated that no reactors in the USA load follow because it is not economic. They say no reactors in the USA can load follow. They suggested that future reactors could be designed to very slowly load follow. It will never be economic. It will never be possible to load follow in real time. In France they shut down reactors on the weekend. For nuclear that is "load following". It is not economic.
Your claims that storage is too expensive is simply ignorant. You have not read the papers I cited that show a well designed renewable system can store all needed power using electrofuels in existing storage facilities. If replacement facilities need to be built it is over 1,000 times cheaper to build liquid electrofuel storage than to build out the pumped hydro you favor. (In any case it is impossible to build out major pumped hydro storage because the environmental damage is too great). Liquid electrofuels are stored in the same tanks that you see if you drive by any chemical storage facility worldwide. "Working prototypes" are everywhere and the costs are well known. Jacobson also documents storage for an all power system without electrofuels and the cost is reasonable. Jacobson details all storage down to the last battery and builds exactly zero pumped storage. Anyone who proposes using extensive pumped storage is trying to mislead you.
- Is Nuclear Energy the Answer?
nigelj at 13:41 PM on 19 January, 2020michael sweet @128, sorry for being a bit off topic.
"The proponents of nuclear power ar RealClimate that you discuss reactor safety with do not count all nuclear related deaths. ...."
Ok. I don't take all that these guys say at face value. Believe me I check what they claim. But you seem a little bit over paranoid for some reason. However I respect your views and maybe you have your reasons.
"Linear response no threshold is accepted by every health agency in the world. "
Sometimes the consensus view is just wrong and the research on this issue is rather old and inadequate. I've had a read of studies, research papers, articles and opinions on both sides of the debate on low levels of radiation, including some of the research that was posted by Doug C on the Forest Fires thread. I'm not going to spend my day listing all this stuff in detail here. I'm just saying there appear to be valid criticisms of the LNT model and your mind appears very closed on it for some reason. I used to be very sceptical of nuclear power, just less so these days.
"Your claim: "If you inject some nuclear power into the mix you get clean energy and need much less storage" is in direct contradiction to peer reviewed papers."
What peer reviewed papers? I posted an article on it previously as below. Its clear an 80% solar and wind grid needs much less storage than a 100% grid. Orders of magnitude less. Nuclear power is one way of filling in the 20%. I have never said its the only way. Hydro would work in some places.
pv-magazine-usa.com/2018/03/01/12-hours-energy-storage-80-percent-wind-solar/
"As for ‘following all paths’ and pursuing a mix of renewables and nuclear, they do not mix well: because of their high capital costs, nuclear power plants are most economically viable when operated at full power the whole time, whereas the variability of renewables requires a flexible balancing power fleet....Please provide a citation to support this wild claim. In a renewable world peak power is required to support renewable wind and solar. Baseload like nuclear is not helpful and has little affect on storage. "
I already provided you a credible study with a link showing nuclear power can be ramped up and down to help renewables intermittency, on the forest fires thread. The article says it already does this in some places.
"Since nuclear is the most expensive power it would be much cheaper to build an excess of renewable energy or design better storage.
This is just an assertion and also assumes we can design better storage. Right now storage is very expensive. Makes nuclear power look attractive.
"The "Smart Energy" papers I have referenced repeatedly at SkS describe using electrofuels to power planes and ships. The electrofuels could be used in existing peaker plants to back up renewable energy if needed. No additional storage would be required. "
This is promising but its theoretical at this stage. Are there working prototypes and are the costs good?
Of course I'm not in a position to make decisions on who builds what power. I feel electricity markets should not discriminate between nuclear power and renewables. They should have equal subsidies (if any) and renewables should be required to have some storage. Then you get a level playing field between renewables and nuclear power, and the issue should sort itself out over time. The best overall system will get chosen and it could be renewables plus storage if storage prices drop.
I just want a clean grid, Im not too concerned what the power source is as such. :)
- How climate change influenced Australia's unprecedented fires
nigelj at 09:51 AM on 19 January, 2020ianw01 @7
"Is the "Climate Change Performance Index" implicitly and silently opposed to nuclear energy?'
Don't know for sure, but something might be going on. Nuclear power is a dirty word in many western countries. Its not liked by the general public because of safety problems and disasters like Chernobyl and Fukushima for understanable reasons. Policy makers pick up on this.
However the scare stories about nuclear radiation look exaggerated. I've read credible reports that nuclear power (including the nuclear accidents) kills and injures far fewer people per megawatt / hour than fossil fuels power, and moderately fewer than renewables. A surprising number of people fall off ladders erecting solar panels etcetera! Heres a relevant article:
www.newscientist.com/article/mg20928053-600-fossil-fuels-are-far-deadlier-than-nuclear-power/
Like others point out, there are questions about the validity of the linear no threshold model. Its complicated but the impression I get from looking at intelligent commentary and research on both sides of the issue is low dose radiation is likely zero or very low risk, not worth bothering about.
However nuclear power has some big problems. Waste disposal is still not sorted out on a durable long term basis and of course this feeds public scepticism. Its higher cost than wind power and coal power (refer Lazards analysis, free online). Its slow to build for various reasons and this is a big issue given the speed climate change is progressing.
However imho nuclear power has considerable merit, at least as "part of the mix".
Solar and wind power have intermittency issues, and as a stand alone solution require a lot of storage that is currently high cost. They currently typically rely instead on gas back up power which is not ideal. If you inject some nuclear power into the mix you get clean energy and need much less storage.
I think we need all the tools we can get and the grid can have a range of power sources. This article shows that nuclear power can also be used to counter renewable intermittency issues.
news.mit.edu/2018/flexible-nuclear-operation-can-help-add-more-wind-and-solar-to-the-grid-0425
Of course storage costs will drop and renewables may well win the day. But my point is there doesn't seem to be a robust case to deliberately exclude nuclear power.
- How climate change influenced Australia's unprecedented fires
Doug_C at 07:02 AM on 19 January, 2020ianw01 @7
A couple to things to add about nuclear power, it is already the safest form of power production, has over a million times the energy density of fossil fuels which in turn have much greater energy density than renewables like solar and wind power.
With new reactor types like pebble bed and molten salt reactors the already high safety factor becomes much higher and with molten salt reactors the nuclear waste issues is mitigated by a factor of about 100.
One of the main issues with the current fleet of nuclear power reactors is that they almost all use pressurized water as a moderator and coolant and so need massive primary and secondary containment which is not perfectly fail-safe. They also use solid fuel which quickly degrades under the intense heat and neutron bombardment in a nuclear reactor core. Reprocessing this spent fuel is expensive and dangerous.
With molten salt reactor cores the fissile material is in solution in an unpressurized molten salt and remains in the reactor until almost all of it is converted to short lived fission products that don't need to be safely stored for the thousands of years that TRUs(transuranic actinides) need to be. Some of those fission products are commercially valuable like the noble metals that are produced as part of the fission process as well as xenon and small amounts of Pu-238 used in deep space exploration as fuel and power production. A molten salt reactor is also a medical isotopes reactor and there would never be a shortage of the Technetium-99m and iodine-131 used in imaging. Bismuth-213 can be used to treat cancer tumors. Most of these fission products can be pulled from an operating molten salt reactor by hydrogen parging of a side stream of the molten core salt.
Exposure to ionizing radiation is the main fear around large scale nuclear power, but this is something all life is exposed to constantly including us.
The evidence is starting to show that life is negatively impacted by the removal of a certain level of ionzing radiation, which would confound the Linear no-Threshold model of risk from ionzing radiation which states that ionizing radiation is hazardous down to a zero dose rate.
For these and other reason we should be taking a much closer look at nuclear power as an alternative to fossil fuels in combination with low density renewables. It's not an either/or equation, it's about everything we have now to replace all fossil fuels as rapidly as we can before the condition become so catastrophic that it becomes impossible to mitigate climate change.
Reading the article about talking about over a billion organisms killed by the current massive outbreak of wildfires in Australia and how they have almost certainly driven some species extinct, I think we are getting close to that point now.
- Clouds provide negative feedback
Hefaistos at 07:37 AM on 5 January, 2020Interesting paper finds "surprising" results from CERES with a negative trend of Earth Energy Imbalance as well as a negative trend of Ocean Heat Content Time Derivative :
"Decadal Changes of the Reflected Solar Radiation and the Earth Energy Imbalance" by Dewitte , Clerbaux and Cornelis.
Abstract: Decadal changes of the Reflected Solar Radiation (RSR) as measured by CERES from 2000 to 2018 are analysed. For both polar regions, changes of the clear-sky RSR correlate well with changes of the Sea Ice Extent. In the Arctic, sea ice is clearly melting, and as a result the earth is becoming darker under clear-sky conditions. However, the correlation between the global all-sky RSR and the polar clear-sky RSR changes is low. Moreover, the RSR and the Outgoing Longwave Radiation (OLR) changes are negatively correlated, so they partly cancel each other. The increase of the OLR is higher then the decrease of the RSR. Also the incoming solar radiation is decreasing. As a result, over the 2000–2018 period the Earth Energy Imbalance (EEI) appears to have a downward trend of −0.16 ± 0.11 W/m2dec. The EEI trend agrees with a trend of the Ocean Heat Content Time Derivative of −0.26 ± 0.06 (1 σ) W/m2dec.
...
"The Earth Energy Imbalance (EEI) shows a trend of −0.16 ± 0.11 W/m2dec. The decreasing trend in EEI is in agreement with a decreasing trend of −0.26 ± 0.06 W/m2dec in the Ocean Heat Content Time Derivative (OHCTD) after 2000.
The OHCTD over the period 1960–2015 shows three different regimes, with low OHCTD prior to 1982, rising OHCTD from 1982 to 2000, and decreasing OHCTD since 2000. These OHCTD periods correspond to periods of slow/rapid/slow surface temperature rise [16,17], to periods of strong La Ninas/El Ninos/La Ninas [14,18], and to periods of increasing/decreasing/increasing aerosol loading [19,20]. "https://www.mdpi.com/2072-4292/11/6/663/htm#
- It's the sun
PatrickSS at 09:32 AM on 20 December, 2019Hi All
I have some questions that I'm sure people here can help me with.
I read a paper by Ronan Connoly and colleagues:
https://www.sciencedirect.com/science/article/abs/pii/S0012825215300349
Preprint:
They say that the temperature graph on this page above is wrong because it does not take urban heat islands into account. They seem to show on graphs that rural temperatures are more or less flat since the 1950s. They seem to have looked very carefully at the data, starting with Valencia in Ireland. Are they wrong?
Secondly, I heard a talk by Richard Alley on youtube. He says that the ice ages were driven by 100,000, 41,000, 23,000 and 19,000-year Milankovitch cycles. He shows a convincing Fourier transform. If the sun can drive ice ages (approx 10C change), it should certainly be powerful enough to drive a temperature change of around 1C.
https://www.youtube.com/watch?v=ujkcTZZlikg
There seem to be many different models for solar irradiation - see the Connolly article above. Which one should we pick? They pick one that almost exactly matches the temperature fluctuations that they report. Are they wrong?
Thx to all and I'd be very interested in comments and explanations (but not so interested in assertions that there is "masses of evidence" out there that shows that the Connollys are completely wrong and that I should go and look for it).
- COP25: Key outcomes agreed at the UN climate talks in Madrid
John Hartz at 01:13 AM on 19 December, 2019From SkS's handy-dandy Climate Glossary:
Greenhouse Effect
Greenhouse gases effectively absorb thermal infrared radiation, emitted by the Earth’s surface, by the atmosphere itself due to the same gases, and by clouds. Atmospheric radiation is emitted to all sides, including downward to the Earth’s surface. Thus, greenhouse gases trap heat within the surface-troposphere system. This is called the greenhouse effect. Thermal infrared radiation in the troposphere is strongly coupled to the temperature of the atmosphere at the altitude at which it is emitted. In the troposphere, the temperature generally decreases with height. Effectively, infrared radiation emitted to space originates from an altitude with a temperature of, on average, –19°C, in balance with the net incoming solar radiation, whereas the Earth’s surface is kept at a much higher temperature of, on average, +14°C. An increase in the concentration of greenhouse gases leads to an increased infrared opacity of the atmosphere, and therefore to an effective radiation into space from a higher altitude at a lower temperature. This causes a radiative forcing that leads to an enhancement of the greenhouse effect, the so-called enhanced greenhouse effect.
Definition courtesy of IPCC AR4.
- 500 scientists refute the consensus
Simple QED at 20:54 PM on 10 December, 2019Carbon emissions as the cause of global warming claimed to explain the recent severe weather on the Earth may be misleading. Small Earth temperature increases, say 1 K per year, caused by carbon emissions are thought the cause of recent severe weather. Since 1 K temperature changes in a small room over a year are impossible to verify, yet the entire world seems to believe preposterous claim of temperature increases of 1 K over the entire Earth. Solar irradiation received by the Earth provides a scientific argument if solar heat is causing global warming. But solar irradiance data over the past century is relatively constant, and therefore variations in Sun temperature have been dismissed as the cause of global warming. Hence, carbon emissions producing the preposterous 1 K per year are by default considered the cause of global warming.
In this regard, it is more likely the sun temperature is changing by a small amount to cause the 1 K temperature - if in fact, the temperature increase per year is 1 K. Today, the sun temperature is 5800 K. Based on Black Body relations, the figure below shows the change in Earth temperature T above that for the Sun at 5800 K when the the sun temperature is higher or lower than 5800K. For example, if the sun temperature is 5820 K or 20 K higher than 5800 K, the Earth temperature is 1 degree K higher. Since it highly likely the sun temperature fluctuates more than 20 K during a year, global warming is more likely caused by the Sun than carbon emissions and is much greater than the 1 degree K per year claimed by scientists.
www.nanoqed.org/resources/2019/Warming.jpg
By the Black Body argument, a higher rise than 1 K in Earth temperature is occurring, but although more realistic than the small 1 K estimate also can never be verified. Regardless, the constancy of solar irradiance at the top of the upper atmosphere over time challenges the foregoing black body argument. It therefore appears the ozone layer in the upper atmosphere is thinning [1] to allow more solar UV and EUV radiation to reach and heat the lower atmosphere, the lower atmosphere actually controlling the weather on Earth. If so, the ozone layer may be of far greater importance than carbon emissions, but data to support this argument is lacking.
Time will tell if global warming by carbon emission or loss of ozone is correct. More research on thinning of the ozone layer is recommended.
[1] C. Jackman, NASA Goddard Space Flight Center, “The Impact of Energetic Particle Precipitation on the Atmosphere,” presentation to the Workshop on the Effects of Solar Variability on Earth’s Climate, September 9, 2011.
- It's cosmic rays
Daniel Bailey at 06:22 AM on 4 December, 2019jmh530, the best available evidence we have is that there is no direct linkage between the sun’s output and cosmic rays impacting the Earth’s climate. Now that’s a broad statement, but let’s examine some more in-depth evidence on those individual components.
Scientists use a metric called Total Solar Irradiance (TSI) to measure the changes in output of the energy the Earth receives from the Sun. And TSI, as one would expect given the meaning behind its acronym, incorporates the 11-year solar cycle AND solar flares/storms.
The reality is, over the past 4 decades of significant global warming, the net energy forcing the Earth receives from the Sun had been negative. As in, the Earth should be cooling, not warming, if it was the Sun.
The scientists at CERN designed an experiment called CLOUD to evaluate the potential impacts of cosmic rays on clouds and cloud nucleation (Cloud Condensing Nuclei = CCN).
Per CLOUD director Kirkby:
"At the present time we can not say whether cosmic rays affect the climate."
Looking at the results of CLOUD, if cosmic rays were a significant factor in affecting our climate, the Earth should have been cooling, not warming. Instead 8 of the warmest 10 years have all occurred in the most recent 10 years.
Erlykin et al 2013 - A review of the relevance of the ‘CLOUD’ results and other recent observations to the possible effect of cosmic rays on the terrestrial climate
“The problem of the contribution of cosmic rays to climate change is a continuing one and one of importance. In principle, at least, the recent results from the CLOUD project at CERN provide information about the role of ionizing particles in ’sensitizing’ atmospheric aerosols which might, later, give rise to cloud droplets. Our analysis shows that, although important in cloud physics the results do not lead to the conclusion that cosmic rays affect atmospheric clouds significantly, at least if H2SO4 is the dominant source of aerosols in the atmosphere. An analysis of the very recent studies of stratospheric aerosol changes following a giant solar energetic particles event shows a similar negligible effect. Recent measurements of the cosmic ray intensity show that a former decrease with time has been reversed. Thus, even if cosmic rays enhanced cloud production, there would be a small global cooling, not warming.”
Modern CCN are pretty much insensitive to cosmic rays and changes in TSI from the Sun, compared to the very much larger anthropgenic and natural contributions (volcanoes, oceanic oscillations and wildfires):
"New particle formation in the atmosphere is the process by which gas molecules collide and stick together to form atmospheric aerosol particles. Aerosols act as seeds for cloud droplets, so the concentration of aerosols in the atmosphere affects the properties of clouds. It is important to understand how aerosols affect clouds because they reflect a lot of incoming solar radiation away from Earth's surface, so changes in cloud properties can affect the climate.
Before the Industrial Revolution, aerosol concentrations were significantly lower than they are today. In this article, we show using global model simulations that new particle formation was a more important mechanism for aerosol production than it is now. We also study the importance of gases emitted by vegetation, and of atmospheric ions made by radon gas or cosmic rays, in preindustrial aerosol formation.
We find that the contribution of ions and vegetation to new particle formation was also greater in the preindustrial period than it is today.
However, the effect on particle formation of variations in ion concentration due to changes in the intensity of cosmic rays reaching Earth was small."
And
"...solar cycle variations of ion concentration lead to a maximum 1% variation of CCN0.2% concentrations. This is insignificant on an 11 year timescale compared with fluctuations due to, for example, the El Nino-Southern Oscillation, variations in wildfires, or volcanoes."
Gordon et al 2017 - Causes and importance of new particle formation in the present-day and preindustrial atmospheres
And the coup de grace for cosmic rays, being proven to unable to significantly affect clouds and climate, is that CCN respond too weakly to changes in Galactic Cosmic Rays to yield a significant influence on clouds and climate.
Pierce 2017 - Cosmic rays, aerosols, clouds, and climate: Recent findings from the CLOUD experiment
Scientist Richard Alley pretty much killed the cosmic ray hypothesis here (the relevant part of the lecture starts at 42:00)
"We had a big cosmic ray signal, and the climate ignores it. And it is just about that simple! These cosmic rays didn’t do enough that you can see it, so it’s a fine-tuning knob at best."
To recap, the Laschamp excursion (the strongest cosmic ray event in the past 40,000 years) hammered climate for 2,550 years about 40,000 years ago. The flux of beryllium-10 produced by cosmic rays greatly increased as the Earth’s magnetic field weakened by 90%.
Here is the chart he’s referring to, showing how the flux of beryllium-10 produced by cosmic rays greatly increased as the Earth’s magnetic field weakened by 90% about 40,000 years ago.

From the AR5, WG1, Chapter 7, p. 573:
"Cosmic rays enhance new particle formation in the free troposphere, but the effect on the concentration of cloud condensation nuclei is too weak to have any detectable climatic influence during a solar cycle or over the last century (medium evidence, high agreement). No robust association between changes in cosmic rays and cloudiness has been identified. In the event that such an association existed, a mechanism other than cosmic ray-induced nucleation of new aerosol particles would be needed to explain it. {7.4.6}"
- Ice age predicted in the 70s
scaddenp at 10:31 AM on 28 November, 2019"S Could you please point out that I have stated it?"
It is entirely possible that we are misunderstanding each other. Michael Sweet was pointing out what was wrong with the idea that an ozone hole was going to lead to global cooling.
You replied:
Mr sweet,
This may enlighten you
Cooling of the Arctic and Antarctic Polar Stratospheres due to Ozone Depletion
Which correctly shows that loss of ozone leads to stratigraphic cooling (but not to climatic cooling). Your manner of comment suggested that you were trying to contradict Michael Sweet. If you were trying to support his argument, then indeed, we are cross-purposes. You seemed somewhat confused between tropospheric and stratospheric ozone and so I thought it might clarify matters if you explained how you thought it worked.
My understanding is this:
In the stratosphere, O3 reduces the energy reaching the surface because it traps incoming UV. (ie unlike N2, O2, and for that matter CO2, it is NOT transparent to incoming solar radiation). This warms the stratosphere but it is a cooling effect on surface climate. On the other hand, O3 is also a greenhouse gas so traps outgoing IR causing some warming. I believe the balance is towards a very small warming effect.
In the troposphere by comparison, UV is mostly absent and so the greenhouse effect is more important (but O3 levels are very low).
Reducing the O3 cools the stratosphere alright but it means there is more energy (UV) warming the surface and so no, the O3 hole is not a climate cooling mechanism.
- SkS Analogy 20 - The Tides of Earth
Alan Lowey at 01:40 AM on 12 November, 2019Post#41
See this paper: A Causality Problem For Milankovitch (Karner, Muller)
Summary
According to the Milankovitch theory, changes in the incident solar radiation, called insolation, in the Northern Hemisphere provide the driving force for global glacial cycles. In their Perspective, Karner and Muller discuss recent studies of corals from around the world that shed doubt on the applicability of the theory to the termination of the penultimate glaciation. The authors argue that a fresh, unbiased look at the data is warranted.
.....
- It's a 1500 year cycle
Eclectic at 01:33 AM on 8 November, 2019Alan Lowey @28 ,
the sun's energy absorbed by the Earth is approx 1.1x10^17 watts (based on TSI times 71% absorption times Earth-cross-sectional area).
Tidal energy (lithosphere and oceans) dissipated into heat, is calculated (Na & Lee, 2014 ) as approx 3.5x10^12 watts. So roughly the same as world total electrical generated power. And roughly a third of the heat generated by the radioactivity of the Earth's core. And roughly 1/30,000 th of the solar radiational heat absorbed by the earth's surface.
The core heat rising to the surface is so tiny (for climate calculations) that it is usually ignored. And the ocean tide heating effect is even smaller than the core heat loss.
I do not understand how you can say: "tides dissipating heat ... is much greater than solar radiance combined with AGW." You seem to have gotten that back to front. Or were you meaning a comparison with that fraction of extra heating produced through the greenhouse action of human-caused CO2/methane/etcetera? Yet even there, your "tidal" heat is at least a couple of orders of magnitude too small.
- It's the sun
deucarra at 21:12 PM on 7 November, 2019As a person concerned about the climatic issue I am trying to understand all the arguments, however this graphic baffles me. Going to the physical foundations of the graph, the temperature is an indicator of the accumulated heat, while solar irradiation is a flow, and by therefore, a contribution of heat. So I don't see any point in looking for a correlation between the two variables (it would be like comparing speed with position). I think that the correlation between temperature variation and irradiation would be more interesting, and that is when these variables not only do not move in opposite directions but do so in parallel.
- It's the sun
scaddenp at 12:55 PM on 7 November, 2019socialfox - estimates of climate sensitivity seek to answer what would the change of temperature for a given effective increase in radiation at TOA. Changes in GHG concentration, albedo are back-calculated to an effective change in TOA radiation. ie. As if the incoming solar radiation was changing. The direct contribution to radiative flux from a change in GHG is a known quantity (~4W/m2 for a doubling, which falls out the Radiative Transfer Equations and has been empirically verified in various ways). It is not something deduced from the temperature response, but resultant feedbacks (water vapour, albedo, cloud cover) that contribute to actual change in temperature are not well known and hence the wide range of estimates for climate sensitivity. Climate sensitivity is estimated from a variety of methods including paleoclimate and models.
Note that models do not assume a climate sensitivity - it is an emergent property from the model so I dont see the circularity.
- CO2 was higher in the past
nyood at 05:28 AM on 5 November, 2019"(1) The total climate forcing from 6000ppm CO2 is very roughly 40Wm^-2. There is no evidence
to suggest that climate was impacted by such forcings (from any source) during the Ordovician."(1) The first sentence is axiomaticly using an estimated forcing of CO2 and therefore is a statement, though the consequences you state are true (none).
I state that CO2 forcing is max 1°C, reaching saturation with roughly PAL levels, pretty much always or already.The Second sentence is true, the forcings that Do determine climate Temperature (T) are the two equilibrium forces
hothouse effect (HHE) and high landmass ratio within polar circles (LPC).
The faint sun paradox (FSP) underlines the strength and dominance of the terrestial forcings by allowing
the orrdovician-silurian events, HHE - LPC - HHE, to happen within the same T amplitude of all compareable HHE and LPC events untill today.
Neglecting CO2 and reducing the FPS or -4% TPI, in its forcings.On top of that you devaluate some of your own arguments brought up in the coming sections. According to (1) you do not allow yourself any comparison from there on.
"(2) According to your cited reference (slides 11 & 14), the period with elevated CO2 significantly above 4000ppm
coincides with the Katian, a period of warming."(2)This sentence has no expressiveness. HHE is happening anyways before and after the LPC.
The Katian documents the late transition state towards an LPC, in fact it doubts CO2 as a driver.
The discrepancy between assumed CO2 forcing and T is underlined by the general high CO2 level in the atmosphere, the planet will reach a glaciation from here on, to develop extreme ice shields despite CO2 levels this high. The FPS is solved as mentioned.
Furthermore forces mentioned in the Schwarck study explain the Katian warming already:
" Bodaevent:
Continental Flood Basalt Province.Alternatively to a bolide impact, LIPs have been postulated as warming triggers."The forcing here that matters is Ice albedo reduction due to dust and ashes.
We can see this again when younger impacts and events causie warming rather then cooling.
An accumulation of dust and ashes at the poles are the result of a rather quickly cleanse of the atmosphere."(3) The period following the Katian sees falling CO2 and falling temperature.
The period of high glaciation during the Himantian sees CO2 estimates
dropping to perhaps 1500ppm. Relative to our recent ice ages with 180ppm CO2,
the Himantian CO2 forcing would thus be perhaps +11Wm^-2 while the relative solar forcing would be -8Wm^-2."(3) "dropping to perhaps 1500ppm". The Schwarck study claims PAL up to x6 till x20. Please specify "perhaps"
and clarify why it is not PAL but minimum PAL x3 according to you. Where are Schwank et.al wrong ?Reminding here that the level of CO2 does not matter in the first place unless it is below PAL (max -1°C), using my axioms.
Again you apply axiomatical values, which are not needed to explain temperatures, you are still using the FSP as a theory support, or to bring it in an equilibrium with
CO2 forcing, by trying to "ramp up" CO2 to a minimum of 1500ppm. Ironically this opposites many attempts
that try to lower CO2 to explain why a glaciation happens, despite ~6000ppm before and after the glaciation, in the first place. These views higlight the needs to explain CO2 forcings as assumed (too high)."(4) Your assertion @89 is that the major forcing of climate is the tectonic positioning of land over polar regions.
Yet there was such land over polar regions throughout the Ordovician when these great swings of climate appear suggesting
the climate was being forced by entirely different mechnisms.I would therefore suggest you have failed to provide any support for your assertion "CO2 is no driver at all." "
(4)This is partly true, as strong as it is the Ice has to build up, which happens very quickly in the hirnation, after the Bodaevent.
The middle to late ordovician is in transition, the continental drift towards the pole is remarkable.
Which is documented with the Silurian:Furthermore one has to take in account the varying lengths of time periods. The ordovician has been added historicaly,
it was included in the silurian before, therefore this interesting periods are "staunched".Antarctica shows a trend towards having a "drop back" to the south pole, mentioned in the devonian and possible in the jurassic.
Maybe this happened here too and we need more accurate paleogeorgraphic data.Answering two other comments here made by other users:
89.Moderator response:
"[PS] This is heading way into sloganeering territory. You are selecting only observations that support your ideas and ignoring completely all others. Science does not operate that like.
You cannot ignore measured increase in downwelling radiation, conservation of energy, nor explain past climate change with hand-wavy statements that violate physics.
If you have a theory that can match all observations, simpler and with better precision than current theory and concordant with laws of physics then by all means publish. Meanwhile,
current climate theory is the one that matches Occams razor. No more half-baked sophistry please."My theory already has a better explanation with its radical attempt, that is the whole point. This is not "sloganeering" it is just a very radical attempt so it asks for situations where we have evidence that show CO2 as a significant driver, relating to topic.
I understand that my radical attempt makes it easy for me but i have to insist on the fairness that i am allowed to show that radical assumptions that i made, make more sense then your axiomatical assumptions.
There is the inherit problem that we eventualy go off topic but i have to ask you at this point which laws and forcings (radiation, energy conservation) are ignored by me in which way ?
I ignore factors as far as they allow me, hence ockham.
I insinuate that your axioms make less sence then mine. Your critisicsm lacks precission at this stage, when it comes to why my radical assumptions are not allowed and where they are not concordant with laws of physics.90. Eclectic:
"Nyood, the importance of CO2 as a driver of climate, is supported by (A) theoretical calculations [Arrhenius and later scientists]; is supported by (B) experimental evidence; is supported by
(C) observational evidence; and is supported by (D) geological evidence. In other words, the mainstream science developed during the past 200 years.The principle of Occam's Razor is a often a helpful guide to thinking : it is not in itself evidence and it is not in itself a method of proof.
Ockham (or Occam) did not support the cutting off or ignoring of evidence. Newton and Einstein did not ignore evidence. Nyood, why do you choose to ignore evidence?"
(A) Arrhenius,Planck Feldmann et.al give a frame, it is known that we can not apply CO2 with a clear value (uncertainty). This leads to a Saturation and or Lindzen et.al and therefore inevitable offtopic, as much as i am willing to discuss it.
(B) same as (A)
(C) I clame that observational evidence support my theory today: Dramatic CO2 increase with a moderate warming trend. My initial post was rightfully snipped of modern time references as offtopic.
(D) Geological evidence is the core of the LPC theory.
- Climate's changed before
MA Rodger at 18:31 PM on 24 September, 2019TVC15 @776,
The denialist asks about the features of two different times and asks what is different today.
20,000 years ago was the maximum glaciation of the last ice age, this the result of reduced solar radiation for the high-latitude Northern summers which 100,000 years ago triggered an increase in the amount of ice-covered land/ocean in high Northern latitudes. The level of ice was amplified by the increased albedo of the ice reflecting away greater levels of solar radiation and by the reduced GHGs (CO2 & methane) caused by the cooling global climate having a net draw-down of such gases. Thus we find the Laurentide & Cordilleran ice sheets covering mainly Canada and beyond, extending to cover the sites of today's Great Lakes. (The map below ignores changing coast lines.) It thus requires the Laurentide Ice Sheet to melt considerably before the Great Lakes can exist, their formation reportedly beginning 14,000 years ago.
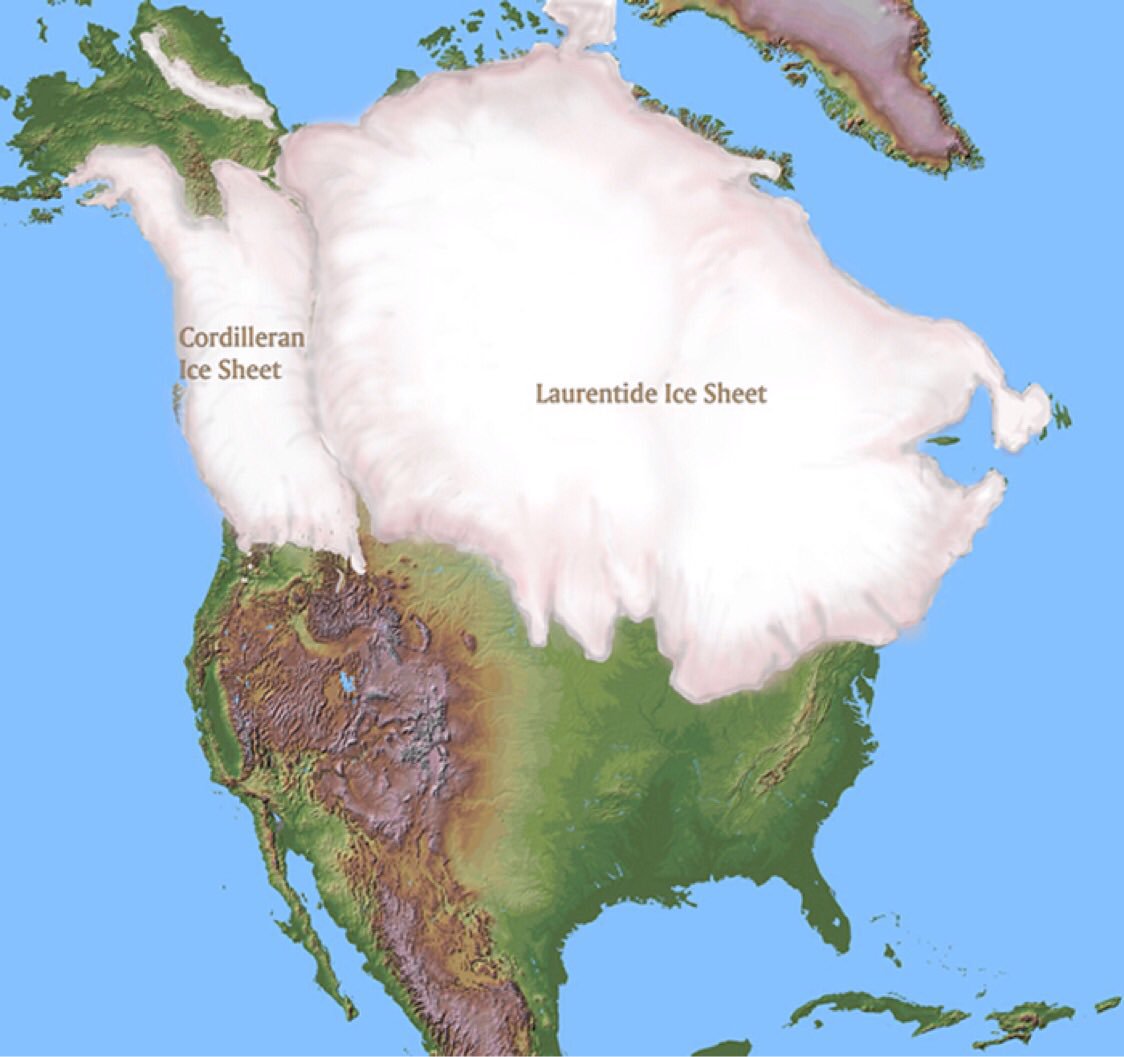
We now leap forward to a time when the Cordilleran ice sheet has long gone. Over recent times the dynamics of glaciers is not always determined by local temperature. A sea-terminating glacier will likely spend most of its days slowing advancing and then, becoming unstable, undergo a short period of rapid retreat. And reduced/increased snowfall can cause a glacier to shrink/expand.
So is there evidence that "Alaskan Glaciers started receding big time around 1750 to 1900"? Solomina et al (2016) who, in an analysis of global glaciers over the last two millenia, examine land-terminated glaciers in Alaska and see no sign of it. Their Fig 2 shows a GEI index indicating a fluctuation in local glacier size which peaked at about 1880AD. This would explain a "receding big time around ... 1900" but not the earlier 1750 date. Other research may give differing timings but it seems unlikely that there is any proper support for a 1750 to 1900 date. Can the denialist provide support for this bold assertion of his?
And "why is now any different"? The unprecidented global rise in temperatures will impact glaciers globally, including Alaska.
- CO2 effect is saturated
MA Rodger at 01:25 AM on 4 September, 2019GwsB @525,
You ask if that Wiki graph you show @525 is misleading. It certainly is!!
That Wiki graph simply shows the chance of a photon travelling vertically through today's atmosphere without a particular species of GHG absorbing it en route. It shows nothing of how many such photons would be travelling at each wavelength or even in what direction. The CO2 absorption band at 2.7μm is stopping solar radiation coming in from the sun not IR going out. The CO2 absorption band at 4.3μm sits in the gap between incoming solar radiation and outgoing IR - there are effectively no photons to be absorbed so it has no relevance to climate. And the inability of a photon to travel un-absorbed by GHGs out through the atmosphere does not prevent the mechanisms of the greenhouse effect from gaining strength through additonal levels of GHG. And I should add that the Wiki page you took the graph from provides a woeful attempt to describe the mechanisms of the GH effect.
You say "The basic physics is simple: A photon of light at a wavelength of 14 μm [15μm] is passed from one CO2 molecule to the next performing a kind of random walk until it exits the atmosphere. There are two exits, outer space and the earth. Saturation means that a photon starting from the earth has very little chance of exiting to outer space." The effect of this 'saturation' is solely that there will be a random walk as all photons will be absopbed. This does not of itself make the chances of IR resulting from that absorption exiting into space small.
Interestingly, you cite Zhong & Haig (2013) 'The greenhouse effect and carbon dioxide' yet you fail to acknowledge the finding of that paper which is "We conclude that as the concentration of CO2 in the Earth’s atmosphere continues to rise there will be no saturation in its absorption of radiation and thus there can be no complacency with regards to its potential to further warm the climate."
Instead you set out contradictory conclusions of your own - "The total negative impact is almost cancelled by the positive impact around 15 μm."
The GH-effect works because the emission & re-emission of IR from the atmosphere containing GHGs will only occur at those same wavebands which subject to are absorption. But the rate of re-emission is set by air temperature. As the temperature drops through the troposphere, the point where emissions will get out into space through the thinner upper atmosphere; that point in the troposphere will be colder. Thus the GHG at that higher altitude will re-emit less IR because it is colder. The more the GHG in the atmosphere, the higher the altitude and the bit of troposphere which emits into space and thus the less IR is emited.
Of course, as the graphics in Zhong & Haig show, that mechanism will go into reverse as the altitude becomes high enough to reach the stratosphere. In the stratosphere, temperature rises with altitude and so the more GHG the greater the IR emissions into space. This is the mechanism which you mention being apparent in their Fig5b which you say results in the increasing GH-effect being "almost cancelled." However, the extra GHG effect of CO2, although reduced with increasing CO2 concentrations in the well-konwn logathithmic relationship, does not peak even if the 15μm band is taken in isolation. It keeps on increasing. And at CO2 levels above 2500ppm(v), the 15μm band is boosted by a compound absorption band at 10μm.
The climate forcing of CO2 does not hit an upper limit. In the words of Zong & Haig (2013), "as the concentration of CO2 in the Earth’s atmosphere continues to rise, there will be no saturation in its absorption of radiation."
- Models are unreliable
MA Rodger at 20:09 PM on 15 August, 2019rupisnark @1151,
The basic message is as Eclectic @1152 says, Christy is trying to pull the wool over your eyes. It may be he has managed to pull the wool over his own eyes as well. That would square with him being in denial over climate change.
And Eclectic @1152 is correct to say that AGW is a phenomenon at the TOA but Christy is not discussing TOA. He is indeed obfuscating.Your first point, that global evaporation can vary by large amounts month-to-month (Christy quoted examples of 24 and 27 'units' in his talk, a variation peak-to-peak of some 12%, a little more variation than his words in GWPF Note 17 - "In other words, evaporation might be 24 one month, but it might be 26 the next."), looking at actual monthly variation, the maximum variation of measured global monthly precipitation over decads (there's a graph of it 1980-2011 on this web-page) is about 12% peak-to-peak. Thus to say such a variation could occur "one month" to "the next" is pure exaggeration. The typical variation month-to-month is far far smaller.
And it is far far smaller doubly-so. Your point that 12% is a big value is twice incorrect. As they say '100% of naff-all is still naff-all.' And the typical variation month-to-month in surface heat flux due to precipitation is naff-all relative to the total precipitation which in turn is a small component of the total surface heat flux.
And your inference that such variation in precipitation would be even larger at longer timescales, "annual, let alone centennial fluctuation" is not correct. Over longer timescales the variations will tend to average out, although there will be trends caused by the likes of AGW.
You also suggest that longer term fluctuation could exist in "the many other variables of both inut (eg amount of solar radiation) and output." The solar cycle resilts in TSI wobbling by 1Wm^-2 peak-to-peak. In Christy-units that would be 0.07 units peak-to-peak (of the 11-year cycle) but when averaged out over longer periods the measure would be far far smaller. That this is a minor effect climate-wise is evinced by the absence of any noticable 11-year climate cycle.Your second point is that "Christy’s diagram does NOT imply 0.5 units is retained." I don't know why you would suggest such an implication. In GWPF Note 17 Christy states "The extra carbon dioxide we have added to the atmosphere amounts to about an extra 0.5 of a unit of the 100 downwelling from the air." So if the CO2 is there, surely the 0.5 units are there. I see no evidence of any implication that the forcing is not permanent.
You further suggest that there is "extra heat being lost in the troposphere" which might provide "one possible reason," this proposal "backed up" by an area of the upper troposphere that has not warmed in line with modelled projections. I don't follow the logic. By what mechanism would a cooler part of the upper troposphere constitute a sink for a heat flux of 0.5 Christy-units? - Models are unreliable
rupisnark at 05:05 AM on 15 August, 2019@MA Rodger 1141
You state: “The constant 0.5 imbalance is "almost" (Christy also says "much more" which is a poor description - "more" yes, "much more" no.) the same size as the occasional fluctuations, his examples being monthly wobbles of +/-1.0 & +/-1.5.”
But Christy’s examples, which you appear to accept, take for instance evaporation of 24 average increasing to compared to 27 over a monthly which is actually a 12.5% change in the amount of heat lost through evaporation. That is clearly not small and that is just a monthly rather than annual, let alone centennial fluctuation of one of the many variables of both inputs (eg amount of solar radiation) and outputs.
Christy’s diagram does NOT imply 0.5 units is retained. His diagrams show in=out.
I think Christy believes one possible reason for the difference is explained by the extra heat being lost in the troposphere. This backed up by Steven C Sherwood and Nidhi Nishant “ tropospheric warming does not reach quite as high in the tropics and subtropics as predicted in typical models”. https://iopscience.iop.org/article/10.1088/1748-9326/10/5/054007/pdf. - CO2 lags temperature
scaddenp at 08:08 AM on 14 August, 2019"Great question. Also an intellegent question. It's something that many Climate Scientists have tried to brush off with a "yes, but CO2 then becomes the forcing agent" as if autocorrelation is only done at the beginning of each interglacial phase. It isn't. It's done over the entire time series, including when CO2 is suppose to become the forcing factor."
Let's break this down. Firstly, do you accept that glacial cycle is orbitally forced? Further discussion makes no sense if this is not the case.
Assuming you accept orbital forcing, how do you explain why SH glaciation is synchronous with NH (since orbital forcing is anti-phased). Its easy if you accept known physics (GHE included) but you apparently want to deny that increasing CO2 will warm the planet.
Secondly, how about linking to some more actual detail about your "autocorrelation" stuff. I dont get your point and I certainly not clear to me what you think you are proving. The relationship between T and CO2 is still somewhat unconstrained but is clearly non-linear and involves multiple mechanisms operating on scales from years to millenia.
What is the basis for your understanding of "their ever decreasing estimates of how much CO2 impact climate". I certainly do not get that from successive IPCC reports.
You seem to be implying that papers on direct observation were arguments from correlation. This is not the case. The arguments in those are of the form, "fundimental physics allows us to predict what observations done by this method would show. Let compare model results with observation".
So from this, you compute how much much the radiation at the surface will change with GHG concentration change - and measure it. You look at how GHG changes would change the spectrum of outgoing or incoming radiation - and measure them. That is what those papers do. Hansen and Sato compute forcing from change in GHG using ice core bubbles as proxy for atmospheric concentration, and compute the change in albedo based on sealevel etc, and finally the global solar irradiation change from milankovitch. Climate theory would expect icecore temperature to be related to that forcing calculation extremely closely and that is what is observed. A failure to observe that would be evidence against.
Can I ask whether you accept Planck Law? ie, if irradiation of surface increases, then it temperature must rise.
Finally, climate change at present appears to be forced by GHG change. The feedback mechanisms that apply during ice ages wont cut in any significant way for 100s of years. The natural system is still moping up about half of our emissions which make 616 invalid (actually so many issues with this, its hard to know where to start. You need 30 year averages remove the internally variability, especially ENSO.)
- Models are unreliable
MA Rodger at 00:39 AM on 14 August, 2019I had a second, more focused look at Sarkomaa & Ruottu (2019) and find it a worthless piece of work.
Clouded by ♥ a confusing use of English & ♥ not-scientific presentation, these elderly Finnish professors provide an account riven with ♥ unsupported but controversial assertions, ♥ silly mathematical constructs and ♥ mathematical models that entirely fail to capture the workings of climate (let alone AGW).
Such a conclusion does need some further demonstrating.
......
♥I don't think their poor use of English needs demonstrating.
♥The lack of scientific presentation is shown many times. As an instance, they insist (p6) that:-
"If all linear radiation coefficients of clouds are set zero, the SRclimate model of Appendix 4 [and of their design] calculates about 100 W/m2 increase of solar energy flux to the ground and about 13 °C increase of the mean temperature of the ground. This agrees with the generally known fact that when cloud comes in front of the sun temperature decreases. Thus, IPCC’s climate change claim should be based on calculations with negative, instead of the positive cloud feedbacks."
Their "generally known fact" is of course simplistic nonsense and the absence of "general agreement" is all too evident in Zelinka et al (2017), a reference cited by Sarkomaa & Ruottu. Yet this diparity is not addressed by Sarkomaa & Ruottu who instead treat us to mention of a peurile interchange with Finish climatologists (p6).
♥The lack of science extends to a large number of obviously unsupported controversial assertions. An example:-
"Figure 1[*] Figure shows that the mean temperature of the ground has been always varied and it is sure, that the variation is going to continue. During the latest 50 thousand years the mean temperature of the ground has increased about 6 ºC and that the increase is going on. On long term decreasing trend can be noticed which is due to inevitable decrease of nuclear reactions in the sun. The hundreds year trends are due to variation of surface temperature of the sun. These variations have nothing to do with CO2 concentration in the atmosphere."
[* on Page 20. Figure plotting global temperatures of last 2Myr based on Snyder (2016), Zachos et al (2008), Lisiecki & Raymo (2005) and 800kyr of Vostok ice core data scaled at 1:2. These first two references contradict the "nothing to do with CO2" assertion.]
♥The nonsense is aided by the use of silly mathematical calculations presented seemingly for no reason. Their equation 4.16a p52 presents an easily understandable example, it being a formula for an average global temperature for time t=0 to t=a obtained by integration over the surface of a sphere. Quite how anyone would obtain formula to use in such an integration of average temperature of a planet (Sarkomaa & Ruottu describe it as being "entirely impossible") or for what purpose they present the formula is not explained.
♥Perhaps their main conclusion is expressed within their blog commentary of their analysis which translated @1145:-
"It follows from Planck's Law and the equation for spectral radiance that the effect of increasing atmospheric carbon dioxide on global temperatures is asymptotic, not progressive."
Here Planck's Law is what within AGW is usually expressed in climatology as the Stefan-Boltzmann relationship although here its exact application is not entirely clear.
"Spectral radiance" is described as "The basic physical concept of radiative heat transfer" (p66) and the "asymptotic" level (which is found to be 288K, the average global temperature which the modelling is set to) appears to be the equilibrium temperature which, of course, will be arrived-at in a manner "asymptotic, not progressive" (as in their eq 5.1) as the equilibrium temperature is approached. The modelling is then used to demonstrate that there will be no significant increase in surface temperature if there is more CO2 in surface air. The result should actually be zero because the air has not been allowed to increase in temperature (the AGW effect is not driven by surface phenomenon) and so cannot have any extra radiative effect to warm the surface. All that happens is the IR path-length decreases within the CO2 absorption bands at the same rate at which the amount of CO2 emiting this IR increases - thus zero effect.
Sarkomaa & Ruottu actually report that in the absence of other GHGs, the "increase of carbon dioxide concentration has strong influence on the mean temperature of the ground." Their Fig 5 p73 is missing the 0.0005 'multiplier' plot but the other plots would suggest a 'climate sensitivity' of 1.0ºC at 0.0005 but this value for 'sensitivity' looks to be increasing exponentially as the 'multiplier' decreases. So if the 'multiplier' were reduced to zero, climate sensitivity (for a CO2 doubling) would be infinite.
But with the 'multiplier' at 1 and GHGs properly represented in their model, the "increase of carbon dioxide concentration has practically no influence on the mean temperature of the ground." Yet, as stated above, given what they are apparently modelling (which is not climate sensitivity), the answer should be zero. - Models are unreliable
Rob Honeycutt at 08:25 AM on 12 August, 2019onhannoita... I'm sure climate scientists everywhere get submissions from all sorts of cranks claiming almost everything under the sun. Most are going to straight to the cylindrical filing cabinet (aka, trash can).
Here's one that should be fairly straight-forward: water vapor.
"Claim 1.4: Water vapor is not a greenhouse gas
The claim 1.4 proves unfathomable ignorance on radiative heat transfer of the thousands of authors of IPCC’s assessment reports. Even though water vapor differs from all other gases of the atmosphere by its thermostatic properties it is by far the “strongest greenhouse gas” of the atmosphere. In the lower atmosphere, mean linear emission coefficient of water vapor is about 27 times the linear emission coefficient of carbon dioxide.
Water is not only by far the “strongest greenhouse gas” but also by far the strongest “greenhouse liquid” and “greenhouse solid”. In the lower atmosphere, sum of the linear emission coefficients of water droplets and particles is at least as large as the linear emission coefficient of water vapor. Everybody knows that during cool nights, when linear emission coefficient of water vapor is small, air temperature may vary up to 10 oC, depending on cloudiness. Because the existing data is deficient, in the calculations of Appendix 4, the Authors have applied minimum realistic estimate of 1 m2/mole for the mean molar emission area of liquid and solid water. Even with this minimum value, water in its three entities dominates fully thermal and solar radiation to the ground and thus the thermodynamic mean temperature of the ground."
As far as I can tell, this is borderline word salad. I mean, "greenhouse liquid" and "greenhouse solid"? It's not even clear to me what they're claiming. Are the claiming the IPCC doesn't consider WV a greenhouse gas? (Which would clearly be wrong.)
- Models are unreliable
MA Rodger at 06:38 AM on 12 August, 2019The article linked @1143 runs to ninety-three pages and is the work of a couple of rather old Mechanical Engineering Professors, Pertti Sarkomaa & Seppo Ruotu (whose surname translates as 'Swedish'). Their work in thermodynamics explains their easy use of maths.
At first glance, their modelling does not appear to address the mechanisms of AGW so if they conclude that increased CO2 is not an agent of warming, that would be no surprise. The article is not well presented with presumably some of the problem resulting from language difficulties.
An account of their work more easily understood is presented in a blog on the site that holds the up-load of the article linked @1143. (Its comment thread may be worth examining.) Of course, the blog-page is in Finnish but that is no great barrier in this day & age. The blog runs to 700 words, not an impossible length for an SkS thread. A translation of it runs:-
Professors: The IPCC Climate Hysteria is a religion without logic
Professors Pertti Sarkomaa (Professor of Heat and Flow Technology and Combustion Engineering) and Seppo Ruottu (Professor Emeritus of Technical Thermodynamics) approached the Rural Media and sent their thoughts on the IPCC report, the IPCC Climate Hysteria. In their view, the IPCC's climate change projections are based on completely erroneous calculations.
IPCC calculations are based on climate models
The calculations in the IPCC monitoring reports are based on climate models that use heuristic parameters such as radiation constraint, cloud feedback, and climate sensitivity that have no physical equivalent or objectively correct value and are not known, required, or permitted by the exact laws of flow and thermal dynamics. The use of said heuristic quantities in climate models is in itself a fatal mistake and indicates that their users do not understand flow and thermal dynamics.
The meteorological scientific community recognizes that, despite decades of research, there is no certainty about the hallmark of cloud feedback. Every common sense person understands that even if the sign of a key parameter of a mathematical model is unknown, the results produced by the model are incorrect. Because cloud feedback is a heuristic that has no physical equivalent, there is no objectively correct value that can be determined. The decades-long study of Cloud Feedback is the most incomprehensible blunder in modern science.
Positive cloud feedback values have been used in the calculations accepted by the IPCC so that a staggering increase in carbon dioxide concentration from 300 ppm to 600 ppm, which would not actually occur, would increase the global mean global equilibrium temperature generated by the calculations by 2-5 ℃. Meteorologists call this change in temperature sensitive to climate sensitivity.
With positive cloud returns from calculations approved by the IPCC, the sensitivity of the climate is two to five times the warming of the lower atmosphere caused by the actual increase in atmospheric carbon dioxide from 280 ppm to the present 410 ppm. So climate sensitivity depends entirely on the cloud response you choose.
It follows from Planck's Law and the equation for spectral radiance that the effect of increasing atmospheric carbon dioxide on global temperatures is asymptotic, not progressive. If the atmospheric carbon dioxide concentration were to increase by the next 130 ppm, the effect of the increase on global average temperatures would be smaller than the increase that had already occurred. The climate sensitivity of the IPCC calculations is completely unrealistic.
Clouds are known to reduce the average solar energy flux on the Earth's surface by about 100 W / m2, so negative calculations should have been used instead of positives in calculations approved by the IPCC. Thus, the IPCC's climate change projections are based on completely erroneous calculations. When the effect of carbon dioxide on global average temperatures is calculated in accordance with the laws of flow and thermal dynamics, the effect is found to be insignificant.
We have provided our calculations to leading Finnish meteorological experts and asked them to prove their potential errors. No errors have been addressed. Nonetheless, the meteorologists who have committed themselves to the IPCC claim are categorically dogmatic, ”say Finnish professors Pertti Sarkomaa and Seppo Ruottu.
Carbon dioxide has no effect on global warming
The climate has changed during the Earth's existence and in the future. It is affected by a plurality of randomly variable quantities with their mutual random interconnections.
According to our research, the effect of atmospheric carbon dioxide on surface and ground-level temperature is insignificant, even if the atmospheric carbon dioxide content doubles compared to the present one. The change would be only a few hundredths of a degree Celsius.
According to our understanding, e.g. The IPCC climate models that underlie the Paris Climate Convention and the climate projections and key measures to "save the world" derived from them are both erroneous and illogical.
The efforts of the IPCC to minimize carbon in the natural cycle and the atmosphere and to switch from fossil fuels to electricity and mechanical energy generation to biofuels will lead to a reduction in energy and food production and biodiversity. Long-term adherence to the IPCC's aspirations and recommendations will lead to mankind's disaster as fossil fuels run out over the next 100 years.
Therefore, the remaining fossil fuels should be used in such a way that, when depleted, the Earth's carbon cycle, which sustains life in the world, produces the greatest amount of biodiversity-compatible biomass.
In Lappeenranta 03.08.2019, Best regards. Pertti Sarkomaa Seppo Ruottu - Professori, TKT.
- 'No doubt left' about scientific consensus on global warming, say experts
Bob Loblaw at 11:26 AM on 31 July, 2019For a less intense introduction to climate change, I often suggest the first IPCC report from 1990. It covers a lot more basics that are simply assumed in later reports.
https://www.ipcc.ch/report/ar1/wg1/
In the contents of the Executive Summary, the first section lists:
What factors determine global climate?
What natural factors are important?
How do we know that the natural greenhouse effect is real?
How might human activities change global climate?
In the main table of contents, Chapter 1 is titled "Greehouse gases and Aerosols". It covers five specific gases, plus ozone and related trace gases, and then aerosols.
Chapter 2 is titled "Radiative Forcing of Climate". Its sections cover greenhouse gases, solar radiation, direct aerosol effects, indirect aerosol effects, and surface characteristics.
So much for the idea that the IPCC does not consider other factors besides fossil fuel emissions. This is so easy to look up.
- 2019 SkS Weekly Climate Change & Global Warming News Roundup #27
Bob Loblaw at 11:17 AM on 26 July, 2019billev:
You can't see something you refuse to look at. For the effects of El Nino on global temperatures, look no further than this paper. Once effects of El Nino volcanic aerosols, and solar variability are removed, very little year-to-year variation is left.
For a readable summary of the Foster and Rahmstorf paper, try here. The key graphic is the following:
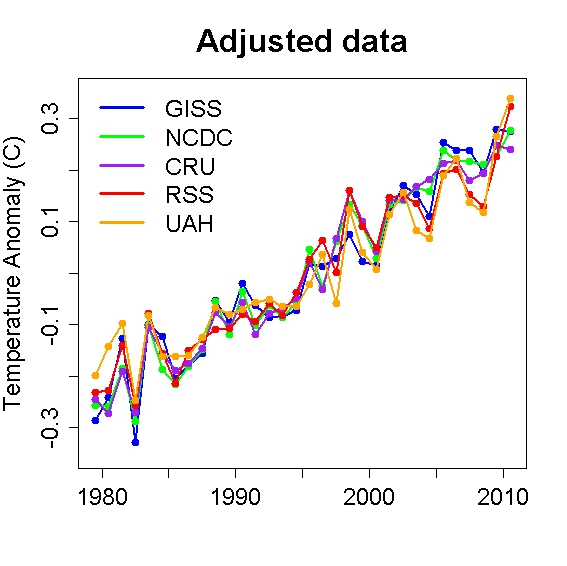
As for chasing the squirrel of IR radiation affecting near-surface air temperature measurements, you really are scraping the bottom of the barrel. Air temperature in the lower tens of metres is vastly controlled by ground (or ocean) surface temperature, which is heated by the sun. Air temperature measurements are taken inside radiation shields, such as the Stevenson Screen. This not only eliminates IR effects, it pretty much removes errors related to solar radiation heating, which is a far more important issue. We've only known about these sort of issues since the mid-1800s.
You're not catching up - you're falling even farther behind. Yesterday, it was 1964 information you were missing. Now it's 1864 information. As one of my colleagues says "he's so far behind he thinks he's in the lead".
- Postma disproved the greenhouse effect
Bob Loblaw at 09:54 AM on 23 July, 2019Dear Nhqjo5kgDyNtNJLX683t:
This has come up recently on this thread:
https://skepticalscience.com/argument.php?a=18&p=26#132128
Radiation in or out of a horizontal surface is expressed as W/m2 (flux density) because douibling the area doibles the energy involved. Yes a Watt is a Joule per second - you get a total in Joules if you sum over time.
The division by four is correct, though: IR is emitted vertically, i.e., perpendicular to the earth's surface. To get total IR in Joules you multiply by the entire earth's surface (4*pi*r3).
Solar radiation is not received vertically at all points on the earth's surface, though. In fact, at any instant in time, there is only one location on earth where the sun is directly overhead. Everywhere else, the sun's rays strike at an oblique angle. The solar intenstity, as measured per unit area of the earth's surface, is reduced according to the cosine law - by a factor of 1/cos(z), where z is the angle between the sun's rays and the local vertical.
If you like calculuis, you could integerate the 1/cos(z) relationship over the entire surface. If you prefer trignonometry, the total sunlight received by the earth is proprtiional to the area of a circle of radius r - area=pi*r2.
The ratio of the two is 1/4, not 1/2.
To visualize the sun's reduced intensity, imaging trying to read a book by candlelight. You can probably manage if you hold the book perpendicular to the light coming from the candle, but as you turn the book obliquely, the light intercepted by the book's page will decrease. By the time the page is parallel to the candle's beam, the page captures no light at all. Think of the sun the same way" at sunrise or sunset, a book lying horizontally gets no direct sunlight at all - only the skylight.
- Is Nuclear Energy the Answer?
michael sweet at 23:01 PM on 12 July, 2019Msmith,
I have worked professionally with large amounts of radiation, I have held a Curie of high energy beta in my unshielded hand, and saw all the information you cite on radiation during my workplace training.
Barry at 75 cites James Conca who writes at Forbes to claim nuclear has the lowest death rate. Doing background reading I found Conca claims only 51 total deaths from Chernobyl including long term cancers. The Union of Concerned Scientists states that 54 people are known to be killed immediately from radiation poisoning. A further 4,000 cancers are expected among the highly exposed gneeral population and 27.000 total cancers are exected worldwide. Conca's estimates are a factor of approximately 500 too low. He is widely cited by nuclear supporters. MIchael Schillenberger uses the same numbers as Conca.
Conca and Schillenberger claim Fukushima killed zero people while peer reviewed studies estimate 1000 killed by radiation, in addition to 600 killed during the required evacuation.
These numbers from spokesmen of the nuclear industry and claims from you and the nuclear industry that the linear response no threshold model overestimates cancers means that no-one will ever get cancer demonstrate you do not care how many people they kill. It has been widley repoorted in the newspaper that exposure to low levels of the many chemicals we have in everyday life result in increased death rates. More radiation has to be bad for a population even if it is not statistically significant.
If we multiply Conca's estimates of deaths from nuclear by 500 to account for his deliberate low balling we see that nuclear actually has a very high death rate compared to other utility generation sources. I note that utility solar generation is deliberately left off Conca's chart since it has such low death rates.
As I have posted already upthread, The French Nuclear Regulatory Agency sees no inherent safety improvements in Generation IV reactors and the Union of Concerned Scienitsts show that claims of greater safety are a scam to get safety standards lowered. I do not buy your improved safety claims.
All of this has been argued upthread already. I suggest you move on to other topics. My experience is that few people will shift their position on safety.
If you want to argue we should only consider new designs I respond that it will be much too late to implement them if they ever get approved. Dittmar 2012 a nuclear Physicist claims that any money spent on nuclear is wasted because nuclear cannot supply more than a small fraction of world energy. Nuclear currently supplies less than 2% of world energy. As MA Rodger points they are already short of uranium.
- Is Nuclear Energy the Answer?
MSMITH at 08:29 AM on 12 July, 2019Michael Sweet:
I need to respond immediately to one thing: "In general I do not discuss radioactive waste or problems that radioactivity causes because nuclear supporters do not care how many people they kill with radioactivity."
I care very much that the death rate from nuclear power, at all levels of the process, from mining to final disposal is much less than that of other technologies. This has been mentioned early. But I would never accuse you of not caring (for example) about the number of people killed during erection of a wind turbine, nor would I accuse you of not caring about the number of people who die falling off a roof maintaining a solar panel.
I therefore consider it a misrepresentation of my position. You imply by your statement the following:
1.) The death rate from nuclear is higher than all other sources of power.
2.) Nuclear supporters know this.
3.) Nuclear supporters choose nuclear anyway, for some other reason.
Number 1 is demonstrably false. Number 2 are therefore rendered irrelevant.
"Personally attacking other users gets us no closer to understanding the science."
You are, however, correct that I did not mention transuranics. But my statement did say "on the order of natural uranium." Yes, transuranics are there, but as there has been no study that has detected any increase in death rates due to radiation exposure on the order of natural background radiation
From the Radiation in Everyday LIfe by the IAEA:
"There are many high natural background radiation areas around the world where the annual radiation dose received by members of the general public is several times higher than the ICRP dose limit for radiation workers. The numbers of people exposed are too small to expect to detect any increases in health effects epidemiologically."
So, if we have been unable to detect the health effects from doses several times higher than the limit for people working in the nuclear power industry, does it not stand to reason that health effects from doses of about 10% of that limit would also be undetectable?
"Nuclear supporters hope to have breeder reactors in 2050 which is too late."
No it's not. For the first 700 - 900 years or so, the radioactivity in spent fuel is dominated by the Sr-90 and Cs-137 I mentioned earlier. If somebody was worried about the dose due to transuranics, storage for even 100 years, followed by reprocessing at that point, provides adequate protection from that portion of the dose that comes from transuranics.
"I note that you have provided no citatioins even to nucear industry propaganda."
As stated in the beginning of my first post, I would establish facts and then support those that you did not agree with. As much of what I said comes from many years of study, from textbooks and in-depth coursework, and from references, it would be useless to go to great lengths to provide adequate references to something that you acknowledged openly.
But now that it's been questioned, I will respond to specifics:
"(90% of current reactors face serious flooding issues which they have not addressed)"
As we are talking about expansion of nuclear power, it makes sense to talk about new designs, not current designs. And specifically, since I did in fact mention SMR in reference to the Clinch River site, we'll simply mention that the flooding issue for the NuScale SMR is simply n/a. The reactor sits in a below-grade pool of water, and requires no power to remain in a safe condition. Flooding is literally not a concern.
And that's not my position. It's the NRCs position. They have accepted that the NuScale reactor needs no AC or DC power to remain safe, which of course is what killed Fukushima, and which all of the flooding concerns ultimately hinge upon.
"It is easy to say a location is suitable without considering the suppy of cooling water,"
A nuclear plant needs about as much cooling water as a coal plant. Replacing a coal plant with a nuclear plant uses the same water a coal plant was using.
"local population, availabiity of land,"
Site boundary sized Emergency Planning Zone. Those words mean something. They literally mean that I could place an SMR facility to replace of a coal plant and not need to worry about evacuations, or off-site dose, and not even worry about zoning, as it stays zoned for industrial.
Again, as reference, Here is the Final Environmental Impact Statement for the Clinch River site.
- Is Nuclear Energy the Answer?
michael sweet at 03:34 AM on 26 June, 2019Eclectic,
I thought it was interesting that utility scale solar, which is most of the solar industry, was left off the list from James Conca. He also does not count all the people killed in the evacuation of Fukushima as killed by nuclear.
If you don't count the people you kill, you can get any result you want. From people who care about how many people die: Accounting for long-term doses in “worldwide health effects of the Fukushima Daiichi nuclear accident” "the mid-range estimate for the number of future mortalities is probably closer to 1000" from radiation released in the accident. James Conca says none.
James Conca never addresses the fact that nuclear power has priced itself out of the market.
- Holocene Optimum was warmer
Phaedrus1 at 21:29 PM on 21 June, 2019From the National Climate Data Center:
Paleoclimatologists have long suspected that the "middle Holocene," a period roughly from 7,000 to 5,000 years ago, was warmer than the present day. Terms like the Altithermal or Hypsithermal or Climatic Optimum have all been used to refer to this warm period that marked the middle of the current interglacial period. Today, however, we know that these terms are obsolete and that the truth of the Holocene is more complicated than originally believed.
What is most remarkable about the mid-Holocene is that we now have a good understanding of both the global patterns of temperature change during that period and what caused them. It appears clear that changes in Earth's orbit have operated slowly over thousands and millions of years to change the amount of solar radiation reaching each latitudinal band of Earth during each month. These orbital changes can be easily calculated and predict that the Northern Hemisphere should have been warmer than today during the mid-Holocene in the summer and colder in the winter. The combination of warmer summers and colder winters is apparent for some regions in the proxy records and model simulations. There are some important exceptions to this pattern, however, including colder summers in the monsoon regions of Africa and Asia due to stronger monsoons with associated increased cloud cover during the mid-Holocene, and warmer winters at high latitudes due to reduction of winter sea ice cover caused by more summer melting.
In summary, the mid-Holocene, roughly 6,000 years ago, was generally warmer than today during summer in the Northern Hemisphere. In some locations, this could be true for winter as well. Moreover, we clearly know the cause of this natural warming, and we know without doubt that this proven "astronomical" climate forcing mechanism cannot be responsible for the warming over the last 100 years.
https://www.ncdc.noaa.gov/global-warming/mid-holocene-warm-period
- Is Nuclear Energy the Answer?
michael sweet at 02:10 AM on 15 June, 2019DPeppigrass,
It looks like your post will not be deleted by the moderator even though it has no citations to peer reviewed studies to support your wild claims. You have two posts. I will address the second one first. They are long posts with many factual errors so my response is necessarily long.
In your second post you start with several links to long youtube videos of nuclear industry propaganda. I do not have time to waste watching them. Please cite peer reviewed written sources so they can be checked.
You then have a long screed on the topic of radiation safety. I note that I have extensive training and experience using radioactivity while you have claimed no experience or training beyond your reading on the internet. In general, I do not debate radiation safety with nuclear supporters because they do not care about reactor safety or how many people they kill. It is thus a waste of my time to discuss safety.
However, for other readers I have this reference from the French Nuclear Regulatory Commission (the IRSN) .
“At the present stage of development, IRSN does not have all the necessary data to determine whether the systems under review [generation IV reactors] are likely to offer a significantly improved level of safety compared with Generation III reactors”.
The claims you parrot about “safe” generation IV reactors are simply propaganda from the nuclear industry.
According to the Union of Concerned Scientists, the Nuclear Industry claims their new designs are safer so that they can reduce safety factors to make more money. There is no factual basis for the claim the reactors are really safer. This is generation IV of nuclear reactors because the first 3 generations were not safe as advertised and were too expensive.
In your first post you start out calling “citation needed” for Abbotts claim that “nuclear reactors must be placed "away from dense population zones, natural disaster zones, and near to a massive body of coolant water" It takes a lot of brass to call for a peer reviewed paper to provide citations when your post contains none. Let us examine these issues.
It is illegal to locate nuclear reactors in cities. In light of the safety issues cited above it is unlikely that rule will change in the foreseeable future. Abbott is correct, no citation needed.
You are suggesting that it is OK to locate nuclear reactors on top of earthquake faults, in flood zones and in locations that are likely to be inundated by sea level rise. I do not think anyone will agree with you. Your claim strongly supports my claim above that nuclear supporters do not care about the safety of the reactors they build. Abbott is correct, no citation needed.
You claim “ the third one in particular does not really apply to Molten Salt Reactors which can rely on air cooling or on relatively modest amounts of cooling water.”
Reading your link and your discussion it appears that you have confused the amount of water needed in an emergency to shut down the reactor and the amount of water that is needed every day for normal operation. The nuclear designers claim without evidence that their designs can do an emergency shutdown with little water or air cooling. Your calculations may indicate how much water that is. According to you, for normal operations the reactors must remove approximately 1.1 GWth at all times. That can only be done with massive amounts of water. Air cooling is too expensive and inefficient for normal use. Your claim that massive bodies of water are not needed is false. This error demonstrates that you have no idea how a nuclear plant works. In spite of the fact you do not know how the plants work you lecture us what we should think. Abbott is correct, no citation needed.
Abbott correctly describes the footprint of a nuclear plant to counter incorrect industry propaganda that nuclear plants only occupy a small area.
You say “I'd love to hear anyone come up with a theory of how an MSR could produce a hazardous radioactive gas cloud (in all seriousness, e.g. I'm waiting for a chemist to speak up about what would happen if a supersonic jumbo jet mysteriously aims itself directly at the below-grade reactor, and then let's say it had a water-based cooling system that now pours uncontrollably onto the exposed salt.”
Fortunately, I am a professional chemist. In the scenario you describe the water coming in contact with the extremely hot salt would instantly cause a steam explosion that would destroy the facility. In the explosion a lot of hydrogen gas would be generated from the highly reducing salt solution. This would cause a hydrogen explosion. Massive amounts of fallout would be released into the environment. Since the industry does not want to build an expensive containment building the explosion would be uncontained. This supports my claim of lack of care about safety.
Abbott describes how many reactors would need to be built to illustrate the size of the problem. Since only a handful of reactors are currently built each year the rate of building would have to increase by a factor of about 100.
You say “the usual debate over nuclear power is not whether we should build 15,000,000 MW of nuclear capacity, but whether we should build any whatsoever”. Abbott discusses building only 1500 reactors at the end of his paper.
If less than 1500 reactors were built than almost all power would have to come from wind and solar. In a renewable world the most valuable energy is peak power on windless nights. Baseload is not valuable at all. It would be much more cost effective to build out more renewable or storage. We would not need to worry about radiation safety, nuclear waste or weapons proliferation.
You say “Um, you mean heat? Why wouldn't you just call it heat?” No, Abbott means entropy. You obviously did not take college chemistry or physics. Heat and energy are similar. Entropy is complicated but for this discussion it is similar to randomness. As heat increases the drive to increase randomness increases. This causes materials to corrode, crack and fail much faster. The problem is especially bad for MSR’s because the salt is also especially corrosive. Alloys that can withstand the heat and corrosion of MSR”s, for example in the valves that control the salt solution, have not been found. They may not exist. The reactors you favor cannot be built until after the alloys for the valves are discovered. This is another example of something you are lecturing us about that you do not understand at all.
You say” My God, is that a citation? Great, now I have to go look at it to see if it has merit. I need to go to sleep momentarily.” Abbott provides citations for all his claims. If I were moderator I would warn or ban you for making game of citations. Where did you get your PhD in reactor design that you are qualified to determine if the citation has merit??? Since you have proven that you do not understand how reactors work, how will you determine if the citation has merit?
If an airplane crashes it does not cause hundreds of thousands of people to be removed from their homes and businesses. In any case, for only two faults the Boeing 300 airliner was grounded until they fix the problem. If that standard was applied to reactors all the reactors in the world would be shut.
You say “anyone who wants to make nuclear reactors cheaper must necessarily also make them less complex; good Gen IV designs are simpler than Gen III.” For myself, I would prefer that reactors were made safer and not cheaper. If your priority is profits for the nuclear industry that is your choice.
Nuclear is uneconomic. The total costs for a new wind or solar plant including the mortgage is less than the costs of operation and maintenance without a mortgage of a nuclear plant. Industry claims of greater inherent safety are not supported by data. You rely entirely on industry propaganda to support your argument.
- Water vapor is the most powerful greenhouse gas
MA Rodger at 20:06 PM on 14 June, 2019TVC15 @347,
The (Fig 10) graph is non-controversial & quite well travelled.
TVC15 @346,
Indeed!! Wien's displacement Law is a new one on me. And it is totally irrelevant. Your "very disengenious climate denier" is speaking through a wrong orifice and note he totally fails to quantify the "far more powerful" nature of H2O. He goes not further than effectively say 'See!! Lots of numbers!!!!'
The three primary absorption bands of CO2 do lie at 2.7, 4.3 & 15 microns. The 2.7 micron band features in the tail end of the solar radiation part of the spectrum while the 4.3 micron one sits between the incoming and outgoing part of the spectrum. Our friend ignores the compound absorption bands at 10 microns which is today quite insignificant but would begin to significantly add AGW above 3,000ppm.
Different bands can have a more powerful absorption than others. So the 4.3 micron CO2 band is stronger than the 15 micron one, but of course it requires radiation to operate and there is effectively no radiation at 4.3 microns.
The height of the GHG in the atmosphere is very relevant. If H2O were not "concentrated near the Earth, unlike CO2", its GHG effect would be far srtonger - the "very disengenious climate denier" gets this arse-about-face.
The "very disengenious climate denier" is however correct in saying that H2O provides a far greater amount of GHG-effect that CO2. Without CO2, if H2O levels were maintained somehow, the GHG-effect would be 80% or so of its present strength. But without the CO2, that 80% cannot be maintained as in a cooler atmosphere the H2O levels are lower, and lower and lower as it cools until effectively the GHG-effect disappears.
Thus it is plain. With no CO2, there is no GHG-effect on planet Earth. So saying "water vapor is the driver of climate, not CO2" is another arse-about-face assertion from your "very disengenious climate denier."
More than 100 comments found. Only the most recent 100 have been displayed.
More than 100 comments found. Only the most recent 100 have been displayed.


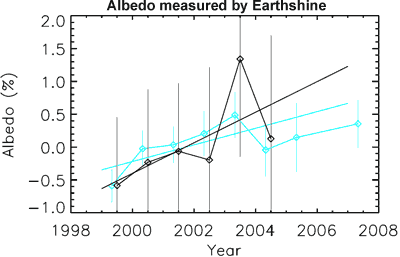
THE ESCALATOR

(free to republish)