


 Arguments


2017 SkS Weekly Climate Change & Global Warming Digest #31
Posted on 6 August 2017 by John Hartz
Story of the Week... Toon of the Week... Quote of the Week... Graphic of the Week... SkS Spotlights... Video of the Week... Coming Soon on SkS... Poster of the Week... Climate Feedback Reviews... SkS Week in Review... 97 Hours of Consensus...
Story of the Week...
More Hot Days Are Coming With Climate Change. Our Choices Will Decide How Many
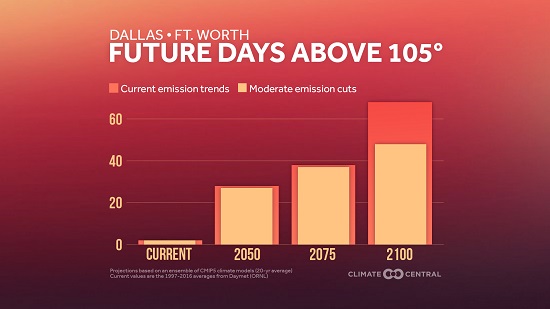
Summer still has a month to go, but extreme heat has been a major storyline through June and July. Sweltering temperatures have grounded planes, sparked wildfires and set records from coast-to-coast.
These stories are becoming annual rites of passage as the world warms. And the number of hot days is projected to increase in the coming decades.
Climate Central has developed a new web-interactive tool that brings the reality of future heat to hometowns across the U.S. Simply enter the name of your city, town or hamlet — or any place in the Lower 48 that piques your curiosity — to see how the number of days above summer temperature thresholds will change throughout the rest of the century. The interactive also shows how reducing greenhouse gas emissions can help reduce the heat.
More Hot Days Are Coming With Climate Change. Our Choices Will Decide How Many, Research Report by Climate Central, Aug 3, 2017
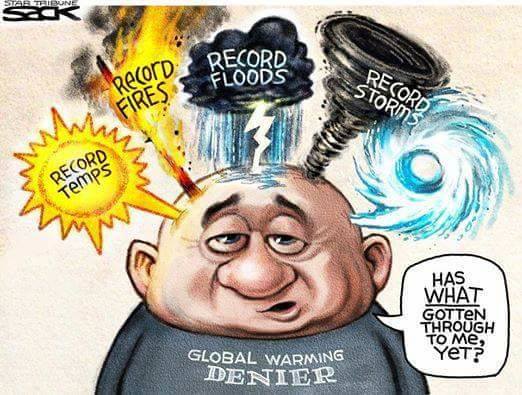
Toon of the Week...
Quote of the Week...
Europe's death toll from weather disasters could rise 50-fold by the end of this century, with extreme heat alone killing more than 150,000 people a year by 2100 if nothing is done to curb the effects of climate change, scientists said on Friday.
In a study in The Lancet Planetary Health journal, the scientists said their findings showed climate change placing a rapidly increasing burden on society, with two in three people in Europe likely to be affected if greenhouse gas emissions and extreme weather events are not controlled.
The predictions, based on an assumption of no reduction in greenhouse gas emissions and no improvement in policies to reduce the impact of extreme climatic events, show European weather-related deaths rising from 3,000 a year between 1981 and 2010 to 152,000 a year between 2071 and 2100.
"Climate change is one of the biggest global threats to human health of the 21st century, and its peril to society will be increasingly connected to weather-driven hazards," said Giovanni Forzieri of the European Commission Joint Research Centre in Italy, who co-led the study.
He said that "unless global warming is curbed as a matter of urgency", some 350 million Europeans could be exposed to harmful climate extremes on an annual basis by the end of the century.
Extreme weather seen killing 152,000 Europeans a year by 2100 by Kate Kelland, Reuters, Aug 4, 2017
Graphic of the Week...
A History of Global Warming, In Just 35 Seconds
Last year, there was the temperature spiral. This year, it’s the temperature circle that’s making the trend of global warming crystal clear.
A new video shows the rhythm of global warming for countries around the world, from Afghanistan to Zimbabwe. Bars representing each country’s annual average temperature anomaly pulse up and down. It's like watching a heartbeat on a monitor.
SkS Spotlights...
The Health and Environment Alliance (HEAL) is a leading European not-for-profit organisation addressing how the environment affects health in the European Union (EU). We demonstrate how policy changes can help protect health and enhance people’s quality of life.
With the support of more than 75 member organisations, HEAL brings independent expertise and evidence from the health community to different decision-making processes. Our broad alliance represents health professionals, not-for-profit health insurers, doctors, nurses, cancer and asthma groups, citizens, women’s groups, youth groups, environmental NGOs, scientists and public health institutes Members include international and Europe-wide organisations as well as national and local groups in 25 countries both within EU member states and the wider European region, as defined by the World Health Organisation (WHO).
HEAL is independent of any political party or commercial interest. The alliance receives funding from the European Union, governments and private foundations as well as through membership contributions. We do not accept funding from sources with commercial interests.
Beginning in 2003 as the environmental ‘wing’ of the European Public Health Alliance (EPHA), HEAL was created to bring the health voice to the centre of a wide spectrum of EU environmental policies, and to integrate environmental concerns in public health decisions.
Learn more about what we do.
Video of the Week...
Science Isn't Really a Method—It's Your Brain Celebrating Danger and Uncertainty
Science Isn't Really a Method—It's Your Brain Celebrating Danger and Uncertainty by Beau Lotto, Big Think/You Tube, Aug 5, 2017
Coming Soon on SkS...
- Problems for oil (Riduna)
- Why the 97% climate consensus is important (Dana, John Cook, Sander van der Linden, Ed Maibach, Tony Lieserowitz)
- ClimateChats: Climate Pictures (Adam Levy)
- Guest Post (John Abraham)
- SkS Resources - Easy to remember Short URLs (Baerbel)
- 2017 SkS Weekly Climate Change & Global Warming News Roundup #32 (John Hartz)
- 2017 SkS Weekly Climate Change & Global Waming Digest #32 (John Hartz)
Poster of the Week...
Climate Feedback Reviews...
Climate Feedback asked its network of scientists to review the 0p-ed, Climate Change Isn’t the End of the World by David Henderson & John Cochrane, Wall Street Journal, July 30, 2017
Five scientists analyzed the article and estimated its overall scientific credibility to be ‘low’ to 'very low'.
A majority of reviewers tagged the article as: Biased, Misleading.
Review Summary
This Wall Street Journal commentary by David Henderson and John Cochrane argues that the world would be better off adapting to climate change than eliminating the greenhouse gas emissions that cause warming. Scientists who reviewed this article found that it does so by ignoring most climate impacts apart from estimates of Gross Domestic Product change, by using only the most optimistic estimates of this economic loss, and by focusing on adaptation possibilities in high-income nations like the United States.
Climate change could have a much larger economic impact, along with impacts on the spread of human disease, food security, extreme weather, and marine ecosystems, for example.
Wall Street Journal op-ed on economic consequences of climate change found naive by scientists, Climate Feedback, Aug 2, 2017
SkS Week in Review...
- 2017 SkS Weekly Climate Change & Global Warming News Roundup #31 by John Hartz
- Study finds human influence in the Amazon's third 1-in-100 year drought since 2005 by John Abraham (Climate Consensus - the 97%, Guardian)
- Explainer: California’s new ‘cap-and-trade’ scheme to cut emissions by Zeke Hausfather (Carbon Brief)
- Underground magma triggered Earth’s worst mass extinction with greenhouse gases by Howard Lee
- 2017 is so far the second-hottest year on record thanks to global warming by Dana Nuccitelli (Climate Consensus - the 97%, Guardian)
- 2017 SkS Weekly Climate Change & Global Warming Digest #30 by John Hartz
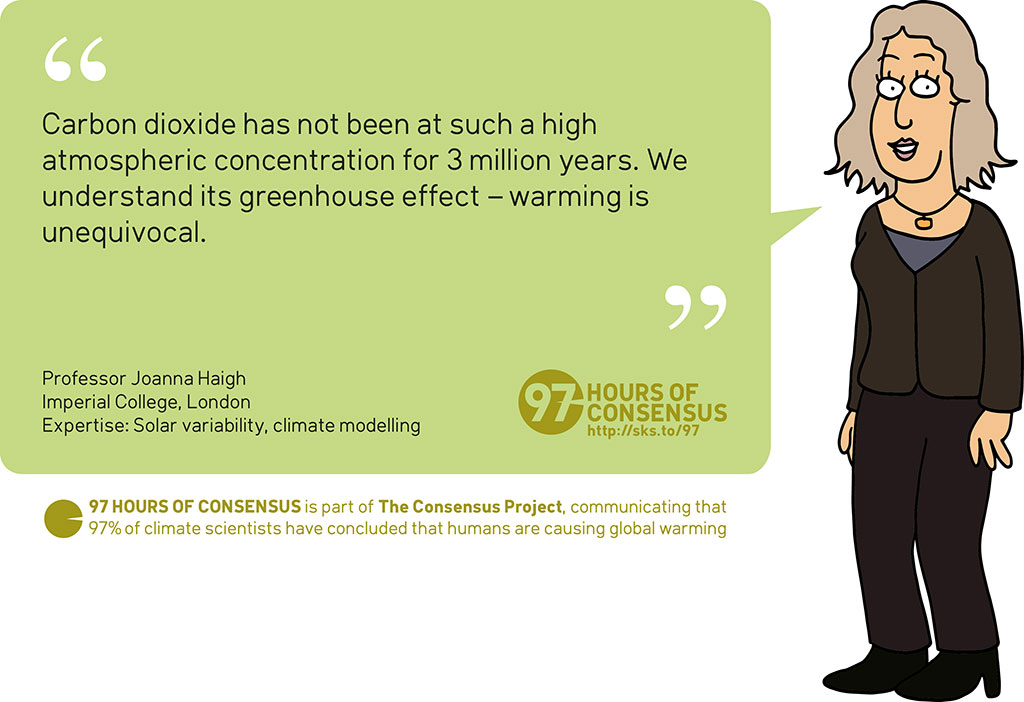
97 Hours of Consensus...

Quote derived with author's permission from:
"Carbon dioxide has probably not been this high in the atmosphere for 3 million years. We understand the greenhouse effect, so what more information do people want?"


The story of the week predicts 25 days of heat over 105f by the year 2025.
Is the author of the story unaware that DFW had 28 days over 105 in 1980,. DFW also had 17 days over 105 in 2011. In summary, the author is predicting that is will take 40+ years for dfw to experience what the DFW metroplex experienced in 1980.
en.wikipedia.org/wiki/1980_United_States_heat_wave
www.timeanddate.com/weather/usa/dallas/historic
Tom13,
Yes, the author is claiming that in 2050 the average year will have as many days over 105F as the record year with the most days that hot in the past. Some years will be higher and some wil be lower (for a little while). You are comparing a record year (one that stands out as very high in the record) to the average year in the projection. The current average looks to me to be about 3 days per year. The hot years you mention will be a substantial fraction of those days. When the average number increases that much it will seriously affect plants and animals.
In summary: there is a difference between an average and a record.
Michael - you make a good point regarding averages. Reviewing the averages and trends should create some doubt into the validity of the study. So far in 2017, DFW has only had a four days over 100, (100.0, 100.0, 100.9 & 104.0) Converting F to Celsius, is 5/9, 5degrees f = 2.7778c. The current warming trend is in the range of 1.5c (ish) per century. So in order to go from an average 2-3 days per year over 105 to 28 or so per year per the study, the rate of warming over the next 33 years would need to be approx 150% of the current rate of warming over a century. While the study's conclusion of 28 days a year in DFW over 105 is possible, it doesnt seem plausible, when you compare the trends or the averages.
In summary a quick cross check of the math, the trends and the averages doesnt support the conclusion of the study.
FWIW, the average July temp in DFW (Dallas) has increased approx 2.0F from 1900 to 2017, while the average aug temp since 1900 through 2017 has remained remarkably flat.
My apologies for losing the link on the DFW average temps, It should be weather.gov. (again my apologies for misplacing the link)
Tom13,
According to the original link of the widget at Climate Central, temperatures are expected to rise about 5.9 F worldwide by 2100 for BAU. Since it warms less over the ocean than the land and less in the tropics than in the temperate zone, we might expect the rise to be significantly greater at DFW than the global average. This is a much faster rate of increase than you used. The distribution of higher temperatures is not always directly proportional to the increase in temperatures because the higher temperatures encourage drought which also increases temperatures.
Because Dallas is an important city you could Google the expected temperature increases online. According to a widget (from Climate Central) in this newspaper article, Dallas should expect a 10F increase by 2100. This was the first hit in my Google search.
Summary: seat of the pants calculations posted on line are not as accurate as studies by experienced scientists at Climate Central.
Tom @3, you cannot really take about 9 months of data from one city and develop conclusions. The city may have had non typical weather that year, and one city would not necessarily be typical of the entire country anyway.
You would need several years of data from a random sample of a dozen cities, then compute an average of everything. Then see how that compares with the theory.
The last IPCC found heatwaves have already increased globally on average, with high certainty. They also predict this will increase further as a general trend, but not at the same rate in every city.
10f = 5.55c over 83 years - I presume you noticed that rate of warming is approx 3x the current rate of warming.
5.9f = 3.278c over 83 years - that rate is approx 2.2x the current rate of warming.
Are either of those projected rates of warming even close to a reasonable estimate.
Nigel - I used data from Dallas starting in 1899 through june 2017. Further - I used Dallas because this article highlighted Dallas and it was a good example. In summary, in order to achieve the projected number of days over 105 by the year 2050, the rate of warming would need to increase by approx 200%.
New Zeland's Natonal Institute of Water & Atmospheric Research (NIWA) just releaesed the results of an analysis similar to that conducted by Climate Central as described in the OP's Story of the Week.
From the NWIS news release...
Wellington will get significantly warmer, new climate change report shows, NWIS News Release, Aug 7, 2017
Tom13,
Since CO2 pollution has dramatically increased over the past few decades why would anyone expect the rate of warming to stay the same as it was when pollution rates were much lower?
"Are either of those projected rates of warming even close to a reasonable estimate."
The rate of warming is expected to increase in the future, especially if nothing is done to reduce emissions. According to the IPCC AR5 Summary for Policy Makers the expected global warming by 2100 is 4C (page 11) for RPC 8.5 (note the high end of the projection is 5.5C). You are making an argument from incredulity because you have not read the background information. Just because you do not know what the projections are does not mean that they are not reasonable. I note that you have not cited a single link to support your argument. I have provided links to support my claims.
If you want to post calculations to a scientific blog like SkS it is your responsibility to read the background material. It is not my responsibiity to spoon feed you material that everyone knows. Arguments from incredulity are not convincing. Reading the SPM linked above would be a good start.
The projections of future warming are shocking!! Imagine living in Dallas when the temperature is 10F warmer! It was only about 2F warmer in 2011. Farmers sold off most of their herds and millions of trees died. Children born today will be alive in 2100. Action needs to be taken immediately to prevent this catastrophe.
Tom13,
This is not the exact graph I referenced above but section (a) has the same information (source IPCC AR5):
Tom13 @8, yes true the article used the example of Dallas to make its point on possible future trends, just so it had some real world examples to talk about. However you miss my point. As was pointed in response to your first post, you can't take one year of 1980 and draw conclusions, as the weather that year could be very non typical, then you go and do the exact same thing and pick this year, which appears to have unusually few record setting days. So your starting point was deceptive. These things need wider data over several years to try to find the average or typical pattern for the year. Thats all I'm saying.
Regarding future temperature projections I can only completely agree with comments by M Sweet. You cannot just project the recent temperature trend forward. You have to look at IPCC predictions and how that may work out for Dallas. Therefore their expectations of 28 record setting days is not unrealistic.
In some ways the original article is frustrating by focussing in on specific cities because we cannot be so absolutely 100% certain about specific cities. I think the pertinent thing is global average temperatures are increasing, and will increase further, and are expected to accelerate. This will not have precisely uniform affects and its hard to be certain about specific locations due to regional climate factors. But its highly likely Dallas will at least see a lot more very hot days by end of century, whatever the exact number is.
NigelJ — Tom13 does have a point which wasn't clearly expressed: Dallas managed to survive a record or year or two with many days over 105 previously, so the new average doesn't mean the city suddenly becomes uninhabitable. For a Northerner who expects to be outside mid-day during the summer, it's uninhabitable right now!
What I think he missed is that the record years in the 2040s will be even hotter. Outdoor work will have to be scheduled with a mid-day break, or clumsy cooling methods, roofs will have to be white or grass-covered, etc etc. But the city won't shut down - people averse to heat avoid it already, whoever lives there is OK with blazing sun and common 100F summer days.
More significant may be when farmland reaches a temp that causes existing crops to slow their growth and for evaporation to create severe wet/dry cycles. We're not ready to change the whole grain belt over to whatever heat-resistant crops exist, those probably won't be what people and animals want/need to eat.
Driving By @13, well ok he had a point, but nobody claimed more hot days would make Dallas 'uninhabitable'. So big strawman!
But I agree with your other comments, more record days will add to air conditioning costs, etc. I would add it could lead to more heat related deaths in the elderly and frail.Of course this is Dallas, and so its not massively severe, but the same trend will be much more damaging in places like India and Africa.
And its about economics. These things all add up to extra costs, and add to other impacts of climate change like sea level rise and your disruption to existing farming patterns. Adapatation to climate change will have a big price, from what I have read, and its money that could be better spent elsewhere on alleviating poverty etc or science research.
Something for the next roundup?
Government Report Finds Drastic Impact of Climate Change on U.S.
www.nytimes.com/2017/08/07/climate/climate-change-drastic-warming-trump.html
WASHINGTON — The average temperature in the United States has risen rapidly and drastically since 1980, and recent decades have been the warmest of the past 1,500 years, according to a sweeping federal climate change report awaiting approval by the Trump administration.
The draft report by scientists from 13 federal agencies, which has not yet been made public, concludes that Americans are feeling the effects of climate change right now. It directly contradicts claims by President Trump and members of his cabinet who say that the human contribution to climate change is uncertain and that the ability to predict the effects is limited.
---
One government scientist who worked on the report, and who spoke to The Times on the condition of anonymity, said he and others were concerned that it would be suppressed.
---
The Environmental Protection Agency is one of 13 agencies that must approve the report by Sunday. The agency’s administrator, Scott Pruitt, has said he does not believe that carbon dioxide is a primary contributor to global warming.
“It’s a fraught situation,” said Michael Oppenheimer, a professor of geoscience and international affairs at Princeton University who was not involved in the study. “This is the first case in which an analysis of climate change of this scope has come up in the Trump administration, and scientists will be watching very carefully to see how they handle it.”
[JH] I posted a link to the article on the SkS Facebook page yesterday. It, and other follow-up articles about the draft report, will be included in the next Weekly News Roundup. Thank you for your suggestion.
#11 Michael - you post the graph from rcp 8.5 in support of the defense of a rate of warming 2x (or more ) than the current rate of warming.
Isnt rcp 4.5 far more reasonable and likely projection. Rcp 8.5 is the ICcp high end assumption which has its share of problematic assumptions, population growth on the high end, increased use of coal, virtually no technological advances, etc, all of which are contrary to global trends.
Back to my original question
Are either of those projected rates of warming even close to a reasonable estimate."
Try to answer without resorting to the most unlikey iccp projection
[DB] Inflammatory tone snipped.
Tom13,
All the IPCC projections are completely reasonable. The recently released US climate assessment (draft) says that scientists (that is the IPCC) are more likely to underestimate warming than to overestimate it. Trump is trying to get other countries to use more oil. That cannot help reduce CO2 emissions. CO2 concentrations are currently a little higher than the 8.5 scenario. The 4.5 scenario is looking like a best case analysis.
To answer your question: A projected temperature that relies on an IPCC projection is by defination a reasonable estimate. In contrast, a posting on the internet usupported by any evidence is unreasonable.
You are denying the reality of the situation. You have provided no data to support your wild claims (as usual). It is sloganeering to repeat arguments without any supporting evidence.