Climate Science Glossary

Term Lookup

Enter a term in the search box to find its definition.

Settings

Use the controls in the far right panel to increase or decrease the number of terms automatically displayed (or to completely turn that feature off).

Term Lookup

Settings


All IPCC definitions taken from Climate Change 2007: The Physical Science Basis. Working Group I Contribution to the Fourth Assessment Report of the Intergovernmental Panel on Climate Change, Annex I, Glossary, pp. 941-954. Cambridge University Press.

Home Arguments Software Resources Comments The Consensus Project Translations About Support

Bluesky Facebook LinkedIn Mastodon MeWe

Twitter YouTube RSS Posts RSS Comments Email Subscribe


Climate's changed before
It's the sun
It's not bad
There is no consensus
It's cooling
Models are unreliable
Temp record is unreliable
Animals and plants can adapt
It hasn't warmed since 1998
Antarctica is gaining ice
View All Arguments...


Username
Password
New? Register here
Forgot your password?

Latest Posts

Archives

How reliable are climate models?

What the science says...

Select a level... Basic Intermediate

Models successfully reproduce temperatures since 1900 globally, by land, in the air and the ocean.

Climate Myth...

Models are unreliable

"[Models] are full of fudge factors that are fitted to the existing climate, so the models more or less agree with the observed data. But there is no reason to believe that the same fudge factors would give the right behaviour in a world with different chemistry, for example in a world with increased CO2 in the atmosphere."  (Freeman Dyson)

At a glance

So, what are computer models? Computer modelling is the simulation and study of complex physical systems using mathematics and computer science. Models can be used to explore the effects of changes to any or all of the system components. Such techniques have a wide range of applications. For example, engineering makes a lot of use of computer models, from aircraft design to dam construction and everything in between. Many aspects of our modern lives depend, one way and another, on computer modelling. If you don't trust computer models but like flying, you might want to think about that.

Computer models can be as simple or as complicated as required. It depends on what part of a system you're looking at and its complexity. A simple model might consist of a few equations on a spreadsheet. Complex models, on the other hand, can run to millions of lines of code. Designing them involves intensive collaboration between multiple specialist scientists, mathematicians and top-end coders working as a team.

Modelling of the planet's climate system dates back to the late 1960s. Climate modelling involves incorporating all the equations that describe the interactions between all the components of our climate system. Climate modelling is especially maths-heavy, requiring phenomenal computer power to run vast numbers of equations at the same time.

Climate models are designed to estimate trends rather than events. For example, a fairly simple climate model can readily tell you it will be colder in winter. However, it can’t tell you what the temperature will be on a specific day – that’s weather forecasting. Weather forecast-models rarely extend to even a fortnight ahead. Big difference. Climate trends deal with things such as temperature or sea-level changes, over multiple decades. Trends are important because they eliminate or 'smooth out' single events that may be extreme but uncommon. In other words, trends tell you which way the system's heading.

All climate models must be tested to find out if they work before they are deployed. That can be done by using the past. We know what happened back then either because we made observations or since evidence is preserved in the geological record. If a model can correctly simulate trends from a starting point somewhere in the past through to the present day, it has passed that test. We can therefore expect it to simulate what might happen in the future. And that's exactly what has happened. From early on, climate models predicted future global warming. Multiple lines of hard physical evidence now confirm the prediction was correct.

Finally, all models, weather or climate, have uncertainties associated with them. This doesn't mean scientists don't know anything - far from it. If you work in science, uncertainty is an everyday word and is to be expected. Sources of uncertainty can be identified, isolated and worked upon. As a consequence, a model's performance improves. In this way, science is a self-correcting process over time. This is quite different from climate science denial, whose practitioners speak confidently and with certainty about something they do not work on day in and day out. They don't need to fully understand the topic, since spreading confusion and doubt is their task.

Climate models are not perfect. Nothing is. But they are phenomenally useful.

Please use this form to provide feedback about this new "At a glance" section. Read a more technical version below or dig deeper via the tabs above!


Further details

Climate models are mathematical representations of the interactions between the atmosphere, oceans, land surface, ice – and the sun. This is clearly a very complex task, so models are built to estimate trends rather than events. For example, a climate model can tell you it will be cold in winter, but it can’t tell you what the temperature will be on a specific day – that’s weather forecasting. Climate trends are weather, averaged out over time - usually 30 years. Trends are important because they eliminate - or "smooth out" - single events that may be extreme, but quite rare.

Climate models have to be tested to find out if they work. We can’t wait for 30 years to see if a model is any good or not; models are tested against the past, against what we know happened. If a model can correctly predict trends from a starting point somewhere in the past, we could expect it to predict with reasonable certainty what might happen in the future.

So all models are first tested in a process called Hindcasting. The models used to predict future global warming can accurately map past climate changes. If they get the past right, there is no reason to think their predictions would be wrong. Testing models against the existing instrumental record suggested CO2 must cause global warming, because the models could not simulate what had already happened unless the extra CO2 was added to the model. All other known forcings are adequate in explaining temperature variations prior to the rise in temperature over the last thirty years, while none of them are capable of explaining the rise in the past thirty years.  CO2 does explain that rise, and explains it completely without any need for additional, as yet unknown forcings.

Where models have been running for sufficient time, they have also been shown to make accurate predictions. For example, the eruption of Mt. Pinatubo allowed modellers to test the accuracy of models by feeding in the data about the eruption. The models successfully predicted the climatic response after the eruption. Models also correctly predicted other effects subsequently confirmed by observation, including greater warming in the Arctic and over land, greater warming at night, and stratospheric cooling.

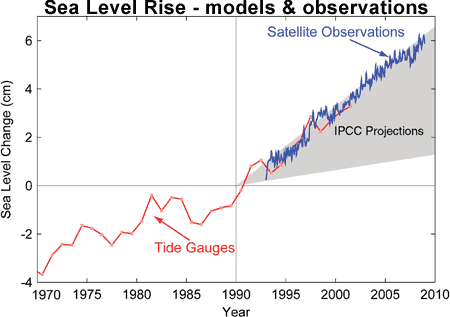
The climate models, far from being melodramatic, may be conservative in the predictions they produce. Sea level rise is a good example (fig. 1).

Fig. 1: Observed sea level rise since 1970 from tide gauge data (red) and satellite measurements (blue) compared to model projections for 1990-2010 from the IPCC Third Assessment Report (grey band).  (Source: The Copenhagen Diagnosis, 2009)

Here, the models have understated the problem. In reality, observed sea level is tracking at the upper range of the model projections. There are other examples of models being too conservative, rather than alarmist as some portray them. All models have limits - uncertainties - for they are modelling complex systems. However, all models improve over time, and with increasing sources of real-world information such as satellites, the output of climate models can be constantly refined to increase their power and usefulness.

Climate models have already predicted many of the phenomena for which we now have empirical evidence. A 2019 study led by Zeke Hausfather (Hausfather et al. 2019) evaluated 17 global surface temperature projections from climate models in studies published between 1970 and 2007.  The authors found "14 out of the 17 model projections indistinguishable from what actually occurred."

Talking of empirical evidence, you may be surprised to know that huge fossil fuels corporation Exxon's own scientists knew all about climate change, all along. A recent study of their own modelling (Supran et al. 2023 - open access) found it to be just as skillful as that developed within academia (fig. 2). We had a blog-post about this important study around the time of its publication. However, the way the corporate world's PR machine subsequently handled this information left a great deal to be desired, to put it mildly. The paper's damning final paragraph is worthy of part-quotation:

"Here, it has enabled us to conclude with precision that, decades ago, ExxonMobil understood as much about climate change as did academic and government scientists. Our analysis shows that, in private and academic circles since the late 1970s and early 1980s, ExxonMobil scientists:

(i) accurately projected and skillfully modelled global warming due to fossil fuel burning;

(ii) correctly dismissed the possibility of a coming ice age;

(iii) accurately predicted when human-caused global warming would first be detected;

(iv) reasonably estimated how much CO2 would lead to dangerous warming.

Yet, whereas academic and government scientists worked to communicate what they knew to the public, ExxonMobil worked to deny it."
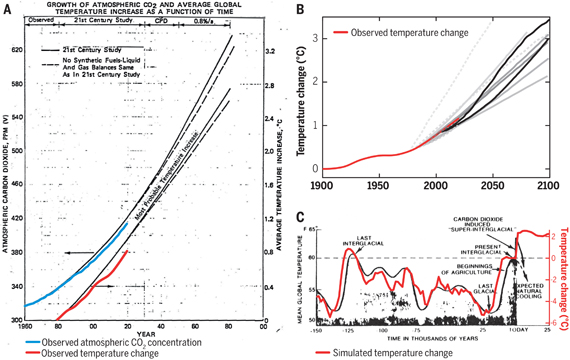

Exxon climate graphics from Supran et al 2023

Fig. 2: Historically observed temperature change (red) and atmospheric carbon dioxide concentration (blue) over time, compared against global warming projections reported by ExxonMobil scientists. (A) “Proprietary” 1982 Exxon-modeled projections. (B) Summary of projections in seven internal company memos and five peer-reviewed publications between 1977 and 2003 (gray lines). (C) A 1977 internally reported graph of the global warming “effect of CO2 on an interglacial scale.” (A) and (B) display averaged historical temperature observations, whereas the historical temperature record in (C) is a smoothed Earth system model simulation of the last 150,000 years. From Supran et al. 2023.

 Updated 30th May 2024 to include Supran et al extract.

Various global temperature projections by mainstream climate scientists and models, and by climate contrarians, compared to observations by NASA GISS. Created by Dana Nuccitelli.

Last updated on 30 May 2024 by John Mason. View Archives

Printable Version  |  Offline PDF Version  |  Link to this page

Argument Feedback

Please use this form to let us know about suggested updates to this rebuttal.

Further reading

Carbon Brief on Models

In January 2018, CarbonBrief published a series about climate models which includes the following articles:

Q&A: How do climate models work?
This indepth article explains in detail how scientists use computers to understand our changing climate.

Timeline: The history of climate modelling
Scroll through 50 key moments in the development of climate models over the last almost 100 years.

In-depth: Scientists discuss how to improve climate models
Carbon Brief asked a range of climate scientists what they think the main priorities are for improving climate models over the coming decade.

Guest post: Why clouds hold the key to better climate models
The never-ending and continuous changing nature of clouds has given rise to beautiful poetry, hours of cloud-spotting fun and decades of challenges to climate modellers as Prof Ellie Highwood explains in this article.

Explainer: What climate models tell us about future rainfall
Much of the public discussion around climate change has focused on how much the Earth will warm over the coming century. But climate change is not limited just to temperature; how precipitation – both rain and snow – changes will also have an impact on the global population.

Update

On 21 January 2012, 'the skeptic argument' was revised to correct for some small formatting errors.

Denial101x videos

Here are related lecture-videos from Denial101x - Making Sense of Climate Science Denial

Additional video from the MOOC

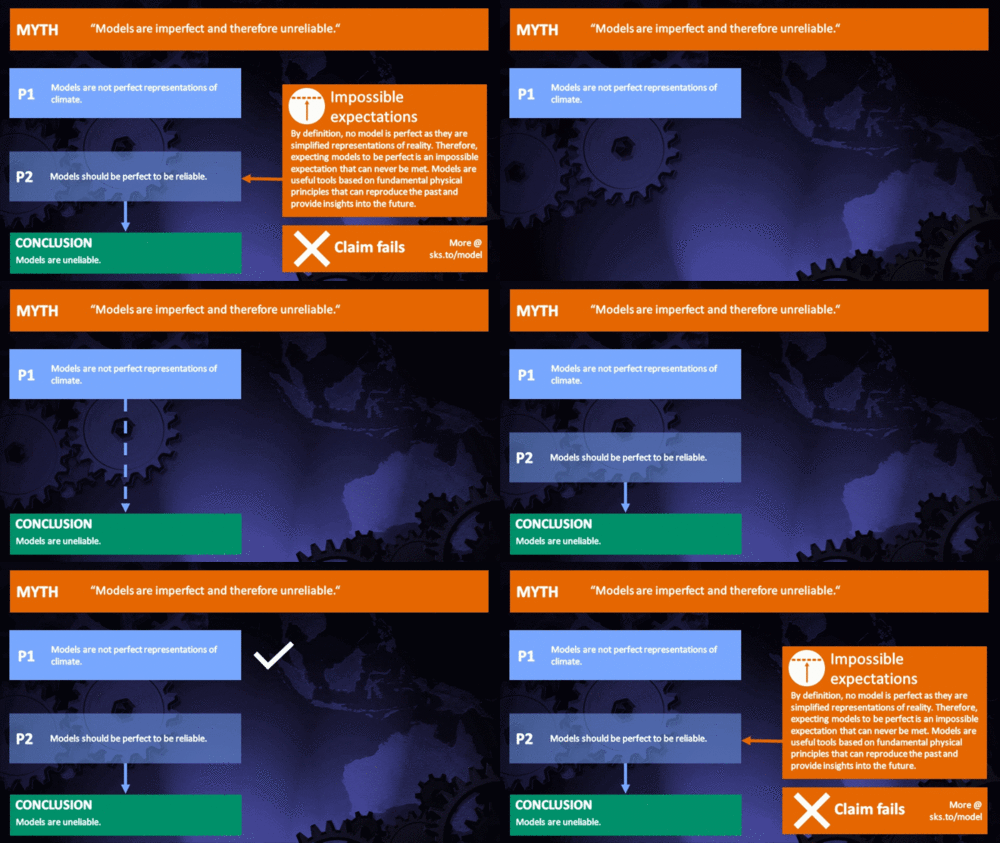
Dana Nuccitelli: Principles that models are built on.

Myth Deconstruction

Related resource: Myth Deconstruction as animated GIF

MD Model

Please check the related blog post for background information about this graphics resource.

Fact brief

Click the thumbnail for the concise fact brief version created in collaboration with Gigafact:

fact brief

Comments

Prev  9  10  11  12  13  14  15  16  17  18  19  20  21  22  23  24  25  26  27  28  Next

Comments 451 to 475 out of 1331:

  1. If I were James Wilson, I would rant on about this paper being a religious paper and the authors not being able to refrain from political argument. I would then say how it got published because of a sympathetic reviewer and that it will certainly be torn apart in subsequent analyses etc etc... Yet I'm sure that, somehow, it will make Poptech's list. Isn't it nice to have flexible standards?
  2. Any ideas where the satellite data shown in the main picture comes from? It doesn't seem to match any data that I'm aware of.
    Response:

    [DB] "Any ideas where the satellite data shown in the main picture comes from?"

    Did you read the linked source?

  3. I noticed that the link to Tamino's graphic in the "further reading" box is broken.
    Response: [DB] Fixed link.
  4. mace @452, the satellite observations in the picture are for sea levels, not temperatures.
  5. mace Please avoid starting up a new discussion without first properly disengaging from another. You made an ill-informed comment here, which several contributors (including myself) took the time to address. It is rather rude to pose questions and the ignore the answers, so please go back to that thread and either acknowledge that you were mistaken or explain why the answers provided are not sufficient. Why should anybody bother respond to your posts if you appear to be ignoring those responses?
  6. The past 40ish years appears to have a fairly straight 0.016C/yr trend. There seems to be little indication of increased warming. Even when exogenous factors are removed, the signal doesn't seem to show any acceleration. Given that we're expected to hit +2C well before 2087 under BAU conditions: A) Why is it taking so long for the positive feedbacks to reveal themselves in the temperature record. B) How long will it be before the rate of change is 0.020 or 0.025C/yr? Ca) If emissions continue at ~BAU and short-term CS is >2.5C (which would result in a visible increase in warming), doesn't it follow that there is a very high chance that the next decade will contain one or more years that are dramatically hotter than '98/05/10? Cb) Isn't that really ****ing bad?
  7. Tristan As this thread is about the models being unreliable, do the models suggest that this acceleration should be visible over a 40 year timespan, above the noise we should expect to see in the observations due to sources of internal unforced variability such as ENSO? If so, then please give a reference to a paper or model output demonstrating this is the case. If not, then the reason we have not seen the clear accelleration is because of (i) the physics of climate suggest we shouldn't have seen it yet and/or (ii) there is so much noise in the observations it may be there but is obscured by the noise so we can't reliably/unequivocally detect it.
  8. Tristan -"There seems to be little indication of increased warming" Nonsense. Over 90% of global warming is going into the oceans. Did you miss Dana's recent blog post? Check out the last 40-ish years: I guess a blog post and graphic(s?) is necessary to clear up this confusion because a lot of the fake-skeptics don't seem to grasp this.
  9. DM F&R2011 removed a lot of that noise to reveal a fairly constant 0.16/decade trend. The 4AR predicts that 2011-30 will be +0.64-0.69C vs 1980-99. We won't get there at the current warming rate. Therefore either the warming rate must increase or the projections were too high. Which is it, do we know? RP I meant "There seems to be little indication of increased atmospheric warming."
  10. Tristan, I find it impossible to believe that the 4AR would make such a narrow projection. Can you provide a cite to the page where this projection was made? If you cannot provide a cite, please withdraw the question. The uncertainty in aerosol pollution alone is enough to account for the difference you note.
  11. I'd advise a little caution in making such strong statements, Michael. WG1 Ch10.ES Mean Temperature There is close agreement of globally averaged SAT multi-model mean warming for the early 21st century for concentrations derived from the three non-mitigated IPCC Special Report on Emission Scenarios (SRES: B1, A1B and A2) scenarios (including only anthropogenic forcing) run by the AOGCMs (warming averaged for 2011 to 2030 compared to 1980 to 1999 is between +0.64°C and +0.69°C, with a range of only 0.05°C). Thus, this warming rate is affected little by different scenario assumptions or different model sensitivities, and is consistent with that observed for the past few decades.
  12. Tristan, Thank you for the cite. Since it says "and is consistent with that observed for the past few decades." and the recent Foster and Rahmstorf (2011) paper claims the rate of warming is unchanging, what is left to explain?
  13. what is left to explain? The gap between 0.16 and 0.20.
  14. Tristan#461: Here is a map of GISS temperature anomaly for the year 2011, using 1980-1999 as a base period: --source You should note the average anomaly of 0.26C shown in the upper right corner. Using FR2011's linear trend of 0.18C per decade, by 2030 (two decades hence), we could easily see an anomaly (relative to 1980-99) in excess of 0.6C.
  15. Muon A) The average of the 5 records is .163C/decade, not 0.18C. B) 2030 may be +0.6C compared to 80-99. However, the 4AR states warming averaged for 2011 to 2030 compared to 1980 to 1999 is between +0.64°C and +0.69°C. If the anomaly is currently +0.26 and it reaches +0.6 by 2030, the average will be a lot less than +0.64.
  16. Tristan#465: You're forecasting using the average rate rather than the current rate? Based on this average of all five adjusted data sets, the warming trend has not slowed significantly in recent years (0.163°C per decade from 1979 through 2010, 0.155°C per decade from 1998 through 2010, and 0.187°C per decade from 2000 through 2010). Either way, what's your point? The thread here is model reliability, not model infallibility. Does pointing out a supposed flaw in an IPCC document somehow nullify AGW?
  17. (-Snip-) Do I need to state that I don't dispute any of the mechanics of climate change before people here actually read my posts properly? The AR4 is doing the forecasting. Not me. Based on the current rate of warming given by F&R2011 atmospheric temperatures will not reach the 2011-30 mean projected by the AR4. Either the warming must increase or the prediction must fall. My completely unscientific guess is that both of these will be the case. I presume that someone with a lot more knowledge than me can give me more information about this disparity. We are not on track for a mean 2011-30 anomaly of +0.64C versus 1980-99 without a very visible acceleration in warming.
    Response:

    [DB] Improper ideological categorizations snipped.

  18. Tristan, it looks like you used the multi-model mean forecast for global temperatures as if it were an exact prediction. Model ensembles don't work that way. If the multi-model mean was projected to be 0.64-0.69, what was the spread of the individual models around that? Some will be lower, some will be higher. How does the current rising trend in global temperature (on the assumption it remains at its recent trend) interact with the ensemble spread? Before you claim incorrectness, you need to know this.
  19. Tristan I understand the discrepancy you highlight. Are you able to sift through the relevant segments of the IPCC and report back? I find it takes too damn long reading through IPCC reports to find the nugget one is after. So I'm not volunteering.
  20. Tristan wrote "F&R2011 removed a lot of that noise to reveal a fairly constant 0.16/decade trend." You are missing the point. A model that had a slight upward (or indeed downward) curvature would fit the observations almost as well (e.g. in terms of the log likelihood) as the "best estimate" given in F&R2011. That is because there is enough signal in the noise to get a reasonable estimate of the basic trend, but not enough to get a reliable indication of any curvature. "The 4AR predicts that 2011-30 will be +0.64-0.69C vs 1980-99." page reference please. "We won't get there at the current warming rate. Therefore either the warming rate must increase or the projections were too high. Which is it, do we know?" That is impossible to answer without knowing *exactly* what was claimed in AR4.
  21. Tristan Sorry, I see you did give the quote. However, the quote gives the range of model ensemble means under different scenarios. However this doesn't mean that we would expect the observations to lie within that range, but instead would be within the spread of the multi-model ensemble, which would be very much broader. By saying that the multi-model mean is consistent with current observations, they would mean that they lie within the spread of the ensemble (which they undoubteldy do).
  22. Tristan#459: "The AR4 is doing the forecasting. Not me. " Wasn't this you in #465?: "We won't get there at the current warming rate." Sounds like a forecast to me. Again, so what? Especially now that we see you're talking about the average of models, not any specific model.
  23. The section in AR4 that Tristan seems to feel is a problem is here.
  24. Thanks for the responses. If it turns out that the 2011-2030 temperatures are markedly lower than the ensemble mean predicted, this suggests a systemic error in the way temperature was being forecasted in '07. I will be interested to see how the AR5's predictions compare to AR4's. Undoubtedly another 5 years of science and temperatures would have shed even more light on the nature of the climate's response to emissions.
  25. Tristan#474: 'Ensemble mean' is not a prediction; a difference between actual and mean does not imply systemic error.

Prev  9  10  11  12  13  14  15  16  17  18  19  20  21  22  23  24  25  26  27  28  Next

Post a Comment

Political, off-topic or ad hominem comments will be deleted. Comments Policy...

You need to be logged in to post a comment. Login via the left margin or if you're new, register here.

Link to this page


The Consensus Project Website

THE ESCALATOR

(free to republish)


© Copyright 2024 John Cook
Home | Translations | About Us | Privacy | Contact Us