Climate Science Glossary

Term Lookup

Enter a term in the search box to find its definition.

Settings

Use the controls in the far right panel to increase or decrease the number of terms automatically displayed (or to completely turn that feature off).

Term Lookup

Settings


All IPCC definitions taken from Climate Change 2007: The Physical Science Basis. Working Group I Contribution to the Fourth Assessment Report of the Intergovernmental Panel on Climate Change, Annex I, Glossary, pp. 941-954. Cambridge University Press.

Home Arguments Software Resources Comments The Consensus Project Translations About Support

Bluesky Facebook LinkedIn Mastodon MeWe

Twitter YouTube RSS Posts RSS Comments Email Subscribe


Climate's changed before
It's the sun
It's not bad
There is no consensus
It's cooling
Models are unreliable
Temp record is unreliable
Animals and plants can adapt
It hasn't warmed since 1998
Antarctica is gaining ice
View All Arguments...


Username
Password
New? Register here
Forgot your password?

Latest Posts

Archives

The Pacific Decadal Oscillation (PDO) is not causing global warming

What the science says...

Select a level... Basic Intermediate Advanced

The PDO shows no trend, and therefore the PDO is not responsible for the trend of global warming.

Climate Myth...

It's Pacific Decadal Oscillation

"The Pacific Decadal Oscillation (PDO) is a temperature pattern in the Pacific Ocean that spends roughly 20-30 years in the cool phase or the warm phase. In 1905, PDO switched to a warm phase. In 1946, PDO switched to a cool phase. In 1977, PDO switched to a warm phase. In 1998, PDO showed a few cool years. Note that the cool phases seem to coincide with the periods of cooling (1946-1977) and the warm phases seem to coincide with periods of warming (1905-1946, 1977-1998)." (The Reference Frame)

At a glance

Oscillate. To move repeatedly from side to side or up and down between two points, or to vary between two states or amounts. To vary above and below a mean value. To move or travel back and forth between two points. To swing backward and forward like a pendulum.

These and similar definitions are to be found if you look up the meaning of 'oscillate' online. Yet global warming is wobbling its way up a one-way course. We've just witnessed the hottest year since temperature records began (2023). Every few years that record goes again. Conclusion: global warming is not an oscillation.

The Pacific Decadal Oscillation or PDO is one of a number of phenomena that affect the world's major oceanic basins. It is a good example of heat being moved around within the ocean and atmosphere. Like all climatic oscillations it has warm, neutral and cool modes and these may endure for years or decades. Oscillations like this do not correspond to a timetable, but are irregular in nature.

The PDO is directly driven by conditions in the northern Pacific but has considerable reach in its effects. Prevailing winds and atmospheric pressure-patterns over that ocean dictate the mode. When winds are predominantly from the southwest, warmer conditions occur along the western USA seaboard. That is due to the onshore transport of warm, subtropical waters. Conversely, when winds are mainly from the north, upwelling of cool and nutrient-rich waters occurs in the open ocean, with cooler conditions prevailing.

Notable long, warm modes of the PDO include 1925-1946 and 1977-1998. 1947-1976 was a lengthy cool phase. More recently, the flip-flopping has been of a much shorter duration with cold and warm phases lasting just a few years. The reason for this switch is incompletely understood.

Like the El Nino Southern Oscillation or ENSO, which flips around over annual timescales, the PDO affects weather patterns, particularly in Asia and North America. It also has considerable impacts on fisheries and if there was one good reason to understand the PDO, it's right there. However, despite the loose coincidence with global temperatures in the early and mid-20th Century, that apparent relationship is no more. For example, a negative PDO mode commenced at the end of 2019 and was still ongoing in mid-2023, the latter having been the warmest year globally since records began.

Like all oscillations, there is no net gain or loss of heat involved in the PDO. It is merely a pattern involving how the heat in the system is being moved around within it. Global warming is different because it involves impeding the loss of heat, originally reaching the planet as sunshine, back out to space. That makes it a climate forcing agent. Big difference.

Oscillate. It's all in the name.

Please use this form to provide feedback about this new "At a glance" section. Read a more technical version below or dig deeper via the tabs above!


Further details

The Pacific Decadal Oscillation (PDO) is a climate phenomenon that occurs primarily in the North Pacific Ocean. It has wide ranging effects on weather patterns, especially over North America and Asia. Like other ocean-basin oscillations, it has a warm mode, expressed as positive values in the PDO index, and a cool mode, with negative values. These modes last anywhere from a few years to multiple decades and feature changes in sea surface temperatures.

While the causes of the PDO are still poorly understood, the primary effects seem to be changes in northeast Pacific marine ecosystems and therefore fisheries. Also they affect the position of the jet stream's path, that may in turn impact agriculture.

During the PDO positive mode, winters in the southern and eastern US states tend to have above average temperatures and higher rainfall. In the western and north-western states, the opposite is the case. Asian winters tend to be cooler and dryer, although above normal temperatures and higher rainfall tend to occur over India.

In the negative PDO mode, warmer and drier winters occur through much of the contiguous USA, with cool conditions confined to the north-west, although parts of the central USA may see notably wet conditions. Over in Asia, India and China see relatively cool and wet winters, whilst Japan has both the warmth and the rainfall. Clearly, a key impact of the PDO is on agriculture, hence its extensive study and the substantial scientific literature surrounding it.

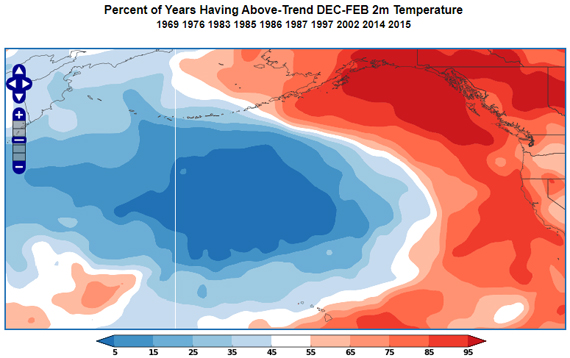
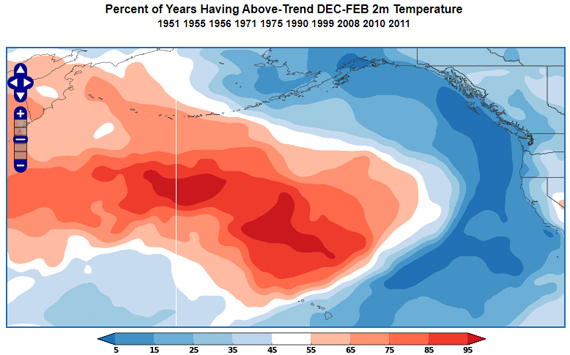
It is important to note, however, that the PDO modes are not set in stone. Frequently, especially in recent years, short sets of 1-5 warm years have occurred during a cool phase and vice-versa. In addition, the warm and cool modes are less descriptive than they would appear. The cool mode, for instance, is in fact associated with high sea surface temperatures in the Northern Pacific (Fig. 1). Another important point is that the hottest year in the global temperature record, 2023, has occurred within a negative PDO mode.

Example of the PDO warm mode.Example of the PDO cool mode.

Figure 1: Examples of the PDO warm mode (above) and cool mode (below). During the positive PDO mode, sea surface temperature anomalies over the North Pacific Ocean form a vast cool area north of Hawaii. At the same time, warmer than normal waters are present near the North American coast. During negative PDO conditions, warm waters are found north of Hawaii and cooler than normal waters are encountered near the North American coast. Images courtesy of World Climate Service.

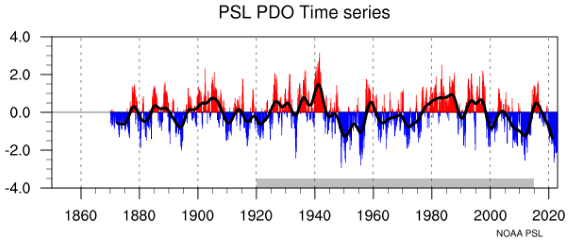
Because the PDO is an oscillation, it does not present a clear trend. If you compare the Global Temperature Anomaly alongside the PDO Index (fig. 2), you will see that although the PDO index appears to influence short-term temperature changes, global temperatures have had a distinct upward trend, especially since the late 1970s.
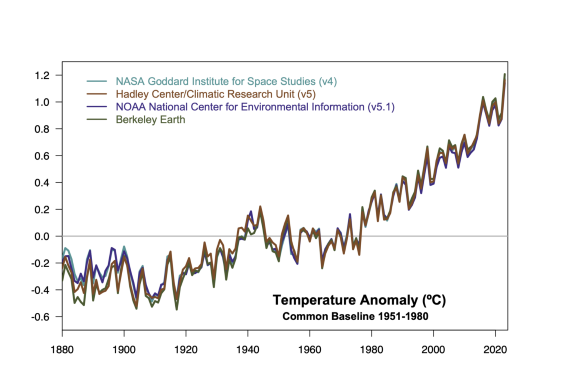
 Global temperature anomaly 1850-2023.

PDO time series.

Figure 2: Top-panel: global temperature anomaly 1850-2023. Graphic: Realclimate. Bottom-panel: Pacific Decadal Oscillation index, 1870-2023. Smoothed data (thicker black line) included. Graphic: NOAA.

Natural oscillations like the PDO simply move heat around from oceans to air and vice-versa. They don't have the ability to either add or remove heat to or from the overall system. Therefore, they're not capable of causing a long-term warming trend like that of the last 50+ years. Instead they are another example of a process causing short- to medium-term temperature variations. Basically they're good examples of internal climate variability. If the PDO was responsible for warming the surface, the oceans would be cooling, which is not the case.

The long term warming trend on Earth is due to increasing greenhouse gas levels. These constitute an external radiative forcing, creating an energy imbalance. In contrast, the PDO is an internal process and does not increase or decrease the total energy in the climate system. Essentially, like other such oscillations, it cancels itself out. The fact that its name defines it as an oscillation should communicate that fact.

Last updated on 31 March 2024 by John Mason. View Archives

Printable Version  |  Offline PDF Version  |  Link to this page

Argument Feedback

Please use this form to let us know about suggested updates to this rebuttal.

Acknowledgements

Many thanks to John Cross who co-authored this post. Thanks also to Josh Willis for his advice on this topic.

Comments

Prev  1  2  3  4  5  Next

Comments 26 to 50 out of 106:

  1. I find it interesting that WDWK after challenging me to analyse data before drawing conclusions then went silent when it transpired that I had already done so. The indication from my data analysis is that ENSO is a redistributor of heat, and is not a driver of global warming. WDWK's observation of increasing oscillation of longer term cycles (#13) is nicely consistent with this paper from Nature on Early-warning signals for critical transitions. The results from my regression analysis suggest that the most likely causal agent for this increase is CO2, as it overtook solar variability as the most important driver of temperature anomaly some time in the mid-20th century.
  2. #26: "observation of increasing oscillation of longer term cycles is nicely consistent" Except that wdwk pins his story on Landscheidt's solar cycles (see #25). In this scheme, its the sun and only the sun. Note that in these 'papers', the references are mainly to other papers by the same author; isn't that an odd feature for scientific research? "results from my regression analysis suggest that the most likely causal agent for this increase is CO2" Excellent -- did you post this?
  3. muoncounter #27 My analysis is pretty crude, and does not confirm to climate science conventions. However if you're interested you can see it starting here.
  4. kdkd #26. I haven't looked at your analyses yet; I simply haven't had the time yet. I will look at it when I can asap, and I really thank you for providing this and also the bottom line that CO2 overtook solar variability some time in the mid-20th century is interesting. The nature reference is very appropriate. I've been thinking of applying economical/stock market data analysis to the global temp, PDO and ENSO data. Such as momentum, RSI, or stochastic indicators like MACD; as all those are used to determine which way stocks are moving to make trading decisions. For example, Momentum (M) measures the acceleration rate of a stock's price. This positive or negative value is then plotted around a zero line; where positive indicates (future) increasing prices and negative values (future) decreasing prices. In this case it can simply be applied to the rise and fall of global temp. M = V - Vx ; V is the latest price, and Vx is the closing price x number of days ago. When applied to global temp V is current monthly temp, Vx is say last month's temp. This could maybe give a could idea about the last This then should be read together with the relative strength indicator (RSI determines the true value of an oscillator: RSI = 100 - (100/(1 + RS)), where RS = Average of x days’ up closes Average of x days’ down closes; which in global temp terms means average of x month's of increasing temps and average of x month's increasing temps) Applying such indicators to the last decade, for example, should give valuable insight on which direction global temperatures are and will be moving in the near future. This in turn is given the current debate that global surface temps since 1998 or 2007 haven't risen while CO2 levels have a great tool. ps: there is nothing wrong with crude analyses. Those are excellent for pattern-recognition and then further in-depth analyses. muoncounter #26: many authors refer to them self in their own papers. The nr of self-references is not an indication on the validity of the data-analyses presented. One of the reasons often is that the author is one of very few within that particular area of research. Just judge the paper on content, quality, argument and validity; not on references.
  5. The temperature since 1860 seems to follow a 1/2 ° C per century ramp and 60 year sine wave pattern. Yes the PDO cannot cause warming but a long slow increase due to recovery from the LIA or Maunder minimum and a positive long feedback time can. It might even be because of CO2 but it is so slow that there is no catastrophe. The tops and bottoms of the sine wave causes some climate scientists to arrive at incorrect conclusions like global cooling [Newsweek 1975]. And Catastrophic Global Warming [CAGW] circa 1998. Here is a chart which shows how the temperature of the earth has varied since the beginning of records. It consists of a ½ ° C per century ramp and a sine wave with a 60 year period. The ramp is because of recovery from the Little Ice Age [or some other cause but it started before mankind emitted significant CO2] and the sine wave is caused by ocean currents. [ADO and PDO] http://wattsupwiththat.files.wordpress.com/2010/04/orssengo3.png Here is a peer reviewed study by a different author which comes to the same conclusion. http://people.iarc.uaf.edu/~sakasofu/pdf/two_natural_components_recent_climate_change.pdf There is a chart on P7 which explains a lot of “mysteries” of the temperature record much better than a CO2 based explanation does. When the sine wave went up in 1970 to 1998 the climate scientists went ballistic. They projected that to mean 3 ° C warming by 2100. When the sine wave started sideways or down in about 2000 they were shown to be wrong. To me this explains the temperature cycle far better than the "CO2 and Aerosol" theory..
    Response: Newsweek is not a scientific journal, and the article in question was not written by a scientist. There is no recovery from the Little Ice Age; see the post "We’re coming out of the Little Ice Age." This is your last warning about posting off-topic comments.
  6. You keep insisting that there was an 70s ice age scare and that the globe has been cooling since 1998. Both of these contentions are wrong and are addressed in other areas of this site which are linked to from the top of the left column. There is no 60 year temperature cycle. Try getting your scientific knowledge from scientific sources rather than popular media like Newsweek.
  7. Re: netdr (30) Akasofu commits many an error (multiple violations of the top 10 in the upper corner of this page). Trenberth has demolished Akasofu's credibility in the past, as shown here. You grasp at straws, as Bibliovermis details above, and as Stephen Leahy alludes to in his comment here. The Yooper
  8. #30: "ramp is because of recovery from the Little Ice Age" Even positing that's true for just a sec, what would cause such a thing? "the sine wave is caused by ocean currents. [ADO and PDO]" Which you just said, cannot cause warming. What's nice about AGW as a scientific theory, other than that it's real, is that it explains observed phenomena. Which is important in science. Otherwise, you're just making stuff up.
    Response: Everybody comment on recovery from the Liitle Ice Age on that thread, not this one.
  9. These subjects blend from one subject to another. How can a conversation with many elements possibly take place ? I came over to the PDO thread but the recovery from the LIA is part of the story. Carrying on a conversation with both elements is impossible and frustrating. #33 The warming may even be due to CO2 who cares ? The overall warming is about 1/2 ° C when the periodic cooling is taken into account. When the maunder minimum was over we started to measure temperature. Thinking all warming was caused by mankind seems contrary to fact. Positive feedback if it exists would multiply solar effects by 3 or more, but it might take time for them to build up. Notice the sunspots increased slowly until the late 2000's, it is an integration not an instantaneous phenomenon. http://sidc.oma.be/html/wolfaml.html
  10. It is almost impossible to post coherent arguments on skepticalscience.com because all arguments slide between threads and part of every response is O T. The so called skeptical arguments are straw-men which don't cover my reasons for not believing in catastrophe at all. Consequently my posts are O T wherever I post them Ocean currents can not cause overall arming but they can cause short term [20 - 30 year like the 78 – 98 ] warming which fools the scientist into thinking there is a bigger trend than there is. Solar variation did not cause the 78 – 98 warming but it can cause the 1880 to 2010 trend when long term positive feedback is factored in. Some treat positive feedback as if it only operates on CO2 caused warming but no scientist really believes that. By breaking the two arguments apart they are both O T on two different threads. Is this divide and conquer time ?
    Response: If you would bother to read the Climate Time Lag post to which you were pointed, you would learn why your contention about solar contribution is wrong.
  11. @NETDR: "Is this divide and conquer time ?" Just stick to making rational arguments that are on-topic and you won't have any problems. For isntance, there is no evidence AFAIK that the PDO and the LIA are directly related, therefore trying to link the two in some sort of "grand unified denier theory" is off-topic. The truth is that contrarians are forced to resort to the logical fallcy known as "changing the subject," because they do not have arguments that withstand scrutiny, and therefore are forced to flee to another topic whenever they are confronted with the weakness of their position. My personal suggestion to you is that, if you don't like the moderation on this site, then just stop commenting. Maybe then we'll be able to have more constructive discussion, such as what we should actually do to mitigate the very real effects of AGW.
  12. #35: "...impossible to post coherent arguments" There's an obvious response to that, but in the spirit of the season, I'll let it slide. I will suggest that you would gain a morsel of credibility if you stopped using the word 'catastrophe' every few sentences. But here's an example of how to stay on topic: Responding to your comment on solar variation here. Please follow the link. asteel: "grand unified denier theory" -- I love it!
  13. Mouncounter The article said : "Until about 1960, measurements by scientists showed that the brightness and warmth of the sun, as seen from the Earth, was increasing. Over the same period temperature measurements of the air and sea showed that the Earth was gradually warming. It was not surprising therefore for most scientists to put two and two together and assume that it was the warming sun that was increasing the temperature of our planet." And they might be right. The problem is confusing the fast warming from 1978 with the long slow warming from 1880 to 2010. Both have happened and proving a single cause can't have caused both is part of the divide and conquer strategy. The long slow overall warming since the end of the Maunder minimum is in my opinion caused by increasing solar activity and positive feedback which can take centuries. It is a long integration and rapid change like that between 1978 and 1998 is not what it does. The rapid [1.2 ° C per century ] warming between 1978 and 1998 is certainly not because of solar increase. [nor CO2 IMHO] The ADO and PDO and a huge El Nino were conveniently positive during this period and in my opinion caused most of the warming . The climate is complicated and proving that neither solar increase or ocean currents could have caused everything is not a reason to exclude them as part of the answer. I am unsure exactly which argument is the "Climate Time Lag" one. Please re-post the link. Archi said supposedly quoting me: "For isntance [sic], there is no evidence AFAIK [???] that the PDO and the LIA are directly related, therefore trying to link the two in some sort of "grand unified denier theory" is off-topic. If that is what you really think I said you are simply wrong or are trying to distort my position so badly that I can't recognize it.
    Response: It's past time for you to learn to use the Search field at the top left.
  14. #38: " ... confusing the fast warming from 1978 with the long slow warming from 1880 to 2010." Yeah, that's confusing all right. Fast warming sure looks different from slow warming. "nor CO2 IMHO" So we'll go with your opinion, then. Works for me. "The climate is complicated ... " So maybe we need some actual facts and maybe even one of those easily confused scientists to sort things out? " ...is not a reason to exclude them as part of the answer." But its absolutely necessary to exclude anthropogenic CO2 as part of the answer. Yeah, that makes sense.
  15. @NETDR: "If that is what you really think I said you are simply wrong or are trying to distort my position so badly that I can't recognize it." Well, you're the one bringing up the LIA in the PDO thread, not me... As I said, it's a typical tactic for contrarians to jump from one topic to the next when they get caught in their own contradictions. (Oh, and BTW, AFAIK means "as far as I know"...)
  16. Moderator I have asked politely I am unsure exactly which argument is the "Climate Time Lag" one. Please re-post the link. I was told to use the search field. I did this before asking BTW. Here are the results None look promising! Search Results Skeptic arguments matching the search 'Climate Time Lag': * CO2 lags temperature * Hockey stick is broken * It's cosmic rays * Naomi Oreskes' study on consensus was flawed * Satellite error inflated Great Lakes temperatures * Warming causes CO2 rise * Water levels correlate with sunspots Plus about 50 blog posts !
  17. muoncounter #38 Actually I think CO2 is not the cause of the long slow warming from 1880 to 2010 but what if it is ? The rate is so slow that there is no catastrophe is there? There is periodic fast warming and cooling superimposed on this long term trend. http://jisao.washington.edu/pdo/ In 1997 after 20 years of positive PDO the Koyoto Protocol 1997 was signed http://unfccc.int/kyoto_protocol/items/2830.php After the PDO had been negative for almost 40 years Newsweek published the famous article on Global Cooling. [1975] Newsweek Article on global cooling http://denisdutton.com/cooling_world.htm Is this just a coincidence ?
  18. #39 Why does NASA's Global Land-Ocean Temperature Index differ so much from satellite Weekly Global SST anomaly plots and UAH Global Average Tropospheric Temperature plots? Specifically, compare 2008 data points. The NASA plot shows (+.42) but both weekly SST anomaly and lower tropospheric measurements were near or below zero in 2008. We could be headed back down to 2008 levels or lower, considering the switch from El Nino to La Nina, and current -PDO, -NAO, although the SST website says La Nina seems to be bottoming out. The 2010 El Nino was similar to 1998 and contributed to the higher global average in the first half of 2010, just like in 1998. I tried to provide web links but had trouble getting them to show up properly in the preview. The SST data are from bobtisdale.blogspot.com, Roy Spencer provides the lower tropospheric data, UAH.
  19. Re #43: Please read this. And also note the trend in global SATs associated with previous moderate to strong La Nina events (ONI <-1.0. Global SAT anomalies from GISTEMP are for the latter year for each event relative to 1951-1980 baseline: 1949-1950: -0.16 C 1954-1955: -0.10 C 1955-1956: -0.17 C 1964-1965: -0.11 C 1970-1971: -0.10 C 1973-1974: -0.08 C 1975-1976: -0.16 C 1984-1985: +0.04 C 1988-1989: +0.19 C 1998-1999: +0.32 C 1999-2000: +0.33 C 2007-2008: +0.44 C 2010-2011" +0.50 C (?)
  20. Re: #43 Thanks for the link, I like the title "Open Mind," with the Douglas Adams subtitle. Don't really care for the name-calling but I guess it comes with the territory. The GISS baseline of 1951-1980 is during mostly negative PDO, while the UAH 1980-2000 is during mostly positive PDO. The UAH baseline is warmer than GISS which explains some of the differences. Comparing the 12-month running means using the same 1980-2000 baseline, there doesn't appear to be any significant warming since the 1998 El Nino. But the GISS plot in post #39 seems to show an upward trend continuing through 2008. I think that the GISS plot is misleading, which is unfortunate. Please allow me to review the material more and get back to you. I'm concerned about the integrity of the surface observing sites that GISS et al. uses, possible contamination from urbanization. The satellite data represents better ground-truth, I think. Whenever raw observations are altered (corrected), the data no longer represents ground-truth but are best described an an analysis.
  21. #44 I've had a chance to review the link. I would like to quote from the "Open Mind" link and then comment: "The biggest difference between the satellite-minus-surface data and PC#2 is that PC#2 shows an additional downward trend. This is mainly because one of the satellite data sets (UAH) shows an overall trend which is decidedly less than that of the other data sets." I went to the NASA GISS website and found a link to Hansen et al. (2001). Hansen mentions several adjustment to the surface observations, i.e., corrections for time-of-observation bias, station history adjustments, and reclassification of rural, small-town, and urban stations. The surface record in its present form is indeed an analysis and not ground-truth. I prefer to continue relying on the satellite measurements, especially the UAH data becuase the lower trend suggests better representation of the surface record. The higher trend in the surface observation analysis suggests that the history/landuse adjustments did not remove contamination from urbanization.
    Response: Wrong thread for your comment. Search for "unreliable."
  22. thepoodlebites - The quality of the surface temperature records (and for that matter, UAH versus other records) is well discussed on the Are surface temperature records reliable thread.
  23. thepoodlebites - You might also find some interesting info on It's Urban Heat Island effect and Temp record is unreliable, or the blog posting Urban Heat Islands: serious problem or holiday destination for skeptics?
  24. Moderator Thank you for the information regarding questionable integrity of the surface temperature records. I hope we agree that the plot presented in post #39 is misleading. Climate is complicated and the PDO is only one piece of the ever-changing puzzle. Maybe the global trend will continue to rise after this pause, maybe it will go down. Based on the evidence, I don't think that we know for sure either way but pre-cursor indicators suggest that we may be headed into another period of cooling similar to the 60's and 70's. When I took advanced meteorology classes in 1981 the consensus was that we may be entering into another ice-age. We learned about "instantaneous glaciation" and the possibility of a near global ice-over within 1,000 years. That was my experience, that was what I was taught. Can you blame me for being skeptical about CO2 induced climate disruption? Yes, I'm skeptical but I'm not a denier. I visited the Holocaust Museum in Washington, DC. To label a skeptical scientist a denier is insulting. Stick to the scientific method, stay objective, don't give in to personal bias, that leads to the dark side.
    Response: [Daniel Bailey] Please furnish us with your rationale for your subjective assessment of the graph in post 39. Use the search function in the upper left corner of this page to find posts discussing planetary cooling and imminent ice ages memes. Lastly, there exists a considerable difference between being skeptical (which necessarily must include being skeptical of contrarian claims) and being a "skeptic". Approaches which seek to use the most possible data to develop an explanation that best explains as much as possible which then survive peer-review are the ones that develop over time into a consensus. Please avoid assigning other bias' like 'dark side' to things. Politics and agendas cause one to quickly run afoul of the Comments Policy. Thanks for your understanding.
  25. Moderator #45 and #46 explains my position, comparing the GISS plot in #39 to the UAH plot on Roy Spencer's website, the GISS plot shows an annual mean value for 2005 (0.61 C) that's higher than the 1998 El Nino year. The UAH plot shows an annual anomaly of 0.3 C for 2005, 0.54 C for 1998. The descrepancy may be in the addition of the surface record to the GISS data, which I can not comment about in this thread. I'll keep referring to the UAH plot if that's OK? If there's any significant warming in the future, it will show up in the satellite data, correct? As far as peer-review in climate science, that's probably off-topic too and best left unsaid here.

Prev  1  2  3  4  5  Next

Post a Comment

Political, off-topic or ad hominem comments will be deleted. Comments Policy...

You need to be logged in to post a comment. Login via the left margin or if you're new, register here.

Link to this page


The Consensus Project Website

THE ESCALATOR

(free to republish)


© Copyright 2024 John Cook
Home | Translations | About Us | Privacy | Contact Us