Climate Science Glossary

Term Lookup

Enter a term in the search box to find its definition.

Settings

Use the controls in the far right panel to increase or decrease the number of terms automatically displayed (or to completely turn that feature off).

Term Lookup

Settings


All IPCC definitions taken from Climate Change 2007: The Physical Science Basis. Working Group I Contribution to the Fourth Assessment Report of the Intergovernmental Panel on Climate Change, Annex I, Glossary, pp. 941-954. Cambridge University Press.

Home Arguments Software Resources Comments The Consensus Project Translations About Support

Bluesky Facebook LinkedIn Mastodon MeWe

Twitter YouTube RSS Posts RSS Comments Email Subscribe


Climate's changed before
It's the sun
It's not bad
There is no consensus
It's cooling
Models are unreliable
Temp record is unreliable
Animals and plants can adapt
It hasn't warmed since 1998
Antarctica is gaining ice
View All Arguments...


Username
Password
New? Register here
Forgot your password?

Latest Posts

Archives

Do volcanoes emit more CO2 than humans?

What the science says...

Select a level... Basic Intermediate

Humans emit 100 times more CO2 than volcanoes.

Climate Myth...

Volcanoes emit more CO2 than humans

"Human additions of CO2 to the atmosphere must be taken into perspective.

Over the past 250 years, humans have added just one part of CO2 in 10,000 to the atmosphere. One volcanic cough can do this in a day." (Ian Plimer)

At a glance

The false claim that volcanoes emit more CO2 than humans keeps resurfacing every so often. This is despite debunkings from bodies like the United States Geological Survey (USGS). Such claims may be easy to make, but they fall apart once a little scientific scrutiny is applied. So, to settle this once and for all, let's venture out into the fascinating world of geology, plate tectonics and volcanism.

According to the USGS, there are 1,350 active volcanoes on Earth at the moment. An active volcano is one that can erupt, even if it's decades since it last did so. As of June 2023, 48 volcanoes were in continuous eruption, meaning activity occurs every few weeks. Out of those, around 20 will be erupting on any particular day. Several of those will have erupted by the time you have finished reading this.

People are familiar with a typical volcano, an elevated area with one or more craters or fissures from which lava periodically erupts. But there are also the submarine volcanoes such as those along the mid-oceanic ridges. These vast undersea mountain ranges are a key component of Earth's Plate Tectonics system. The basalts they continually erupt solidify into the oceanic crust making up the flooring of the deep oceans. Oceanic crust is constantly moving away from any mid-ocean ridge in the process known as 'sea-floor spreading'.

Oceanic crust is chemically reactive. It reacts with seawater, allowing the formation of huge quantities of minerals including those carrying carbon in the form of carbonate. But oceanic crust is geologically young. That is because it is also being consumed at subduction zones - the deep ocean 'trenches' where it is forced down into Earth's mantle.

When oceanic crust is forced down into the mantle at subduction zones, it heats up and begins to melt into magma. Carbonate minerals in that crust lose their carbon - it is literally cooked out of them. Magmas then transport the CO2 and other gases up through Earth's crust and if they reach the surface, volcanic eruptions occur and the CO2 and other gases leave the magma for the atmosphere.

So here you can see a long-term cycle in which carbon gets trapped in the sea-floor, subducted into the mantle, liberated into new magma and erupted again. It's a key part of Earth's Slow Carbon Cycle.

Volcanoes are also dangerous. That's why we have studied them for centuries. We have hundreds of years of observations of all sorts of eruptions, at Earth's surface and beneath the oceans. Those observations include millions of geochemical analyses of both lavas and gases.

Because of all of that data collected over so many years, we have a very good idea of the amount of CO2 released to the atmosphere by volcanic activity. According to the USGS, it is between 180 and 440 million tons a year.

In 2019, according to the IPCC's Sixth Assessment Report (2022), human CO2 emissions were:

44.25 thousand million tons.

That's at least a hundred times the amount emitted by volcanoes. Case dismissed.

Please use this form to provide feedback about this new "At a glance" section. Read a more technical version below or dig deeper via the tabs above!


Further details

Beneath the surface of the Earth, in the various rocks making up the crust and the mantle, is a huge quantity of carbon, far more than is present in the atmosphere or oceans. As well as fossil fuels (those still left in the ground) and limestones (made of calcium carbonate), there are many other compounds of carbon in combination with other chemical elements, making up a range of minerals. According to the respected mineralogy reference website mindat, there are 258 different valid carbonate minerals alone!

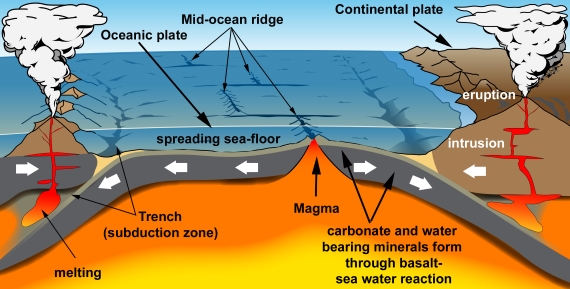
Some of this carbon is released in the form of carbon dioxide, through vents at volcanoes and hot springs. Volcanic emissions are an important part of the global Slow Carbon Cycle, involving the movement of carbon from rocks to the atmosphere and back on geological timescales. In this part of the Slow Carbon Cycle (fig. 1), carbonate minerals such as calcite form through the chemical reaction of sea water with the basalt making up oceanic crust. Almost all oceanic crust ends up getting subducted, whereupon it starts to melt deep in the heat of the mantle. Hydrous minerals lose their water which acts as a flux in the melting process. Carbonates get their carbon driven off by the heating. The result is copious amounts of volatile-rich magma.

Magma is buoyant relative to the dense rocks deep inside the Earth. It rises up into the crust and heads towards the surface. Some magma is trapped underground where it slowly cools and solidifies to form intrusions. Some magma reaches the surface to be erupted from volcanoes. Thus a significant amount of carbon is transferred from ocean water to ocean floor, then to the mantle, then to magma and finally to the atmosphere through volcanic degassing.

 Plate tectonics in cartoon form

Fig. 1: An endless cycle of carbon entrapment and release: plate tectonics in cartoon form. Graphic: jg.

Estimates of the amount of CO2 emitted by volcanic activity vary but are all in the low hundreds of millions of tons per annum. That's a fraction of human emissions (Fischer & Aiuppa 2020 and references therein; open access). There have been counter-claims that volcanoes, especially submarine volcanoes, produce vastly greater amounts of CO2 than these estimates. But they are not supported by any papers published by the scientists who study the subject. The USGS and other organisations have debunked such claims repeatedly, for example here and here. To continue to make the claims is tiresome.

The burning of fossil fuels and changes in land use results in the emission into the atmosphere of approximately 44.25 billion tonnes of carbon dioxide per year worldwide (2019 figures, taken from IPCC AR6, WG III Technical Summary 2022). Human emissions numbers are in the region of two orders of magnitude greater than estimated volcanic CO2 fluxes.

Our knowledge of volcanic CO2 discharges would have to be shown to be very mistaken before volcanic CO2 discharges could be considered anything but a bit player in the current picture. They have done nothing to contribute to the recent changes observed in the concentration of CO2 in the Earth's atmosphere. In the Slow Carbon cycle, volcanic outgassing is only part of the picture. There are also the ways in which CO2 is removed from the atmosphere and oceans. If fossil fuel burning was not happening, the Slow Carbon Cycle would be in balance. Instead we've chucked a great big wrench into its gears.

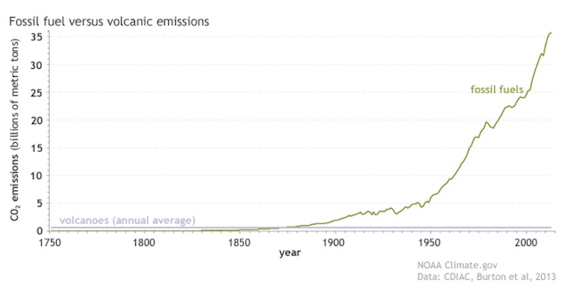
Some people like classic graphs, others prefer alternative ways of illustrating a point. Here's the graph (fig. 2):

Human emissions of CO2 from fossil fuels and cement

Fig. 2: Since the start of the Industrial Revolution, human emissions of carbon dioxide from fossil fuels and cement production (green line) have risen to more than 35 billion metric tons per year, while volcanoes (purple line) produce less than 1 billion metric tons annually. NOAA Climate.gov graph, based on data from the Carbon Dioxide Information Analysis Center (CDIAC) at the DOE's Oak Ridge National Laboratory and Burton et al. (2013).

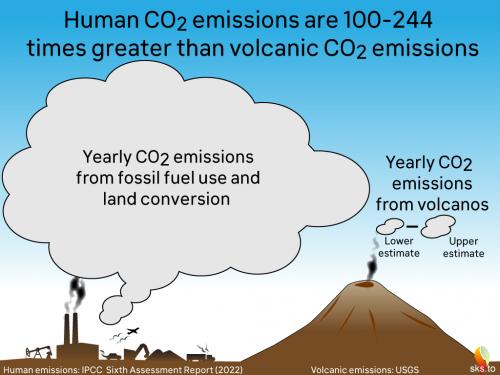
And here's a cartoon version (fig. 3):

 Human and volcanic CO2 emissions

Fig. 3: Another way of expressing the difference between current volcanic and human annual CO2 emissions (as of 2022). Graphic: jg.

Volcanoes can - and do - influence the global climate over time periods of a few years. This is occasionally achieved through the injection of sulfate aerosols into the high reaches of the atmosphere during the very large volcanic eruptions that occur sporadically each century. When such eruptions occur, such as the 1991 example of Mount Pinatubu, a short-lived cooling may be expected and did indeed happen. The aerosols are a cooling agent. So occasional volcanic climate forcing mostly has the opposite sign to global warming.

An exception to this general rule, however, was the cataclysmic January 2022 eruption of the undersea volcano Hunga Tonga–Hunga Ha'apai. The explosion, destroying most of an island, was caused by the sudden interaction of a magma chamber with a vast amount of seawater. It was detected worldwide and the eruption plume shot higher into the atmosphere than any other recorded. The chemistry of the plume was unusual in that water vapour was far more abundant than sulfate. Loading the regional stratosphere with around 150 million tons of water vapour, the eruption is considered to be a rare example of a volcano causing short-term warming, although the amount represents a small addition to the much greater warming caused by human emissions (e.g. Sellitto et al. 2022).

Over geological time, even more intense volcanism has occurred - sometimes on a vast scale compared to anything humans have ever witnessed. Such 'Large Igneous Province' eruptions have even been linked to mass-extinctions, such as that at the end of the Permian period 250 million years ago. So in the absence of humans and their fossil fuel burning, volcanic activity and its carbon emissions have certainly had a hand in driving climate fluctuations on Earth. At times such events have proved disastrous. It's just that today is not one such time. This time, it's mostly down to us.

Last updated on 10 September 2023 by John Mason. View Archives

Printable Version  |  Offline PDF Version  |  Link to this page

Argument Feedback

Please use this form to let us know about suggested updates to this rebuttal.

Related Arguments
Further reading

Tamino has posted two examinations of the "volcanoes emit more CO2 than humans" argument by looking at the impact of the 1991 Pinutabo eruption on CO2 levels and the impact of past super volcanoes on the CO2 record.

The Global Volcanism Program have a list of all "most noteworthy" volcanoes - with for example a Volcanic Explosivity Index (VEI) greater than 5 over the past 10,000 years.

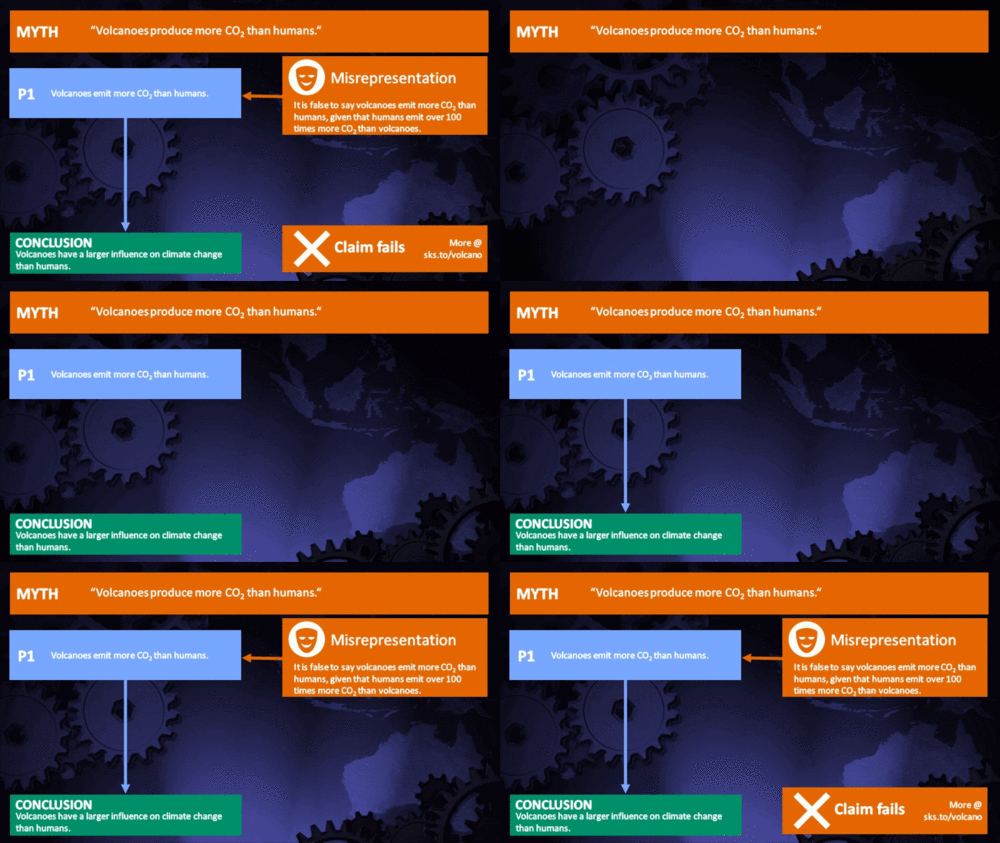
Myth Deconstruction

Related resource: Myth Deconstruction as animated GIF

MD Volcano

Please check the related blog post for background information about this graphics resource.

Denial101x video

Here is the relevant lecture-video from Denial101x - Making Sense of Climate Science Denial

Fact brief

Click the thumbnail for the concise fact brief version created in collaboration with Gigafact:

fact brief

Comments

Prev  1  2  3  4  5  6  7  8  9  10  11  12  Next

Comments 51 to 75 out of 283:

  1. Another way of putting 'it': That the 155 W/m2 LW 'forcing accounts for 33 K temperature difference is itself theoretical (not so much uncertain, but it is theoretical), and couldn't be observation evidence against a 0.3 K/(W/m2) no-feedback (or feedback included in 'forcing') sensitivity.
  2. "But the greatest heat transfer occurs in regular cycles at subduction zones and that is the interesting part. What besides tidal forces can cause these cyclic events?" But I've never seen anywhere any evidence or theorty to back up the first sentence there. The closest I've come to it was a website which seemed to be stating ENSO was caused by submarine geothermal activity, but it seemed to be (ill-informed) speculation - just guessing, really (and so I didn't bother to mention it until just now).
  3. CORRECTION: PARAGRAPH IN "Patrick 027 at 14:27 PM on 24 September, 2008": "Dissipation: heat - atoms have to move around in a phase transition; conceivably, even in a short period, some portion of the atoms near phase transitions in the mantle might be cycled through different arrangements (statistically - I wouldn't imagine the phase transition is knife-edge, or that on that timescale it could get near equilibrium (?), and there are the gradual phase transitions from or to garnet, so I wouldn't expect it's the same atoms each time around) - that might be a location where there is some relative concentration of tidal dissipation into heat energy. Not that it would be a significant source of heat. I would try comparing it to the radioactive heat generation in the mantle per unit volume if I had the time. " Some of the logic I used above should be correct, BUT not the part about phase transitions dissipating the forcing that drives them into heat - that was totally wrong. Atoms move around due to thermal energy - those that have enough energy (statistically some fraction will, depending on temperature) can reach some threshold and leave the energy well of their former position in the crystal lattice (or in other situations: overcome the kinetic barrier to chemical reaction or nuclear fusion, etc.) and then fall into another position - in this case, kinetic energy is converted into potential energy, and then back into kinetic energy. Lack of thermal energy simply reduces the number of atoms that are able to move around like that, and so reduces the speed at which a phase transition can occur. Of course, if the final energy well is shallower or deeper than the initial, then there will have been a net exchange between kinetic and potential energy, which tranlates to taking up or giving off latent heat. Since material properties are temperature and pressure dependent (which is of course why the thermodynamic stability of a phase is dependent on these things), there could be a net latent heating or cooling over a cycle if the phase transition in one direction and in the reverse are not occuring at the same T,p - which of course will happen if there is a time lag due to the kinetic barrier. However, the specific heat of the material will also vary, and I suspect the end result of all this is no net temperature change over time. Except in the case that there is a net change in the microstructure over the course of many cycles - crystal grains have to form and reform, and if the grain sizes over time shrink, then there will be an increasing number of atoms whose energy is not as it would be within the crystal lattice... (PS this might build up to a point of dynamic equilibrium, beyond which factors that tend to increase grain size over time (annealing?) would balance those tending to reduce grain size over time. But anyway, as interesting as it is to consider tidal cycling of phase transitions in the mantle, I expect this is a very, very, very minor effect in the scheme of things.
  4. "However, the specific heat of the material will also vary, and I suspect the end result of all this is no net temperature change over time." Well, now I'm not sure about that...
  5. ... I was thinking of the heat content of the material at a given temperature, and the the difference in heat capacity of two phases must be related to the latent heat of phase transformation - and it's dependence on temperature, by the requirement that whatever path is taken, taking one phase at T1,p1 and ending up at another phase at T2,p2, the same net change in heat content of the material must have occured. But that's an assigned temperature change. A cycle of out-of-equlibrium (time-delayed) phase transitions might concievably require a net mechanical energy input and so would produce heat... But see the last part of comment 53 (PS I had meant to identify that it was comment 46 which contained the paragraph I was correcting in comment 53).
  6. Because I mentioned the motion of charged particles in the Earth's magnetosphere ealier: (PS all the following (except stated formula) is just from visualization; so some uncertainty in some places) About motion (velocity v) of charged particles in magnetic field B, without other forces considered (if I'm not mistaken), where component of v parallel to B is vB, the component perpendicular to B is vp, all acceleration is is in direction of vector cross-product q(v x B) = q(vp x B), which is perpendicular to v, so that |v| is constant (q is electric charge (more generally, force F = q(E + v x B), where E is electric field (as a vector), and so acceleration is proportional to q/m, m being the mass); with E set to zero, let r be the radis of curvature of the trajectory projected onto the plane normal to B; so that |vp|^2/r = centrifugal acceleration = q/m * |vp x B| = q/m * |vp||B| r = (m/q) * |vp|^2 / (|vp||B|) r = (m/q) * |vp|/|B| 1. Constant field B: helix on a cylindrical surface (field lines parallel to surface), would would appear as a straight line on the surface if unrolled. |vB| and |vp| are constant. Radius of cylinder proportional to |vp|. 2. Change in magnitude of B in direction perpendicular to B (aside from 1., the easiest to visualize): The trajectory, or it's projection onto a plane normal to B, has tighter curvature in regions of higher B. This leads to a net displacement over the course of one revolution (to where v has the same direction). Their is thus a net drift in the direction that v has in the weaker B side of the field. Looking with B vectors directed toward you, positive charges revolve clockwise (turn to the right), and the net drift is directed with the stronger B field to the right. Negative charges: opposite. Smaller q/m ratio (as with proton compared to electron): larger radius of curvature, which itself means greater net displacement over each revolution, but also means greater variation in |B| over the range of each revolution, which means even greater net displacement over each revolution. 3. Variation in field strength along B - convergence or divergence of field lines (also means, over distance perpendicular to B, change in direction of B in the same dimension): helix on a conical surface (or something like that) - vB shrinks to zero and then reverses as larger B is approached, so the trajectory is 'repelled' by larger B values. This means |vp| must rise approaching larger B. In the other direction, as B shrinks, vp also approaches shrinks as v becomes more parallel to B. 4. Over distance perpendicular to B, change in direction of B, but in direction perpendicular to both B and to the direction along which the variation is detected: Suppose there is one field line, aligned with the z-axis, where x and y = 0, about which the particle is revolving in the same dimension. Case A: variation only in the x direction, all field lines parallel to y-z planes, where in the positive x axis, field lines have increasing slope dy/dz. In this case, when v is in the positive x direction, B is changing so that ... well, to make a long story short, I think the result is a helix on a cylinder, but the cylinder (whose axis is the z axis) is flattened in the x direction (?). Case B: braided (twisted) field lines. In this case, if one starts with vB in the positive z direction, then if the field lines curve around each other going in the postive z direction in the same direction as vp, then vp is less than otherwise, vB is more than otherwise, and the result is a helix on a cylinder (??) with a larger radius than otherwise for the same velocity in the x-y plane. If B is twisted in the opposite direction, the cylinder would have a smaller radius for the same velocity in the x-y plane. 5. Change in direction of B along B (curved field lines) This one is trickier to visualize... Locally one may consider approximately constant field strength and field line curvature; but when the radius of curvature is small enough or the range of positions large enough, constant curvature of field lines requires change in field strength along field lines, while constant field strenght requires increasing field line curvature toward a center of curvature, unless field direction is also changing as in case 4. above. --- There are someone conically shaped regions above each polar region; With B directed from the south pole to the north pole, if one visualizes the Earth with north pole pointing up, then within the ~ conic regions, B is downward, while outside the ~ conic regions, B is upward; B should increase in field strength toward the Earth. Thus, protons should have a net westward and electrons a net eastward drift especially outside of polar regions due to effect 2., many are 'repelled' from the poles due to effect 3. Effect 5 will also come into play (not sure of effect); 4, or at least 4B, is not a feature of a basic dipole field but I suppose it might occur due to disturbances or to the motions of charged particles themselves (and also within the core?).
  7. Patrick Sorry, I have read your argument a dozen times trying to see your logic but I simply can't. I am afraid it's too abstract for me.
  8. "I have read your argument a dozen times" Wow! Thanks for the effort! I suppose it would have been helpful if I had written a summary. TIDES ON EARTH: Outside of oceanic effects (and maybe a few glaciers at sea level), too weak to expect a significant effect on: 1. mantle convection and the overall rate of plate motions (which can't change fast anyway). 2. earthquakes and volcanic activity - at least in the longer term trends (as opposed to variations over cycles of 1/2 day, day, 1/2 month, month, etc.), if not even in those shorter term cycles. 3. the Geodynamo and outer core motion 4. the atmosphere, ionosphere (including E-region dynamo, in the base of the thermosphere), and magnetosphere (except in the magnetotail at those times of the month when the moon actually would get near or intersect it, although even then, on further reading it seems the magnetic forces on charged particles with the kinds of energies involved would overwhelm gravitational effects - and also, outside of the monthly and ~18-year cycles, what effect could that have, and even then, what would the significance of that be to Earth?) And where the tides have a significant effect, how would that effect relate to climate changes over a ~100 year period (as opposed to a ~ 20 year period or especially a 1/2-month (spring to neap to spring again)period)? TIDES CENTERED ON SUN (due to planets): far too weak to expect significant effect on: 1. solar convection or solar dynamo, and hence, 11-year sunspot cycle, other related phenomena including TSI variations 2. solar wind and interplanetary magnetic field (except, for effects on Earth, perhaps when Earth get's near the wake of Venus or Mercury, - **although most of that effect wouldn't actually be from the gravity of Mercury or Venus - and what effect could it be?) - this is especially considering the case considering the much much larger variations that do occur in solar wind density and velocity... TIDES ON SUN VS 'SOLAR JERK', FAIRBRIDGE CYCLE: I had thought that if the there was a correlation of solar TSI or solar wind and magnetic field to the solar jerk, it would be because they would both be correlated to the tides on the sun, which might have an effect on solar TSI, wind, and magnetic field (though an insigificant effect for our purposes, from my reasoning). The solar jerk is just the changing free-fall of the sun so it is hard to see how that would affect solar activity (as I explained elsewhere). However, it is interesting that while both such tides and 'jerk' depend greatly on Jupiter, the jerk depends also on the other gas giants due to their mass and distance, and the contribution of the 4 inner planets is tiny in comparison, whereas the three most important planets after Jupiter for the tides on the Sun are Venus, Earth, and Mercury. ---- ... Further reading on magnetosphere, solar wind...: (PS I have only browsed many of the following, with one noted exception): http://en.wikipedia.org/wiki/Magnetosphere http://en.wikipedia.org/wiki/Magnetosphere_particle_motion http://en.wikipedia.org/wiki/Guiding_center but of course one must be careful with wikipedia (their article on tides suggests the human menstrual period could be an evolutionary artifact of distant sea-dwelling ancestors' adaptations to tidal cycles, when in fact this doesn't seem likely at all, particularly considering the menstrual cycle periods of our closer relatives - it is just a coincidence) - on the other hand, it is possible to figure out whether or not the math and physics work out as such. But also: http://www-ssc.igpp.ucla.edu/ssc/tutorial/magnetosphere.html (which I have read completely) http://farside.ph.utexas.edu/teaching/plasma/lectures/lectures.html http://www-istp.gsfc.nasa.gov/Education/Intro.html ----- On a possible connection of oceanic tides to climate: http://www.pnas.org/content/94/16/8321.full I think there was a related article to the above, which focussed on a correlation of shorter term variability to oceanic tidal forcing. I haven't read through these closely enough to see just how much variability in tidal forcing there is relative to the tidal forcing itself - the largest I do expect is the spring-neap variation, but there are other variations... but I expect they are smaller especially in the long term variations - so I am arguing that oceanic tidal variations are significant in climate variations on the multidecadal to century to millenial or beyond timescale, but it is interesting to consider. I don't think the authors would or could argue that this could account for the warming of the last few decades...
  9. ... aside from that: 1. Unclear that recent changes in Earth's magnetic field are anything unusual over the same time period in which recent climate changes are unusual. (**PS I'd be curious to see if the previous changes in magnetic field, either in strength of dipole or actual reversals, correspond in any significant way with the paleoclimatic record, or anything else. One would think it could affect some species (birds, turtles?), though there is no evidence of enhanced extinction rates during reversals, as far as I know). 2. While new discoveries are made about submarine volcanic activity, there hasn't been a discovery of temporal changes in this, either significantly correlated to ENSO or other climate variability, or to global warming, and the same for volcanic activity in general - (except perhaps for the going into and out of a ~quiet period with respect to explosive volcanism above water, which wouldn't explain global warming of the last 100 years but apparently has influence (But not control) over ENSO). 3. As far as I know, the torques on Earth that contribute to two of the Milankovitch cycles do not result in true polar wander - the rotational axis changes orientation but the whole body of the Earth shifts with it, so the North pole remains in the Arctic over such cycles. 4. anthropogenic greenhouse forcing may be a little less than 2 % of the total greenhouse 'forcing' (including water vapor and clouds), but the small size of that proportion may not mean what some may think; a total forcing (greenhouse + albedo) that in terms of globally averaged radiative forcing would be somewhere between 3 % and 5 % of the same total greenhouse 'forcing' accounts for the global warming between the last ice age and preindustrial climate.
  10. Patrick Much better, thank you. Re: 1 Magnetic orientation for birds etc. may simply be lines of force rather than a true polarity orientation. A reversal likely has little effect but shift does to some extent, I would not expect extinctions however. Re: 2 I disagree here. But as with any hypothesis there is room for doubt. This is under study so I am content to wait on the outcome. Re: 3 The pole remains in the Arctic yes but the amount of direct sunlight changes with the angle of attack. Re: 4 I am uncertain of this, which is why I am here.
  11. Quietman, "Re: 3 The pole remains in the Arctic yes but the amount of direct sunlight changes with the angle of attack." Yes - this much is a widely understood aspect of Milankovitch cycles. "Re: 2 I disagree here. But as with any hypothesis there is room for doubt. This is under study so I am content to wait on the outcome." If you could find articles which specify changes in time (of geologic activity, aside from major eruptions above water, of course) correlated with any climate changes on the scale of years to millenia, I'd very much like to see it. Clarification - as I recall now, there was some speculation about possible temporal changes in geothermal heating of ice at two locations - somewhere in northern Greenland, and somewhere in West Antarctica. In each case it appeared to be only speculation, though. And I don't think those could have enough regional or global significance to account for much of recent climate changes. (With all the volcanos in the world, certainly a few could just happen to change just as anthropogenic emissions are becoming a big player, but it would seem quite a coincidence if enough volcanos in the right areas happened to change activity to have regional and global climatic significance at this time and yet not for some longer period of time prior to now (as inferred by paleoclimatic records and ice sheet conditions, etc.))
  12. Patrick You still assume AGW is a big player and I do not. See the sensitivity thread.
  13. ... will post response at: http://www.skepticalscience.com/climate-sensitivity.htm
  14. Satellite Data Reveals Extreme Summer Snowmelt In Northern Greenland ScienceDaily (Oct. 10, 2008) — The northern part of the Greenland ice sheet experienced extreme snowmelt during the summer of 2008, with large portions of the area subject to record melting days, according to Dr. Marco Tedesco, Assistant Professor of Earth & Atmospheric Sciences at The City College of New York (CCNY), and colleagues.
  15. Interesting article. Is meltwater perculating up from below to heat the ice? Geothermal heating would melt the bottom first; even with infinite thermal conductivity, the melting point of ice is lower at higher pressure. Depending on the thickness of the ice at that location, it might take considerable time for a change in heating to propogate upward. I think a majority is from AGW.
  16. Patrick In the Greenland thread I have added an abstract that is applicable in answer.
  17. PS I posted a link in comment 267 in Arctic sea ice melt - natural or man-made? which is also applicable as a response.
  18. correction: comment 257 (not 267).
  19. Patrick In other words it would appear that the arctic is subject to some very unusual weather causing much of the problem for the past half century. The question now becomes, what caused the change in pattern. My tectonic argument based on "the solar jerk" offers an explanation for this change while the IPCC argument does not.
  20. "My tectonic argument based on "the solar jerk" offers an explanation for this change while the IPCC argument does not." 1. But the 'IPCC argument' (also the argument of many others) may very well explain it... (more on that later) 2. How 'on earth' is the tectonic argument linked to the solar jerk? a. is it that tides, which may be correlated with solar jerk, are acting on either the geodynamo or tectonics or volcanism (all of which I strongly doubt (tidal variations weak, variations over relavent time periods weaker still), outside butterfly effects that take time and are not discernable as predictable links among individual causes and effects)? or b. that solar activity affects Earth's magnetic field, which of course does happen, BUT - I am very doubtful (with the same caveats as in a.) of any significant role of solar jerk or tides on the sun in changing solar activity, or of any significant link between changes in the outer core geodynamo and tectonics on the relavent timescales (mantle is very slow and reacts very slowly to changes in outer core convection), or of much effect, at least on the relavent timescales, that solar and space 'weather/climate' perturbations on Earth's magnetosphere and E-region dynamo could have on motions and magnetic field in the core, considering how much much much more massive the core is and how much more intense the field is in the core (yes, there is a lot of momentum and energy per unit mass in the magnetosphere, but still I expect much more total momentum and kinetic energy within the outer core), and also that, at least as far as I know, the strongest (relative?) perturbations of the magnetic field due to space weather occur at greater distances, where the field is even weaker still. ------------ Back to 1: Greenland article abstract (referenced in comment 66): the effect of meltwater is to lubricate the base of the glacier causing faster flow; sudden changes can occur as water flows. Effect may be limited. Nowhere does it state that the meltwater has increased due to geothermal heating - not that that's not a possibility but - without actual eruptions or sudden magma movement up through cracks, changes in geothermal heating must be slow - could it account for a significant change over only decades? How much heat would be necessary to account for the amount of water melting? Wouldn't there be some indication of volcanic activity (from a pattern of earthquakes (discernable from icequakes or quakes due to changing ice mass and isostatic adjustments??); sulfur concentration in meltwater outflow????)... I think this phenomenon of basal lubrication of the ice is not limited to the area where a underlying hotspot is thought to be. --- Arctic sea ice loss article: "Rising Arctic Storm Activity Sways Sea Ice, Climate ScienceDaily (Oct. 6, 2008)" http://www.sciencedaily.com/releases/2008/10/081006180815.htm What I got from that is: There was an expectation from climate theory ("derived from model results") that a warmer climate would lead to a northward shift in storm tracks and increased storminess in the arctic. This expectation has been verified from the observations. Observations also indicated that the changing circulation patterns have affected, through wind, the Arctic Ocean circulation, via movement of sea ice. Transport of sea ice: "The team found that the pace of sea ice movement along the Arctic Ocean's Transpolar Drift Stream from Siberia to the Atlantic Ocean accelerated in both summer and winter during the 55-year period." "Progressively stronger storms over the Transpolar Drift Stream forced sea ice to drift increasingly faster in a matter of hours after the onset of storms." (I'm not sure how similar this flow pattern is to the flow of ice associated with the 2007 circulation anomaly that pushed warmer air into Siberia - in that case, however, the atmospheric circulation pattern was not unprecedented, but resulted in record minimum ice because it was acting on top of an overall warmer atmosphere and thinner sea ice, etc. - because of ongoing global warming. There will be highs and lows; on top of an upward trends the highs and lows with both be higher, except potentially for the trend's effect on the shorter term variability itself.) Ocean mixing: "The moving sea ice forces the ocean to move which sets off significantly more mixing of the upper layers of the ocean than would occur without the "push" from the ice. The increased mixing of the ocean layer forces a greater degree of ocean convection, and instability that offers negative feedback to climate warming." That last part is potentially great! - that more CO2 might go into the oceans - BUT it is also potentially worrisome - will it speed up ice loss? Will it make it harder for new ice to form each winter as the fresher meltwater is mixed into the saltier water? - and of course because of the ice albedo feedback?
  21. Patrick But in fact the thinned crust is the northern end of Greenland (in the articles linked in this thread) and surrounding Arctic ocean and that is exactly where the largest glacial melt is AND IT IS FROM THE BOTTOM.
  22. Ice albedo will remain until all the ice is gone. Soot in the top layers lower the albedo so fresh ice will have a higher albedo if we control the output of soot.
  23. They do not say if it is AGW either. In fact they do not say why at all (in that article). But top down melting would not produce the same results, nor would it be restricted to only northern Greenland where the crust is thin (they DO describe it as a "hot spot" in the other article and suggest that vulcanism is a "contributer" in an earlier article. I do think they are at last on track.
  24. Patrick Keep in mind that while you and I can speak openly for or against the AGW concept. there are others who need to be politically correct or they will lose their jobs or grant money and therefore skirt the issue. Then there are those, like one poster at this site, that are environmental fanatics who look upon AGW as a bible thumper looks to the word of God. Hopefully we will get to the truth behind all this regardless of their attempts to "enlighten" us "deniers" (that is their demonization of skeptics vocabulary, not mine).
  25. Patrick To save time and server space, I ask you to read the comments in "Arctic sea ice melt - natural or man-made?" as that is where I presented my hypothesis en todo. It technically should have been placed here, but I got angry and a little carried away when I got double teamed. But there were some good points made by all in my opinion.

Prev  1  2  3  4  5  6  7  8  9  10  11  12  Next

Post a Comment

Political, off-topic or ad hominem comments will be deleted. Comments Policy...

You need to be logged in to post a comment. Login via the left margin or if you're new, register here.

Link to this page


The Consensus Project Website

THE ESCALATOR

(free to republish)


© Copyright 2024 John Cook
Home | Translations | About Us | Privacy | Contact Us