Climate Science Glossary

Term Lookup

Enter a term in the search box to find its definition.

Settings

Use the controls in the far right panel to increase or decrease the number of terms automatically displayed (or to completely turn that feature off).

Term Lookup

Settings


All IPCC definitions taken from Climate Change 2007: The Physical Science Basis. Working Group I Contribution to the Fourth Assessment Report of the Intergovernmental Panel on Climate Change, Annex I, Glossary, pp. 941-954. Cambridge University Press.

Home Arguments Software Resources Comments The Consensus Project Translations About Support

Bluesky Facebook LinkedIn Mastodon MeWe

Twitter YouTube RSS Posts RSS Comments Email Subscribe


Climate's changed before
It's the sun
It's not bad
There is no consensus
It's cooling
Models are unreliable
Temp record is unreliable
Animals and plants can adapt
It hasn't warmed since 1998
Antarctica is gaining ice
View All Arguments...


Username
Password
New? Register here
Forgot your password?

Latest Posts

Archives

Do volcanoes emit more CO2 than humans?

What the science says...

Select a level... Basic Intermediate

Humans emit 100 times more CO2 than volcanoes.

Climate Myth...

Volcanoes emit more CO2 than humans

"Human additions of CO2 to the atmosphere must be taken into perspective.

Over the past 250 years, humans have added just one part of CO2 in 10,000 to the atmosphere. One volcanic cough can do this in a day." (Ian Plimer)

At a glance

The false claim that volcanoes emit more CO2 than humans keeps resurfacing every so often. This is despite debunkings from bodies like the United States Geological Survey (USGS). Such claims may be easy to make, but they fall apart once a little scientific scrutiny is applied. So, to settle this once and for all, let's venture out into the fascinating world of geology, plate tectonics and volcanism.

According to the USGS, there are 1,350 active volcanoes on Earth at the moment. An active volcano is one that can erupt, even if it's decades since it last did so. As of June 2023, 48 volcanoes were in continuous eruption, meaning activity occurs every few weeks. Out of those, around 20 will be erupting on any particular day. Several of those will have erupted by the time you have finished reading this.

People are familiar with a typical volcano, an elevated area with one or more craters or fissures from which lava periodically erupts. But there are also the submarine volcanoes such as those along the mid-oceanic ridges. These vast undersea mountain ranges are a key component of Earth's Plate Tectonics system. The basalts they continually erupt solidify into the oceanic crust making up the flooring of the deep oceans. Oceanic crust is constantly moving away from any mid-ocean ridge in the process known as 'sea-floor spreading'.

Oceanic crust is chemically reactive. It reacts with seawater, allowing the formation of huge quantities of minerals including those carrying carbon in the form of carbonate. But oceanic crust is geologically young. That is because it is also being consumed at subduction zones - the deep ocean 'trenches' where it is forced down into Earth's mantle.

When oceanic crust is forced down into the mantle at subduction zones, it heats up and begins to melt into magma. Carbonate minerals in that crust lose their carbon - it is literally cooked out of them. Magmas then transport the CO2 and other gases up through Earth's crust and if they reach the surface, volcanic eruptions occur and the CO2 and other gases leave the magma for the atmosphere.

So here you can see a long-term cycle in which carbon gets trapped in the sea-floor, subducted into the mantle, liberated into new magma and erupted again. It's a key part of Earth's Slow Carbon Cycle.

Volcanoes are also dangerous. That's why we have studied them for centuries. We have hundreds of years of observations of all sorts of eruptions, at Earth's surface and beneath the oceans. Those observations include millions of geochemical analyses of both lavas and gases.

Because of all of that data collected over so many years, we have a very good idea of the amount of CO2 released to the atmosphere by volcanic activity. According to the USGS, it is between 180 and 440 million tons a year.

In 2019, according to the IPCC's Sixth Assessment Report (2022), human CO2 emissions were:

44.25 thousand million tons.

That's at least a hundred times the amount emitted by volcanoes. Case dismissed.

Please use this form to provide feedback about this new "At a glance" section. Read a more technical version below or dig deeper via the tabs above!


Further details

Beneath the surface of the Earth, in the various rocks making up the crust and the mantle, is a huge quantity of carbon, far more than is present in the atmosphere or oceans. As well as fossil fuels (those still left in the ground) and limestones (made of calcium carbonate), there are many other compounds of carbon in combination with other chemical elements, making up a range of minerals. According to the respected mineralogy reference website mindat, there are 258 different valid carbonate minerals alone!

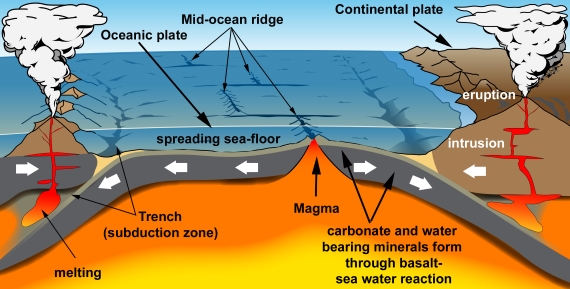
Some of this carbon is released in the form of carbon dioxide, through vents at volcanoes and hot springs. Volcanic emissions are an important part of the global Slow Carbon Cycle, involving the movement of carbon from rocks to the atmosphere and back on geological timescales. In this part of the Slow Carbon Cycle (fig. 1), carbonate minerals such as calcite form through the chemical reaction of sea water with the basalt making up oceanic crust. Almost all oceanic crust ends up getting subducted, whereupon it starts to melt deep in the heat of the mantle. Hydrous minerals lose their water which acts as a flux in the melting process. Carbonates get their carbon driven off by the heating. The result is copious amounts of volatile-rich magma.

Magma is buoyant relative to the dense rocks deep inside the Earth. It rises up into the crust and heads towards the surface. Some magma is trapped underground where it slowly cools and solidifies to form intrusions. Some magma reaches the surface to be erupted from volcanoes. Thus a significant amount of carbon is transferred from ocean water to ocean floor, then to the mantle, then to magma and finally to the atmosphere through volcanic degassing.

 Plate tectonics in cartoon form

Fig. 1: An endless cycle of carbon entrapment and release: plate tectonics in cartoon form. Graphic: jg.

Estimates of the amount of CO2 emitted by volcanic activity vary but are all in the low hundreds of millions of tons per annum. That's a fraction of human emissions (Fischer & Aiuppa 2020 and references therein; open access). There have been counter-claims that volcanoes, especially submarine volcanoes, produce vastly greater amounts of CO2 than these estimates. But they are not supported by any papers published by the scientists who study the subject. The USGS and other organisations have debunked such claims repeatedly, for example here and here. To continue to make the claims is tiresome.

The burning of fossil fuels and changes in land use results in the emission into the atmosphere of approximately 44.25 billion tonnes of carbon dioxide per year worldwide (2019 figures, taken from IPCC AR6, WG III Technical Summary 2022). Human emissions numbers are in the region of two orders of magnitude greater than estimated volcanic CO2 fluxes.

Our knowledge of volcanic CO2 discharges would have to be shown to be very mistaken before volcanic CO2 discharges could be considered anything but a bit player in the current picture. They have done nothing to contribute to the recent changes observed in the concentration of CO2 in the Earth's atmosphere. In the Slow Carbon cycle, volcanic outgassing is only part of the picture. There are also the ways in which CO2 is removed from the atmosphere and oceans. If fossil fuel burning was not happening, the Slow Carbon Cycle would be in balance. Instead we've chucked a great big wrench into its gears.

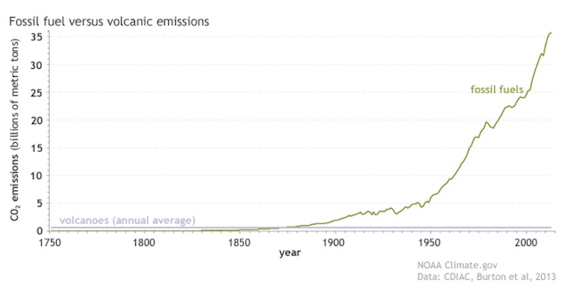
Some people like classic graphs, others prefer alternative ways of illustrating a point. Here's the graph (fig. 2):

Human emissions of CO2 from fossil fuels and cement

Fig. 2: Since the start of the Industrial Revolution, human emissions of carbon dioxide from fossil fuels and cement production (green line) have risen to more than 35 billion metric tons per year, while volcanoes (purple line) produce less than 1 billion metric tons annually. NOAA Climate.gov graph, based on data from the Carbon Dioxide Information Analysis Center (CDIAC) at the DOE's Oak Ridge National Laboratory and Burton et al. (2013).

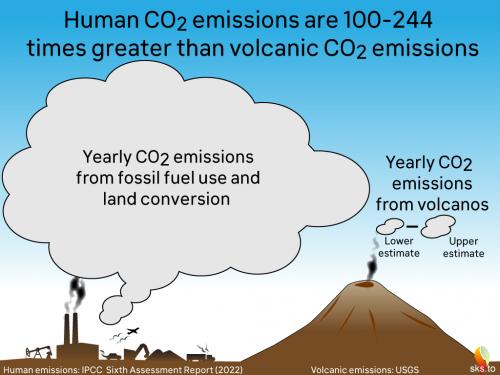
And here's a cartoon version (fig. 3):

 Human and volcanic CO2 emissions

Fig. 3: Another way of expressing the difference between current volcanic and human annual CO2 emissions (as of 2022). Graphic: jg.

Volcanoes can - and do - influence the global climate over time periods of a few years. This is occasionally achieved through the injection of sulfate aerosols into the high reaches of the atmosphere during the very large volcanic eruptions that occur sporadically each century. When such eruptions occur, such as the 1991 example of Mount Pinatubu, a short-lived cooling may be expected and did indeed happen. The aerosols are a cooling agent. So occasional volcanic climate forcing mostly has the opposite sign to global warming.

An exception to this general rule, however, was the cataclysmic January 2022 eruption of the undersea volcano Hunga Tonga–Hunga Ha'apai. The explosion, destroying most of an island, was caused by the sudden interaction of a magma chamber with a vast amount of seawater. It was detected worldwide and the eruption plume shot higher into the atmosphere than any other recorded. The chemistry of the plume was unusual in that water vapour was far more abundant than sulfate. Loading the regional stratosphere with around 150 million tons of water vapour, the eruption is considered to be a rare example of a volcano causing short-term warming, although the amount represents a small addition to the much greater warming caused by human emissions (e.g. Sellitto et al. 2022).

Over geological time, even more intense volcanism has occurred - sometimes on a vast scale compared to anything humans have ever witnessed. Such 'Large Igneous Province' eruptions have even been linked to mass-extinctions, such as that at the end of the Permian period 250 million years ago. So in the absence of humans and their fossil fuel burning, volcanic activity and its carbon emissions have certainly had a hand in driving climate fluctuations on Earth. At times such events have proved disastrous. It's just that today is not one such time. This time, it's mostly down to us.

Last updated on 10 September 2023 by John Mason. View Archives

Printable Version  |  Offline PDF Version  |  Link to this page

Argument Feedback

Please use this form to let us know about suggested updates to this rebuttal.

Related Arguments
Further reading

Tamino has posted two examinations of the "volcanoes emit more CO2 than humans" argument by looking at the impact of the 1991 Pinutabo eruption on CO2 levels and the impact of past super volcanoes on the CO2 record.

The Global Volcanism Program have a list of all "most noteworthy" volcanoes - with for example a Volcanic Explosivity Index (VEI) greater than 5 over the past 10,000 years.

Myth Deconstruction

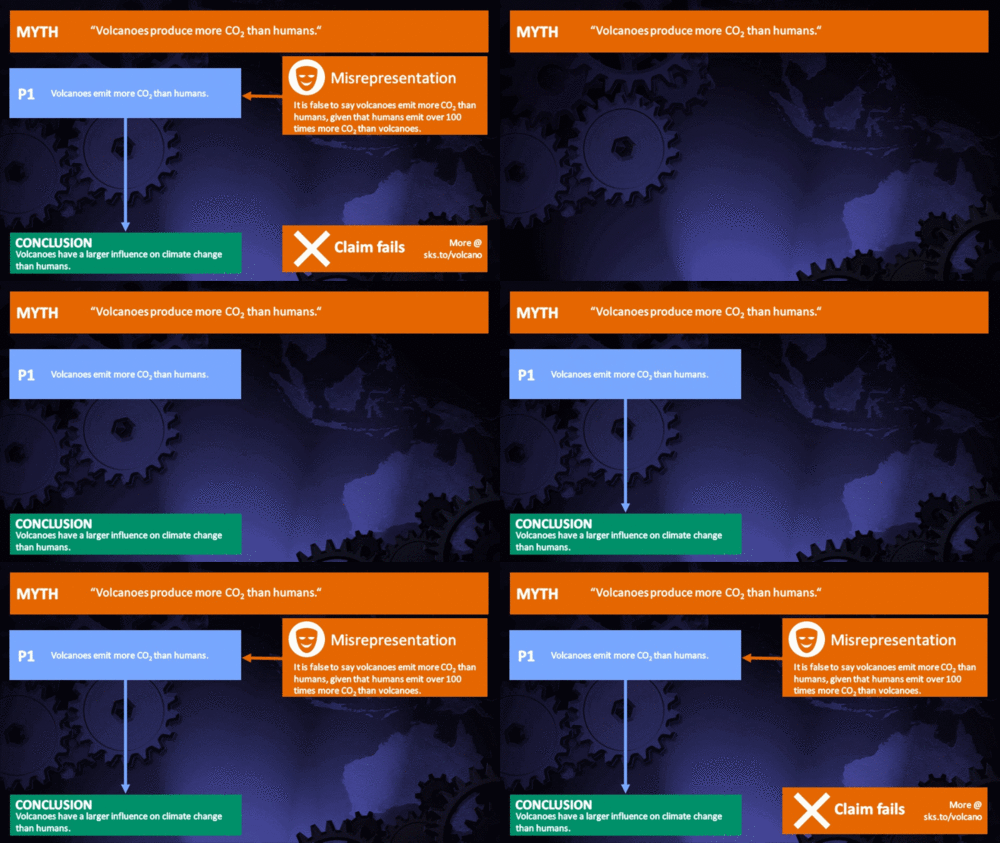
Related resource: Myth Deconstruction as animated GIF

MD Volcano

Please check the related blog post for background information about this graphics resource.

Denial101x video

Here is the relevant lecture-video from Denial101x - Making Sense of Climate Science Denial

Fact brief

Click the thumbnail for the concise fact brief version created in collaboration with Gigafact:

fact brief

Comments

Prev  1  2  3  4  5  6  7  8  9  10  Next

Comments 151 to 175 out of 243:

  1. Patrick It has been determined that the earth does not work slowly but just like evolution, in fits and spurts, ie. it does not matter if it's a million years or a hundred years. What matters is current phase which is an active phase. This was noted in an article this past year (more new information not taken into account by the IPCC). Yes, those volcanos are active. And those are only the ones that are under the ice, not the ones on the ocean floor. It's a subduction zone.
  2. ps We are also looking at overall trends, over millions of years in addition to the current phase. It certainly does pertain.
  3. Patrick Here is a couple more new items of increased tectonic activity: New Fault Raises Threat of Eastern Earthquakes Yellowstone Earthquake Swarm Puzzles Scientists
  4. "ps We are also looking at overall trends, over millions of years in addition to the current phase. It certainly does pertain. " To the subject of climate in general, but not so much to AGW specifically in as far as the causes of recent changes (last 100 years, especially last few decades) must be, outside of natural variability contributions, things which have recently changed and in so doing reached states unseen for some longer time. "What matters is current phase which is an active phase. This was noted in an article this past year " Which article? "Yes, those volcanos are active. And those are only the ones that are under the ice, not the ones on the ocean floor. It's a subduction zone. " But are they unusually active? The numbers just don't add up to explain much of recent climate changes, if even to suggest some significant multidecadal trend in tectonic activity.
  5. Patrick I am referring back to the articles posted above in this thread. Yes the activity increased in the late 1970s and has continued. That is exactly what all of the above links indicate. And what is usual? The realization that tectonic activity is not a constant is a recent realization (the article on this concerns mountain building in fits and spurts). So how can it be more than usual, as there is apparently no usual.
  6. ps The "new" fault is obviously not new, it just has become active again. I knew it was there, so obviously they should know at LEAST what I was able to learn. It's a very sad state of affairs for the educational system in the U.S.
  7. "The "new" fault is obviously not new, it just has become active again. I knew it was there, so obviously " Are you sure the fault you knew about is the specific one they described as recently discovered? I didn't get the impression from the article that there has been any recent activity at that specific fault (where I heard about it from a different source, my impression was that the bubbling liquefied sand was not an ongoing process but something that had happenned and left a mark in the geologic record, which helped identify the fault), which is near but not the same as the New Madrid fault, which I also already knew about. "So how can it be more than usual, as there is apparently no usual." Of course it is not constant, but as with climate and weather, there will be a general state of tectonic activity within which variations and events occur on smaller time scales. There does seem to me to be more tectonic activity right now than 10 years ago (but is that a false impression created by a very small data set? - in other words, this isn't something I've followed closely). Is this level unusual for the last 100 years? The last 1000? There was an earthquake in Portugal - I think during the little ice age, actually (but I'm not sure) - and it killed something like over 70,000 people. Which is a great tragedy, of course, but what does that imply in as far as tectonic trends or short term tectonic activity - climate relationships? Not much. When you picture the level of tectonic activity over time - let's say the last 1000 years - what do you picture: (_ low, , - medium, | high, ^ higher, A highest) (graphs coming soon)
  8. A. -^^__A|__^||^^|^|__||A|_^-A^^^A-A|A-_^-^-_|^---_-A-|A^^_|A_A_^^^A-AA^^^_-_A-^-_||__--A-_^-^A_||-__^_--_|A-^^_|- B. A----A-|A-^|AA^--|A___-|^-A_|_||-|-|^-_^___-_A|_-^^A_-_^AAA_A|^A_^|A_^__-AA_A-__|A|A^^A^^A-_||___^^|__-A^AA^-A- C. _|_^^^AAA^_|-__-_|^A|----A^|^_|A-^__|___|_|___A^_AA|_---_-^|--_____A|_|^A--^|_-^A_|A-|-|-__A__A-_^A-_|^-|^^-^A_ D. __^__^-|^--_AA_^__A____^-||_^||__A__^-_--_-_^_-_-____|-_-||_-A__A__|__^__A^-____||-_|_A_|_____|-___A|-__^___^__ E. __^____^A____--_|-^--|__-__|A-|^-_|A__-||_A__-A^^-__|-|___|___|_---_^^__|A-^-A__-^-_-__A-_^____|___|__^|_______ F. ___^___--__|-_-_|__|____|___-_-|____|__^-____||_-__-_-|-_-__^____|_-____|_|___--__|-__^_^|^____|___|-_-_-|-_-_| G. --|-____-___-A-^__-|---_-__-_A____-_-__--A__---_-__|-|-_|-_A-|_|_|_-_^|_A--_-^^^_-_-_^___-__^--___|___|_|_|____ H. _____A_--A|__-_^-_-A_^_-_-___--_|_|__----|__--_^A-^---_-|-A____|__---___---__|^___^___|-_____A_-|_^_-|______^|_ I. -_-__--A|__|-_^^------__|-^-_---__-|__-|__-_|-_-____-_|_^-_-___|_|-__^___A___-||A-|-A_______^__^-__-_-^___A_|_^ J. _-_A|-_-|---_|^--__---^_---|-__-_A_-_|^-_A-__^-__|-^_-__-_||_^-_-|____-____-_--^|__|_--_--^__-__-|_--|^-A^A-|^A^
  9. Patrick I have been assuming that you are up on geology since you are studying climate. Your recent comments have indicated that I made a false assumption. I am sorry if I have confused you. On the antarctic: The penninsula of west antarctica sits on a subduction zone, that is the reason that the volcanos are active and mountain building is still occurring in that region. That is the southernmost extent of what they call "the ring of fire". The New Madrid area is a juncture of a fault line and a fracture zone. In each of these areas there is only one main fault but it has fractures running perpendicular and minor faults running parallel. The appalachian chain follows the main fault. It has many inactive volcanos all along it from Texas to Maine as proof. They are "discovering" old faults that were considered "dead" but they were simply not very active, and that activity has been increasing for about 25 to 30 years now all along that main fault. Another area of subduction is the northern edhe of Greenland and Arctic Canada. Again this area has only recently increased in activity. The subduction zones along Asia and Alaska have also increased activity, the recent volcanic activity is simply indicative of the tectonic activity. This is why geologists make good climatologists.
  10. PS don't think too hard about it. All except J are just random sequences (I used a spreadsheet to make the text strings). (Not that there aren't such things as random trends.) The first few follow power laws; the last few have each level about half as likely as the next highest. Anyway, even with some correlation between tectonics and climate, one still has to show at least either that the correlation is robust (reoccurs with statistical significance) and/or that there is some reason to expect a predictable (as opposed to butterfly effects) causal relationship. At least that is met for short term volcanic aerosol cooling, for longer term geologic influences on atmospheric CO2 concentration, and changing geography (but a local land rise of 5 inches isn't generally significant as a regional or global climate cause).
  11. PS 160 follows 158, not comment 159 "This is why geologists make good climatologists." What "This"? - for comment 159 is essentially all about geology. Why not then assume that because I have a grasp of climatology, I might then know more about geology than you do - that would also potentially be erroneous. Yes a fault, volcano, etc., might be thought dead/extinct and later discovered to still be active or have potential for activity in the not too distant future, etc. But that doesn't mean that all new discoveries of potentially active faults had already been identified as faults, does it? An example of what I am aware of - The New Madrid seismic zone is a leftover of a failed rift - an aulacogen (aka Mississippi Embayment ?) - from around the time of the breakup of Pangea or around that time (I'm better at the generalities than the exact dates). A much older example of a failed rift underlies Lake Superior and is ~ a billion years old or so - at least roughly in the same temporal territory as the Grenville orogeny (might they be causally linked?).
  12. "that you are up on geology" Well I guess that depends on what you mean by 'up on'. I have a good basic understanding of the rock cycle, plate tectonics, mantle convection, some stuff about the core, geochemistry, how material is processed so as to concentrate some materials in some places in some forms (repeated partial melting and freezing for igneous rocks), crystal lattices, the large scale of geologic history; I could draw a rough map of Pangea; am less clear on Rodinia, I've heard of Mazatzal (spelling?); I know detrital pyrite is an indicator of lack of oxygen; ... But no, there are certainly a lot of minerals (especially the rare ones) that I couldn't identify or have never heard of, I don't know every division of time, I don't know every minor fault, I don't know precisely where the line is drawn between active, dormant, and extinct; I have some more detailed knowledge about a few things, like Baraboo quartzite (it goes back ~ 1.8 billion years, has some association with the Penokean orogeny; color an indication of presence of atmospheric oxygen at the time).
  13. Patrick No offense meant. I did assume that you understood more geology than I do. Your questioning if volcanos are active over an active subduction zone threw me a curve. I assumed that you knew where the subduction zones were (Hansen et. al. apparently doesn't). The pattern of activity has been increasing since the 1970s. Looking at paleomaps, it is clear that the "canadian shield" is not a solid plate. The rifting really is not a failed rift. What we have is a compression along an old plate edge that we assumed to have fused when beringia was formed. I don't believe anything "fused" is actually a permanent condition. PS I don't understand what 158 represents.
  14. ps To clarify, does J indicate the current time and what time frame are you depicting?
  15. pps To see what I mean look at this map: http://www.scotese.com/newpage1.htm Look at New England and Nova Scotia near the bottom left of the map.
  16. Re 165 - yes, I know ultimately every sizable chunk of continent came together from smaller terranes. Of course the Keweenawan rift likely cut through some older boundaries and may well have incorporated some older boundaries. But it was itself a rift. Although it is also true that it absorbed some compression at a later time (but not much later?)- formerly fallen blocks were forced back up. "I don't believe anything "fused" is actually a permanent condition" - well, that makes sense, but I would guess that, other things being equal, forces would be more likely to reactivate more recently active faults than faults that have been dead for longer. Re 164 - each is a hypothetical ~1000 year 'graph' of tectonic activity. I altered J in an attempt to show what one might expect it to look like if recent global warming were driven by an increase in tectonic activity. Even if it did look that way, however, there is still the problem that there is not enough reason to expect one to cause the other. Whereas there is much reason to expect adding CO2 to the atmosphere to cause warming, with or without paleoclimatic and geologic record correlations, though every bit can help clarify matters. I don't see what your point is about the map http://www.scotese.com/newpage1.htm (458 Ma). The Keweenawan rift (underlying Lake Superior but extending elsewhere) predates this map and within the borders of the portions (or at least mostly so) of North America so far assembled and still together at 458 Ma.
  17. Patrick I was referring to New England and Nova Scotia being on a seperate plate. It's actually more than New England but that's irrelavent. The joining of this land mass from the bottom left to the canadian shield is responsible for much mountain building and the primary appalachian fault which is still active. They just had a 3.0 quake in Morristown N.J. a couple days ago - extremely rare event for N.J. which I am assuming occurred along the Ramapo fault (a parallel fault). This makes sense when you realize that the arctic ridge increased speed and is pushing the canadian shield south again.
  18. "I was referring to New England and Nova Scotia being on a seperate plate. It's actually more than New England but that's irrelavent. The joining of this land mass from the bottom left to the canadian shield is responsible for much mountain building and the primary appalachian fault which is still active. " - Okay... aside from there being one fault that can be designated the primary fault, I was aware of that. Isn't possible, though, that there has been no increase in activity? Because: "They just had a 3.0 quake in Morristown N.J. a couple days ago - extremely rare event for N.J." (PS I heard about that one. I had known about the New Madrid fault quite some time ago but just a couple or so years ago I was surprised to see on a map that there was significant seismic hazard in South Carolina and elsewhere in eastern North America. I think there've even been a few big earthquakes in the New York/eastern Canada region (historical).) When events are so rare, it is really hard to tell from a short record just what would signify a trend in activity. Maybe there's an average of one >= 3.0 earthquake in NJ every 500 years or so (pure hypothetical example - I don't know what the number actually is). You did refer to news about scientific findings from the Arctic ridge, but it was never established that there was an actual significant increase in speed. Mantle convection and the large scale plate motions that follow it are gradual on the scale of many years to many hundreds of thousands of years ... not sure where the long cut-off would be - the point being that, as some portion of the stress is relieved in jolts, I would expect the finer time scale will show some irregularity in motion on the spatial scale of the stress build up and relief by single or a few earthquakes. But this will tend to average out on intermediate timescales because the source of such stress is from the pressure variations due to elevation, composition, and temperature variation, which change significantly only on much longer timescales.
  19. Yes, the fault that follows the Hudson river had a 5+ back in the 70s near Bear Mountain. I remember that one because I felt it in N.J. over a hundred miles away and there was concern about the epicenter being close to a nuclear power plant. I was born and raised in N.Y. and raised my children in N.J. so I am familiar with the area. Never even heard of earthquakes there until the 70s. Knew about the 2nd avenue fault from history, they discovered it blasting for a subway. Obviuosly they stopped work on it.
  20. ps thats 2nc Avenue in Manhatten (NYC).
  21. I forgot the "booming" noises (enough to rattle windows in north western NJ) that were in all the NJ papers in the 70s. It took them a while to realize that they were earthquakes because no one alive at the time had ever felt them in NJ. They thought the Ramapo fault was dead and that's the main one through NJ.
  22. "Obviuosly they stopped work on it. " Was that before or after they realized the fault had a potential for activity? PS - a little fuzzy on some of this, but I think: The Keweenaw rift formed (as a rift) just before 1000 Ma, and this may coincide with the Grenville orogeny (to the east if oriented as now) - (perhaps the rift occured over a descending slab of subducted oceanic crust, from the subduction zone to the east (if oriented as now)). Shortly afterward, it reversed from being extensional to being compressional; fallen blocks (The Saint Croix horst?) (having been covered with basalt and sediment) were forced back up again. This occured between 1000 Ma and 900 Ma, during another collision (I believe distinct from and coming after the Grenville orogeny, though not completely sure). But, faults were again reactivated during another collision in the Ordivician, with the former rift absorbing a bit more compression.
  23. Patrick "Obviuosly they stopped work on it. " Was that before or after they realized the fault had a potential for activity? The blasting caused an earthquake. Not a good thing under downtown NYC. :)
  24. The Keweenaw rift That sounds logical enough. I thought that you were talking about a recent event when you first said "a failed rift". It does not seem to have failed, just old and later compressed. My cousin has a degree in geology (not a PhD) and showed me some of the features upstate New York some years ago. Where he is now (near Albany) has Devonian rock all over, covered with fossils. Interesting stuff.
  25. Volcanic Eruptions Greater than 4.0 Period from 1945 to 1970 (16 major eruptions) Nomen Year Rank Location FERNANDINA 1968 4 Galapagos AWU 1966 4 Sangihe Islands KELUT 1966 4 Java TAAL 1965 4 Luzon SHIVELUCH 1964 4+ Kamchatka AGUNG 1963 5 Lesser Sundas AGUNG 1963 4 Lesser Sundas BEZYMIANNY 1956 5 Kamchatka CARRAN 1955 4 Chile SPURR 1953 4 Alaska BAGANA 1952 4 Bougainville Island KELUT 1951 4 Java LAMINGTON 1951 4 New Guinea AMBRYM 1951 4+ Vanuatu HEKLA 1947 4 Iceland SARYCHEV 1946 4 Kuril Islands Period from 1971 to 2006 (26 major eruptions) Nomen Year Rank Location RABAUL 2006 4 New Britain MANAM 2005 4 N.E.of New Guinea REVENTADOR 2002 4 Ecuador RUANG 2002 4 Sangihe Islands SHIVELUCH 2001 4 Kamchatka ULAWUN 2000 4 New Britain RABAUL 1994 4 New Britain LASCAR 1993 4 Chile SPURR 1992 4 Alaska HUDSON 1991 5+ Chile PINATUBO 1991 6 Luzon KLIUCHEVSKOI 1990 4 Kamchatka KELUT 1990 4 Java AUGUSTINE 1986 4 Alaska CHIKURACHKI 1986 4 Kuril Islands COLO 1983 4 Sulawesi GALUNGGUNG 1982 4 Java CHICHON 1982 5 Mexico CHICHON 1982 4+ Mexico PAGAN 1981 4 Marianas ALAID 1981 4 Kuril Islands ST.HELENS 1980 5 Washington AUGUSTINE 1976 4 Alaska TOLBACHIK 1975 4+ Kamchatka FUEGO 1974 4 Guatemala TIATIA 1973 4 Kuril Islands Source: http://www.volcano.si.edu/world/largeeruptions.cfm Results: 10 more eruptions recently with a VEI >=4 than for the same length preceeding period using 1970 as a cutoff. Note: I have no access to the additional activity or the undersea volcanos that are not included.

Prev  1  2  3  4  5  6  7  8  9  10  Next

Post a Comment

Political, off-topic or ad hominem comments will be deleted. Comments Policy...

You need to be logged in to post a comment. Login via the left margin or if you're new, register here.

Link to this page


The Consensus Project Website

THE ESCALATOR

(free to republish)


© Copyright 2024 John Cook
Home | Translations | About Us | Privacy | Contact Us