Climate Science Glossary

Term Lookup

Enter a term in the search box to find its definition.

Settings

Use the controls in the far right panel to increase or decrease the number of terms automatically displayed (or to completely turn that feature off).

Term Lookup

Settings


All IPCC definitions taken from Climate Change 2007: The Physical Science Basis. Working Group I Contribution to the Fourth Assessment Report of the Intergovernmental Panel on Climate Change, Annex I, Glossary, pp. 941-954. Cambridge University Press.

Home Arguments Software Resources Comments The Consensus Project Translations About Support

Bluesky Facebook LinkedIn Mastodon MeWe

Twitter YouTube RSS Posts RSS Comments Email Subscribe


Climate's changed before
It's the sun
It's not bad
There is no consensus
It's cooling
Models are unreliable
Temp record is unreliable
Animals and plants can adapt
It hasn't warmed since 1998
Antarctica is gaining ice
View All Arguments...


Username
Password
New? Register here
Forgot your password?

Latest Posts

Archives

How does the Medieval Warm Period compare to current global temperatures?

What the science says...

Select a level... Basic Intermediate

While the Medieval Warm Period saw unusually warm temperatures in some regions, globally the planet was cooler than current conditions.

Climate Myth...

Medieval Warm Period was warmer

"For now, though, it is enough just to see the Medieval WARM Period shown to be global, and warmer than today." (Musings from the Chiefio)

At a glance

To explore this topic, the first question must surely be: what was the Medieval Warm Period? The answer lies in the dim and distant past, in modern human terms, that is. Compared to the age of the Earth, at 4.5 billion years, it is a fraction of a very small fraction of a blink of the eye. Nevertheless, let's continue.

The period of time known to archaeologists as the Common Era (CE) roughly covers the past 2000 years. Decades ago it was divided into a series of climate epochs. Although there is no firm consensus regarding their precise duration, the 'Roman Warm Period' covered the first few centuries. The 'Dark Ages Cold Period' was from around 400-800 CE, the 'Medieval Warm Period' was from 800-1200 CE and the 'Little Ice-Age' was from 1200-1850 CE.

Each of these climatic epochs has its origin in old pieces of paleoclimatic evidence from the Northern Hemisphere. Decades ago, it was assumed each such epoch must have been global in extent. But since that time, climatology has steadily moved on. More new ways of reconstructing the Common Era climate have been discovered and refined. Coverage has been extended from those few Northern Hemisphere localities to the entire globe.

Thanks to such improvements, we now know that many of these warming and cooling events were regional, not global effects. The evidence no longer supports the idea of epochs of globally coherent and synchronous climate. Yes it was warm in Europe in the Medieval Warm Period. However, it was much cooler, for example, over the Pacific than it is today.

The coldest epoch of the last millennium is known as the Little Ice Age. But here too, the effects were not the same everywhere at the same time, as pointed out in a recent paper published in Nature. Its authors commented that peak cold occurred at widely-spaced locations hundreds of years apart. Coldest temperatures occurred during the fifteenth century in the central and eastern Pacific Ocean. But by the seventeenth century it was coldest in northwestern Europe and southeastern North America.

In contrast the same study found that the warmest period of the past two millennia occurred during the 20th century. The warmth affects more than 98% of the globe. That constitutes solid evidence that modern human-caused global warming is unusual. As the paper says, it is, "unparalleled in terms of absolute temperatures and also unprecedented in global coverage within the past 2,000 years".

Please use this form to provide feedback about this new "At a glance" section. Read a more technical version below or dig deeper via the tabs above!


Further details

One of the most often cited arguments of those who deny anthropogenic global warming is that the Medieval Warm Period (800-1200 AD) was as warm, or even warmer, than today. Using this as proof to say that we cannot be causing current warming is a faulty notion based upon rhetoric rather than science. So what are the holes in this line of thinking?

Firstly, increasing evidence suggests that the Medieval Warm Period may have been warmer than today in parts of the globe such as in the North Atlantic. The warming thereby allowed Vikings to travel further north than had been previously possible because of reductions in sea ice and land ice in the Arctic. However, evidence also suggests that some places were much cooler than today, including the tropical Pacific. All in all, when the warm places are averaged out with the cool places, it becomes clear that the overall warmth was likely similar to early to mid 20th Century warming.

Since that early 20th Century warming, global temperatures have risen well beyond those reached during the Medieval Warm Period. The National Academy of Sciences released a report on climate reconstructions in 2006. In the Overview chapter, the authors stated it was 'likely' that current temperatures are hotter than during the Medieval Warm Period, saying the following:

"Presently available proxy evidence indicates that temperatures at many, but not all, individual locations were higher during the past 25 years than during any period of comparable length since A.D. 900".

Further evidence obtained since 2006 suggests that even in the Northern Hemisphere, temperatures have now gone well beyond those experienced during Medieval times (Figure 1). This was also confirmed by a major paper from 78 scientists representing 60 scientific institutions around the world in 2013. A Skeptical Science blog-post about the publication may be read here.
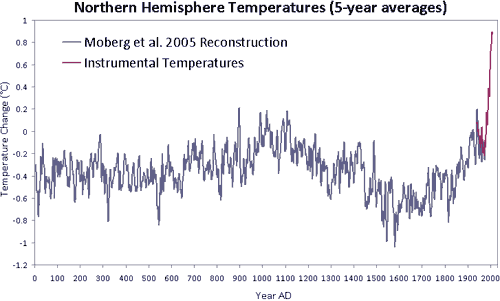
Northern Hemisphere Temperature Reconstruction. 

Figure 1: Northern Hemisphere Temperature Reconstruction by Moberg et al. (2005) shown in blue, Instrumental Temperatures from NASA shown in Red.

Secondly, the Medieval Warm Period has known causes. These explain both the scale of the warmth and its regional pattern. Importantly, both self-evidently differ from the modern-day warming caused predominantly by human activities. Based on global paleoclimate reconstructions over the past 2,000 years, a 2019 study found absolutely no evidence for pre-industrial globally-coherent cold or warm epochs. Instead, it found that the warmest period of the past two millennia occurred during the twentieth century and covered more than 98% of the globe. The paper concluded, "not only unparalleled in terms of absolute temperatures but also unprecedented in spatial consistency within the context of the past 2,000 years."

In the same paper, the authors commented that, in particular, the coldest epoch of the last millennium, long referred to as the Little Ice Age, seems to have seen peak cold at widely-spaced locations and hundreds of years apart, strongly emphasising both the regionality and non-synchronicity of the events. Coldest temperatures occurred, "during the fifteenth century in the central and eastern Pacific Ocean, during the seventeenth century in northwestern Europe and southeastern North America, and during the mid-nineteenth century over most of the remaining regions."

Overall, our conclusions are:

  1. Globally temperatures are warmer than they have been during the last 2,000 years;
  2. Both warmth and cold seem to have occurred at times in the last 2000 years but only on a regional and non-synchronous basis.
  3. the causes of Medieval warming are not the same as those causing late 20th century warming.

Last updated on 9 May 2024 by John Mason. View Archives

Printable Version  |  Offline PDF Version  |  Link to this page

Argument Feedback

Please use this form to let us know about suggested updates to this rebuttal.

Acknowledgements

Many thanks to gp2 who generated the temperature pattern for the last decade based on NOAA data.

Denial101x video

Here is a related lecture-video from Denial101x - Making Sense of Climate Science Denial:

Fact brief

Click the thumbnail for the concise fact brief version created in collaboration with Gigafact:

fact brief

Comments

Prev  1  2  3  4  5  

Comments 101 to 114 out of 114:

  1. Crowly 2010 is using old TSI reconstructions that have been updated. Refer to my post from Lief.org slide 7. Hence, this paper has little bearing on the reason that the MWP was a warm period. It is obvious that TSI was/is NOT a factor in the MWP temperatures. Volcanoes are short lived and unless we had had a super erruption, would not be detectable in the resolution of the proxy data presented for the temps of the MWP. Once again, based on the current science published, why were temperatures higher in the MWP?
  2. As far as being global, it does certainly seem that the MWP was global. Southern South America temp proxy record. This study is done on Southern SA temperatures, the results indicate that the Southern South America region recognizes proxy data that supports temperatures within the expected anamoly of the NH MWP R. Neukom et al
  3. Camburn, have you actually stated when the MWP occurred, i.e. what dates were globally warmer than current temperatures ?
  4. Camburn @103, Neukom et al present a reconstruction of summer temperatures for Southern South America only. Last time I looked, the year was not 3 months long, nor the Southern Hemisphere confined to Southern South America. Consequently it is impossible to legitimately draw the conclusion you make from the data you link. More importantly, Neukom et al show a cool period from 950 to 1200 AD, coinciding with the warmest period of the NH MWP. The show a warm period from 1200 to 1400, after which temperatures decline sharply to the coldest in the record, two centuries before the Maunder Minimum and the end of the NH MWP. In other words, averaging this temperature reconstruction with NH temperature reconstructions would smooth out the record, lowering reconstructed temperatures at the beginning and end of the MWP, while raising them in the period shown as the coolest part of the MWP in most NH reconstructions. Ignoring the details of the reconstruction as you have done is entirely uncalled for, and is contrary to good scientific practice. I note that your 101 consists of a serious of dubious claims made with no supporting evidence. If you want to debate by sloganeering, as your 101 suggests you want to, then you have nothing interesting to contribute to the debate and do not warrant response.
  5. JMurphy: You need me to supply dates? From the multitude of posts you have through out this forum, one would have thought you had dates of this period firmly established. The dates that seem to be well established are 850-1300AD +-(50 years). The proxy data does not have enough resolution to isolate it to a precise year. As far as temps being warmer than current, the resolution of the proxy data used in MWP reconstructions is NOT defined enough to state with certainty that it warmer presently than at some period during the MWP. And in fact, that isn't even an issue. The isue at hand is WHY it was as warm during the MWP as it was. Current solar data is very upfront in showing that the cause of warmth was not solar/TSI related. Volcanism was not a contributor as the time scale of temperature disruption from volcanoes is not long enough to be a variable, and the resolution of the proxy data would not show it anyways.
  6. Camburn#101: Once again, the horns of a dilemma. You state that TSI was not a factor, yet you want higher temperatures? That demands high sensitivity. But you've been told that high sensitivity is unacceptable. Then you can't have those higher temps. You're at Door#3, just open it. Here's a peek inside: To claim the Medieval Warm Period was warmer than today is to narrowly focus on a few regions that showed unusual warmth. However, when we look at the broader picture, we see that the Medieval Warm Period was a regional phenomenon with other regions showing strong cooling. As Tom C just pointed out, Neukom 2011 is not a global study. It is interesting, however, that they find the 'warmest' DJF decade in southern Patagonia to be 1079-1088, with an anomaly of +0.57C with respect to a 1901-1995 baseline. A GISSTemp polar map (land only) shows the same area to have an anomaly of 0.2-1C for the decade 1996-2005 (same 95 year baseline). So Neukom does not support the claim that MWP was warmer than present, even on a local basis. And yes, that is the issue. If MWP was not warmer than present, there is no 'why.'
  7. Camburn @105, your last two sentences are false as is shown by Crowley 2000 (accidently referenced by me as Crowley 2010 in an earlier post). You may not like the conclusions of that paper, but they are none-the-less backed up by evidence, unlike your assertions. More recent work continues to show the significance of solar and volcanic forcings in the MWP>
  8. The last study of global, full year proxies over MCA would be Mann 2009. From that accumulation of many proxies world wide, you get two stand out features - 1/ anomaly varied in timing from one region to another (unlike today), 2/ it was not global. I dont see published evidence to contradict either conclusion so far. You might like to read the methods bit of 2009 about treatment of individual proxies so you dont go cherry-picking.
  9. Tom C: Your statement 'more recent work continues to show... ' (citing Swingedouw et al 2010) is only partially correct. That paper used the same TSI reconstructions as were used in 2000: The TSI variations that we use are deduced from the Bard et al. (2000) reconstruction and are the same as the one used by Crowley (2000). Bard 2000 (data here) is a radioisotope study; Crowley is heavily dependent on Bard's Be10 and C14 proxies. Crowley's figure 2 (in full scale pdf) makes this clear: More importantly, the bottom panel in the figure demonstrates that recent forcing - from GHGs - is utterly unprecedented on this time scale. We have in fact made the 'MWP' vanish.
  10. Tom@107: Please look at slide 7 of this presentation and tell me how solar/TSI caused the MWP. TSI and MWP comparisons. muoncounter: I havne't had a chance to read Crowley 2000 yet, but the presentation of your bottom pannel is very telling. I will also re-examine Mann 2009. It has been some time since I have read his last paper.
  11. muoncounter, Tom, scaddenp: I appreaciate your comments. I do think you are missing my thought process to a point tho. When I look at temp reconstructions of the MWP, and look at current temperatures, I look at the scaling of the data. The upturn in temperatures currently, would not as of yet made much of an impression on the reconstructions. I used to agree that TSI was the predominant factor in the temperature rise of the MWP. New reconstructions of TSI, which we hope are more accurate, show that TSI was not an influence of increase during the MWP. Door 3 may be the logical conclusion. I have opened it, but I have not as yet stepped through it.
  12. Camburn#111: "upturn in temperatures currently, would not as of yet made much of an impression on the reconstructions." That is just not true (and it certainly is unsubstantiated). See Fig 1 in Mann et al 2009: The reconstructions there show the MCA (formerly known as MWP) as well below +0.5C; we are now well above +0.5C. More significantly, the recent rate of change of temperature anomaly is unprecedented in the 1500 year proxy record.
  13. Muoncounter @109, while I agree that we have "made the MWP vanish" in terms of relative forcings, that is not germane to the issue of the total forcings in the MWP. Of those forcings, the three main components are the solar forcing, the volcanic forcing and the GHG forcing. Despite first glance appearances in the figure you reproduce, GHG forcings are significant relative to other forcings in the MWP as a comparison of the scales of the y-axis will show. It should be noted that just prior to 1000 AD, GHG forcings fall to approximately LIA levels again, although that is not shown by Crowely 2000. My purpose in quoting Swingedouw et al 2010 was to rebut Camburn's contention that Crowley was so obsolete that it can be ignored. That a 2010 study uses Crowley's figures for solar forcing just emphasizes that point. For course Swingedouw et al use Amman et al 2007 for volcanic forcings, but the pattern is still very similar, although with less volcanism in the MWP. I have to admit I am puzzled as to your reason for pointing out that Crowley's reconstruction of TSI depends on isotope data. Prior to 1600 and reliable sunspot counts, what else could it be based on?
  14. Camburn, the sources you have used (as well as others available via those sources) give plenty of information which should show you how unlikely it is that the MWP was global and/or contemporaneous; how unlikely it is that many temperatures were as high as they are today; how much resolution is actually possible, and what are the probable causes of the warming of that period. Here are some of the highlights, giving linked references where they are separate from your own references, which I assume you are already conversant with - but you may have missed the relevant parts I have picked-out : ENSO variability continued as now but oscillating about a colder mean state. ...cooler tropical Pacific Ocean... ...drier in southern South America, wetter in northern South America and Central America, wetter in the Sahel region of Africa but drier in coastal east Africa and drier in parts of the Mediterranean and southern Europe. (From your first relevant link, which is more particularly detailed with regard to Western USA) When the Z-C [ZebiakCane ENSO] model is forced in this way [with changing volcanic forcing and solar irradiance over the past 1000 years], eastern tropical Pacific SSTs tend toward a cool, La Nina–like base state during the model run's early period (circa AD 1100 to 1250) of high solar irradiance and reduced volcanism. Long-Term Aridity Changes in the Western United States - Cook et al, 2004 (Paper referenced in your first link) ...temperatures in the Medieval Warm Period are comparable to those in the current warm period over China, and the effect of solar activity on climate cannot be neglected in any period of the millennium climate change. (From your second relevant link which I didn't really find to be the "confirmation" you labelled it) The following were found from that second link and are generally concerned with China rather than the increasing region you ended up describing (China/and the surrounding area/Asia) : The effective solar radiation and solar irradiance have significant impacts on the temporal variation of both temperature and precipitation. Volcanic activity plays an important role in the sudden drop of temperature before the Present Warm Period (PWP). There is a positive correlation between precipitation and volcanic activity before 1400 A.D., and a negative relationship between the two thereafter. The concentration of greenhouse gases increases in the PWP, and the temperature and precipitation increase accordingly. The warmest epoch in the MWP covered half of the 12th century. The increasing trend of temperature with model results is consistent with the variation in the instrumental data on the inter-decadal time scale, and exceeds the maximum temperature in the MWP after 1920 A.D Simulated analysis of summer climate on centennial time scale in eastern China during the last millennium - Wang et al, 2011 During past two millennia, a warming trend in the 20th century was clearly detected, but the warming magnitude was smaller than the maximum level of the Medieval Warm Period and the Middle Holocene. ...but the warming of the Medieval Warm Period (AD 900–AD 1300) was not distinct in China, especially west China Temperature and precipitation changes in China during the Holocene - Quansheng et al, 2007 To compare differences among the Medieval Warm Period (MWP), Little Ice Age (LIA), and 20th century global warming (20CW), six sets of transient and equilibrium simulations were generated using the climate system model FGOALS_gl. The results indicate that MWP warming is evident on a global scale, except for at mid-latitudes of the North Pacific. However, the magnitude of the warming is weaker than that in the 20th century. The warming in the high latitudes of the Northern Hemisphere is stronger than that in the Southern Hemisphere. A comparison of the Medieval Warm Period, Little Ice Age and 20th century warming simulated by the FGOALS climate system model - Zhou et al, 2011 Our data indicate that we are in the middle of the 260-yr-long relatively dry period and suggest that this climate will persist for about another century before the next 130 yr of relatively wet climate. The human-induced global warming over the past century, however, may add its own effects on top of this 400-yr cycle and exacerbate the intensity of natural fluctuation and drought Possible solar forcing of century-scale drought frequency in the northern Great Plains - E.Yu & E.Ito, 1999 From your third relevant link : In winter, the decadal-scale pre-1901 temperature anomalies mostly remain below the twentieth century average. Within the twentieth century, the 30-year filtered anomalies of both seasons do not exceed the uncertainty range of warm periods in previous centuries. Our spatial reconstructions indicate differences in the low and high frequency variability between the subregions of SSA. This study clearly revealed that temporally and spatially highly resolved multi-centennial climate field reconstructions are also possible in the SH. Nevertheless, skill values are still rather low and there is a striking lack of annually resolved proxy data, especially from tropical and subtropical regions (see Boninsegna et al. 2009) and from the eastern lowlands of SSA.
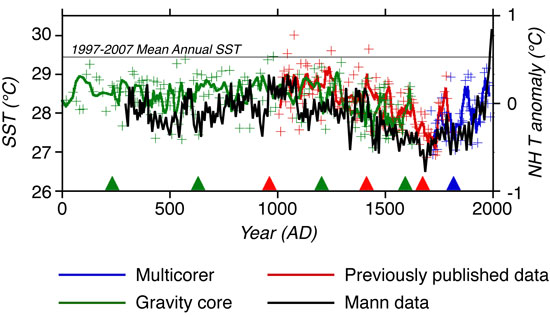
  15. I've always thought of the Medieval Warm Period as an example of Natural Variability. Found some examples of other proxy data being used for temperature reconstructions Woods Hole Oceanographic Institution Examines 2,000 years of sediment records for temperature reconstruction "A new 2,000-year-long reconstruction of sea surface temperatures (SST) from the Indo-Pacific warm pool (IPWP) suggests that temperatures in the region may have been as warm during the Medieval Warm Period as they are today." "Water temperature during the late Medieval Warm Period, between about A.D. 1000 to 1250, was within error of modern annual sea surface temperatures. (Oppo, Rosenthal, Linsley; 2009)" http://www.whoi.edu/page.do?pid=7545&tid=282&cid=59106&ct=162 Found another interesting page about sediment record analysis at Woods Hole, covering the Medieval Warm Period and the Little Ice Age http://www.whoi.edu/oceanus/viewArticle.do?id=3842 "Events warmer than today occurred about 500 and 1,000 years ago, during the Medieval Warm Period, and it was even warmer than that prior to about 2,500 years ago." "Because the Sargasso Sea has a rather uniform temperature and salinity distribution near the surface, it seems that these events must have had widespread climatic significance. The Sargasso Sea data indicate that the Medieval Warm Period may have actually been two events separated by 500 years, perhaps explaining why its timing and extent have been so controversial. Second, it is evident that the climate system has been warming for a few hundred years, and that it warmed even more from 1,700 years ago to 1,000 years ago." This graph of the Sargasso Sea Surface Temperature, reconstructed from sediment cores, shows what they are talking about http://www.whoi.edu/oceanus/viewImage.do?id=8722&aid=3842 More data on reconstructed temperatures around the world from the Medieval Warm Period is available at the Woods Hole web page. Go there and search for 'Medieval Warm Period' http://www.whoi.edu/search.do?q=Medieval+Warm+Period&g=ext&search=Search&type=search Paper offering high resolution temperature proxy data from an Alaskan lake over the past 6,000 yrs, derived from midge analysis on the sediments. Shows temperatures there were higher in the past 3,000 yrs than today"Although the Moose Lake TJuly record displays an increasing trend over the past 150 years, the TJuly values in several warm intervals of the past 6000 years were comparable to or exceeded early 20th-century values. For example, the TJuly values during the MCA were generally higher than the early 20th-century values (Fig. 4C). " http://www.life.illinois.edu/hu/publications/Clegg_et_al_2010.pdf Chris Shaker
  16. Also, this AGU published research paper, "Evidence for a ‘Medieval Warm Period’ in a 1,100 year tree-ring reconstruction of past austral summer temperatures in New Zealand". http://ruby.fgcu.edu/courses/twimberley/EnviroPhilo/CookPalmer.pdf Chris Shaker
  17. Chris, in what way do you think Cook & Palmer challenges consensus? (I mean its used in the Mann/Jones 2003,2004 papers). Also did you follow up and look at their 2006 paper. Of course, MCA/MWP is example of natural variability. But not of unforced variability. Instead of cherry picking particular proxies, tell what is wrong with the methodology of the Mann 2009 paper which integrates them all for a global picture.
  18. cjshaker, there's a nice 'hockey-stick' available at the first link you provided :
  19. Tom Curtis at 13:17 PM on 9 February, 2012 ".....the implicit claim that the MWP was globally warmer than the last two decades for the entire period of the MWP is refuted by the same comparison..." Tom, I'm not sure that IS the claim. The argument is that there exists in various worldwide proxy records some evidence that there was an unknown driver of a temperature elevation which was evident globally within a certain time bracket.(and referred to as The Medieval Warming Period). Whether it was precisely co-incidental is perhaps not of great importance, should a spate of extreme high temperatures such as that be observed today, surely we would label it as evidence of "Global Warming"?
  20. markx @ 119: "Whether it was precisely co-incidental is perhaps not of great importance" Actually, I think it is of great importance. If there were warm periods, but they were at different times in different locations, then that is merely evidence that the earth's climate is somewhat variable. On the other hand, right now, it's warmer everywhere at the same, which seems to be unprecedented for at least the past six or seven thousand years. When it comes down to it, though, it's not just about whether the climate was warmer / cooler in the past. It's about what caused those warmer / cooler periods. And right now, there's only one explanation that stands up to scrutiny for the current warming (hint: it doesn't involve the word 'natural').
  21. If it has unknown driver, then why do we see something like MCA in forcing-based models? (See the AR4 discussion). That is not to say that there is a strong consensus of mechanisms, especially for the regional distribution, but its not a great mystery.
  22. Bern at 15:50 PM on 26 March, 2012 said: "..... It's about what caused those warmer / cooler periods...." That is indeed why these periods are of so much interest to many. scaddenp at 05:38 AM on 27 March, 2012 said: "...If it has unknown driver, then why do we see something like MCA in forcing-based models? (See the AR4 discussion)...." Thanks scad - I'd be interested to see the modelled MWP, and information on what the drivers were, but I wandered around those threads, most discussion is post 2000, with an occasional chart going back to 1990, and even one from 1900, but I found no mention of the MWP/MCA? Further comment: Recent research on the Antarctic discusses an MWP signal there as well? Again, timing is an issue, but it is still an interesting phenomenon. http://www.dailymail.co.uk/sciencetech/article-2120512/Global-warming-Earth-heated-medieval-times-human-CO2-emissions.html Abstract here http://www.sciencedirect.com/science/article/pii/S0012821X12000659
    Response: [Riccardo] links fixed
  23. Markx - see Chpter 6 of AR4, WG1 ("Paleoclimate"), for compilation of modelling that had been done at time of publication, compared to proxy reconstructions. Have you read Mann et al 2009?
  24. Thanks scad. I’ll have good look at that. Yes, I have a copy of "Global Signatures and Dynamical Origins of the Little Ice Age and Medieval Climate Anomaly" Mann etal 2009. It worries me a bit in that it is a modelled set of data (world temperature anomalies: see Fig 2) for which there are only 6 available proxy sources in the southern hemisphere, and four of those (at least) show a warming signal, yet the SH hemisphere is largely mapped as having cooled during the MWP.
  25. Perhaps time to look closely the supplementary material? here (rather more proxies, and note the sensitivity tests). Note that the AR4 predates this paper too.

Prev  1  2  3  4  5  

Post a Comment

Political, off-topic or ad hominem comments will be deleted. Comments Policy...

You need to be logged in to post a comment. Login via the left margin or if you're new, register here.

Link to this page


The Consensus Project Website

THE ESCALATOR

(free to republish)


© Copyright 2024 John Cook
Home | Translations | About Us | Privacy | Contact Us