Climate Science Glossary

Term Lookup

Enter a term in the search box to find its definition.

Settings

Use the controls in the far right panel to increase or decrease the number of terms automatically displayed (or to completely turn that feature off).

Term Lookup

Settings


All IPCC definitions taken from Climate Change 2007: The Physical Science Basis. Working Group I Contribution to the Fourth Assessment Report of the Intergovernmental Panel on Climate Change, Annex I, Glossary, pp. 941-954. Cambridge University Press.

Home Arguments Software Resources Comments The Consensus Project Translations About Support

Bluesky Facebook LinkedIn Mastodon MeWe

Twitter YouTube RSS Posts RSS Comments Email Subscribe


Climate's changed before
It's the sun
It's not bad
There is no consensus
It's cooling
Models are unreliable
Temp record is unreliable
Animals and plants can adapt
It hasn't warmed since 1998
Antarctica is gaining ice
View All Arguments...


Username
Password
New? Register here
Forgot your password?

Latest Posts

Archives

Are we heading into a new Ice Age?

What the science says...

Select a level... Basic Intermediate

Worry about global warming impacts in the next 100 years, not an ice age in over 10,000 years.

Climate Myth...

We're heading into an ice age

"One day you'll wake up - or you won't wake up, rather - buried beneath nine stories of snow. It's all part of a dependable, predictable cycle, a natural cycle that returns like clockwork every 11,500 years.  And since the last ice age ended almost exactly 11,500 years ago…" (Ice Age Now)

At a glance

In something like a Day after Tomorrow scenario, the idea that a new ice-age was just around the corner was the subject of a book, a DVD and a website created in 2002. The author was a retired architect, by the way. Fortunately for us, both the movie and the quote above are figments of someone's fertile imagination. But let's have a quick look at ice-ages and what makes them tick, after which we hope you will agree that the notion that another ice-age is just around the corner is nonsensical.

Ice-ages, also known as glacials, are cold periods that occur in a cyclic fashion within an Icehouse climate state. Earth's climate has been mostly of the Hothouse type (no Polar ice-sheets). However, on occasion it has cooled down into Icehouse, as has been the case in the last few million years. There are regular variations in Earth's orbit around the Sun, taking place over tens of thousands of years. These affect the amount of Solar radiation reaching our planet. During the Icehouse state, such variations can lower and raise planetary temperature sufficiently to trigger swings between cold glacials – when ice-sheets expand towards the Equator – and mild interglacials – when the ice retreats back polewards.

To give an idea of the time-scales involved, Europe and North America have seen glacials and interglacials come and go repeatedly over the last 2.5 million years, this being known as the Quaternary Period of geological time. The last glacial period started 115,000 years ago and the Last Glacial Maximum (LGM), when the greatest ice extent was reached, was around 22,000 years ago. The current interglacial – also known as the Holocene, commenced 11,700 years ago.

A general pattern may be seen here with a long cooling down towards Glacial Maximum but a relatively quick warming into an interglacial. The speed of the warming-up part of the cycle is due to climate feedbacks. Removal of pale, reflective snow and ice cover revealing the darker ground beneath allows more solar heat energy to be soaked up. Melting of permafrost releases carbon dioxide and methane. These and other feedbacks serve to amplify the warming effect, speeding it up.

However, our burning of fossil fuels has happened on such a vast scale that we have blown such factors apart. The atmospheric concentration of CO2 has risen well above the 180-280 ppm range typical of recent glacial-interglacial cycles. The current level, getting on for 420 ppm, is more typical of the mid-Pliocene. That was a geological epoch that happened around a million years before the start of the Quaternary. Mid-Pliocene ice-sheets were much smaller than those of the present day. Rather than being due another glaciation, we can expect a continued transition towards mid-Pliocene conditions.

Please use this form to provide feedback about this new "At a glance" section, which was updated on May 27, 2023 to improve its readability. Read a more technical version below or dig deeper via the tabs above!


Further details

Because our current interglacial (the Holocene) has already lasted approximately 12,000 years, it has led some to claim that a new ice age is imminent. Is this a valid claim? No.

To explore this topic further, it is necessary to understand what has caused the cyclic shifts between ice ages and interglacials during the Quaternary period (fig. 1). Such shifts are in part a response to regular changes in the Earth’s orbit and tilt, which affect the amount of summer sunlight reaching high northern latitudes and were described by the Milankovitch Cycles, first proposed in the early 20th Century by Serbian mathematician Milutin Milankovitch (1879-1958). For more about Milankovitch cycles this NASA page offers lots of graphics and explanations.
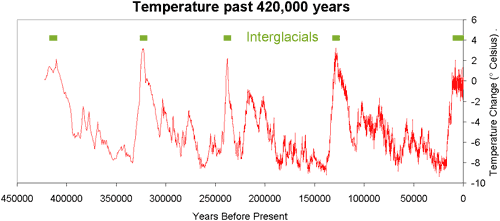
Figure 1: Temperature change through the late Quaternary from the Vostok ice-core, Antarctica (Petit et al. 2000). The timing of warmer interglacials is highlighted in green; our current interglacial, the Holocene, is the one on the far right of the graph.

When incoming sunlight declines in the high north, the rate of summer snow and ice-melt declines and the ice sheets begin to grow. When incoming sunlight increases, the opposite happens. So where are we in these cycles today? Changes in both the orbit and tilt of the Earth do indeed indicate that – were they singularly responsible for climate shifts - the Earth should be slowly cooling. However, recent research shows that is too simple. That's because we now have analyses of ice-cores going back 800,000 years or more. We have devised ways to use stable isotope ratios of various elements in things like fossils and we have developed many other proxy methods for telling us more about conditions in the relatively recent past that the Quaternary represents.

A number of irregularities in glacial-interglacial cycles have been determined, for example times when interglacials were skipped when orbital patterns suggest they should have happened. (Koehler and Van de Wal 2021). Such research has also been aimed at resolving the question of why Earth's 41,000 year obliquity cycle was a strong driver of glacial-interglacial transitions up until around one million years ago. Since then, glacials have instead typically lasted for much longer - around 100,000 years.

The importance of feedbacks within Earth's climate system has been increasingly recognised as the decades have gone by. A good example is the speed of transition from glacial to interglacial, which is relatively rapid because certain very effective climate feedbacks are involved. One such feedback involves albedo, defined as the ability of different bodies to absorb or reflect sunlight (e,g, Thackeray and Fletcher 2016).

Albedo is expressed on a scale of 0 (black body, absorbs everything) to 1 (white body, reflects everything. Fresh snow has a high albedo of as much as 0.9, whereas the muck revealed when old snow and ice cover melts has a much lower one in the range 0.2 to 0.4 – it can absorb lots more solar energy. So melting snow and ice leads to more heat energy retention, amplifying the warming (Fig. 2). 
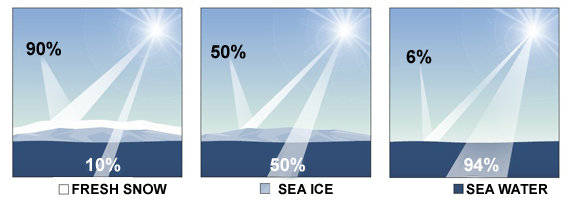
Albedo Explainer (John Mason)

Fig. 2: Albedo feedback explained. Freshly-fallen snow is highly reflective of incoming sunshine, so that most of the solar energy is simply bounced back towards space. Bare sea ice can potentially absorb about half of the incoming energy, so if conditions become warmer, causing the snow to melt, there’s more energy retained on Earth. If the sea ice melts too, then almost all of the incoming solar energy is absorbed by the much darker surface of the sea. So an initial warming directly results in further warming. Graphic: John Mason.

Another feedback happens when permafrost gets thawed out, since the ground is then able to release previously trapped CO2 and methane. During a glacial, the extent of permafrost is vast, so as it thaws, the release of such gases occurs on an enormous scale – again, amplifying the warming.

Researchers have also modelled ice-sheet dynamics, investigating how the sheets behaved as they melted, for example. It has been found that the shorter-lived, lower latitude Northern Hemisphere ice-sheets that existed prior to one million years ago were much thinner and therefore easier to melt. So ice-sheet dynamics looks to have a role in the much longer freeze-ups of the past million years. This all goes to show that glacial periods arise through a whole lot of factors interacting with one another, of which orbital cycles are but one, albeit important, cog in the gearbox and are not necessarily able to drive the climate system from one state (glacial) to another (interglacial) in total isolation (e.g. Bintanja and Van de Wal 2008; Berends et al. 2021).

Talking of cogs in the gearbox, we are another – and a big one. Our intentional disturbance of carbon reservoir rocks – what we do when we seek, extract and burn the fossil fuels – is unique in the geological record. It's a one-off in the planet's 4.56 billion year long history and while the consequent overloading of atmospheric CO2 levels is still insufficient to take Earth back into a Hothouse state yet, it is perfectly adequate to prevent another glaciation any time soon.

Last updated on 27 May 2023 by John Mason. View Archives

Printable Version  |  Offline PDF Version  |  Link to this page

Argument Feedback

Please use this form to let us know about suggested updates to this rebuttal.

Further reading

Tamino discusses predictions of future solar activity in Solar Cycle 24.

Acknowledgements

Many thanks to Sami Solanki for his invaluable advice and feedback as well as John Cross for his very helpful comments.

Further viewing

potholer54 published a video tackling this myth on June 27, 2020


Dave Borlace explains why we are not headed towards an ice age in this "Just have a think" video published in December 2019:


Denial101x video

Comments

Prev  1  2  3  4  5  6  Next

Comments 101 to 125 out of 143:

  1. Mr Loeber, you appear to believe that the best way to describe the state of the climate is by seeking out every report of a cold snap somewhere, sometime, and highlighting it. That's a good way to fool yourself, but not a good way to understand objective reality. Maximiliano Herrera has compiled data on met stations that set new high or low records every year since 2002. So far, in 2010 there have been 337 warm records versus 13 cool records. In 2009, the ratio was 80 (warm) to 15 (cool). In 2008, it was 40 (warm) to 18 (cool). In 2007, it was 133 (warm) to 9 (cool). And so on... Your comment "It is my opinion that the greatest danger we face is epistemic relativism. Might does not make right. Majority opinion does not determine truth. Observe to formulate opinions ad infinitum. Don't opinionize to formulate what you can and cannot observe." is highly ironic. Rather than being convinced by the objectively straightforward warming trend, you rely on anecdote, cherry-picking, and appeals to emotion.
  2. My post @ 96 should have read: "And a correction to my previous post. No nations, to my knowledge, have set all-time record cold temperatures in 2010, not one." And the experts concur with CBDunkerson's thoughts on noctilucent clouds: Here is some information In which they state: "First sighted in 1885 in Northern high latitudes, noctilucent, or night shining clouds occur in the summer in the mesosphere, which is the coldest part of the atmosphere. Cloud formation is possibly hastened by increasing amounts of carbon dioxide in the atmosphere. While CO2 is thought to contribute to global warming on Earth, it actually cools the high atmosphere. In recent years, noctilucent clouds have begun appearing closer to the equator." And some more here. In which they say: "Ironically, greenhouse gases like CO2 that warm Earth's lower atmosphere also cool the upper atmosphere, possibly enhancing conditions for ice crystal formation, said Rusch, lead scientist for the Cloud Imaging and Particle Size experiment, or CIPS"
  3. Only one record low in one nation this year? This article must be mistaken http://en.trend.az/regions/world/ocountries/1725799.html and this one http://english.ruvr.ru/2010/07/15/12419233.html and this one http://pgosselin.wordpress.com/2010/07/15/record-cold-set-in-antarctica/ and this one http://www.nzherald.co.nz/nz/news/article.cfm?c_id=1&objectid=10658655 and this one http://latimesblogs.latimes.com/lanow/2010/07/record-cold-at-lax-airport-as-july-gloom-continues-in-southern-california.html and this one http://www.signonsandiego.com/news/2010/jul/06/grsq-dreary-clouds-last-until-mid-week/ and this one http://joongangdaily.joins.com/article/view.asp?aid=2921285 and this one http://journalnet.com/news/local/article_10a69c4e-6c75-11df-b454-001cc4c002e0.html That is about half of this year. I could go back more but I think of the above you will fine at least two that are fairly reputable that list record cold temperatures in different nations. Mr. Bostrom, that paper I commented on earlier also states that the extent of the noctilucents has never exceeded as when they were first noticed. That is convenient for his argument that they play no significance in climate change but it is absolutely false. You don't see the data though in his paper as he only takes a slice, less than 36% the time they have been observed. Mr. Murphy, I stand corrected. I see the notices that last year or maybe the year before then, England had its coldest winter in at least 30 years and some reports say more than 100 years. I cannot continue with this. I do have a life and this is a message board and as such it is linear and people can post more than their proven worth. I will leave you with one suggestion, don't trust the summaries written up by prominent scientists or organizations. The internet gives you a good start at going and looking at the evidence yourself. There are strong, violent and intolerant forces at work that have been swaying public and private opinions for generations and they continue to play a dominant role, IMHO.
    Response: You must post comments on weather on this thread: It’s freaking cold!. Further comments on that topic on this page will be deleted--that's comments by you and by anyone else.
  4. Tom, please read other people's posts very carefully. I was talking about all time record maxima and minima. Regardless, as Ned showed nicely @101, record highs are far outpacing record minima. Yes, and I have a life too. Tuning you out then.
    Response: Please post comments--even responses--regarding weather on the thread It’s freaking cold!.
  5. Tom Loeber, your first link mentions a "worst cold spell in 46 years"; the second mentions the "lowest temperature this year"... I give up. You just do not understand the comparison between, say, a 'record since records began', and 'a record this year'. You seem to see the word 'record' and think that is everything. It isn't : what you are so excited about is called 'weather'. As for "some reports say more than 100 years", prove it. It's not worthwhile anyone bothering to check anything you type out anymore. Finally, and most bizarrely, you suggest that we shouldn't "trust the summaries written up by prominent scientists or organizations" - while you trust media reports and headlines; think the internet allows you to be an expert in whatever you feel like, and end up with conspiracy theories. You have nothing, I'm afraid, but you think you have everything.
    Response: Continue discussion of individual weather events on the relevant thread It’s freaking cold!.
  6. Sorry about my last comment, which should be posted elsewhere as suggested - I didn't see the Moderator's suggestion before I posted. This will be my last on this subject here.
  7. Re #104, sorry moderator......
  8. Redirecting extrema discussions to "It's freaking cold"... please see for comment.
    Response: Thank you!
  9. I'm trying again. There are reports of all time historical record lows in a number of countries this year that I attempted to post and if this works, I'll try to do it again. Does appear as if I was banned. JMurphy is right and I was wrong. England did not receive an all time record cold winter recently. Actually it was the coldest in anywhere from 30 to 140 years according to numerous posts and findings.
    Response: You are posting on the wrong page. Off topic posts are deleted. I'll give you some time to see this reply by me, and then I will delete your comment. Go to the page "It's Freaking Cold!"
  10. Tom Loeber - try posting it on topic, in the it's freaking cold thread. Off topic posts (in this case, individual extrema data on the Ice Age thread) get deleted.
    Response: Exactly.
  11. Tom Loeber, I have replied to you at Does cold weather disprove global warming?/It's freaking cold! as requested.
    Response: Thank you.
  12. In the July 2003 pdf Doug Bostrom linked to, "Are Noctilucent Clouds Truly a 'Miner's Canary' for Global Change?"
    it is stated "Unambiguous observations of NLC go back to the summer of 1885,when NLC appeared above western Europe with a brightness and latitudinal extent which has never been reached again." As far as I can tell from the NASA graph I post above, their first siting was surpassed in the 1950s as well as the 1960s for the extent of that graph. Why does the pdf misrepresent the situation? How come it only considers its hypothesis that noctilucents play no role in climate change on less than a third of the time they have been observed? Isn't the fact that there is no record of them being observed prior to the industrial revolution of significance?
  13. It appears to me that most of the warming we have seen over the past 14,000 years is from the natural glacial cycle. I'm posting some references about what we know about the glacial cycle, from the proxy temperature record extracted from the ice cores, in hopes that someone will be able to provide me with better ones. I remain dismayed at how hard it is to find accurate descriptions of the glacial cycle. Over the past 800,000 years, we've had at least 8 glacial cycles, each about 100,000 years long, consisting of roughly 90,000 years of advancing ice followed by roughly 10,000 years of warmth. Sometimes, the warm period has been up to 23,000 years long. http://www.sciencemag.org/cgi/content/abstract/289/5486/1897 http://www.sciencemag.org/cgi/content/full/289/5486/1897 This National Geographic web page mentions that the highest and lowest temperatures obtained from analysis of the ice cores spanning the past 800,000 years occurred during our most recent glacial cycle. The hottest temperature was 4.5 degrees Celsius warmer than today. That was 130,000 years ago. http://news.nationalgeographic.com/news/2007/07/070705-antarctica-ice.html It seems interesting to me that record high and low temperatures, and the glacial maximum, for the past 800,000 years were set during this most recent glacial cycle! According to some sources, we're about 14,000 years into this warming phase. Given that the maximum temperature during the last warming phase was about 4.5 C warmer than today, it seems likely that we'll continue to see much warmer temperatures and sea levels during this warm phase, just due to the natural glacial cycle. This source gives a history of the science behind our understanding of the past glacial cycles. http://www.aip.org/history/climate/cycles.htm It seems to show that the end of this warm period is fairly near. Chris Shaker
  14. How does this warming phase look different from the previous seven warming phases during the past 800,000 years? So far, I have not been able to find a graph of the derivative of the glacial cycle temperature record. Would that not be interesting to show the rate of change during the warming phases, and compare this one to previous ones? Chris Shaker
  15. cjshaker the comparison you're asking for does not make much sense to me. The glacial cycles are driven by orbital variations and we should be in a cooling phase. Also, glacial terminations are quite slow events and we do not expect rapid changes. Anyways, using DomC data (divided by two to account for polar amplification) my crude estimate of the largest warming rate during the last glacial termination is of the order of 0.002 °C/yr. Now we're running about 10 times faster.
  16. I see very few good references on the glacial cycle, and its effect on our climate. I see obviously false references at places like Factoidz, claiming that there have only been four glacial cycles in the history of the world. I started reading about what the ice cores have taught us about the glacial cycle. Temperature proxy records derived from deuterium measurements. At least 800,000 years of ice core records detailing the 100,000 year glacial cycle, composed of 90,000 years of cold and ice and only 10,000 years of warmth, on average. http://news.nationalgeographic.com/news/2007/07/070705-antarctica-ice.html http://www.sciencemag.org/cgi/content/abstract/289/5486/1897 http://www.sciencemag.org/cgi/content/full/289/5486/1897 If you're going to tell me that man's CO2 has become the dominant factor in the climate, you need to be able to describe where we would be in the glacial cycle without it. IE - what is the delta caused by CO2? As far as I can determine, over the past 14,000 years of the warming phase, most of that warming has been from the natural forces of the glacial cycle. How does this warm phase look different from the previous seven warm phases? Is there a graph comparing the shape of them? Taking the derivative of the temperature waveform to get the rate of change of the temperature waveform would be one way to compare the warm phases from the glacial cycle? As a failed electrical engineer (computer scientist), I see these graphs of the temperature records of the glacial cycle, and start wondering how they could be analyzed to predict where they would go into the future, with and without man's CO2. I did find several articles about research using spectral analysis of the glacial cycle Spectral Analysis of Climate Data, by P. Yiou, E. Baert, and M.F. Loutre http://www.nosams.whoi.edu/PDFs/papers/surveysingeo_time_series.pdf Evidence for decoupling of atmospheric CO2 and global climate during the Phanerozoic eon JaÂn Veizer*, Yves Godderis2 & Louis M. FrancËois http://mysite.science.uottawa.ca/idclark/courses/Veizer%20Nature%202001.pdf "The Predictability of Glaciation Cycles" http://www.igsoc.org/annals/5/igs_annals_vol05_year1984_pg213-214.pdf Chris Shaker
  17. "Blue represents an anthropogenic release of 300 gigatonnes of carbon - we have already passed this mark" Can you please tell me what time frame is this referring to?
  18. #117: "Blue represents an anthropogenic release of 300 gigatonnes of carbon" You've found a typo in the Intermediate Version -- John, this should refer to Figure 4. "Figure 3 examines the climate response to various CO2 emission scenarios." An excellent summary of CO2 emissions is available here. Although the cumulative emissions graph in their Figure 8 goes back to 1750, the caption states that one half of the 270 Gt as of the year 2000 was released from fossil fuel consumption since 1974. Tack on the last 10 years and we're well over the quoted 300 Gtons cumulative. See USEIA emissions data tables for the numbers.
  19. muoncounter: Thank you for your response and for the links. But, I'm having trouble making sense out of the Sicily paper as it relates to the EIA data. Here is the problem I am having: according to the EIA, between 1980 and 2006, globally, humans have cumulatively emitted over 600 Gton C from the "Consumption and Flaring of Fossil Fuels". (http://www.eia.doe.gov/pub/international/iealf/tableh1co2.xls). Roll in the link that you sent and we are up to 663 Gton C by 2008. Assuming an average increase in anthropogenic CO2 emission per year of 2%, and that puts us at a cumulative 725 Gton C for the last 30 years. If we want to say that global warming started in 1895 (http://www.time.com/time/magazine/article/0,9171,983504,00.html) due to the flaring of fossil fuels - (assuming a constant of a 2% increase per year (which may or may not be reasonable)) then we had to be well beyond 1000 Gton C by the year 2000 (this excludes the first 145 years of the industrial revolution). So, how is it that the Sicily paper has us at cumulative of only 270 Gton C between 1750 and 2000? Am I not comparing apples and apples here? If I've made an error, I hope you can help me see where I went wrong. Thank you.
  20. #119: The Sicily paper's data only goes up to 1998; here is the more recent version. On that page, they say 337 billion metric tons of carbon since 1750; half since the mid-70s. The difficulty is the conversion from carbon to CO2 is a factor of 3.664: 1 gram C = 0.083 mole CO2 = 3.664 gram CO2. Not quite apples and oranges, but still important. When you divide 650.7 Gtons CO2 (world cumulative from 1980-2008 from the tables here) by 3.664, you obtain 177.6 Gtons carbon, which is the same order of magnitude as 'half of 337 Gtons carbon since the mid-70s.' Someone here very patiently explained this to me the first time I found the same sort of inconsistency; I hope I've paid that forward for you. I did a breakdown of the carbon numbers by identifying segments with reasonably constant slope:
    	  cum carbon	avg annual rate
       period     (gtons)	(gtons/yr)
    1751-1910	19.2	0.1
    1911-1946	37.2	1.1
    1947-1979      102.4	3.2
    1980-2006      170.1	6.5
    As a result, it hardly seems like anything prior to early part of the 20th century is worth bothering over.
  21. Re: NQuestofApollo (119) To tack onto muoncounter's execellent comment to you at 120 above, there's these quotes from Dr Toby Tyrrell of the University of Southampton's School of Ocean and Earth Science at the National Oceanography Centre, Southampton, appearing in Science Daily:
    "Our research shows why atmospheric CO2 will not return to pre-industrial levels after we stop burning fossil fuels. It shows that it if we use up all known fossil fuels it doesn't matter at what rate we burn them. The result would be the same if we burned them at present rates or at more moderate rates; we would still get the same eventual ice-age-prevention result."
    and
    "Burning all recoverable fossil fuels could lead to avoidance of the next five ice ages."
    The Yooper
  22. Thank you, both, muoncouter and Daniel - I really appreciate the help. Daniel (121) - I guess I have to start with questioning whether or not stopping an ice age is necessarily bad. Since it is rather difficult to grow things, like food, in ice - it is a bit obvious (at least to me) that a warmer globe is better than a cooler globe. So, the real argument would be against a rapidly warming globe. Assuming that CO2 in fact causes the globe to warm, causing glaciers to melt and frozen tundra to unfreeze - then a SLOW release of CO2 would be necessary to allow the increased water and vegetation to act as carbon sinks and absorb the increasing CO2. Based on my primitive understanding of the Carbon cycle - I must respectfully disagree with Dr. Tyrrell. muoncouter (120) - I would like to express my sincerest gratitude for your explanation, as it clarified the error of my ways. At first, I felt pretty silly thinking that the "C" in "Gton C" meant "carbon dioxide" - I've since discovered that this seems to be a common misconception. In fact, "carbon" is often used in reference to "carbon dioxide" - as in "carbon sink". However, I am now more frustrated than I was before. Last year, POTUS made the following statement: "… this legislation is paid for by the polluters who currently emit the dangerous carbon emissions that contaminate the water we drink and pollute the air that we breathe." Now, I have a solid piece of carbon hanging around my neck - in today's vernacular it is called a diamond. I can guarantee you (and I'm not even going to offer up a study to prove I'm right) that diamonds are NOT contaminating the water we drink and polluting the air that we breathe. So, now I'm noticing that the discussions about global warming interchange accumulated atmospheric carbon and carbon dioxide emissions. Here is an example: "Humankind is releasing CO2 at a rate of about 7 Gton C per year from fossil fuel combustion, with a further 2 Gton C per year from deforestation. Because the atmospheric CO2 concentration is higher than normal, the natural world is absorbing CO2 at a rate of about 2 or 2.5 Gton C per year into the land biosphere and into the oceans, for a total of about 5 Gton C per year." http://www.realclimate.org/index.php/archives/2006/11/how-much-co2-emission-is-too-much/ But, Carbon is not a greenhouse gas - Carbon Dioxide is. Without the O2 part - why would carbon have any impact on the temperature of the globe? Or, to make a short story long: why do we care about the amount of Carbon as a stand alone element vis-a-vis global temperatures?
  23. 'So, the real argument would be against a rapidly warming globe." (my emphasis). YES! Rate is everything. Arguing about what would be a global optimal temperature would be tough. The problem is change faster than we can adapt in things like food production and infrastructure upon which we have become dependent. Re: use of "carbon". Well diamonds and such are not emissions. CH4 and CO2 are. While there might be an undesirable shorthand in common use, any document that matters on emission levels, is usually in terms of CO2e (CO2 equivalents).
  24. #122: "it is a bit obvious (at least to me) that a warmer globe is better than a cooler globe." You seem to be suggesting that if an ice age is coming, some beneficial greenhouse warming due to CO2 (let's lose the 'assuming CO2 does cause warming') would be a good thing. The first problem with this is the obvious: Who says an ice age is coming? I congratulate you for your personal chunk of face centered carbon crystals; hope it is of respectable carat weight. The issue is indeed atmospheric CO2; roughly 50% of the 30 Gtons CO2 we are releasing from fossil fuel combustion each year stays in the atmosphere and the globally measured concentration now increases by more than 2 ppm by volume per year. I'm sure some of the others here can enlighten us why C and CO2 seem to be used semi-interchangeably. Until then, remember to multiply by 3.664.
  25. Re: NQuestofApollo (122) Technically we are still in an ice age (defined as the existence of continental ice sheets in any such form), so we actually are in what is called an interglacial period. Of super-sized form. Glaciated conditions typically form through draw-down of atmospheric concentrations of CO2, as seen here: Given that the residential lifetime of CO2 in the atmosphere is on the millennial timescale, we can be safe in assuming no glaciers bugging temperate latitudes anytime soon. We have known about the GHG effect of CO2 for nearly two centuries - this is well-understood and not seriously questioned by any competent scientist anywhere. Google Tyndall, Arrhenius or Fourier sometime. As far as a slow release of CO2, that would be nice. But it in no way reflects the reality of what is actually happening. There simply is no comp in the paleo record for such a quick rise in CO2 concentrations in the atmosphere (other than during the PETM). So past periods of climate change occurred over much longer periods than what is happening today. Past periods of rapid climate change were always accompanied by many mass-extinctions (during periods when CO2 concentrations changed more slowly than today. Except during the PETM...). You can certainly disagree with Dr. Tyrrell and his understanding of the carbon cycle all you want. My money's on Dr. Tyrrell. As far as growing crops in a rapidly changing climate, that is easier said than done. Aridity of agricultural soils has gone from 8% in the 60s to over 21% as of 2001. Projections show greater than 50% aridity by 2035 and over 70% by 2052. Evapotranspiration of the soil is decreasing (soils are drying out) while humidity has increased by 4% (the equivalent extra volume of Lake Erie is now floating in the air, waiting to dump on someone). So what does that mean? Less rainfall events and drier soils; when it does rain, the "gas tanks" are greater, so more moisture falls (once-in-a-thousand year rainfall events start fall every century then every decade) in shorter burst, yielding more runoff and more erosion and flooding. And more crop damage. Global warming = Droughts, famines. In a world struggling to feed its existing populace, what will people do in 20 years when half the food is being produced for another 2 billion more people to feed than today's totals? muoncounter can answer whatever scaddenp didn't above. The Yooper

Prev  1  2  3  4  5  6  Next

Post a Comment

Political, off-topic or ad hominem comments will be deleted. Comments Policy...

You need to be logged in to post a comment. Login via the left margin or if you're new, register here.

Link to this page


The Consensus Project Website

THE ESCALATOR

(free to republish)


© Copyright 2024 John Cook
Home | Translations | About Us | Privacy | Contact Us