


 Arguments


Is Antarctica losing or gaining ice?
What the science says...
| Select a level... |
 Basic
Basic
|
 Intermediate
| |||
|
Antarctic sea ice extent has expanded at times but is currently (2023) low. In contrast, Antarctica is losing land ice at an accelerating rate and that has serious implications for sea level rise. |
|||||
Climate Myth...
Antarctica is gaining ice
"[Ice] is expanding in much of Antarctica, contrary to the widespread public belief that global warming is melting the continental ice cap." (Greg Roberts, The Australian)
At a glance
Who discovered the great, South Pole-straddling continent of Antarctica? According to the National Geographic, Captain Cook came within an estimated 80 miles of it in the late 1700s, but the three first 'official' discoveries all took place in 1820 by Russian, British and American teams of seafarers respectively.
Since that initial discovery, Antarctica has attracted and inspired researchers and explorers alike. It's a challenging place, fringed by sea-ice that, unlike the Arctic, has not steadily declined but whose extent fluctuates on a seasonal basis: it's currently (February 2023) at a very low coverage, but it can and does recover from such dips. Antarctic sea-ice is no great problem, with the exception of albedo-loss in low extent years: if it all melted, it would have no effect on global sea-levels. It's the stuff on land we need to focus upon.
The land of Antarctica is a continent in two parts, divided by the 2,000 m high Transantarctic Mountains. The two parts differ in so many respects that they need to be considered separately. East Antarctica, that includes the South Pole, has the far greater landmass out of the two, some 4,000 by 2,500 kilometres in size. Although its massive ice-sheet, mostly grounded above sea level, would cause 52 metres of sea level rise if it completely melted, so far it has remained relatively stable. Snow accumulation seems to be keeping in step with any peripheral melting.
In contrast, in the absence of ice, West Antarctica would consist of islands of various sizes plus the West Antarctic Peninsula, a long mountainous arm pointing northwards towards the tip of South America. The ice sheet overlying this mixed topography is therefore grounded below sea level in many places and that's what makes it far more prone to melting as the oceans warm up. Currently, the ice-sheet is buttressed by the huge ice-shelves that surround it, extending out to sea. These slow down the glaciers that drain the ice-sheet seawards.
The risk in West Antarctica is that these shelves will break up and then there will be nothing to hold back those glaciers. This has already happened along the West Antarctic Peninsula: in 1998-2002 much of the Larsen B ice-shelf collapsed. On Western Antarctica's west coast, the ice-sheet buttressing the Thwaites Glacier – a huge body of ice with a similar surface area to the UK - is a major cause for concern. The glacier, grounded 1,000 metres below sea level, is retreating quickly. If it all melted, that would raise global sea levels by 65 centimetres.
Such processes are happening right now and may not be stoppable - they certainly will not be if our CO2 emissions continue apace. But there’s another number to consider: 615 ppm. That is the CO2 level beneath which East Antarctica’s main ice sheet behaves in a mostly stable fashion. Go above that figure and the opposite occurs - major instability. And through our emissions, we’ve gone more than a third of the way there (320 to 420 ppm) since 1965. If we don’t curb those emissions, we’ll cross that line in well under a century.
Please use this form to provide feedback about this new "At a glance" section. Read a more technical version below or dig deeper via the tabs above!
Further details
Arguments that we needn't worry about loss of ice in the Antarctic because sea ice is growing or even that sea ice in the Antarctic disproves that global warming is a real concern hinge on confusion about differences between sea and land ice, and what our best information about Antarctic ice tells us.
As well, the trend in Antarctic sea ice is not a permanent feature, as we'll see. But let's look at the main issues first.
- Sea ice doesn't play a role in sea level rise or fall.
- Melting land ice contributes to sea level rise.
- The net, total behavior of all ice in the Antarctic is causing a significant and accelerating rise in sea level.
Antarctic sea ice is ice which forms in salt water mostly during winter months. When sea ice melts, sea level does not change.
Antarctic land ice is the ice which has accumulated over thousands of years in Antarctica by snowfall. This land ice is stored ocean water that once fell as precipitation. When this ice melts, the resulting water returns to the ocean, raising sea level.
What's up with Antarctic sea ice?
At both poles, sea ice grows and shrinks on an annual basis. While the maximum amount of cover varies from year to year, there is no effect on sea level due to this cyclic process.
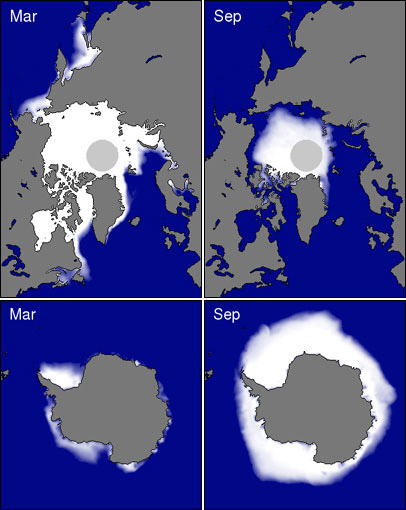
Figure 1: Coverage of sea ice in both the Arctic (Top) and Antarctica (Bottom) for both summer minimums and winter maximums. Source: National Snow and Ice Data Center
Trends in Antarctic sea ice are easily deceptive. For many years, Antarctic sea was increasing overall, but that shows signs of changing as ice extent has sharply declined more recently. Meanwhile, what's the relationship of sea ice to our activities? Ironically, plausible reasons for change may be of our own making:
- Ozone levels over Antarctica have dropped causing stratospheric cooling and increasing winds which lead to more areas of open water that can be frozen (Gillett & Thompson 2003, Thompson & Solomon 2002, Turner et al. 2009).
- The Southern Ocean is freshening because of increased rain and snowfall as well as an increase in meltwater coming from the edges of Antarctica's land ice (Zhang 2007, Bintanja et al. 2013). Together, these change the composition of the different layers in the ocean there causing less mixing between warm and cold layers and thus less melted sea and coastal land ice.
Against those factors, we continue to search for final answers to why certain areas of Antarctic sea ice grew over the past few decades (Turner et al. 2015).
More lately, sea ice in southern latitudes has shown a precipitous year-on-year decline (Parkinson 2019). While there's a remaining net increase in annual high point sea ice, the total increase has been sharply reduced and continues to decline.
How is Antarctic land ice doing?
We've seen that Antarctic sea ice is irrelevant to the main problem we're facing with overall loss of ice in the Antarctic: rising sea level. That leaves land ice to consider.

Figure 2: Total Antarctic land ice changes and approximate sea level contributions using a combination of different measurement techniques (IMBIE, 2017). Shaded areas represent measurement uncertainty.
Estimates of recent changes in Antarctic land ice (Figure 2) show an increasing contribution to sea level. Between 1992 and 2017, the Antarctic Ice Sheets overall lost 2,720 giga-tonnes (Gt) or 2,720,000,000,000 tonnes into the oceans, at an average rate of 108 Gt per year (Gt/yr). Because a reduction in mass of 360 Gt/year represents an annual global-average sea level rise of 1 mm, these estimates equate to an increase in global-average sea levels by 0.3 mm/yr.
There is variation between regions within Antarctica as can be seen in Figure 2. The West Antarctic Ice Sheet and the Antarctic Peninsula Ice Sheet are losing a lot of ice mass, at an overall increasing rate. The East Antarctic Ice Sheet has grown slightly over the period shown. The net result is a massive loss of ice. However, under a high-emissions scenario, ice-loss from the East Antarctic ice-sheet is expected to be a much greater in the decades after 2100, as reported recently by Stokes et al. (2022). That’s a scenario we must avoid at all costs.
Takeaway
Independent data from multiple measurement techniques (explained here) show the same thing: Antarctica is losing land ice as a whole and these losses are accelerating. Meanwhile, Antarctic sea ice is irrelevant to what's important about Antarctic ice in general.
Last updated on 14 February 2023 by John Mason. View Archives


"Are you suggesting the most recent changes in ice mass are indicative of a substantive change in the trend? And if so, what do you think is driving such a change?"
That might be, yes. The driving force could be the low amount of sea ice, and the rising temperatures. Both of them can produce more snowfall. The question is: how will the discharge of the ice along the edge of the ice sheet react? And how is the balance between these two? Of course, things can be less positive when the climate change goes on. More precipitation can fall in the form of rain than, and the discharge can overrule the gain of ice again. Nowbody knows, that's why it's so interesting to have a close look on what happens.
[BL] Speculation snipped - "might be" and "nobody knows" is a concrete indication that you are engaging in pure speculation again. Again, you are contributing nothing that has not been said before. It was not "interesting" in March, and it is not "interesting" now.
Bart... It would incumbent upon you to put forth a physical, testable hypothesis and then do the work to validate it. Speculations aren't really useful without some hard data.
[BL] In terms of hard data, Bart has not advanced anything new in the way of analysis since March. He's made a big thing about NASA's 149 Gt/yr value, presenting his own calculation of 114 Gt/yr.
...but that calculation uses the start and end points from February 2003 to February 2023. That is not an appropriate way to do a trend analysis - it ignores all the data in between.
A first approximation of the overall trend is a linear fit. If we take the GRACE data starting in October 2002 (where the zero relative mass value originates), we can compare the "last minus first" approach with a linear regression. If we repeat this calculation for each time in the time series, we can plot the two calculations as a function of the last time in the calculation and see how that evolves over time.
This is what we get:
As expected, in the early times the noisy signal gives us a lot of variation in the "average" loss rate. Over time, the two values stabilize, but the "last minus first" approach is always more influenced by noise. The regression results become quite stable, and the last 2-3 years of higher mass have little effect on the regression slope. The "last minus first" approach creates a noticeable rise not seen in the regression slope (which uses all the data).
We can see this better if we zoom in on the last three years:
With calculations done each month, we can see somewhat of an annual cycle in the "last minus first" calculation, but this largely vanishes in the regression analysis. Bart's "interesting" rise in 2022-2023 results does not look much different from previous noise in the signal.
"Nobody knows.." Hmm. Certainly investigated. See "Interannual ice mass variations over the Antarctic ice sheet from 2003 to 2017 were linked to El Niño-Southern Oscillation"
Shows correlation of AP and WAIS with ENSO and anticorrelation of EAIS.
Hmm. ok, only 2017. What about GFO and recent records. There is some detailed analysis in "Spatially heterogeneous nonlinear signal in Antarctic ice-sheet mass loss revealed by GRACE and GPS (2023)"
and another study of links with other quasi-periodic cycles in Antarctica in "Antarctica ice-mass variations on interannual timescale: Coastal Dipole and propagating transports"
Evidence to date - based on correlations of where the changes in ice mass are occurring - links interannual change to short term (2-8 year) quasi-periodic weather cycles (ENSO, Antarctic Circumpolar Wave, Antarctic Occillation) influencing Antartica.
My money (literally) would be on continued long term ice loss. Short term variation as observed here to date would certainly NOT be a reason for change in climate mitigation policy.
Before Bart was moderated, he made some speculative comments about the contribution from loss of sea ice. At first glance this doesnt sound like something that would have a big effect. The ocean surface temperatures are still very cold so not a lot of scope of increased evaporative water content, especially compared to incursions of moist air due to positive SAM. However, this seems a very testable hypothesis since different parts of Antarctica would have different response to changes in air circulation, whereas arctic seaice has varied a lot (up and down) over past 20 years and if it was a factor, then expect precipation to vary accordingly (and in the regions where change happens).
Thank you very much, scaddenp #579
So text was just removed, which is very annoying! I wasn't sure if I had done anything wrong myself.
But indeed, a rising air temperature and reduced sea ice mean more snowfall and a higher Surface Mass Balance according to multiple models. The question is how that relates to the increased melting and calving along the edges. Nobody knows exactly, and therefore it's good to have a close look on what happens.
Antarctic surface climate and surface mass balance in the Community Earth System Model version 2 during the satellite era and into the future (1979–2100)
BL #577 "He's made a big thing about NASA's 149 Gt/yr value"
Huh ...? I simply changed the number, for it was wrong. Bob Loblaw was the one who kept talking about it. And yes, "it ignores all the data in between." But that's not what the discussion was about. Replacing the 'last-first' by 'regression' doesn't make it better, for that still ignores all the data in between.
[DB] Hyperbole and sloganeering snipped. The commenter has recused himself from further participation here.
Just for clarification for other readers, as I pointed out above, Bart's conjecture "reduced sea ice mean more snowfall" is not expected given very low sea surface temperatures. To demonstrate that, Bart would need to show that precipatation varies in sync with sea-ice (which has both increased and decreased in recent history). By contrast, there is evidence for variations being due to multiyear weather cycles.
As to ice loss (overwhelmingly calving since most of Antarctica is too cold for melt), while the SAM is positive then continued basal erosion of the ice shelves is expected from warm deep water (eg see "The circum-Antarctic ice-shelves respond to a more positive Southern Annular Mode with regionally varied melting" ) and a useful summary here.
Loss of ice shelves leads to increased calving (see here with its links to relevent papers) as does loss of sea ice. That is why my money is on continued ice loss despite some weather noise. Let's see what an El Nino will bring after three La Nina years.
Suggested supplemental reading:
Forty percent of Antarctica’s ice shelves are shrinking, worrying scientists by Kasha Patel, Environment, Washington Post, Oct 12, 2023