Climate Science Glossary

Term Lookup

Enter a term in the search box to find its definition.

Settings

Use the controls in the far right panel to increase or decrease the number of terms automatically displayed (or to completely turn that feature off).

Term Lookup

Settings


All IPCC definitions taken from Climate Change 2007: The Physical Science Basis. Working Group I Contribution to the Fourth Assessment Report of the Intergovernmental Panel on Climate Change, Annex I, Glossary, pp. 941-954. Cambridge University Press.

Home Arguments Software Resources Comments The Consensus Project Translations About Support

Twitter Facebook YouTube Mastodon MeWe

RSS Posts RSS Comments Email Subscribe


Climate's changed before
It's the sun
It's not bad
There is no consensus
It's cooling
Models are unreliable
Temp record is unreliable
Animals and plants can adapt
It hasn't warmed since 1998
Antarctica is gaining ice
View All Arguments...


Username
Password
New? Register here
Forgot your password?

Latest Posts

Archives

Sun & climate: moving in opposite directions

What the science says...

Select a level... Basic Intermediate Advanced

The sun's energy has decreased since the 1980s but the Earth keeps warming faster than before.

Climate Myth...

It's the sun

"Over the past few hundred years, there has been a steady increase in the numbers of sunspots, at the time when the Earth has been getting warmer. The data suggests solar activity is influencing the global climate causing the world to get warmer." (BBC)

At a glance

Thankfully for us, our Sun is a very average kind of star. That means it behaves stably over billions of years, steadily consuming its hydrogen fuel in the nuclear reaction that produces sunshine.

Solar stability, along with the Greenhouse Effect, combine to give our planet a habitable range of surface temperatures. In contrast, less stable stars can vary a lot in their radiation output. That lack of stability can prevent life, as we know it, from evolving on any planets that might orbit such stars.

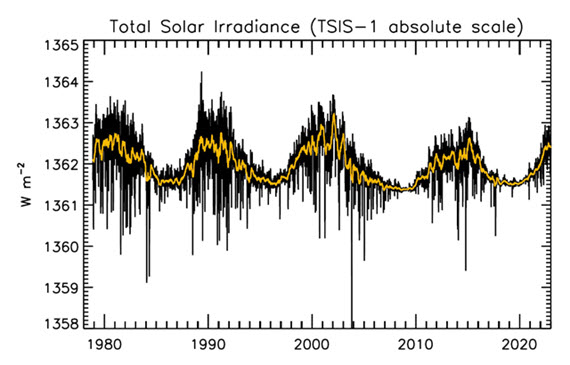
That the Sun is a stable type of star is clearly demonstrated by the amount of Solar energy reaching Earth's average orbital position: it varies very little at all. This quantity, called the Total Solar Irradiance, has been measured for around forty years with high accuracy by sensitive instruments aboard satellites. Its average value is 1,362 watts per square metre. Irradiance fluctuates by about a watt either way, depending on where we are within the 11-year long sunspot cycle. That's a variation of no more than 0.15%.

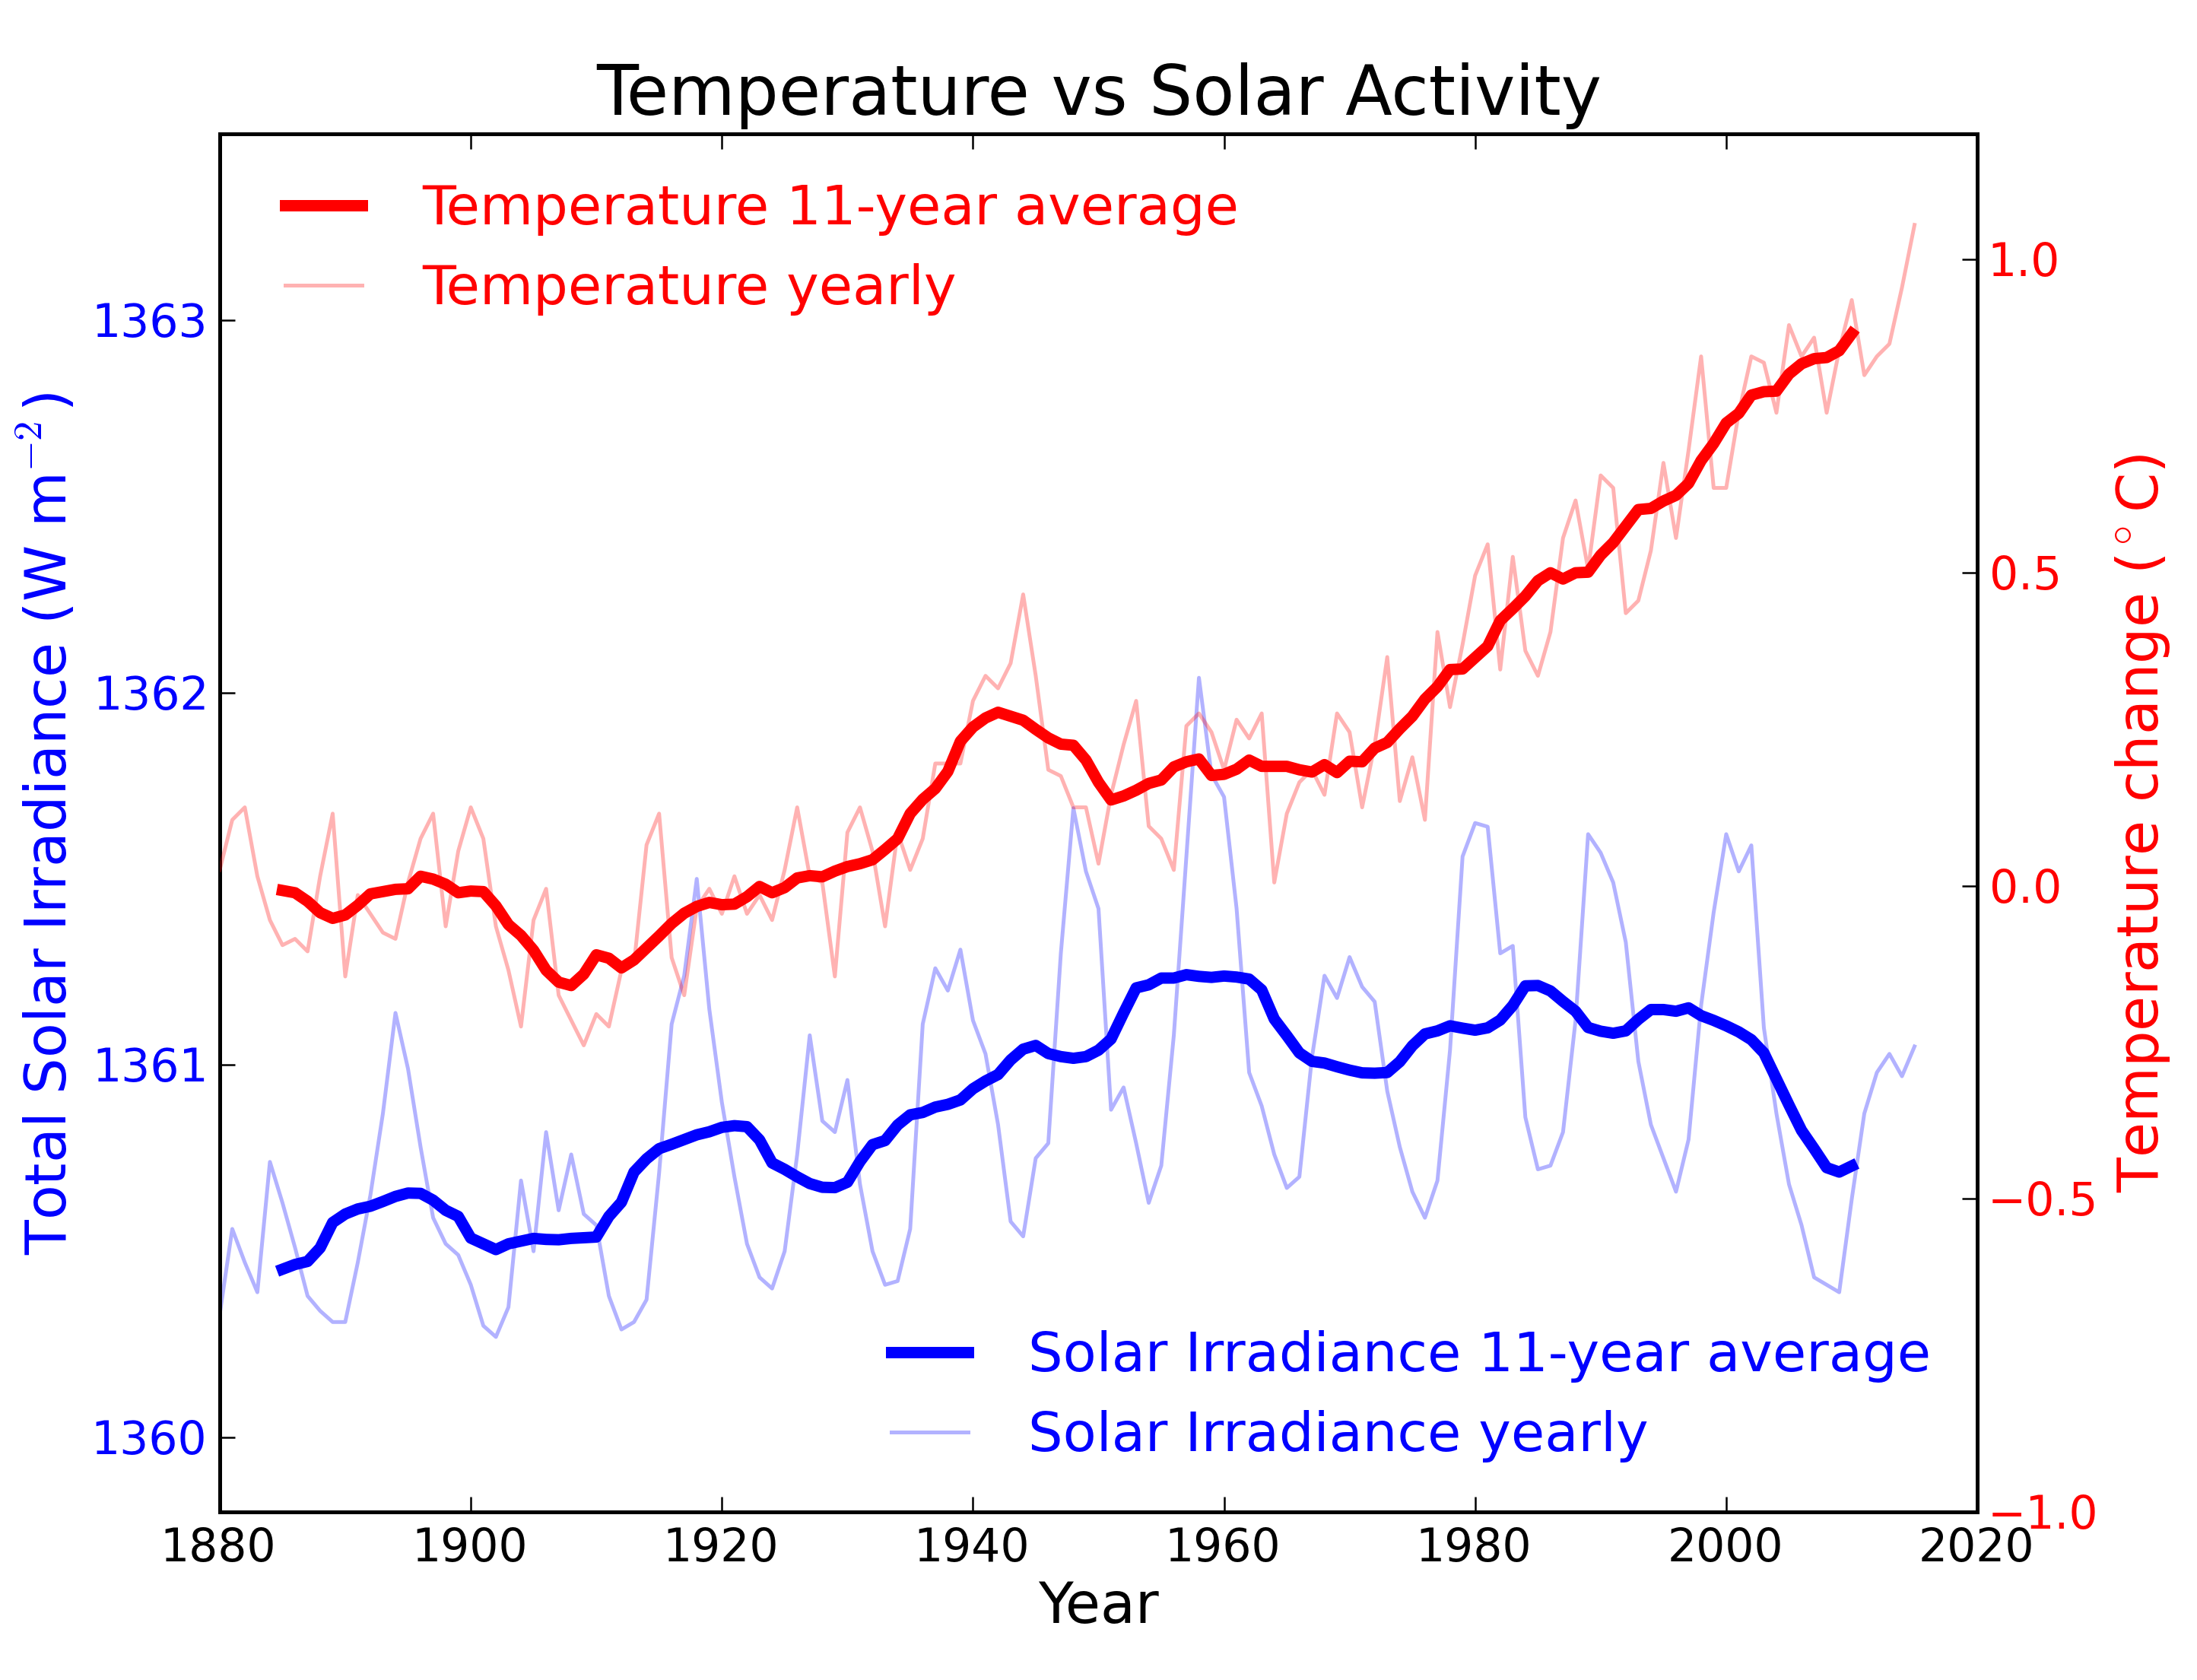
From the early 1970s until today, the Solar radiation reaching the top of Earth's atmosphere has in fact shown a very slight decline. Through that same period, global temperatures have continued to increase. The two data records, incoming Solar energy and global temperature, have diverged. That means they have gone in opposite directions. If incoming Solar energy has decreased while the Earth continues to warm up, the Sun cannot be the control-knob of that warming.

Attempts to blame the sun for the rise in global temperatures have had to involve taking the data but selecting only the time periods that support such an argument. The remaining parts of the information - showing that divergence - have had to be ditched. Proper science study requires that all the available data be considered, not just a part of it. This particular sin is known as “cherry-picking”.

Please use this form to provide feedback about this new "At a glance" section, which was updated on May 27, 2023 to improve its readability. Read a more technical version below or dig deeper via the tabs above!


Further details

Our Sun is an average-sized main sequence star that is steadily using its hydrogen fuel, situated some 150 million kilometres away from Earth. That distance was first determined (with a small error) by a time consuming and complex set of measurements in the late 1700s. It led to the first systemic considerations of Earth's climate by Joseph Fourier in the 1820s. Fourier's number-crunching led him to realise a planet of Earth's size situated that far from the Sun ought to be significantly colder than it was. He was thereby laying the foundation stone for the line of enquiry that led after a few decades to the discovery of what we now call the Greenhouse Effect – and the way that effect changes in intensity as a response to rising or falling levels of the various greenhouse gases.
TSI Solar cycles

Figure 1: Plot of the observational record (1979-2022) on the scale of the TSIS-1 instrument currently flying on the space station. In this plot, the different records are all cross calibrated to the TSIS-1 absolute scale (e.g., the TSIS1-absolute scale is 0.858 W/m^2 higher than the SORCE absolute scale) so the variability of TSI in this plot is considered to be its “true variability” (within cross calibration uncertainties). Image: Judith Lean.

The Sun has a strong magnetic field, but one that is constantly on the move, to the extent that around every 11 years or so, Solar polarity flips: north becomes south, until another 11 years has passed when it flips back again. These Solar Cycles affect what happens at the surface of the Sun, such as the sunspots caused by those magnetic fields. Each cycle starts at Solar Minimum with very few or no sunspots, then rises mid-cycle towards Solar Maximum, where sunspots are numerous, before falling back towards the end. The total radiation emitted by the Sun – total solar irradiance (TSI) is the technical term – essentially defined as the solar flux at the Earth's orbital radius, fluctuates through this 11-year cycle by up to 0.15% between maximum and minimum.

Such short term and small fluctuations in TSI do not have a strong long term influence on Earth's climate: they are not large enough and as it's a cycle, they essentially cancel one another out. Over the longer term, more sustained changes in TSI over centuries are more important. This is why such information is included, along with other natural and human-driven influences, when running climate models, to ask them, “what if?"

An examination of the past 1150 years found temperatures to have closely matched solar activity for much of that time (Usoskin et al. 2005). But also for much of that time, greenhouse gas concentrations hardly varied at all. This led the study to conclude, "...so that at least this most recent warming episode must have another source."
TSI vs. T
Figure 2: Annual global temperature change (thin light red) with 11 year moving average of temperature (thick dark red). Temperature from NASA GISS. Annual Total Solar Irradiance (thin light blue) with 11 year moving average of TSI (thick dark blue). TSI from 1880 to 1978 from Krivova et al. 2007. TSI from 1979 to 2015 from the World Radiation Center (see their PMOD index page for data updates). Plots of the most recent solar irradiance can be found at the Laboratory for Atmospheric and Space Physics LISIRD site.

The slight decline in Solar activity after 1975 was picked up through a number of independent measurements, so is definitely real. Over the last 45 years of global warming, Solar activity and global temperature have therefore been steadily diverging. In fact, an analysis of solar trends concluded that the sun has actually contributed a slight cooling influence into the mix that has driven global temperature through recent decades (Lockwood, 2008), but the massive increase in carbon-based greenhouse gases is the main forcing agent at present.

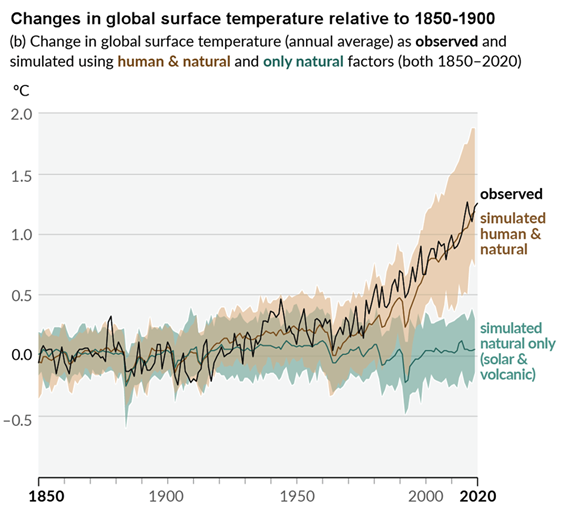
Other studies tend to agree. Foster & Rahmstorf (2011) used multiple linear regression to quantify and remove the effects of the El Niño Southern Oscillation (ENSO) and solar and volcanic activity from the surface and lower troposphere temperature data.  They found that from 1979 to 2010, solar activity had a very slight cooling effect of between -0.014 and -0.023°C per decade, depending on the data set. A more recent graphic, from the IPCC AR6, shows these trends to have continued.

AR6 WGI SPM Figure 1 Panel p

Figure 3: Figure SPM.1 (IPCC AR6 WGI SPM) - History of global temperature change and causes of recent warming panel (b). Changes in global surface temperature over the past 170 years (black line) relative to 1850–1900 and annually averaged, compared to Coupled Model Intercomparison Project Phase 6 (CMIP6) climate model simulations (see Box SPM.1) of the temperature response to both human and natural drivers (brown) and to only natural drivers (solar and volcanic activity, green). For the full image and caption please click here or on the image.

Like Foster & Rahmstorf, Lean & Rind (2008) performed a multiple linear regression on the temperature data, and found that while solar activity can account for about 11% of the global warming from 1889 to 2006, it can only account for 1.6% of the warming from 1955 to 2005, and had a slight cooling effect (-0.004°C per decade) from 1979 to 2005.

Finally, physics does not support the claim that changes in TSI drive current climate change. If that claim had any credence, we would not expect to see the current situation, in which Earth's lower atmosphere is warming strongly whereas the upper atmosphere is cooling. That is exactly the pattern predicted by physics, in our situation where we have overloaded Earth's atmosphere with greenhouse gases. If warming was solely down to the Sun, we would expect the opposite pattern. In fact, the only way to propagate this myth nowadays involves cherry-picking everything prior to 1975 and completely disregarding all the more recent data. That's simply not science.

Longer-term variations in TSI received by Earth

It's also important to mention variations in TSI driven not by Solar energy output but by variations in Earth's orbit, that are of course independent of Solar activity. Such variations, however, take place over very long periods, described by the Milankovitch orbital cycles operating over tens of thousands of years. Those cycles determine the distance between Earth and the Sun at perihelion and aphelion and in addition the tilt the planet's axis of rotation: both affect how much heat-radiation the planet receives at the top of its atmosphere through time. But such fluctuations are nothing like the rapid changes we see in the weather, such as the difference between a sunny day and a cloudy one. The long time-factor ensures that.

Another even more obscure approach used to claim, "it's the sun" was (and probably still is in some quarters) to talk about, "indirect effects". To wit, when studies can't find a sufficiently large direct effect, bring even lesser factors to the fore, such as cosmic rays. Fail.

In conclusion, the recent, post 1975 steep rise in global temperatures are not reflected in TSI changes that have in fact exerted a slight cooling influence. Milankovitch cycles that operate over vastly bigger time-scales simply don't work quickly enough to change climate drastically over a few decades. Instead, the enormous rise in greenhouse gas concentrations over the same period is the primary forcing-agent. The physics predicted what is now being observed.

Last updated on 27 May 2023 by John Mason. View Archives

Printable Version  |  Offline PDF Version  |  Link to this page

Argument Feedback

Please use this form to let us know about suggested updates to this rebuttal.

Related Arguments

Further viewing

Related video from Peter Sinclair's "Climate Denial Crock of the Week" series:

Further viewing

This video created by Andy Redwood in May 2020 is an interesting and creative interpretation of this rebuttal:

Myth Deconstruction

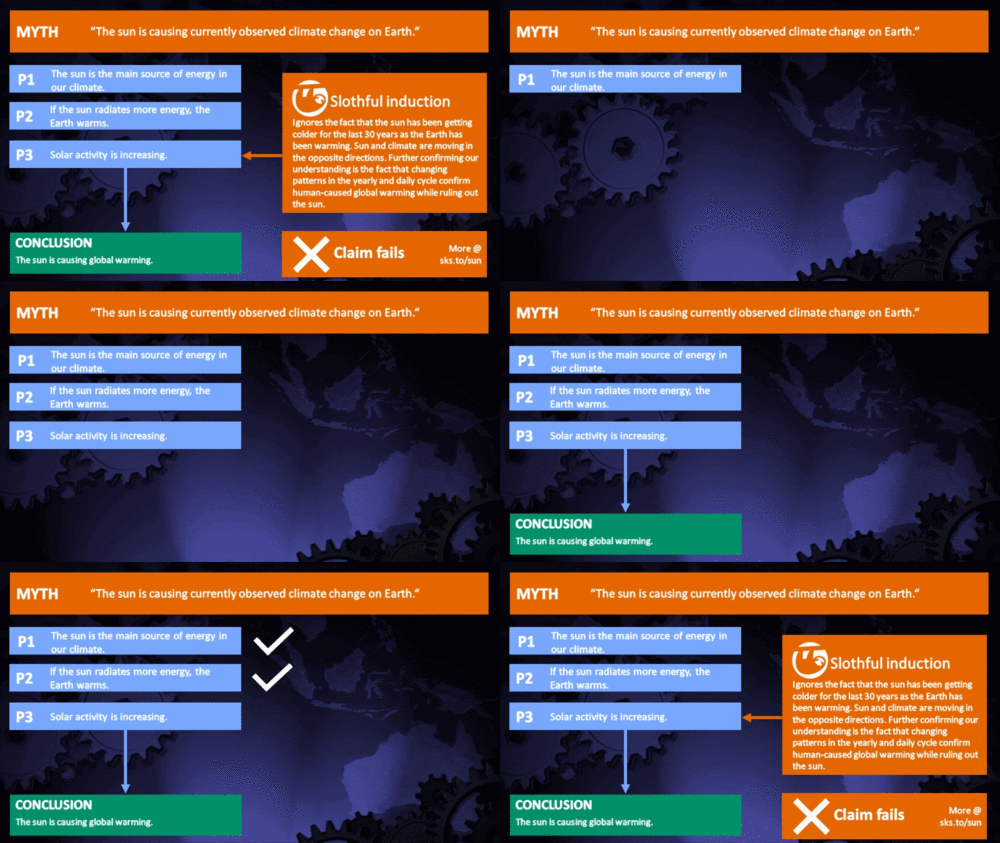
Related resource: Myth Deconstruction as animated GIF

MD Sun

Please check the related blog post for background information about this graphics resource.

Denial101x videos

Related lecture-videos from Denial101x - Making Sense of Climate Science Denial

and

Additional video from the MOOC

Expert interview with Mike Lockwood

Comments

Prev  24  25  26  27  28  29  30  31  32  33  34  35  36  37  38  39  40  41  42  43  Next

Comments 826 to 850 out of 1232:

  1. I read the following from comment #997 in Jeff Master’s blog today. I expect that someone with knowledge will have to pick his writing apart, as an article is making the rounds on the intertubes, apparantly based on Stockwell's writing. What follows is comment #997: Another blow to the AGW theory... Dr. David Stockwell who has a PhD in Environmental Sciences submitted a recent paper, that shows that solar activity alone, could explain Global Warming. I believe that GCC has more of an impact than the sun, but it's interesting nonetheless. Quote: Finally, my hibernation of the last 6 months is coming to an end, with the formal submission to a journal yesterday of the fruits of my labor. The main points: 1. solar forcing is time-integrated and not direct, 2. accumulation of the 0.1W/m2 increase in solar irradiance in the 20th century explains global warming, 3. there is a credible explanation for global warming that does not involve increases in human emissions of greenhouse gasses. Figure: Cumulative solar irradiance (blue) and volcanic forcing (red) is highly correlated with HadCRU global temperature and explains the trend in temperature since 1950. The direct solar irradiance (orange) is uncorrelated with temperature. There are a lot of other points about the model that no doubt I will get into in time. For the moment, here is the Conclusion. Contrary to the consensus view, the historic temperature record displays high sensitivity to solar variations when related by slow equilibration dynamics. A range of results suggest that incorrect specification of the relationship between forcings and temperature may be at the heart of previous studies finding low correlations of solar variation to temperature. The accumulation model is a credible alternative mechanism for explaining both paleoclimatic temperature variability and present-day warming without recourse to increases in heat-trapping gases produced by human activities. The grounds on which a solar explanation for late 20th century warming is dismissed should be reconsidered.
  2. I don't know what's going around the intertubes, I couldn't find the paper. Maybe people is talking about nothing. We'll see.
    Response:

    [DB] Try Stockwell's blog here.

  3. Thanks DB. Actually there's not much there either, only a figure more. Assuming that it can not simply be "solar forcing integration", we need to know more about his model before commenting. And sure I'd not be thrilled by a "mathurbation".
  4. 826, Tor B, Until his work is published in its entirety, and available to all, it is only so much blather, and very unlikely to undergo scrutiny, since no one else to date has been able to accomplish what he claims, and quite to the contrary, a number of existing studies demonstrate the opposite. [See the #2 denial argument, It's the Sun.] At this point, all you can do is to claim that he claims that he's submitted the masterful diagnosis which overturns all of modern climate science. Forgive me if I don't sit up too straight in my chair. At the same time, he will also need to explain other things, like why CO2 is not causing any warming (considering that the mechanism is very well understood, and it would be a huge surprise if that mechanism is totally and completely misunderstood by all atmospheric physicists around the globe). Sorry, but your post is only so much "trust me, I know a guy who knows the truth, just wait" hand waving, and as such is a wholly inappropriate claim to make.
  5. Sigh, Let Tamino know...probably another crank paper that needs to be refuted.
  6. Stockwell's "work" sounds like the same-old-same-old overfitting of a curve with a whole bunch of parameters.
  7. Tor B @826, Stockwell provides very little information to provide a counter analysis. The majority of the information comes from this diagram: As you can see, he plots temperature against the cumulative solar forcing. The only way that can be appropriate is if there has been no increase in Outgoing Longwave Radiation to dissipate the increased incoming solar energy, thus allowing it to accumulate. As a rise in temperature will result in a rise in OLR all else being equal, he leaves entirely unexplained why OLR has not increased over the period, and why it did increase in previous centuries, thus allowing the solar forcing to dissipate and temperatures to not rise as they have in the twentieth century. What Stockwell needs, therefore, is a mechanism that provides a near linear reduction in OLR over time. (Care to guess where this is going?) Oddly, and obviously, there is a known mechanism which has been increasingly been reducing the OLR over the course of this century. It is the increase in the Greenhouse Effect due to increased anthropogenic emissions of Greenhouse Gasses. Indeed, the increased forcing (reduction in OLR for a given surface temperature) has risen approximately linearly over the last half of the twentieth century: Further, it turns out that using a linear increase in anthropogenic forcings plus solar forcings, plus volcanic forcings plus the MEI (an index of the El Nino Southern Oscillation), an even better correlation with temperatures can be found than that found by Stockwell: So it turns out that the evidence Stockwell has uncovered is in fact evidence of an increasing anthropogenic forcing - he is just not good enough an analyst to realise it.
  8. 832, Tom Curtis, You win the Comments-Rebuttal-Of-The-Month Award!!! [Darn. I wish I'd worked that one through. Very nice job, and a lesson for anyone who has fallen for any such similar denial nonsense. Just playing with numbers is a parlor game, not science. Casual readers should note that the basic problem with Stockwell's analysis was the creation of an arbitrary mathematical mechanism -- the accumulation of solar input -- without any corresponding physical mechanism to justify the assumption. He picked it just because it fit the data, and didn't take the thought process any further. As Tom demonstrated, the missing physical mechanism that justifies the mathematical trick to demonstrate the incline does exist, but sadly, for Stockwell, it's called the Greenhouse Gas Effect.]
  9. Sphaerica (829) appears to miss the intent of my posting "someone with knowledge will have to pick his [Stockwell's] writing apart". Albatross (830) reflects my view: I read a "new" "it's the Sun" and thought folks here could banish it properly. Tom Curtis (832) has done what I am not able to do. Thanks!
  10. 834, Tor B, Apologies. Believe it or not, I read your post several times trying to figure out the intent. I even did a google search looking for your past comments, to see what sort of things you've posted previously. My bad. I think I've been getting way too feisty lately. Too much nonsense devoid of substance flying around here of late. It's just frustrating. Sorry again. -- Bob
  11. I find myself skeptical that the current trend of increasing global warming is currently sustainable reasons. 1) The current increase in global temperatures is a result of burning fossil fuels, releasing energy into the atmosphere. While the global may increase over a period of time, the heat emitted from burning fossil fuels is contained within the bounds of the earth. Eventually (and discounting any changes in solar output), the heat emitted will be reabsorbed back into the surface of the earth, reducing the atmospheric temperature back to near the original temperature of the pre-combusted fuel (the mass of gas surrounding the earth does not hold a candle to the amount of mass contained within the crust). 2) Fossil fuel supplies are limited, as is the amount of heat we can eject into the atmosphere is finite. At some point we MUST stop putting energy into the atmosphere. 3) While the heat island effect exists, it is a two way street. Energy is just as easily emitted into space as it is absorbed into the earth. Granted, there will be larger temperature fluctuations within the city than outside of it due to an increased surface area (sq mile to sq mile). The amount of greenhouse gasses in the atmosphere is nowhere near significant enough to significant detract from that. 4) The amount of greenhouse gasses in the atmosphere, while significant, are unlikely to have anything to do with global warming for the same reason as item 3 above. If it can contain heat well, it rejects it just as well. Energy from the surface of the earth is reflected with the same percentage as energy from the sun. This is not to say it cannot wreck hell on the earth’s ecosystems, just that it a political issue versus an actual energy issue. Essentially we are looking at an energy balance problem. All energy enters the earth via solar radiation, all energy leaves the earth via solar radiation. Unless there is a statistically significant solar change, the current temperature fluctuations are due to the energy revolution of the 1900’s. Recent increases in the global temperature can probably (not going do the work) be correlated relatively accurately to the number of cars in use around the earth (or number of people on the earth). So from where I stand, blaming temperature increases on CO2 is a fallacious argument, as it is a neutral player.
    Response:

    [DB] I'm not even sure where to begin...first-off, please read Newcomers, start here.  Then take a gander at The Big Picture.

    1. The current global rise in temperatures is a result of the energy imbalance at the top of the atmosphere, due to rising levels of CO2.  As long as we keep emitting more CO2, the imbalance will continue and so will the rise in temperatures.
    2. The energy being accumulated is not due to energy being released by us, but by the CO2 we release.
    3. UHI is immaterial as scientists measure anomalies, not absolute temperatures.  See also CO2 effect is weak.
    4. How to put this kindly...this makes little sense as written.

    Energy does not leave the system as solar radiation but as thermal emission from the Earth.  CO2 lengthens the exit path by that radiant thermal emission, so the lower levels of the atmosphere heat up due to the increase in back radiation.  See The Greenhouse Effect has been Falsified.

  12. rdmtask... In addition to the moderator's comments you need to be aware that you are coming to a conclusion that is diametrically opposed to the conclusions of the vast majority of the published literature on this topic. If you're genuinely interested in learning about the science of climate change you should spend time reading the articles here on SkS. And you don't even need to take the word of the authors of these articles. Almost every one of them fully cite the relevant research. You can follow those links and read the actual research for yourself.
  13. And further note, that we have enough coal to change the CO2 concentration in the atmosphere back to pre-pliocene levels.
  14. As for #4: The incoming energy from the sun primarily is shortwave radiation. This is absorbed by the planet and emitted as longwave radiation. The greenhouse gases absorb and reflect this longwave radiation. The "greenhouse effect" You are arguing against over a century of accumulated scientific knowledge based on your lack of understanding.
  15. The way I read 1 & 2 of rdmtask's comment, is that he/she thinks the heat driving global warming is from the heat given off by burning of fossil fuels, rather than the CO2 given off increasing the Greenhouse Effect. This confusion continues here: "All energy enters the earth via solar radiation, all energy leaves the earth via solar radiation" Where he/she appears to claim that the Earth is a star.
  16. Ken Lambert - If you are talking about forcing imbalances, then statements such as "If TSI is above an 'equilibrium' value and stays constant -there is a constant imbalance in forcing which translates to a linearly increasing gain in energy..." are completely unwarranted, as you should well understand. The climate will respond by warming due to increased energy in the system, and reduce the imbalance due to increased TOA radiation. The "constant imbalance" phrase is one you have repeated several times in this context - it's been wrong every time before, and it is wrong now, as it implies a constantly increasing TSI - which is not the case. "My point is that the TSI contribution is really unknown unless you know the 'equilibrium' TSI which will produce neither warming not cooling in the absence of all the other AG forcings." There is no such thing as an "absence of all other AG forcings". The climate is the sum result of all the forcings and feedbacks. Climate change is the result of changes in one or more forcings. TSI has changed very little over the past century, where we've seen the most warming, and the 'equilibrium TSI' would have been long since reached at some equilibrium in the absence of other changes. In particular, there has been essentially no change in TSI since 1980. "E pur si muove" - and yet it moves! Essentially, you seem to be looking for a unique equilibrium, when any fixed forcing will reach an equilibrium tied to that forcing. Climate changes from that point are due to changes in forcing, and we have an excellent track of what the TSI changes are - negligible. The observed climate change is therefore primarily due to the greater than exponential increase in CO2, hence a greater than linear forcing change.
  17. First it is to notice that 'solar activity' means quite more than the single value of TSI. Also of importance, but unfortunately on a low level of scientific understanding according to the IPCC, are things like intensities of mass ejections, number and intensity of flares (2003 showed the most and most intense flares in history - what of course could explain the sharp rise of the OHC in 2003), magnetic fux and the interplay between magnetic fields of both earth and sun (we had a decrease of the earth MF of about 10% in the last 100 years while the solar magnetic flux nearly doubled in the same time). Second I wonder why you talk only about the last 35 years. Looking at the graphs in the basic and intermediate sections makes it quite obvious that the former correlation between TSI and temperature was not broken in the 70th but in the mid 40th instead. (Following the correlation would show a temperature level like the current in the mid 60th, but the TSI-level had not reduced significantly, what means that the level was still high until the mid of the last decade. This, of course, depends on the reconstructions that one uses.) From my point of view, it suggests itself that the temperature rise of the last 35 years was not caused by the change in the same time, but by the absence of warming in the area of time before. So, look at these graphs and tell me why only to speak about the last 35 years when the link was broken 30 years before.
  18. JoeRG - Please see CO2 is not the only driver of climate, and mentally replace "CO2" with "the sun" throughout the article. There are a lot of forcings that affect the climate - when looking at climate change we need to look at what the forcing changes are. TSI changes (as with magnetic storms, and ion counts, and galactic cosmic rays) don't correlate with recent warming.
  19. @KR Honestly, I know that there is more than one driver of climate and currently no correlation between TSI and temperature. The question is here (because of the topic): when did this correlation break? As it is to see in the graphs it was NOT in the 60th or 70th as the basic or intermediate section suggests, it was obviously earlier: in the 40th. The TSI rose until the 60th while the temperatures had a kind of timeout. So, and thats is the main part of the question, why we don't speak about the area from the 40th to the 60th - the time when the correlation was broken? To speak only about the last 35 years is a false trail. To imagine what I mean you can make a little backyard experiment: Take a cattle full of water on an oven, bring a kind of insulation between cattle and heatplate (so that the water temperatur would be constant at higher power) and turn the plate up to a almost constant high level. After a while remove the insulation. What would you expect? Would you really mean that the water would stay with the constant temperature? No? So I wonder why the climate science does. Of course, we had some kind of climatic insulation in the past: global dimming in general and, according to a recent study, possibly a little impression what a nuclear winter can look like. Finally, a possible conclusion is that we had a delayed (but not unexpected) warming that is caused mainly by the sun, resp. by its near constant high level of activity (until the beginning of the last decade). But if you look only at the recent three decades you wouldn't / can't see it (or possibly not want to? - just a general question, not personally).
  20. JoeRG - the "broken correlation" just tells you that some other factor is more important now. The sun is always important. When the real relationship with temperature is: Temp = Func(Sun, Albedo, Aerosol,GHG) (which when you right it out properly tells you the temperature on the surface of any rotating planet) then you can hardly make sense of correlation by just looking at Temp = Func(Sun) Right through 20th century, all the other factors were changing too. The problem with delays (ie "recovering" from LIA) is where's the springs in the climate system? Of course there are delays between applying a forcing and getting a response - it takes a long time to heat the ocean - but if you remove the forcing, then by what mechanism can you continue the warming (same applies in reverse too). Even more puzzling, these hidden "springs" must produce an accelerating response after the removal of a forcing. There is no known mechanism for this whereas our ordinary climate understanding explains observations fine.
  21. @scaddenp #845 The solar forcing remained nearly constant since the 60th and was higher after the break in the 40th. So there was no significant change, even a slight rise. - For the backyard experiment: we had a constant high level of the heatplate. The only forcings that were removed partly are the causes of global dimming, but these were negative. - The insulation was removed. In result, the temperature rise in general is physically to expect, naturally, by how much is quite uncertain. This leads to the conclusion that we have to search for the natural behaviour. If we want to know this and with it about the anthropogenic influence we have to know the natural equilibrium temperature at a comparable solar activity. Naturally means that we have Temp=Func(Sun, Albedo, Aerosols (incl. Clouds & Volcanoes)). So we have to search for times with similar conditions. The uncertainties lay in the amounts of albedo and aerosols because for former times we know little about. But we can certainly assume that the natural values might be similar. For the sun it means a similar activity level. Solanki tells that this happened at about 8000bp, other studies point it at 5000bp. But these times have one in common: in most studies / proxies they show a warmer climate than today. With this knowledge gained we are now able to amount the antropogenic influences and forcings, both the negative and, of course, the positive (GHG, antropogenic aerosols and changes in planetary albedo etc). One can conclude that we are not far away from the natural behaviour that could be expected. But it is necessary to broaden the view and put away the look at a cherry of only 35 years.
  22. JoeRG - There's excellent correlation between the sum of forcings and climate, more than just TSI. Just not (currently) between natural forcings and climate, since we've added such a huge anthropogenic forcing. I suggest you look at the IPCC discussion of this: Figure 9.5. Comparison between global mean surface temperature anomalies (°C) from observations (black) and AOGCM simulations forced with (a) both anthropogenic and natural forcings and (b) natural forcings only. The climate moved clearly away from a natural forcing response (TSI, volcanoes, etc) sometime mid-20th century.
  23. @KR You cannot deny that a well tuned, means a good model can predict everything wanted. Honestly, this IPCC model linked is a bad one. The only section that has a nearly proper correlation is the time after 1963 in the upper diagram (anthropogenics included). The other part, 1900 until 1963, does not fit at all. This is a mess, because this is the section to which the natural forcings have to be attuned. Neither in the upper nor in the lower diagram there are any signs of fitting the lower peak around 1910 or the higher peak in the 40th. So the predicted temperature curve is much too flat. As well, the effect of global dimming, widely accepted in science, is missing (the natural forces would have caused higher temperatures, countered by this effect). This is a clear sign of underestimated natural forcings in this model (both curves are almost identical in this time, so the anthropogenic forcings are negligible). One that claims to have a sceptic look at science must have recognized this - and, if I am right, most posters here claim it. Regrettably I have to conclude that it is not as you suggest that there would be an excellent correlation. Perhaps some kind of excellence in the part that is claimed to be important, but a mess in the offcut. Generally, models, even those accepted by the IPCC, do not always match the reality. You can of course use the models to get your conclusions, but how reliable can models be if the tuning sections don't fit at all?
  24. JoeRG I don't know if you are aware of this, but there are several issues with your comment. First is that natural variability means that on a short time scale (5-10 years) 'climate' models can only give an approximation of the 'weather', where on 20-30 years they do an excellent job of looking at trends. It's not a miss unless the observations go outside the envelope of model predictions, the orange and blue bands representing the multiple-run envelope.. Therefore the fit with anthropogenic forcings is quite good. Second, given recent higher grade measurements of forcings, the post 1950's fit is accordingly better in the models. Third, 'global dimming' shows up in both model and measurement data as change to a downward trend around 1940. I think your statement regarding that is unfounded. Finally, as to models - they are an important tool for teasing out the contributions and effects of different forcings, as well as a good check on our understanding of the physics involved. Based on our understanding of the physics of forcings, the measured changes in solar activity, volcanic activity, etc., natural forcings should have cooled the climate considerably since mid-century. That did not happen - anthropogenic forcings made the difference, hence current warming. So again, the statistically significant (obvious to the point of a boot to the head) break between natural forcings and climate response became visible mid-20th century. I suggest you read the Models are unreliable thread if you have such concerns about the use of models as tools.
  25. KR First is that natural variability means that on a short time scale (5-10 years) 'climate' models can only give an approximation of the 'weather', where on 20-30 years they do an excellent job of looking at trends. It's not a miss unless the observations go outside the envelope of model predictions, the orange and blue bands representing the multiple-run envelope.. Therefore the fit with anthropogenic forcings is quite good. If you didn't notice, the two peaks I mentioned are begin and end of a trend that lasted about 35 years and that, after removing the noise of ENSO effects, was as straight as a temperature trend could ever be. So I didn't speak about a short time effect but about a significant climatic scenario. Besides, it is a good example for underestimation of natural forcings, especially the solar forcing. Given that the forcings are to describe as a function like in comment #845 by scaddenp, the function for the natural forcings is: (nat)Temp = Func(Sun, Albedo(clouds), Aerosols(vulcans)). Looking at the conditions shows that in this period the albedo is to assume as nearly constant and the aerosols were slightly lowering with only a very small change after 1915. So the solar forcing remained as the main driver of the occured trend. As well, if only the natural forcings were considered, this trend should have been continued until 1963 because there were no significant changes. This leads to your next statement: Third, 'global dimming' shows up in both model and measurement data as change to a downward trend around 1940. I think your statement regarding that is unfounded. Excuse me, but where is it? In the measurements clearly, but where in the models? Given the circumstances that no natural forcing had changed that far that the trend could have been stopped (in the period from '45 until '63) results in the conclusion that anthropogenic forcings were at work in the manner of global dimming. This would mean that natural forcings must have caused higher temperatures as anthropogenic forcings in this time. But this never happens in the models. Summarized: We have a model that 1) doesn't consider significant trends, 2) underestimates natural forcings and 3) shows wrong values of anthropogenic forcings. Sorry, but 'excellent' is something different. Finally, as to models - they are an important tool for teasing out the contributions and effects of different forcings, as well as a good check on our understanding of the physics involved. Such models give the impression that the physics are not well understood, at least in the climate science. Second, given recent higher grade measurements of forcings, the post 1950's fit is accordingly better in the models. Not quite. Forcings are calculated based on measured physical values and observed conditions. I suggest you read the Models are unreliable thread if you have such concerns about the use of models as tools. I didn't mean to go too far off topic, but this model that you've presented is a proper example for an analysis how underestimated solar activities are in the climate models. As I see it, because of false trails that exist (and that are powered by such bad models), the research in possible amplifications of solar forcings is too little to get a better understanding. For example, as I told before the magnetic field of the Earth weakened by 10% in the last century while the solar magnetic flux nearly doubled. I found only a view studies about this influence on climate, but most of them were made by persons that you would call a 'denier'. In the IPCC documents I found nothing at all, regrettably. As well, an influence of number and intensities of solar flares is possibe (and can of course explain the unusual hard rise in the OHC in 2003). But as long as only the last 35 years of solar activity are considered (as in the 3 topics and the IPCC reports) there will be probably no change in research. And that is not only a 'miss', it is truly a mess.

Prev  24  25  26  27  28  29  30  31  32  33  34  35  36  37  38  39  40  41  42  43  Next

Post a Comment

Political, off-topic or ad hominem comments will be deleted. Comments Policy...

You need to be logged in to post a comment. Login via the left margin or if you're new, register here.

Link to this page


The Consensus Project Website

THE ESCALATOR

(free to republish)


© Copyright 2024 John Cook
Home | Translations | About Us | Privacy | Contact Us