


 Arguments


How reliable are climate models?
What the science says...
| Select a level... |
 Basic
Basic
|
 Intermediate
| |||
|
Models successfully reproduce temperatures since 1900 globally, by land, in the air and the ocean. |
|||||
Climate Myth...
Models are unreliable
"[Models] are full of fudge factors that are fitted to the existing climate, so the models more or less agree with the observed data. But there is no reason to believe that the same fudge factors would give the right behaviour in a world with different chemistry, for example in a world with increased CO2 in the atmosphere." (Freeman Dyson)
At a glance
So, what are computer models? Computer modelling is the simulation and study of complex physical systems using mathematics and computer science. Models can be used to explore the effects of changes to any or all of the system components. Such techniques have a wide range of applications. For example, engineering makes a lot of use of computer models, from aircraft design to dam construction and everything in between. Many aspects of our modern lives depend, one way and another, on computer modelling. If you don't trust computer models but like flying, you might want to think about that.
Computer models can be as simple or as complicated as required. It depends on what part of a system you're looking at and its complexity. A simple model might consist of a few equations on a spreadsheet. Complex models, on the other hand, can run to millions of lines of code. Designing them involves intensive collaboration between multiple specialist scientists, mathematicians and top-end coders working as a team.
Modelling of the planet's climate system dates back to the late 1960s. Climate modelling involves incorporating all the equations that describe the interactions between all the components of our climate system. Climate modelling is especially maths-heavy, requiring phenomenal computer power to run vast numbers of equations at the same time.
Climate models are designed to estimate trends rather than events. For example, a fairly simple climate model can readily tell you it will be colder in winter. However, it can’t tell you what the temperature will be on a specific day – that’s weather forecasting. Weather forecast-models rarely extend to even a fortnight ahead. Big difference. Climate trends deal with things such as temperature or sea-level changes, over multiple decades. Trends are important because they eliminate or 'smooth out' single events that may be extreme but uncommon. In other words, trends tell you which way the system's heading.
All climate models must be tested to find out if they work before they are deployed. That can be done by using the past. We know what happened back then either because we made observations or since evidence is preserved in the geological record. If a model can correctly simulate trends from a starting point somewhere in the past through to the present day, it has passed that test. We can therefore expect it to simulate what might happen in the future. And that's exactly what has happened. From early on, climate models predicted future global warming. Multiple lines of hard physical evidence now confirm the prediction was correct.
Finally, all models, weather or climate, have uncertainties associated with them. This doesn't mean scientists don't know anything - far from it. If you work in science, uncertainty is an everyday word and is to be expected. Sources of uncertainty can be identified, isolated and worked upon. As a consequence, a model's performance improves. In this way, science is a self-correcting process over time. This is quite different from climate science denial, whose practitioners speak confidently and with certainty about something they do not work on day in and day out. They don't need to fully understand the topic, since spreading confusion and doubt is their task.
Climate models are not perfect. Nothing is. But they are phenomenally useful.
Please use this form to provide feedback about this new "At a glance" section. Read a more technical version below or dig deeper via the tabs above!
Further details
Climate models are mathematical representations of the interactions between the atmosphere, oceans, land surface, ice – and the sun. This is clearly a very complex task, so models are built to estimate trends rather than events. For example, a climate model can tell you it will be cold in winter, but it can’t tell you what the temperature will be on a specific day – that’s weather forecasting. Climate trends are weather, averaged out over time - usually 30 years. Trends are important because they eliminate - or "smooth out" - single events that may be extreme, but quite rare.
Climate models have to be tested to find out if they work. We can’t wait for 30 years to see if a model is any good or not; models are tested against the past, against what we know happened. If a model can correctly predict trends from a starting point somewhere in the past, we could expect it to predict with reasonable certainty what might happen in the future.
So all models are first tested in a process called Hindcasting. The models used to predict future global warming can accurately map past climate changes. If they get the past right, there is no reason to think their predictions would be wrong. Testing models against the existing instrumental record suggested CO2 must cause global warming, because the models could not simulate what had already happened unless the extra CO2 was added to the model. All other known forcings are adequate in explaining temperature variations prior to the rise in temperature over the last thirty years, while none of them are capable of explaining the rise in the past thirty years. CO2 does explain that rise, and explains it completely without any need for additional, as yet unknown forcings.
Where models have been running for sufficient time, they have also been shown to make accurate predictions. For example, the eruption of Mt. Pinatubo allowed modellers to test the accuracy of models by feeding in the data about the eruption. The models successfully predicted the climatic response after the eruption. Models also correctly predicted other effects subsequently confirmed by observation, including greater warming in the Arctic and over land, greater warming at night, and stratospheric cooling.
The climate models, far from being melodramatic, may be conservative in the predictions they produce. Sea level rise is a good example (fig. 1).

Fig. 1: Observed sea level rise since 1970 from tide gauge data (red) and satellite measurements (blue) compared to model projections for 1990-2010 from the IPCC Third Assessment Report (grey band). (Source: The Copenhagen Diagnosis, 2009)
Here, the models have understated the problem. In reality, observed sea level is tracking at the upper range of the model projections. There are other examples of models being too conservative, rather than alarmist as some portray them. All models have limits - uncertainties - for they are modelling complex systems. However, all models improve over time, and with increasing sources of real-world information such as satellites, the output of climate models can be constantly refined to increase their power and usefulness.
Climate models have already predicted many of the phenomena for which we now have empirical evidence. A 2019 study led by Zeke Hausfather (Hausfather et al. 2019) evaluated 17 global surface temperature projections from climate models in studies published between 1970 and 2007. The authors found "14 out of the 17 model projections indistinguishable from what actually occurred."
Talking of empirical evidence, you may be surprised to know that huge fossil fuels corporation Exxon's own scientists knew all about climate change, all along. A recent study of their own modelling (Supran et al. 2023 - open access) found it to be just as skillful as that developed within academia (fig. 2). We had a blog-post about this important study around the time of its publication. However, the way the corporate world's PR machine subsequently handled this information left a great deal to be desired, to put it mildly. The paper's damning final paragraph is worthy of part-quotation:
"Here, it has enabled us to conclude with precision that, decades ago, ExxonMobil understood as much about climate change as did academic and government scientists. Our analysis shows that, in private and academic circles since the late 1970s and early 1980s, ExxonMobil scientists:
(i) accurately projected and skillfully modelled global warming due to fossil fuel burning;
(ii) correctly dismissed the possibility of a coming ice age;
(iii) accurately predicted when human-caused global warming would first be detected;
(iv) reasonably estimated how much CO2 would lead to dangerous warming.
Yet, whereas academic and government scientists worked to communicate what they knew to the public, ExxonMobil worked to deny it."
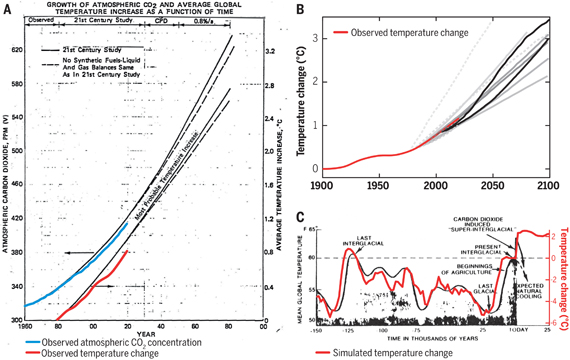
Fig. 2: Historically observed temperature change (red) and atmospheric carbon dioxide concentration (blue) over time, compared against global warming projections reported by ExxonMobil scientists. (A) “Proprietary” 1982 Exxon-modeled projections. (B) Summary of projections in seven internal company memos and five peer-reviewed publications between 1977 and 2003 (gray lines). (C) A 1977 internally reported graph of the global warming “effect of CO2 on an interglacial scale.” (A) and (B) display averaged historical temperature observations, whereas the historical temperature record in (C) is a smoothed Earth system model simulation of the last 150,000 years. From Supran et al. 2023.
Updated 30th May 2024 to include Supran et al extract.
Various global temperature projections by mainstream climate scientists and models, and by climate contrarians, compared to observations by NASA GISS. Created by Dana Nuccitelli.
Last updated on 30 May 2024 by John Mason. View Archives


@Tom Curtis #872:
"Political, off-topic or ad hominem comments will be deleted" (Comments policy)
Klapper, is that really how you want to defend your persistent use of inappropriate comparisons? I take that as an admission that it is indefensible (which I guess I knew anyway).
@Tom Curtis #877:
We should stay on topic and deal with the numbers. Do you have a suggestion of a linkable place I can post my graph?
@Tom Curtis #345:
In case you missed my last post directed at you on the other thread, I'd like you to expand on your reasoning for adjusting net CMIP5 TOA energy input forecasting based on "model drift".
Klapper @879.
There is plenty of advice on where you can up-load images that is easily found on-line, for instance here. Many require nothing more than an e-mail, a user name & a password. For instance (and I mention it as an exemplar rather than recommend it) this website allowed me to upload an image in less that a minute. I would have displayed the resulting image in-thread but the image to hand that I up-loaded is political in nature.
Mal Adapted @870.
You write "I'm not a biblical scholar, but I don't recall seeing any estimates of error margins in that book..."
My understanding of Leviticus is that it is entirely about defining error and what happens when any such error occurs. Within an approach to error such as laid out in Leviticus, the concept of there being 'error margins' disappears within a binary reality: either there is error or there is not error :-)
The uncertainties in Earth's total heat content data, 93% of which is ocean heat content, is shown in the image from the IPCC AR5 below:
And the climate model vs observation (black solid line) of ocean heat content from the IPCC AR5 is shown here:
@Rob Painting #882:
Graph as discussed. TOA Energy imbalance net from CMIP5 model ensemble variables as discussed above.
@Klapper #884:
I see my dropbox links do not work, which I suspected when I could not see the images in the preview. Back to the drawing board.
[RH] You might try http://tinypic.com
@Rob Painting #882:
Here is a graph I created by extracting from KNMI explorer the Watts/m^2 down and up (SW and LW) and calculating the net energy imbalance from these absolute variables (dashed black line, variables are rlut, rsut, and rdst). The "Global" (dark blue line) net from observations is really a fudge by assuming that OHC (which is derived from the Pentadal 0-2000) is 80% of the global (as per Tom Curtis' comment). Obviously that's not true over time but it suffices as a cross-check on how far from the observations the models might be deviating using this 80% factor to calculate a facsimile for global energy imbalance. The light blue line is the 0-2000 OHC from NODC pentadal, delta ZJ over 5 year running linear trend with ZJ/year converted to W/m^2 global basis.
There is a difference between this and the Smith et al figure posted on the other thread by Tom. I think the difference may be what Tom alluded to as adjustments for "model drift" in the Smith et al TOA model net imbalance. Then again, I could have made some mistake in my processing.
If I am correct the first observation I would make is that the better quality data we have on observations, the bigger the spread between OHC energy input and TOA model energy imbalance.
Klapper @886, very briefly, the CMIP5 RSDT from KNMI is consistently larger than the equivalent estimated value from the SORCE TSI reconstruction currently considered to be the best TSI reconstruction by the IPCC. In the late nineteenth century, the discrepancy is about 0.8 W/m^2. Even if we align the two estimates over the late 20th century, what we get is an increasing overestimate by CMIP5 with time:
So, the most obvious thing about your diagram is not that the discrepancy becomes largest where the observations are most accurate, but that it becomes largest where the solar component is known to be over represented in the models. That alone accounts for approximately 0.2 W/m^2 of your discrepancy, and possibly more depending on how accurate the difference between model and observed solar input is over the full record.
This, of course, continues to ignore the effect of the large number of small volcanoes in the early twenty-first century that are observed, but not included in the CMIP-5 data which will account for yet more of the discrepancy.
@Tom Curtis #887:
"... In the late nineteenth century, the discrepancy is about 0.8 W/m^2"
"...Even if we align the two estimates over the late 20th century..."
Yes, the models use a TSI history that is consistently 0.8 to 0.9 W/m^2 higher measured at the earths surface (or 3.2 to 3.6 watts/m^2 of total solar flux) compared to the Source TIM-adjusted reconstruction. How do you explain with this alleged massive error over the whole of the 20th century, they manage to replicate surface temperature as well as they do?
Is this the reason behind the "model drift correction" employed by Smith et al you alluded to earlier?
Klapper @888:
1) Why are you focusing on the least germain part of my comment? Surely the important thing here is the change in the RSDT discrepancy over the last 15 odd years. The discrepancy over the full period is relevant only in illustrating that models uses observational data of forcings that are approximately 10 years out of date (of necessity given the time it takes to set up and run models, and delays related to publication time). It follows that minor discrepancies over more recent periods between model predictions and up to date data is as likely to be due to the updating of the data as to any problem with the models. In particular, over the last decade or so, we know that model forcings are too large relative to recent observations because of an unpredicted very low solar minimum and recent low solar activity, and because of recent small scale volcanism (also not included in the models). That you have run this entire argument without ever acknowledging this fact, even when it is pointed out to you shows deliberate avoidance.
2)
More specifically with relation to comment my point (1), models predict changes in temperature anomalies. Slight changes in a forcing consistently applied over the whole duration will not effect the anomaly and therefore are not relevant. They are relevant to absolute temperature values, as shown in the side box to this graph:
You will notice that the multi-model mean is about 0.2 C less than (ie colder than) the observed values. The primary effect of the 0.8 W/m^2 difference in solar insolation would be to reduce that further by a small amount. (Note as an aside that the absolute value of the GMST is not well constrained by observations. I have seen values of 14 C and 15 C quoted based on different temperature series. Further note with respect to your "models always run hot" comment on another thread, in this and many other cases, they run cold. It is only that deniers cherry pick only those cases where the models "run hot" for their criticisms.)
3) I have clearly linked to Smith et al, who in turn clearly cited Sen Gupta et al on climate drift. I am not going to try to explain it further as I do not understand it well enough. I am going to acknowledge that the relevant experts think it a significant factor and correct for it, and note the corrected values. You on the other hand seem intent on holding it dubious because you couldn't bother doing your own homework.
For completeness, here are the absolute discrepancy at top of Troposphere, the Smith et al corrected values and the Smith et al observed values for the periods listed in Smith et al for comparison:
Period | CMIP5 | CMIP5 (Smith) | Obs (Smith
1861-1880 | 0.29 | xxxx | xxxx
1961-2010 | 0.56 | 0.36 | 0.33
1971-2010 | 0.67 | 0.46 | 0.48
1993-2010 | 0.91 | 0.68 | 0.59
2000-2010 | 0.92 | 0.73 | 0.62
2005-2010 | 0.90 | xxxx | 0.58
The factors in play explaining why there is a difference between the Smith et al CMIP5 values and the CMIP 5 absolute values are:
1) The CMIP 5 values as downloaded from the KNMI climate exporer are strictly speaking top of troposhere (or tropopause) values where as Smith et al may have obtained actual Top Of Atmosphere values. The primary differences between top of tropopause and TOA values is that TOA solar values would be slightly higher, as would outgoing longwave radiation (due to the effect of the stratosphere).
2) Smith et al are corrected for model drift.
The primary factors relating to the difference between observed values and the absolute CMIP5 values are:
a) CMIP5 forcings are known to be overstated by 0.2-0.4 W/m^2 relative to anomaly values from the late 1990s onward due to low solar and background volcanic effects.
b) CMIP5 absolute values of solar forcings are known to be overstated relative to observations by an unknown (by us) amount. The amount is unknown in that in benchmarking values for the observations, all three relevant factors may have been adjusted, so that the solar values may have been greater than those from SORCE TIM, but would not have been less than the unadjusted SORCE-CMIP5 discrepancy of about 0.8 W/m^2. This could account for the ongoing high bias of CMIP-5 absolute values. (Note again, such a constant offset of a forcing would not affect appreciably changes in anomaly temperature values.)
c) CMIP5 absolute values apparently need correction for model drift, although I cannot do more than note the stated necessity by relevant experts and refer you to the relevant literature on this point.
Combining these three factors we have an explanation for the increased discrepancy in the 21st century that explains from half to all of the discrepancy observed. We have a further explanation that potentially over-explains the persistent high bias of CMIP-5 absolute values. Finally we have a factor that essentially eliminates the discrepancy prior to the 21st century. If anything, given all this, the models are running too cold relative to known discrepancies.
The important point is not that we have these explanations. With further refinement of observations, the correction factors they imply are likely to shift so that the models are running hot again, or colder. The important point is that the models have run within error of observations, and that there are factors that can explain both short term increases in the discrepancy and long term persistent features. Ergo it is jumping the gun to conclude from this that the models are in error.
@Tom Curtis #889 & 890:
"... It follows that minor discrepancies over more recent periods between model predictions..."
I don't think they are minor, I think they help explain the recent lack of surface temperature gain in the observations compared to that projected by the models. The discrepancy from observations to models is currently 48% (0.90 to 0.62 W/m^2 TOA energy imbalance).
"...because of recent small scale volcanism (also not included in the models).."
I don't accept that argument. Forster and Rahmstorf 2011 did multivariate regression on the effects of TSI, ENSO and AOD, albeit against surface temperature, not TOA imbalance, but their Figure 7 shows essentionally no significant effect form aerosols after the mid-nineties (as least compared to ENSO and TSI). You'd be better off to include ENSO in your arguments than small volcanoes as I doubt the latter come close to the effect of the former. I suspect that's your next argument, ENSO deflated the observed TOA imbalance in the first decade of the 21 first century, which the models didn't include.
"...Slight changes in a forcing consistently applied over the whole duration will not effect the anomaly and therefore are not relevant.."
That's a rather astounding statement given it's untrue if you mean that changes in forcing won't affect the delta in the temperature anomaly.
"...You will notice that the multi-model mean is about 0.2 C less than (ie colder than) the observed values..."
Irrelevant. The forcing changes the warming rate, not the baseline which is dependent on the starting temperature/starting heat content. The warming rate in the models is essentially the same as the observations for surface temperature, yet the magnitude of the solar input appears to be approximately 0.85 W/m^2 too high (if we can believe the SORCE TSI reconstruction), in the CMIP5 model inputs. This is a serious issue you chose to treat as if it's not important but it is. Either the models are using the wrong input, or the SORCE 20th century TSI reconstruction is wrong.
"...Further note with respect to your "models always run hot" comment on another thread, in this and many other cases, they run cold..."
Calculate the SAT trend in all of the models and tell me what percentage run "hot" and what percentage run "cold"? Not many of them run cold and we shouldn't waste our time on sematic arguments when the ensemble mean is consistantly above the observations for TOA imbalance. Look at your own table above. The model forcing is higher than the observations in all but 1 of 10 period comparisons to the observations (5 CMIP5, 5 CMIP5 "adjusted").
"....KNMI climate exporer (sic) are strictly speaking top of troposhere"
What makes you think that? Maybe there's an issue with translation from Dutch but the description in the CMIP5 "standar output" document for the "rlut" variable is:
"at the top of the atmosphere (to be compared with
satellite measurements)"
And if the "rsdt" varible was Top of the troposphere, it should be lower than the TSI reconstruction, not higher, as some incoming LW would not make the tropopause due to absorption in the stratosphere.
"...(Note again, such a constant offset of a forcing would not affect appreciably changes in anomaly temperature values.)..."
Once again, we are not talking about offsetting forcings, I agree it doesn't matter, we are talking about a difference in the net between input and output TOA, which do affect anomaly values. It is not true the net forcing in the models is the same as the observations.
"...CMIP5 forcings are known to be overstated by 0.2-0.4 W/m^2..."
"...Ergo it is jumping the gun to conclude from this that the models are in error."
Both above statements cannot be true. The models according to you are (currently at least) in error. If the models are not in error why do they need to correct the TOA imbalance numbers for model drift?
I think my next step will be to compare the CMIP5 model TSI input to the ACRIM TSI reconstruction.
Klapper wrote: "I don't want 'perfect data', I want the best data."
Great! So what pre-Argo data is there which is better than the XBT results? None? Then guess what "the best data" for that time period is. :]
@CBDunkerson #892:
I used datasets compiled using XBD inputs. As you can see my graph shows ocean heat content changes going back to 1959 (pentadal dataset starts 1957, so a centred 5 year trend first occurs in 1959. However, given the XBT have problems with depth resolution, based on sink rates, they are nowhere near as good as the ARGO floats. Unfortunately the ARGO network only reach a reasonable spatial density in 2004 or 2005.
Klapper... Don't throw the baby out with the bathwater just because he's not reached puberty yet.
Klapper - all measurement systems have issues. The question to ask is what can be determined from measurements available and to what accuracy. This is dealt with in a number of papers, particularly here. See also supplimentary materials in the Levitus papers on OHC content. What do you perceive to be the errors in this analysis?
Your earlier response on dismissing pre-Argo, simply pointed to sparcity of deeper data (and why is 2014 in age of Argo relevant?). To dismiss 0-700 warming because 700-2000 is sparce however means having a plausible mechanism for 700-2000 cooling while 0-700 heats.
Looking over your posting history, it appears to me that you have made an a priori choice to dismiss AGW and seem to be trying to find something plausible, anything!, for dismissing inconvenient data rather than trying to understand climate. If this is correct, then do you have an idea of what future data might cause you to revise your a priori choice?
Klapper, I was looking at the NODC 0-2000 OHC data as a check on the empirical data. Year by year, here is the comparison, with "world" equalling the 0-2000 meters adjusted by a scaling factor based on Smith et al. (The scaling factor is to multiply by 0.58/0.47, or equivalently, divide by 0.81.)
For reproducibility, the 2005 value is based on the difference between the 2005.5 and 2006.5 OHC, which represents therefore the gain in OHC between those periods (ie, the gain in OHC for 2005). Overall, there is an average difference between the models and observation in this period of 0.12 W/m^2.
For comparison, here are the five year means over that period shown in the graph:
Period_____ | CMIP5 | Obs | Diff
2005-2010 | 0.91 | 0.67 | 0.24
2006-2011 | 0.95 | 0.42 | 0.53
2007-2012 | 0.99 | 0.58 | 0.41
2008-2013 | 1.02 | 0.83 | 0.20
2009-2014 | 1.02 | 1.02 | 0.00
Mean______ |0.98 | 0.71 | 0.27
The means of the five year means exagerate the discrepancy because they count the middle (low) values more often than the high endpoints.
In any event, it is clear that when you say "The discrepancy from observations to models is currently 48% (0.90 to 0.62 W/m^2 TOA energy imbalance)" it is not true. The discrepancy, if we take the latest five year mean is in fact 0%. Of course, a better observational basis may restore that discrepancy.
Klapper @891:
1)
I really don't care about your propensity for avoiding inconvenient information. Recent papers show that the volcanic effect has influenced temperature trends and and TOA energy imbalance. Thus we have Santer et al (2014):
Haywood et al (2013):
And most directly of all, Solomon et al (2011):
If you add the -0.1 W/m^2 additional aerosol load after 2000 to the approximately -0.1 W/m^2 from the the discrepancy between modeled and observed solar forcing, you get a CMIP5 absolute value energy imbalance of 0.72 W/m^2 from 2000 to 2010, ie, only 16% greater than observed (Smith et al), and using drift corrected figures the modelled TOA energy imbalance becomes 14.5% less than the observed values. Forster and Rahmstorf used values from prior to these analyses and so cannot be expected to have incorporated them. Therefore citing Forster and Rahmstorf is not a counter argument. It is merely an appeal to obsolete data.
2) With regard to the SORCE data, the situation is very simple. The SORCE reconstruction is essentially an earlier reconstruction that was benchmarked against PMOD which has been rebenchmarked against the SORCE data. The effect of that it to shift the entire reconstruction down by the difference between the TSI as determined by PMOD, and that as determined by SORCE. Consequently the TOA shortwave down radiation is shifted down by a quarter of that value over the entire length of the reconstruction. Because that shift occures over the entire length of the reconstruction, it means the difference between twentieth century values of the solar forcing and preindustrial values(ie, rsdt(y) minus rsdt(pi), where rsdt(y) is the downward short wave radiation at the tropopause in a given year, and rsdt(pi) is the downard short wave radiation at the tropopause in 1750) does not change, because both the twentieth century values and the preindustrial values have been reduced by the difference between PMOD and SORCE. Ergo there is no appreciable change in the solar radiative forcing in the twentieth century as a result of the difference.
In contrast, for twenty-first century values, the models use a projection so that the difference between (model rsdt minus SORCE value) and the mean twentieth century difference is significant because it does represent an inaccurate forcing in model projections.
The tricky bit comes about in a direct comparison of TOA energy imbalance. In determining the "observed" energy imbalance, Smith et al following Loeb et al adjust the satellite observed rsdt, rsut and rlut so that the net value matches the calculated increase in OHC from 2005-2010, and so as to maximize the likilihood of the adjustments given the error margins of the three observations. Consequently, in all likelihood, they have adjusted the rsdt upward from the SORCE estimate. Therefore when comparing observations to models we are dealing with two adjustments to rsdt. First we have an implicit adjustment in the models that results in the radiative forcing being preserved in the models. This implicit adjustment is equivalent to the average difference between the model rsdt and the SORCE reconstruction. Secondly, we have another smaller adjustment to the SORCE value that results from the benchmarking of the empirical values. Because this adjustment is smaller than the first, it generates a persistent gap between the observed and modelled rslut resulting in a persistent difference in the energy balance.
From the fact that this gap is persistent, the size of the TOA energy imbalance and that temperatures were rising from 1861-1880, it is evident that the gap (and hence the persistent bias) is less than 0.2 W/m^2. I suspect, however, that it is at least 0.1 W/m^2 and probably closer to 0.2 than to 0.1 W/m^2.
3)
The fact that the graph of rsdt shows a clear downward spike in 1992 (Pinatubo) and another smaller one in 1983 (El Chichon). That makes sense with increases in stratospheric aerosols, but is impossible if the data is trully from the TOA (rather than the TOA by convention, ie, the tropopause).
4)
Both above statements cannot be true. The models according to you are (currently at least) in error. If the models are not in error why do they need to correct the TOA imbalance numbers for model drift?"
By "both of these statements cannot be true", you really only indicateing that you don't understand it. In fact, everytime you said it in the post above, you were wrong.
So, lets start from basics. Climate models are models that, given inputs in the form of forcings produce outputs in the form of predictions (or retrodictions) of a large number of climate variables. When you have such a model, if you feed it non-historical values for the forcings, it is not an error fo the model if it produces non-historical values for the climate variables. So, when we discover that forcings have been overstated for the first decade and a half of the twentyfirst century, we learn absolutely nothing about the accuracy of climate models. We merely rebut some inaccurate criticisms of the models. It follows that the first sentence does not contradict, but rather provides evidence for the second.
With regard to model drift, had you read the relevant scientific paper (to which I linked) you would have learnt that it is impossible to determine without exhaustive intermodel comparisons whether or not drift is the result of poor model physics, too short a run up time or poor specification of the initial conditions. Only the first of these counts as an error in the model. Ergo, you cannot conclude from this that because of model drift, the models are flawed. All you can conclude is that, if you accept that the model drift exists, then you ought to correct for it and that uncorrected model projections will be rendered inaccurate by the drift. Now here you show your colours, for while you steadfastly refuse to accept the dift corrected TOA energy imbalance figures as the correct comparitor, you want to count model drift as disproving the validity of models. That is an incoherent position. Either the models drift and we should compare drift adjusted projections to emperical observations, or they don't drift in which case you can't count drift as a problem with the models.
@Rob Honeycut/scandenp #894/#895:
You're complaining not because I didn't utilize the data, which I did, but I think because I don't embrace it as much as I should. It is what it is and I accept that, however, it's not only myself that has doubts about reliability of the data. See these comments from Kevin Trenberth et al 2012:
"...(XBTs) were the main source from the late 1960s to 2004 but, because depth or pressure of observations werent measured, issues in drop rate and its corrections plague these data and attempts to correct them result in varied outcomes.”
Certainly the data are far better with the ARGO collecting system was my key point and that analyses using these later systems should carry more weight than '60s/70's/80's analyses.
@Scaddenp #895:
"... (and why is 2014 in age of Argo relevant?)..."
I think you're referring to my comparison of the 5 year '68 to '72 inclusive data density map at 1500 m. I could have given you any 5 year period from 2005 on for the ARGO (i.e. 2005 to 2009 inclusive), but it's not important whether I used 1 year or 5 from the ARGO era, or whether it was 2011 or 2014 or whatever. The point is the data density now in the deep ocean is many orders of magnitude better than the 60's to 90's.
Klapper @898&899.
It is bizarre that you are happy to present a trace of ΔOHC 1959-2010 @886 then to happily junk 90% of it because it doesn't meet some level of precision that you have decided is required. Indeed, discussing your dismissal of pre-2005 OHC data isn't going to be very helpful if you cannot make a better case for so doing. For instance 'Many orders of magnitude of data density in deep oceans' (which sounds exagerated) can be translated into data uncertainty so it doesn't justify the use of the rubbish bin. Further, inclusion or otherwise of such data is an aside to the central point of this interchange which is the ability of the models to handle the global energy balance.
I am of the opinion that you are pretty-much wrong on every point being presently discussed (as per @891 for instance). I think scaddenp @895 has probably diagnosed the situation. As you continue to protest that you still hold a valid position, the explanations of why you are wrong become ever more detailed & technical but that will probably not be helpful.
There are two things required to establish your "The models run hot" assertion. Firstly that model output is higher than measured values. This is possibly true but not to the large extent that you are arguing. And secondly, that the inputs into the model are not the reason for those higher output values. It does appear that the inputs are the reason for the higher model output and to the extent that the models are probably running cool, the opposite of your position.