


 Arguments


How reliable are climate models?
What the science says...
| Select a level... |
 Basic
Basic
|
 Intermediate
| |||
|
Models successfully reproduce temperatures since 1900 globally, by land, in the air and the ocean. |
|||||
Climate Myth...
Models are unreliable
"[Models] are full of fudge factors that are fitted to the existing climate, so the models more or less agree with the observed data. But there is no reason to believe that the same fudge factors would give the right behaviour in a world with different chemistry, for example in a world with increased CO2 in the atmosphere." (Freeman Dyson)
At a glance
So, what are computer models? Computer modelling is the simulation and study of complex physical systems using mathematics and computer science. Models can be used to explore the effects of changes to any or all of the system components. Such techniques have a wide range of applications. For example, engineering makes a lot of use of computer models, from aircraft design to dam construction and everything in between. Many aspects of our modern lives depend, one way and another, on computer modelling. If you don't trust computer models but like flying, you might want to think about that.
Computer models can be as simple or as complicated as required. It depends on what part of a system you're looking at and its complexity. A simple model might consist of a few equations on a spreadsheet. Complex models, on the other hand, can run to millions of lines of code. Designing them involves intensive collaboration between multiple specialist scientists, mathematicians and top-end coders working as a team.
Modelling of the planet's climate system dates back to the late 1960s. Climate modelling involves incorporating all the equations that describe the interactions between all the components of our climate system. Climate modelling is especially maths-heavy, requiring phenomenal computer power to run vast numbers of equations at the same time.
Climate models are designed to estimate trends rather than events. For example, a fairly simple climate model can readily tell you it will be colder in winter. However, it can’t tell you what the temperature will be on a specific day – that’s weather forecasting. Weather forecast-models rarely extend to even a fortnight ahead. Big difference. Climate trends deal with things such as temperature or sea-level changes, over multiple decades. Trends are important because they eliminate or 'smooth out' single events that may be extreme but uncommon. In other words, trends tell you which way the system's heading.
All climate models must be tested to find out if they work before they are deployed. That can be done by using the past. We know what happened back then either because we made observations or since evidence is preserved in the geological record. If a model can correctly simulate trends from a starting point somewhere in the past through to the present day, it has passed that test. We can therefore expect it to simulate what might happen in the future. And that's exactly what has happened. From early on, climate models predicted future global warming. Multiple lines of hard physical evidence now confirm the prediction was correct.
Finally, all models, weather or climate, have uncertainties associated with them. This doesn't mean scientists don't know anything - far from it. If you work in science, uncertainty is an everyday word and is to be expected. Sources of uncertainty can be identified, isolated and worked upon. As a consequence, a model's performance improves. In this way, science is a self-correcting process over time. This is quite different from climate science denial, whose practitioners speak confidently and with certainty about something they do not work on day in and day out. They don't need to fully understand the topic, since spreading confusion and doubt is their task.
Climate models are not perfect. Nothing is. But they are phenomenally useful.
Please use this form to provide feedback about this new "At a glance" section. Read a more technical version below or dig deeper via the tabs above!
Further details
Climate models are mathematical representations of the interactions between the atmosphere, oceans, land surface, ice – and the sun. This is clearly a very complex task, so models are built to estimate trends rather than events. For example, a climate model can tell you it will be cold in winter, but it can’t tell you what the temperature will be on a specific day – that’s weather forecasting. Climate trends are weather, averaged out over time - usually 30 years. Trends are important because they eliminate - or "smooth out" - single events that may be extreme, but quite rare.
Climate models have to be tested to find out if they work. We can’t wait for 30 years to see if a model is any good or not; models are tested against the past, against what we know happened. If a model can correctly predict trends from a starting point somewhere in the past, we could expect it to predict with reasonable certainty what might happen in the future.
So all models are first tested in a process called Hindcasting. The models used to predict future global warming can accurately map past climate changes. If they get the past right, there is no reason to think their predictions would be wrong. Testing models against the existing instrumental record suggested CO2 must cause global warming, because the models could not simulate what had already happened unless the extra CO2 was added to the model. All other known forcings are adequate in explaining temperature variations prior to the rise in temperature over the last thirty years, while none of them are capable of explaining the rise in the past thirty years. CO2 does explain that rise, and explains it completely without any need for additional, as yet unknown forcings.
Where models have been running for sufficient time, they have also been shown to make accurate predictions. For example, the eruption of Mt. Pinatubo allowed modellers to test the accuracy of models by feeding in the data about the eruption. The models successfully predicted the climatic response after the eruption. Models also correctly predicted other effects subsequently confirmed by observation, including greater warming in the Arctic and over land, greater warming at night, and stratospheric cooling.
The climate models, far from being melodramatic, may be conservative in the predictions they produce. Sea level rise is a good example (fig. 1).

Fig. 1: Observed sea level rise since 1970 from tide gauge data (red) and satellite measurements (blue) compared to model projections for 1990-2010 from the IPCC Third Assessment Report (grey band). (Source: The Copenhagen Diagnosis, 2009)
Here, the models have understated the problem. In reality, observed sea level is tracking at the upper range of the model projections. There are other examples of models being too conservative, rather than alarmist as some portray them. All models have limits - uncertainties - for they are modelling complex systems. However, all models improve over time, and with increasing sources of real-world information such as satellites, the output of climate models can be constantly refined to increase their power and usefulness.
Climate models have already predicted many of the phenomena for which we now have empirical evidence. A 2019 study led by Zeke Hausfather (Hausfather et al. 2019) evaluated 17 global surface temperature projections from climate models in studies published between 1970 and 2007. The authors found "14 out of the 17 model projections indistinguishable from what actually occurred."
Talking of empirical evidence, you may be surprised to know that huge fossil fuels corporation Exxon's own scientists knew all about climate change, all along. A recent study of their own modelling (Supran et al. 2023 - open access) found it to be just as skillful as that developed within academia (fig. 2). We had a blog-post about this important study around the time of its publication. However, the way the corporate world's PR machine subsequently handled this information left a great deal to be desired, to put it mildly. The paper's damning final paragraph is worthy of part-quotation:
"Here, it has enabled us to conclude with precision that, decades ago, ExxonMobil understood as much about climate change as did academic and government scientists. Our analysis shows that, in private and academic circles since the late 1970s and early 1980s, ExxonMobil scientists:
(i) accurately projected and skillfully modelled global warming due to fossil fuel burning;
(ii) correctly dismissed the possibility of a coming ice age;
(iii) accurately predicted when human-caused global warming would first be detected;
(iv) reasonably estimated how much CO2 would lead to dangerous warming.
Yet, whereas academic and government scientists worked to communicate what they knew to the public, ExxonMobil worked to deny it."
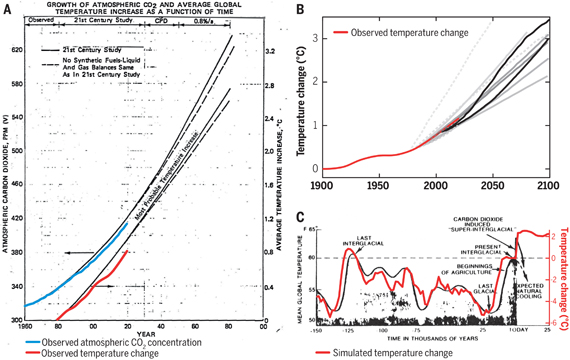
Fig. 2: Historically observed temperature change (red) and atmospheric carbon dioxide concentration (blue) over time, compared against global warming projections reported by ExxonMobil scientists. (A) “Proprietary” 1982 Exxon-modeled projections. (B) Summary of projections in seven internal company memos and five peer-reviewed publications between 1977 and 2003 (gray lines). (C) A 1977 internally reported graph of the global warming “effect of CO2 on an interglacial scale.” (A) and (B) display averaged historical temperature observations, whereas the historical temperature record in (C) is a smoothed Earth system model simulation of the last 150,000 years. From Supran et al. 2023.
Updated 30th May 2024 to include Supran et al extract.
Various global temperature projections by mainstream climate scientists and models, and by climate contrarians, compared to observations by NASA GISS. Created by Dana Nuccitelli.
Last updated on 30 May 2024 by John Mason. View Archives


michael sweet @775:
No! That means that there are some aspects of model performance which, if cherry picked, indicate they underestimate expected warming. Equally there are some other aspects of model performance which, if cherry picked, indicate they overestimate expected warming. In practise they tend to balance out, with the best evidence suggesting they currently overestimate warming by 15%. That evidence remains consistent with their actually underestimating warming (given uncertainties); but not (on a frequentist test) with their overestimateing warming by more than 100% (ie, we can be very confident of at least half of model ensemble mean predicted warming going forward).
I will note that the models are underpredicting (by and large) slow feedbacks more than fast feedbacks. On that basis I suspect the current 15% overestimate of warming figure is misleading in the long term, and that the actual future warming beyond several decades will be closer to the model mean or above it rather than below that 15%.
Tom,
I agree "that there are some aspects of model performance which, if cherry picked, indicate they underestimate expected warming. Equally there are some other aspects of model performance which, if cherry picked, indicate they overestimate expected warming. "
My comment was intended to illustrate the cherrypicking you mention for Shadow Dragon. Perhaps Shadow Dragon will come back and clarify what they are interested in. Hopefully their interest will be as even handed as your assessment is.
BojanD asked on another thread: "Since some of you know a thing or two about models, I would like to ask you a question that I just can't find an answer to. I'm looking for some credible explanation why 1990 is a baseline year to align model projections with measurements. Since misaligning them is one of the favorite contrarian tactics, I would like to have technical description why it is wrong. Thanks you!"
(Somebody more knowledgeable than me--and there are lots of you--please correct any errors in my below explanation to BojanD.)
BojanD, choosing any baseline does not change the slopes of the trend curves. That's the first thing to note in a discussion of a fake skeptic's manipulation of baselines. Up is still up. Scary is still scary.
Choosing a baseline affects only the position of the curve on the y (temperature) axis. That is irrelevant if you are looking at only one curve. It is relevant only if you are comparing trend curves, and even then only if those curves are not identical. Real temperature data's trend curves never are identical, of course. Computing all the data using the same, single, baseline year in effect moves all the data up and down the y axis to make all those datasets and therefore trend curves intersect at that baseline year. Using as your baseline an average of several consecutive years does the same thing, but intersects the datasets and trend curves at the midpoint of that timespan.
Choosing a baseline period has the effect of choosing the time period in which the curves intersect. That has the effect of choosing which portions of the curves intersect.
The differences among the trend curves are minimized at the midpoint of the baseline period. The differences manifest most before and after that baseline period.
Imagine trend curves Observed and Model both have positive slopes, but Observed's slope is shallower than Model's. If you move the curves up and down the y axis (temperature) so they intersect at the far left of the x axis (years), then Observed will diverge below Model toward the right of the plot; Observed will be cooler than Model the closer to Now that you get. If instead you make them intersect at the far right end of the x axis, Observed will diverge above Model toward the left of the plot; Observed will be warmer than Model in the past, but approach and then match Model at Now.
How do you choose a fair timepoint at which the curves intersect? That depends on the exact question you want to ask. But almost regardless of the exact question you want to ask, it is inappropriate to choose any single year as the baseline period, because that year almost certainly will not be representative of the underlying, "true," population temperature even at that one-year moment in time. If your single chosen year lies above or below the true population temperature at that year, then you will be making the trend curves' intersection unrepresentative of the population data. You can't use even just a few years, because the true population temperature is obscured by short-term noise. You really should baseline on the temperature averaged across 30 years or so. That's why the definition of "climate" is based on 30 years.
HotWhopper showed how Roy Spencer used a short and cherry-picked baseline period to produce his infamous plot of models over-projecting temperature in recent years, here and then with a different flavor here.
BojanD: An example of incorrect baselining by using the single year 1990 was an IPCC AR5 report preliminary draft's plot of model projections versus observations. That error was pointed out by Tamino and explained by Dana here on SkepticalScience.
That particular error has a problem in addition to what I explained in my previous comment: Each model curve is a different run of a model, with different parameters; think of each curve as being from an alternate Earth. The mean curve of those curves inherently averages out the noise and so is representative of the population of all those curves--the Average Earth. But there is only one observed dataset--only one of the many alternate Earths. We can't create an average across all the alternate Earths' observed temperatures, because we've got only one Earth. We have a really sparse sample of the population of alternate Earths' observed temperatures, that we are comparing to a much larger sample of the population of alternate Earths' modeled temperatures.
We can't get more alternate Earths' observed temperatures. But at least we can get a better estimate of the population of observed temperature at that year (1990) by averaging across the 30 years centered on 1990, and using that average as our baseline.
Tom Dayton @778, your explanation is a good one except for the claim that "Using as your baseline an average of several consecutive years ... intersects the datasets and trend curves at the midpoint of that timespan". That will only occur if the various datasets only differ in slope. As the datasets also differ in the shape of the curves (due to differences in annual variation) they will not all intersect in the same year using a multi-year baseline, and different curves will likely intersect multiple times across the baseline period (and probably outside it as well). The average difference across the baseline period (specifically the Root Mean Squared Difference) will be minimized.
In reponse to BojanD, I would like to draw attention to two comments I made (in particular) in the discussion of the AR5 Fig 1.4. First:
Note the range of potential offsets here were calculated specifically for the model temperature comparison. For some data sets, with low annual variability choice of a single year baseline makes no practical difference.
Second:
I will note the comments in the thread on IPCC AR5 Fig 1.4 are well worth reading in general (particularly those from SkS authors and regulars) for those who want to understand the issues relating to baselining better.
@Tom & @Tom, very much appreciated. Ok, I get it now. There's nothing absolute about 1990, but it is very convenient year for a sniff test since it was by far the warmest year. And like @TD said and Dana gave it the whole section, you can just forget about aligning stuff and look at the trends instead. Not sure how I missed that Dana's article. Had I read it before I wouldn't have had to ask the question.
Why is it that, from all the models presented by IPCC in its last report (AR5 WG1 fig 9.8), all but one overshoot their estimation of current temperature anomaly, by up to 0.6 °C?
with zoom of the upper right corner
It may well be that the quality of the models doesn't enable a more exact reproduction of actual data.
That's life when historic series are scarce and imprecise, and when interactions are not well understood. More computers can't help.
However, what does it say about their ability to play future scenarii and provide useful projections?
Or to render a plausible equilibrium climate sensitivity?
[Rob P] - IIRC the CMIP5 simulations use historical data (hindcasts) up to 2005, and estimated forcings thereafter. The multi-model mean is the average of all the simulations and thus represents Earth without any natural variation. Natural variation (the IPO) has, however, had a hand in recent surface warming trends, as have light-scattering volcanic sulfate aerosols, a cooler-than-expected solar cycle, and perhaps industrial sulfate pollution too.
Allowing for all these things there is actually a remarkable match of the climate models with the recent slower rate of surface warming. And note too that many of these models have climate sensitivities of around 3°C. Time will tell if there's a problem, but there's no genuine reason to think so yet.
Michel
As the intermediate article above states: "Each individual climate model run has a random representation of these natural ocean cycles,"
That is, they are trying to simulate a large source of the 'noise' in the climate signal. The ensemble mean of the models will, in some sense, reflect a scenario in which the short term noise has not pulled the temperature in either direction.
In reality, the noise of the last 15 years has pulled the signal downwards. On the flip side, if the noise had been a positive, rather than negative signal, we would most likely have witnessed temperatures that tracked above projections.
Long time reader of SkS, but not a poster. I was explained the basics of AGW and modelling in the 90s by a crazy Swedish mathematician / scientist, and as a data modeler I took it to heart. My main academic field is Philosophy, but you gotta earn a buck as well I guess…
Question I have though is with regard to the IPCC year-by-year model results. As I understand it, most “skeptics” infer that the farther away observations stray from the ensemble mean, the more wrong you are. As if the ensemble boundaries are error bars of sorts.
But that’s far from being the case of course. In fact, today the models are actually correct when hugging the lower boundaries, given the downward pressure of volcanic activity, short-term solar cycles and a net negative pseudo-ENSO cycle since 1998.
Just wondering then if the IPCC should perhaps offer some qualified projection-scenarios? Like, explaining in 2000 that a possible future La Nina-dominated decade would in fact produce a flatter curve? Certainly would help explain things to my right-wing friends… And the larger public as well. I understand that the ensemble mean does not include natural variability, but lots of people don't...
SDK @784, what you are looking for was in fact provided in the draft version of the recent IPCC report:
In this graph, the range of the projections are given as the range between the mean projections for two different but plausible bau scenarios. To that is appended the grey zone representing the reasonable range of annual variability due to short term factors such as ENSO. The graph was ammended in the final report, mostly because of a fake controversy (see here and here)generated by ignoring that fact (which was not sufficiently emphasized by defenders of climate science, myself included). The graph does have some flaws, including an inappropriate baselining on a single year and the fact that the grey zone, out of graphic necessity, is drawn from the upper or lower limit of all projections. Therefore caution should be used in presenting that graph, which should not be presented without the disclaimers regarding its flaws, in links to rebutals of the trumped up controversy.
For these reasons, I prefer my own graph which plots observations against all model runs for AR4:
Doing so allows the actual model variability to define the expected annual variability, thereby eliminating the false perception of smoothness sometimes generated by showing only ensemble means for projections. The test for those claiming the models failed to project the current temperatures is to pick out the observations from the projections. If they cannot do so easilly, then the model projections have correctly captured both the trends (see below) and the range of annual variability.
Thanks for the charts (from a fellow Tom who is also knee-deep into chart porn…)
Forget about the deniers, but these charts are not even close to addressing the concerns of the fencers either. At least when we need to attach complex disclaimers to them. I mean, if you ask say 90% + of the general population, they would have no idea what the ensemble mean actually erm… means in the first place. Isn’t that kind of a “double catastrophe” when you add the battle of public relations? We’ve won on the science, but losing badly in communications and framing the issue. Unfortunately, science doesn’t always fit nicely on a bumper sticker.
Sure, I can provide charts with the short-term weather noise removed, but then I’ll always be accused of chart manipulation… “after the fact”.
What if I had a chart e.g. from the early 2000s, showing that if the 3 main short-term natural fluctuations put a downward pressure on the GST in the coming years, it will produce a flattening of the curve? Further, why not just produce hundreds of those -— with a combination of premises -— which can subsequently be checked “after the fact”? As appendixes to the IPCC reports? Just asking as it sure as hell would've made my life easier arguing the AGW case on other forums.
Just to add. How many in the general population would understand that today the model ensemble mean is correct because it strays away from the instrumental record? And that if the observed data was closer to the mean -— or even exactly on top it -— it would in fact be more wrong?
Now there’s a pedagogical challenge...
Deon van Zyl commented on another thread:
Deon, in fact science is just as much extrapolation via theory into models, as it is observation. In fact, "direct observation" is only the first step. For example, you probably think that looking at a mercury column thermometer and noting the number that the column reaches is "direct observation" of temperature. But it's not. Instead your temperature observation relies on your model of the relationship of the mercury's height to the temperature. The very notion of temperature is theoretical. When an apple comes loose from a tree and you predict that it will fall to the ground, you are using a model. All those models are based on observations. All theory is generalized observation. Models are instantiations of theories.
Perhaps you think climate models are poor models because you think they are merely statistical models that assume the future will be the same as the past. But that is incorrect. Climate models are models of physical processes, whose elements are constructed to match empirical observations of fundamental physical phenomena such as how much water vapor air can hold at a given temperature. The models are then run so that all those individual elements interact, yielding the climate projections.
To learn about how climate models are built and run, click the links in the "Further Reading" green box below the original post on this page (right before the comments section).
Adding to Tom Dayton's excellent post @788, I want to note that a theory is of no practical use in science if it does not lead to mathematical predictions. Absent such mathematical predictions, comparison to observations can only be vague at best. And the way that theories lead to mathematical predictions is by being couched in mathematical models. Consequently, absent mathematical models, a theory can only give vague, qualitative predictions that constitute hand waving more than science. It is one of the outstanding features of climate science that they have taken such extensive efforts to couch their theories in mathematical models, and to check those models against observations across a wide range of observations (not just Global Mean Surface Temperature). Given the difficulties in so doing, both due to the complexity and chaotic nature of climate - it is a stirling effort.
Climate scientists are often criticized for making model based predictions. As the model is just the theory couched in the most mathematically precise way we are capable of at the moment (due to budgetary constraints and limitations of computer power), what else can you base your predictions on? By definition of "prediction", you cannot base it on observations because the observations go outside the current observations.
In fact, those who say we should not base predictions on models typically resort to predictions made on crude models that lack physics, and are constrained to just one or two climate variables. In effect, they want climate science to remain at the hand waving stage found around 11 pm in any bar room across the world.
This is not to say that models are perfect. They are not, and some of their imperfections may be due to flaws in the theory they embody. (Others are related to innacccurate initial or boundary conditions, and/or limitations of computational power.) But you can only find the flaws in the theory by putting them in mathematical form and comparing them to observations (ie, by using models), so that is no reason for not using models. And it is reasonable to make our predictions based on the currently best available theory. The complete lack of climate models developed by "skeptics" means by default that must be the conventional theory accepted by the IPCC.
Tom Dayton @788 correctly notes that "temperture" is a theoretical construct - one that has proved invaluable in uniting a whole host of observations. I will merely note that given that our sense are sound, visions, smell, taste and touch, even such objects as the sun, or even other people (given our lack of ESP) are theoretical constructs for us. We just do not notice because they are so good at uniting disparate phenomenon, and we are so used to them in practise, that unless we are of a philosophical bent, we don't think about it.
When I had taken on the task of learning to trade stocks and currency a few years ago, I was amazed at the number of 'models' that were 'back tested' to be accurate. They tended to be somewhat accurate - until they failed.
Most scientists do not understand randomness and the role it plays in all aspects of our lives. We exist totally due to randomness. Weather - despite how much we think we understand the interactions of everything that affects weather - is totally random. We will never be able to predict, with certainty, the future of weather.
Many, if not all, of the so called solutions to curb CO2 emmisions, or to curb sunlight, or to convert to alternate energy sources, - although they may be necessary - do not address the effects on many people in the middle income brackets and below. Some do not address the potential negative effect on our health.
I would like to see the data that scientists use to predict the negative effects on our environment, animals and humans. Polar bears are often used as an example. Polar bears can survive without the ice covered artic as they do in parts of eastern Canada.
Also, it would be very eye opening to see the source of the actual data, how it is interpreted, and what assumptions are included in their climate models. If we demand openness in government we should also demand it on something as importand as this.
Sangfroid... There's a huge difference between financial models and climate models. Climate models are based on physical processes. Financial models are subject to varying human behavior. Gavin Schmidt has a great TED Talk about climate models that you should listen to.
If weather were totally random then you'd get snow in the summer and sweltering heat waves in the winter. Your statement is patently absurd.
With regards to the rest of your comment, all the information is there. You just have to dig in and start reading. Understand that the body of scientific research is produced by researchers who've dedicated their lives and careers to getting this stuff as accurate as possible.
Sangfroid @791, there is a major difference between the stockmarket (or currency trading) models and climate models. That is, the stockmarket models are entirely statistical. In contrast, the climate models encode well established physical laws into mathematical representations of the atmosphere. These are laws such as consevation of energy, conservation of energy, radiative transfer physics, boyles law etc. Because we cannot represent the atmosphere molecule by molecule, (or indeed, kilometer by kilometer), some of the laws are approximated based on empirical estimates of the effect of the laws in the real atmosphere. Consequently, when these models retrodict the temperature series, without having been trained on that temperature series, that is a significant prediction.
The achievement is even more impressive in that the models do not predict just a single time series (again unlike stock market models). The predict temperature series for a variety of different altitude and depths of the ocean. The predict major atmospheric and ocean circulations (including ENSO like effects). The predict precipitation changes, and changes in sea and land ice. They are not perfect at any of these - indeed do not always agree among themselves at any of these - but they do so with very far above chance accuracy. This would not be possible if they did not get the fundamental processes right - and if they were not in the right ball park for the subtle effects.
So, quite frankly, I consider your analogy to be on a par with somebody insisting that because a particular sum cannot be calculated in a reasonable time on an abacus, it cannot be calculated in much better time on a Cray xc-40.
Sangfroid @791:
The assumption here is that the data is not available to the public. That assumption is false. For all climate models, the basic assumptions and fundamental equations are specified in the peer reviewed literature, as for example the GISS Model E. Updates will also result in detailing in the peer reviewed literature, either in seperate papers for major updates, or as part of the paper in which the update is first used for minor updates. Further, for some models (notably the GISS Model E) full code is available for earlier versions, and considerable effort is made to make the code available to the public in a convenient format, as detailed here. Nor is NASA alone in granting this level of access to the code. Indeed, one climate model (CCSM 3.0) was explicitly designed to be available to the public, and is freely downloadable along with all relevant documentation.
So, the problem is not the availability of code and assumptions for analysis. It is that so called "skeptics" do not make use of resources made available to them to run their own climate experiments, or to modify the models according to the principles they think will hold. I presume that is because they are quite aware that the result, if they did, would be a very much poorer fit with the data than is provided by the standard models.
Tom's
That answer is spot on. I have to write that down. I think its worth reemphasizing that the models do not make a sngle set of predictions - for example of global temperature. People who question models often talk as if they do, but in fact these models actually make many different predictions about the atmospheric and climate. Each of these can be compared to observation. the number of different sorts of predictions actually provides a fairly stringent test of the models
typos!
Sangfroid, you wrote "Most scientists do not understand randomness and the role it plays in all aspects of our lives. We exist totally due to randomness."
You are wrong on both counts. For example, biological evolution is not "totally random."
Regarding weather versus climate, see the post "The difference between weather and climate." After you read the Basic tabbed pane, click the Intermediate tab.
See also "Chaos theory and global warming: can climate be predicted?" which has Basic and Intermediate tabbed panes. And "The chaos of confusing the concepts."
If after that you still believe most scientists do not understand randomness, read the seven-part series "Natural Variability and Chaos" at ScienceOfDoom.
sangfroid
"Most scientists do not understand randomness and the role it plays in all aspects of our lives"
Excuse me while I pick my jaw up of the floor!
Understanding of 'randomness' is absolutely central to science. I would back 100 scientist's understanding of statistics against 100n people from just about any other background - apart perhaps from pure statisticians.
So your comment "Weather - despite how much we think we understand the interactions of everything that affects weather - is totally random" betrays a deep limitation in your understanding of both weather and statistics.
Weather is an example of bounded randomness. A process that displays degrees of randomness, but within bounds imposed by non-random processes. Primarily the Conservation Laws. Randomness for example could never produce high pressure systems over the entire planet - the Law of Conservation of Energy prohibits that.
Some models predict better than others and failing to adequately account for emerging environmental factors of differing importance - for instance the increasing importance of precipitation data - will likely, over time, negatively impact a model's predictive capacity.
[JH] You are once again skating on the thin ice of sloganeering which is prohibited by the SkS Comments Policy.
Please note that posting comments here at SkS is a privilege, not a right. This privilege can be rescinded if the posting individual treats adherence to the Comments Policy as optional, rather than the mandatory condition of participating in this online forum.
Please take the time to review the policy and ensure future comments are in full compliance with it. Thanks for your understanding and compliance in this matter.
You will note that IPCC reports make heavy use of CMIP model runs.
CMIP = Coupled Model Intercomparison Project. Read about it here.
Funnily enough it exists to highlight and explore differences between models and understand what is going on.