Climate Science Glossary

Term Lookup

Enter a term in the search box to find its definition.

Settings

Use the controls in the far right panel to increase or decrease the number of terms automatically displayed (or to completely turn that feature off).

Term Lookup

Settings


All IPCC definitions taken from Climate Change 2007: The Physical Science Basis. Working Group I Contribution to the Fourth Assessment Report of the Intergovernmental Panel on Climate Change, Annex I, Glossary, pp. 941-954. Cambridge University Press.

Home Arguments Software Resources Comments The Consensus Project Translations About Support

Bluesky Facebook LinkedIn Mastodon MeWe

Twitter YouTube RSS Posts RSS Comments Email Subscribe


Climate's changed before
It's the sun
It's not bad
There is no consensus
It's cooling
Models are unreliable
Temp record is unreliable
Animals and plants can adapt
It hasn't warmed since 1998
Antarctica is gaining ice
View All Arguments...


Username
Password
New? Register here
Forgot your password?

Latest Posts

Archives

How reliable are climate models?

What the science says...

Select a level... Basic Intermediate

Models successfully reproduce temperatures since 1900 globally, by land, in the air and the ocean.

Climate Myth...

Models are unreliable

"[Models] are full of fudge factors that are fitted to the existing climate, so the models more or less agree with the observed data. But there is no reason to believe that the same fudge factors would give the right behaviour in a world with different chemistry, for example in a world with increased CO2 in the atmosphere."  (Freeman Dyson)

At a glance

So, what are computer models? Computer modelling is the simulation and study of complex physical systems using mathematics and computer science. Models can be used to explore the effects of changes to any or all of the system components. Such techniques have a wide range of applications. For example, engineering makes a lot of use of computer models, from aircraft design to dam construction and everything in between. Many aspects of our modern lives depend, one way and another, on computer modelling. If you don't trust computer models but like flying, you might want to think about that.

Computer models can be as simple or as complicated as required. It depends on what part of a system you're looking at and its complexity. A simple model might consist of a few equations on a spreadsheet. Complex models, on the other hand, can run to millions of lines of code. Designing them involves intensive collaboration between multiple specialist scientists, mathematicians and top-end coders working as a team.

Modelling of the planet's climate system dates back to the late 1960s. Climate modelling involves incorporating all the equations that describe the interactions between all the components of our climate system. Climate modelling is especially maths-heavy, requiring phenomenal computer power to run vast numbers of equations at the same time.

Climate models are designed to estimate trends rather than events. For example, a fairly simple climate model can readily tell you it will be colder in winter. However, it can’t tell you what the temperature will be on a specific day – that’s weather forecasting. Weather forecast-models rarely extend to even a fortnight ahead. Big difference. Climate trends deal with things such as temperature or sea-level changes, over multiple decades. Trends are important because they eliminate or 'smooth out' single events that may be extreme but uncommon. In other words, trends tell you which way the system's heading.

All climate models must be tested to find out if they work before they are deployed. That can be done by using the past. We know what happened back then either because we made observations or since evidence is preserved in the geological record. If a model can correctly simulate trends from a starting point somewhere in the past through to the present day, it has passed that test. We can therefore expect it to simulate what might happen in the future. And that's exactly what has happened. From early on, climate models predicted future global warming. Multiple lines of hard physical evidence now confirm the prediction was correct.

Finally, all models, weather or climate, have uncertainties associated with them. This doesn't mean scientists don't know anything - far from it. If you work in science, uncertainty is an everyday word and is to be expected. Sources of uncertainty can be identified, isolated and worked upon. As a consequence, a model's performance improves. In this way, science is a self-correcting process over time. This is quite different from climate science denial, whose practitioners speak confidently and with certainty about something they do not work on day in and day out. They don't need to fully understand the topic, since spreading confusion and doubt is their task.

Climate models are not perfect. Nothing is. But they are phenomenally useful.

Please use this form to provide feedback about this new "At a glance" section. Read a more technical version below or dig deeper via the tabs above!


Further details

Climate models are mathematical representations of the interactions between the atmosphere, oceans, land surface, ice – and the sun. This is clearly a very complex task, so models are built to estimate trends rather than events. For example, a climate model can tell you it will be cold in winter, but it can’t tell you what the temperature will be on a specific day – that’s weather forecasting. Climate trends are weather, averaged out over time - usually 30 years. Trends are important because they eliminate - or "smooth out" - single events that may be extreme, but quite rare.

Climate models have to be tested to find out if they work. We can’t wait for 30 years to see if a model is any good or not; models are tested against the past, against what we know happened. If a model can correctly predict trends from a starting point somewhere in the past, we could expect it to predict with reasonable certainty what might happen in the future.

So all models are first tested in a process called Hindcasting. The models used to predict future global warming can accurately map past climate changes. If they get the past right, there is no reason to think their predictions would be wrong. Testing models against the existing instrumental record suggested CO2 must cause global warming, because the models could not simulate what had already happened unless the extra CO2 was added to the model. All other known forcings are adequate in explaining temperature variations prior to the rise in temperature over the last thirty years, while none of them are capable of explaining the rise in the past thirty years.  CO2 does explain that rise, and explains it completely without any need for additional, as yet unknown forcings.

Where models have been running for sufficient time, they have also been shown to make accurate predictions. For example, the eruption of Mt. Pinatubo allowed modellers to test the accuracy of models by feeding in the data about the eruption. The models successfully predicted the climatic response after the eruption. Models also correctly predicted other effects subsequently confirmed by observation, including greater warming in the Arctic and over land, greater warming at night, and stratospheric cooling.

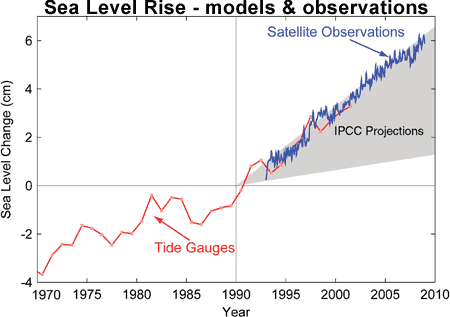
The climate models, far from being melodramatic, may be conservative in the predictions they produce. Sea level rise is a good example (fig. 1).

Fig. 1: Observed sea level rise since 1970 from tide gauge data (red) and satellite measurements (blue) compared to model projections for 1990-2010 from the IPCC Third Assessment Report (grey band).  (Source: The Copenhagen Diagnosis, 2009)

Here, the models have understated the problem. In reality, observed sea level is tracking at the upper range of the model projections. There are other examples of models being too conservative, rather than alarmist as some portray them. All models have limits - uncertainties - for they are modelling complex systems. However, all models improve over time, and with increasing sources of real-world information such as satellites, the output of climate models can be constantly refined to increase their power and usefulness.

Climate models have already predicted many of the phenomena for which we now have empirical evidence. A 2019 study led by Zeke Hausfather (Hausfather et al. 2019) evaluated 17 global surface temperature projections from climate models in studies published between 1970 and 2007.  The authors found "14 out of the 17 model projections indistinguishable from what actually occurred."

Talking of empirical evidence, you may be surprised to know that huge fossil fuels corporation Exxon's own scientists knew all about climate change, all along. A recent study of their own modelling (Supran et al. 2023 - open access) found it to be just as skillful as that developed within academia (fig. 2). We had a blog-post about this important study around the time of its publication. However, the way the corporate world's PR machine subsequently handled this information left a great deal to be desired, to put it mildly. The paper's damning final paragraph is worthy of part-quotation:

"Here, it has enabled us to conclude with precision that, decades ago, ExxonMobil understood as much about climate change as did academic and government scientists. Our analysis shows that, in private and academic circles since the late 1970s and early 1980s, ExxonMobil scientists:

(i) accurately projected and skillfully modelled global warming due to fossil fuel burning;

(ii) correctly dismissed the possibility of a coming ice age;

(iii) accurately predicted when human-caused global warming would first be detected;

(iv) reasonably estimated how much CO2 would lead to dangerous warming.

Yet, whereas academic and government scientists worked to communicate what they knew to the public, ExxonMobil worked to deny it."
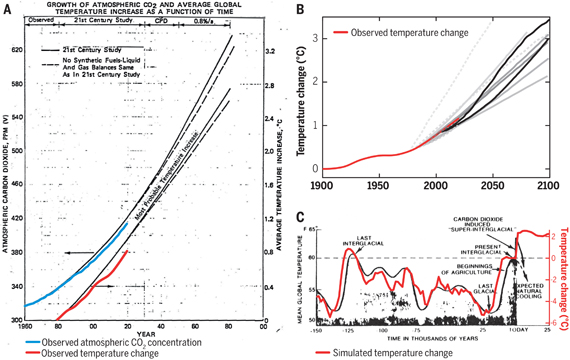

Exxon climate graphics from Supran et al 2023

Fig. 2: Historically observed temperature change (red) and atmospheric carbon dioxide concentration (blue) over time, compared against global warming projections reported by ExxonMobil scientists. (A) “Proprietary” 1982 Exxon-modeled projections. (B) Summary of projections in seven internal company memos and five peer-reviewed publications between 1977 and 2003 (gray lines). (C) A 1977 internally reported graph of the global warming “effect of CO2 on an interglacial scale.” (A) and (B) display averaged historical temperature observations, whereas the historical temperature record in (C) is a smoothed Earth system model simulation of the last 150,000 years. From Supran et al. 2023.

 Updated 30th May 2024 to include Supran et al extract.

Various global temperature projections by mainstream climate scientists and models, and by climate contrarians, compared to observations by NASA GISS. Created by Dana Nuccitelli.

Last updated on 30 May 2024 by John Mason. View Archives

Printable Version  |  Offline PDF Version  |  Link to this page

Argument Feedback

Please use this form to let us know about suggested updates to this rebuttal.

Further reading

Carbon Brief on Models

In January 2018, CarbonBrief published a series about climate models which includes the following articles:

Q&A: How do climate models work?
This indepth article explains in detail how scientists use computers to understand our changing climate.

Timeline: The history of climate modelling
Scroll through 50 key moments in the development of climate models over the last almost 100 years.

In-depth: Scientists discuss how to improve climate models
Carbon Brief asked a range of climate scientists what they think the main priorities are for improving climate models over the coming decade.

Guest post: Why clouds hold the key to better climate models
The never-ending and continuous changing nature of clouds has given rise to beautiful poetry, hours of cloud-spotting fun and decades of challenges to climate modellers as Prof Ellie Highwood explains in this article.

Explainer: What climate models tell us about future rainfall
Much of the public discussion around climate change has focused on how much the Earth will warm over the coming century. But climate change is not limited just to temperature; how precipitation – both rain and snow – changes will also have an impact on the global population.

Update

On 21 January 2012, 'the skeptic argument' was revised to correct for some small formatting errors.

Denial101x videos

Here are related lecture-videos from Denial101x - Making Sense of Climate Science Denial

Additional video from the MOOC

Dana Nuccitelli: Principles that models are built on.

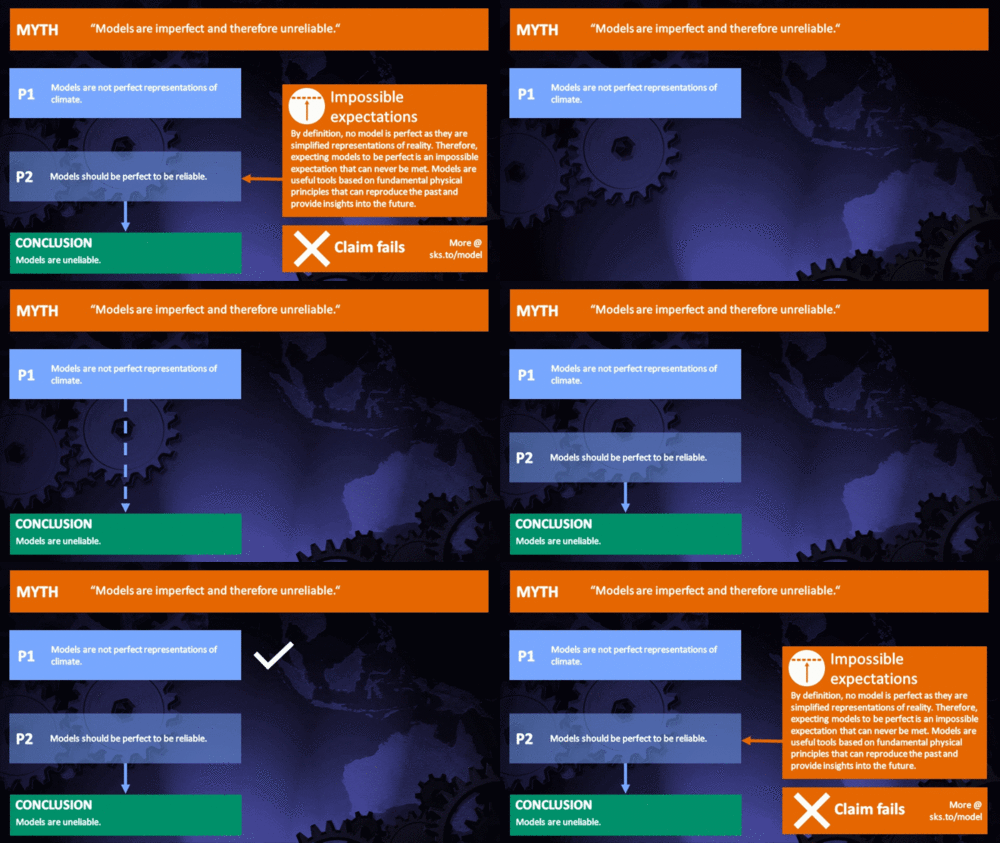
Myth Deconstruction

Related resource: Myth Deconstruction as animated GIF

MD Model

Please check the related blog post for background information about this graphics resource.

Fact brief

Click the thumbnail for the concise fact brief version created in collaboration with Gigafact:

fact brief

Comments

Prev  1  2  3  4  5  6  7  8  9  10  11  12  13  14  15  16  17  18  19  20  Next

Comments 76 to 100 out of 1329:

  1. Don't be silly Dan. You don't need to point out that you're parotting phrases from post to post..we can see that ourselves! The point is that your parroted phrases are illogical. The fact that insolation effects drive downtrends in temperature while CO2 levels remain high doesn't necessarily say anything about the net feedbacks to raised CO2 levels at constant insolation. This is explained in my post #64. You could look at the papers cited in that post which will enlighten you considerably about the rather straightforward phenomenon of Milankovitch-forced warming/cooling transitions. Look at the papers John Cook links to here, for example: http://www.skepticalscience.com/co2-lags-temperature.htm (Petit et al, 1999 and Shackleton, 2000 are two helpful papers.) You would also benefit from reading: Kawamura et al (2007) Northern Hemisphere forcing of climate cycles in Antarctica over the past 360,000 years. Nature 448, 912-918. Although your conundrum has been resolved by explanation several times already, here's another explanation: (i) raised CO2 levels stay raised for long periods, since CO2 is drawn out of the atmosphere rather slowly, for example in response to temperature downtrends. (ii) therefore if insolation effects (due to Milankovitch cycles) reduce critical insolation, the Earth's temperature will drop even 'though CO2 levels remain high. (iii) therefore during the ice age cycles, insolation changes that drive temperature changes will precede the CO2 responses. (iv) this doesn't mean that variation of atmospheric CO2 at constant insolation doesn't have associated positive feedbacks. All of the evidence (that we can measure in the real world, including an increase in tropospheric humidity as a feedback response to raised tropospheric warming, and reduced albedo due to surface ice recession and so on) indicates that the effects of CO2 variations are amplified by net positive feedbacks. (v) one can point out a simple analogy of the day/night cycle. Although atmospheric CO2 levels don't change overnight and remain very very high, as the sun goes down, the temperature measured at the Earth's surface drops. (vi) In other words a temperature downtrend at high/highish atmospheric CO2 levels only means that the particular driver of the temperature trend at that paticular time is variation in insolation. (vii) which we all know very well since it's rather obvious and well characterized!
  2. In post #68 Chris says “What quiet sun?” There are several agencies that report on solar activity that Chris could have accessed to find out. NOAA has revised several times their predictions of the magnitude and delay of the start of cycle 24. An animated display of the revisions can be viewed at http://wattsupwiththat.com/2008/10/05/nasa-moves-the-goalposts-on-solar-cycle-24-again/ . A day-by-day report of solar activity is available at http://www.dxlc.com/solar/ and http://www.swpc.noaa.gov/forecast.html. Numerical monthly sunspot averages since 1749 are at ftp://ftp.ngdc.noaa.gov/STP/SOLAR_DATA/SUNSPOT_NUMBERS/MONTHLY. As can be observed, the sun remains quiet, even for a solar minimum. The assertion that all temperature trend direction changes are brought about by Milankovitch cycles is rejected by history and logic. The longest Milankovitch cycle is about 100,000 years and has been associated with the glacial/interglacial cycle. Most have determined that it accounts for about half of the glacial/interglacial climate change. The shortest and much weaker 23,000 year Milankovitch cycle explains only about 10% of the variance (http://www.physics.ohio-state.edu/~wilkins/energy/Companion/E16.7.pdf.xpdf) . There is no mechanism by which any Milankovitch cycle could cause the observed temperature trend changes that last only a few millenniums or so. Chris has finally (albeit inadvertently) conceded that average global temperature uptrends and downtrends take place irrespective of the atmospheric carbon dioxide level with the statement in post #78 “a temperature downtrend at high/highish atmospheric CO2 levels only means that the particular driver of the temperature trend at that particular time is variation in insolation”. Think about it. A temperature downtrend continuing for a millennium or so with the carbon dioxide level higher at any given temperature than it was during a prior uptrend. The Vostok data show repeatedly a temperature uptrend changing to a downtrend with the carbon dioxide level during the downtrend higher than it had been during the uptrend. The NOAA data are graphed at the Middlebury web site given at post #41 or at http://www.roperld.com/science/CO2_Temp.pdf . No amount of spin or deception can alter that this proves that significant net positive feedback does not exist. Without the imposition of significant net positive feedback by the GCM users, the GCMs do not predict significant global warming. The many references that Chris likes to list are evidence of the group-think mentality that permeates the climate scientist community who benefit from dire predictions.
  3. Come off it Dan.. 1) re "quiet sun". We're smack at the bottom of the solar cycle. Nothing surprising, or out of the ordinary, about that. For the last couple of years the very small reduction in solar irradiation has been opposing greenhouse-induced warming a tad...in a couple of years it will be supplementing greenhouse-induced warming. Not sure what point you're attempting to make about the fact that the sun is at the bottom of its solar cycle! 2) re Milankovitch cycles. No one says that "all temperature trend direction changes are brought about by Milankovitch cycles", so let's not make stuff up! Otherwise, I suspect that you haven't read the papers I cited. You need to come to some decision about whether you want to understand this stuff or not. Remember that the 100,000 year, the 41,000 year and the 23,000 year cycle are out of phase. So it's quite straightforward to understand how the net insolation effect can produce a pattern of cyclical temperature variation as observed in the record. So, for example, if the delta T or delta 18O records from the Dome Fuji or Vostok cores are Fourier transformed to extract their power spectra, the three dominant Milankovitch cycles stand out rather clearly (111 kyr; 41 kyr; 23 kyr). see, for example, Figure 2 of: Kawamura et al (2007) "Northern hemisphere forcing of climate cycles in Antarctica ove rthe past 360,000 years" Nature 448, 912-919. It really is difficult to see your problem....insolation changes due to Milankovitch cylces seem to have dominated temperature (and atmospheric CO2 concentration) variations during the ice age cycles. I suggest you have a more careful read of the article whose url you cited. It gives a pretty good account: http://www.physics.ohio-state.edu/~wilkins/energy/Companion/E16.7.pdf.xpdf Sadly, I suspect you're never going to get the simple and obvious truth that significant insolation changes due to the slow cyclical orbital properties of the Earth, can result in temperature changes that result in slow drops in temperature in advance of changes in atmospheric CO2 concentrations. Happily, competent scientists and policymakers don't seem to share your mental blockage! One of the things that you haven't commented on with respect to the temperature and CO2 changes due to Milankovitch effects, is the really very, very small changes in atmospheric CO2 concentrations [see for example: http://www.skepticalscience.com/co2-lags-temperature.htm]. So some of the changes over which you are very confused involve extremely small changes in atmospheric CO2; e.g. reductions of 10 or 20 ppm of atmospheric CO2 during several thousands of years. These changes are very likely a consequence of the very slow temperature drop that results from insolation changes. The amplify the cooling as expected from the basic physics of the greenhouse effect. But these changes are pretty small (i.e. changes within the major glacial-interglacial transitions). There the sorts of changes occurring over thousands of years that we are now seeing in 4-5 (10 ppm) or 8-10 (20 ppm) years at the current rate of expelling massive amounts of greenhouse gases into the atmosphere. So the Earth is warming at a rate that massively exceeds the very slow temperature changes due to the very, very slow Milankovitch cycles. During ice age cycles insolation changes dominated temperature changes with warming effects resulting in water vapour, CO2 and albedo feedbacks. Now during an extraordinarily miniscule time period in relation to the vast millenia of the ice age transitions, a rapid increase in temperature is occurring during a period of relatively constant insolation as a result of a massive hiking upwards of the atmospheric greenhouse gas concentration (with water vapour and albedo feedbacks as we can measure in the real world). It ain't rocket science Dan! And I'm afraid that blanket dismissal of scientific research that doesn't accord with your agenda, is taking conspiracy theorising too far!
  4. Contrary to the statement in post #80 “No one says that "all temperature trend direction changes are brought about by Milankovitch cycles", so let's not make stuff up”, the statement “So it's quite straightforward to understand how the net insolation effect can produce a pattern of cyclical temperature variation as observed in the record” and several similar statements in post # 80 indicate that Chris seems to realize that temperature up trends and downtrends were not driven by atmospheric carbon dioxide level in the past. In post #73 with the statement “We all know that the Earth's equilibrium temperature response has a logarithmic relationship to the atmospheric CO2 concentration” Chris appears to also understand that added increments of carbon dioxide have diminishing influence on temperature. But then Chris and apparently the rest of the alarmists fail to put the two observations together which would prove to them that temperature trends now are also not driven by atmospheric carbon dioxide level.
  5. Do you really expect that logical fallacies are going to fool anyone on a skeptics board Dan? The ice age cycles were/are dominated by Milankovitch cycles (insolation pattern variations resulting from achingly slow cyclical variations in the Earth's orbital properties). Carbon dioxide is a greenhouse gas. The Earth has a warming response to raised atmospheric CO2 of the order of 3 oC per doubling of atmospheric CO2. Each of those phenomena apply to the Earth's temperature response and both of the statements are true. They're not mutually exclusive as you attempt to insinuate. It's logically fallacious to attempt to pursue the deceit that only one thing can influence a particular parameter (like the earth's temperature).. the fallacy of the single cause. Here's what the evidence idicates rather clearly: (i) there is a clear relationship between atmopheric CO2 levels and earth's temperature throughout the last 500 million years (see citations in my post #48). (ii) this is entirely consistent with the well-established fact that CO2 is a greenhouse gas, enhanced levels of which contribute to a warming response (amplified by feedbacks like raised water vapour and albedo response that we can observe and measure in the real world). (iii) During the slow, slow ice age cycles insolation effects result in a second-order cyclical temperature variation... it ain't rocket science Dan!
  6. Not forgetting that WV is also a GG, and has considerably greater warming effect than CO2. And that during glacial cycles the amount of WV would decrease thus adding to a more rapid/longer cooling cycle. In order to reverse WV driven cooling you need to get more WV into the atmosphere...through volcanic action or increased evapo/transpiration. If you don't increase the WV content significantly CO2 levels would have to rise dramatically to get you out of the glacial cycle. But we don't see such patterns in the CO2 record, so the primary forcing has to be increasing WV.
  7. re #83 Remember that water vapour is a feedback. Its atmospheric concentration is a consequence of the atmospheric temperature (and pressure), and so the levels of water vapour respond largely to variations in the atmospheric temperature. These respond rather quickly (days-months), and so the atmospheric water vapour levels are near equilibrium with respect to the atmospheric temperature. So you can't add water vapour to the atmosphere in the manner that you suggest. Thus volcanic eruptions don't add water vapour (nor does evapo/transpiration)....in general they reduce water vapour. For example, after the 1991 Pinatubo eruption the atmospheric water vapour levels fell in response to reduced atmospheric temperature as a result of the cooling effect from the blasting of particulates high into the atmosphere and the reduction of solar irradiance at the surface [***]. So water vapour can never be a “primary forcing”. It’s quite well understood that the primary driver of the ice age cycles is the slow, slow sinusoidal variations in the earth’s orbital parameters (Milankovitch cycles). As the Milankovitch insolation takes the earth through a glacial to interglacial transition, the awesomely slow primary atmospheric warming is amplified essentially immediately by the water vapour positive feedback that occurs as a spontaneous response to atmospheric warming. This is further amplified by a slower responding CO2 feedback (which recruits its own enhanced water vapour as a positive feedback). The reverse happens during the waning phases of the Milankovitch cycles. Of course water vapour responds essentially passively to ANY forcing that results in a change in atmospheric temperature. Following volcanic eruptions the atmosphere cools and water vapour levels drop as observed [***]. And as the atmosphere warms under the forcing of massively enhanced greenhouse gas concentrations, so the atmospheric water vapour concentration response passively as a positive feedback. We can observe this in the real world too [*****]. [***] e.g. B. J. Soden et al. (2002) Global Cooling After the Eruption of Mount Pinatubo: A Test of Climate Feedback by Water Vapor. Science 296, 727-730. Abstract: The sensitivity of Earth's climate to an external radiative forcing depends critically on the response of water vapor. We use the global cooling and drying of the atmosphere that was observed after the eruption of Mount Pinatubo to test model predictions of the climate feedback from water vapor. Here, we first highlight the success of the model in reproducing the observed drying after the volcanic eruption. Then, by comparing model simulations with and without water vapor feedback, we demonstrate the importance of the atmospheric drying in amplifying the temperature change and show that, without the strong positive feedback from water vapor, the model is unable to reproduce the observed cooling. These results provide quantitative evidence of the reliability of water vapor feedback in current climate models, which is crucial to their use for global warming projections. [*****] e.g. Santer BD et al. (2007) Identification of human-induced changes in atmospheric moisture content. Proc. Natl. Acad. Sci. USA 104, 15248-15253 Soden BJ, et al (2005) The radiative signature of upper tropospheric moistening Science 310, 841-844. Gettelman A and Fu, Q. (2008) Observed and simulated upper-tropospheric water vapor feedback . J. Climate 21, 3282-3289 Buehler SA (2008) An upper tropospheric humidity data set from operational satellite microwave data. J. Geophys. Res. 113, art #D14110 Brogniez H and Pierrehumbert RT (2007) Intercomparison of tropical tropospheric humidity in GCMs with AMSU-B water vapor data. Geophys. Res. Lett. 34, art #L17912
  8. Actually a valid assessment of GCM predictions is fairly simple. But clear thinking might be prevented by the preconceived notion that increased atmospheric carbon dioxide is a significant cause of global warming. It might help to realize that the climate scientists who promote this notion did not need to learn about Dynamic System Analysis yet they impose substantial net positive feedback (feedback is a factor in Dynamic System Analysis) in their Global Climate Models which causes the models to predict significant global warming. Without the imposition of substantial net positive feedback the GCMs do not predict significant global warming. You can avoid being hoodwinked by the group-think bias of others by looking at the ‘raw’ data. First observe closely the temperature trends and carbon dioxide levels during the last glacial period (e.g. from 110,000 ybp to 20,000 ybp) as available on the web from NOAA. The data was extracted from proxies archived in the Vostok Antarctica ice cores. This is the same data that, in an unfocused view, was used in An Inconvenient Truth the substantially fictional movie that misled so many. A close look at this data exposes the mistake. The digital temperature data is available at http://cdiac.ornl.gov/ftp/trends/temp/vostok/vostok.1999.temp.dat and digital data for the Carbon dioxide levels from http://cdiac.ornl.gov/trends/co2/vostok.html . To facilitate the examination, this data is graphed as the second graph at the Middlebury web site given in post #41. If atmospheric carbon dioxide was a significant driver of average global temperature the temperature could not be in a declining trend when the atmospheric carbon dioxide level was higher that it had been when the temperature was in a rising trend. It is astounding that some supposedly cognitively competent people cannot seem to grasp this. Lacking any other knowledge one might think that if the atmospheric carbon dioxide level increases enough it may then significantly drive temperature. But when the carbon dioxide level is higher, increased increments of carbon dioxide have less influence than the same size increments had when the atmospheric carbon dioxide level was lower. Thus average global temperature was not significantly driven by atmospheric carbon dioxide level during the previous glacial period and atmospheric carbon dioxide level has even less influence on climate now.
  9. You keep repeating the same fallacious non-sequiters Dan without addressing straightforward critique. 1. Real world observations strongly support positive feedbacks to CO2-induced warming. We can measure the major feedback (enhanced water vapour) in the real world (see papers cited in my post #84), and recent work has reinforced the identification of the water vapour feedback and its quantitation: e.g. Dessler et al (2008), Water-vapor climate feedback inferred from climate fluctuations, 2003–2008, Geophys. Res. Lett., 35, L20704 for a layman's description see: http://www.nasa.gov/topics/earth/features/vapor_warming.html the identification and effects of the albedo feedback can be seen very clearly in the Arctic, and so on..So there’s no value in pretending that what exists doesn’t exist. 2. It’s rather well understood that the ice age cycles are driven by slow sinusoidal cycles in the earth’s orbital properties that alter the pattern of insolation. Sinc atmospheric CO2 levels respond very slowly to drops in global temperature (driven by Milankovitch cycles, for example), it’s not surprising that there is a significant lag between Milankovitch cooling and reduced CO2. Note that these CO2 changes in response to temperature during glacial cycles are rather small and extremely slow. They occur more than 100 times more slowly than the present rate of change in atmospheric CO2 resulting from massive burning of fossil fuels. It’s a logical fallacy to attempt the deceit that because CO2 variations weren’t the primary driver of temperature changes during ice age cycles (it amplified the changes of course), that massively increased atmospheric CO2 levels won’t increase the earth’s temperature under conditions of relatively stable insolation. 3. …and yes, we all know that the earth’s temperature varies as the logarithm of the atmospheric greenhouse gas concentrations. Welcome to the 19th century! This really has been known for more than 100 years. As we also all know, the earth’s temperature responds to enhanced atmospheric CO2 with somewhere near 3 oC of warming per doubling of atmospheric CO2. So yes, if we ramp up the atmospheric CO2 concentrations we expext that the world will warm. That’s also pretty consistent with real world observations. It's the greenhouse effect Dan!
  10. Here again you use a time period that includes the murky transitions from interglacial to glacial and glacial to interglacial instead of sticking to a period that excludes the transitions and the interglacials. Stick to the time period from about 110,000 ybp to about 20,000 ybp. Then the Milankovitch effect is very small but along with other factors still drives the temperature. The effect of the atmospheric carbon dioxide at that time must have been even smaller since it does not drive the temperature. We know that because the record shows that temperature trended down when the carbon dioxide level was higher than when the temperature was trending up. If you have a rational explanation that proves otherwise than give it. Your endlessly quoting fellow victims of group-think proves nothing. Oh, and in the world that I am in, there is 6% more arctic ice than last year, average global temperature in 2008 is the lowest this century and the atmospheric carbon dioxide level has increased since 2000 by about 14% of the total rise since the start of the industrial revolution. What world are you in?
  11. You're not paying attention Dan. This was all explained to you in posts #78 and #80 above. Remember that the earth's orbital parameters are characterized by three major cycles having periods near 100,000 years, 41,000 years and 23,000 years. Since these cycles are out of phase a rather complex insolation pattern accrues from the "summation" of the cycles which matches the ice core data quite well. You'd benefit from reading this paper which describes some of the data in a manner that you could probably understand. Figure 2 is interesting; it illustrates the extraction of the earth's orbital cycles by Fourier transformation of ice core data on proxy temperature and 18O variations. The power spectrum shows clear strong peaks at 111,000, 41,000 and 23,000 years, which matches the orbital cycle frequencies rather well: Kawamura et al (2007) "Northern hemisphere forcing of climate cycles in Antarctica over the past 360,000 years" Nature 448, 912-919. You would also benefit from reading some of the papers John Cook discusses in his article on top of this thread. You shouldn't be frightened of the science Dan. Averting your eyes from scientific papers with schoolboy insults will only leave you woefully misinformed.
  12. In post #80 Chris said “…the simple and obvious truth that significant insolation changes due to the slow cyclical orbital properties of the Earth, can result in temperature changes that result in slow drops in temperature in advance of changes in atmospheric CO2 concentrations…”. That is a fairly clear statement that Chris correctly perceives that atmospheric carbon dioxide level change did not cause average global temperature change during the last glacial period but in fact carbon dioxide level change lagged temperature change (the Middlebury site at post #41 gives links to the NOAA data that show this). In post #73 with the statement “We all know that the Earth's equilibrium temperature response has a logarithmic relationship to the atmospheric CO2 concentration” Chris appears to also correctly understand that added increments of carbon dioxide now have less influence on temperature compared to the influence on temperature that previous increments of the same size had when the atmospheric carbon dioxide level was lower and atmospheric carbon dioxide level did not drive temperature. But then Chris appears to ignore these correct perceptions and instead switches to the alarmist mantra that added atmospheric carbon dioxide now will cause a devastating increase in average global temperature. Perhaps Chris has abandoned logic and/or common sense as a result of becoming immersed in some of the products of group-think that he/she thinks passes for science. Or maybe he/she has simply become confused by the plethora of insignificant and/or irrelevant minutia. It will be interesting to find out just how cold the planet will need to get before the alarmists begin to realize that maybe they missed something. The rapidly growing number of scientists who recognize that it is a mistake to think that the planet will significantly warm because of increased atmospheric carbon dioxide may be an indication that this has already started to occur. It will probably take longer for the technologically incompetent politicians to relinquish their prosperity-diminishing control.
  13. It's really difficult to see your confusion Dan. For some reason you can't avoid linking a couple of straightforward truths together into a fallacious false premise. Incidentally, you didn't thank me for explaining the origin of your confusion over temperature transitions during glacial periods and their relationship to the insolation variations arising from out of phase elements of the earth's orbital properties. Anyway, it might help if we went away from the qualitative arguments that are scuppering your ability to create a logical progression, and looked at some numbers. Here are the two "truths" (i.e. conclusions strongly supported by real world evidence). Note that you got the first one wrong: (i) During ice age transitions, the temperature changes are driven by insolation changes resulting from Milankovitch cycles. During warming phases small amounts of CO2 are recruited from ocean and terrestrial stores and these amplify the Milankovitch-driven warming. The earth has a climate sensitivity near 3 oC of warming per doubled atmospheric CO2 as we know. (ii) During the present, atmospheric CO2 levels are racing upwards due to massive burning of fossil fuels sequestered for many 10's and 100's of millions of years underground. The rate of increase of atmospheric CO2 is more than 100 times faster than during ice age transitions (e.g. ~ 2.5 ppm per year now compared with < 2 ppm per 100 years during the last glacial to interglacial transition averaged over the period ~15,000 to ~10,000 ago). In each case the climate sensitivity is equivalent to around 3 oC of warming from raised CO2 levels per doubling of atmopsheric CO2. Let's look at the numbers. Since the earth's temperature has a logarithmic response to CO2 and the climate sensitivity is near 3 oC per doubling of atmospheric CO2 we can easily use some scientific graphing software with a straightforward log equation to determine the earth's temperature response at equilibrium resulting from the CO2 increases during the two circumstances (glacial to interglacial transition 15,000-10,000 years ago and the contemporary period): a. glacial to interglacial Atmospheric CO2 rose from ~180 ppm to ~270 ppm. This gives a temperature rise of ~ 1.8 oC at equilibrium based on a climate sensitivity of 3 oC per doubling. This is around the contribution to the temperature change during the glacial to interglacial transition arising from the increase in atmospheric CO2 and incorporates the feedbacks specific to the raised CO2 (the CO2 proportion of the water vapour and albedo feedback). b. Contemporary CO2 changes. Now the CO2 is being dumped straight into the atmosphere as a direct forcing. Its concentration change still results in a temperature response near 3 oC of warming per doubling. So far we've raised CO2 levels from 280 ppm to 386 ppm. Go back to our graph and read off the temperature change at equilibrium. This gives a temperature rise near 1.4 oC at equilibrium of which we've had around 0.8 oC so far. For contemporary warming the rate of CO2 increase is much faster that the earth can respond (i.e. come to temperature equilbrium), and so we still have a considerable amount of warming "in the pipeline", even if the CO2 levels were to stop dead at 386 ppm. We could look at the future. Atmospheric CO2 levels are rising at 2.5 ppm per year and still accelerating. Here's the temperature increase (over pre-industrial levels) that would result at equilibrium assuming we were to halt atmospheric CO2 concentrations at the following levels: we're at 386 ppm now: 1.4 oC above preindustrial levels at equilibrium 400 ppm 1.55 oC 450 ppm 2.05 oC 500 ppm 2.51 oC 550 ppm 2.88 oC 600 ppm 3.30 oC ...and so on....
  14. whoops....550 ppm should give a temp rise of 2.92 oC at equilibrium with a climate sensitivity of 3 oC per doubling of atmospheric CO2.
  15. Dan Chris is a believer in equilibrium, a weird and non-existant concept. You see, without the concept of equilibrium, the entire AGW hypothesis comes apart. You might find this concept of interest: Letter abstract Nature Geoscience 2, 28 - 31 (2009) Published online: 14 December 2008 | doi:10.1038/ngeo388 Subject Categories: Atmospheric science | Climate science Age of stratospheric air unchanged within uncertainties over the past 30 years A. Engel1, T. Möbius1, H. Bönisch1, U. Schmidt1, R. Heinz2, I. Levin2, E. Atlas3, S. Aoki4, T. Nakazawa4, S. Sugawara5, F. Moore6, D. Hurst6, J. Elkins6, S. Schauffler7, A. Andrews6 & K. Boering8 "The rising abundances of greenhouse gases in the atmosphere is associated with an increase in radiative forcing that leads to warming of the troposphere, the lower portion of the Earth’s atmosphere, and cooling of the stratosphere above1. A secondary effect of increasing levels of greenhouse gases is a possible change in the stratospheric circulation2, 3, which could significantly affect chlorofluorocarbon lifetimes4, ozone levels5, 6 and the climate system more generally7. Model simulations have shown that the mean age of stratospheric air8 is a good indicator of the strength of the residual circulation9, and that this mean age is expected to decrease with rising levels of greenhouse gases in the atmosphere10. Here we use balloon-borne measurements of stratospheric trace gases over the past 30 years to derive the mean age of air from sulphur hexafluoride (SF6) and CO2 mixing ratios. In contrast to the models, these observations do not show a decrease in mean age with time. If models are to make valid predictions of future stratospheric ozone levels, and of the coupling between ozone and climate change, a correct description of stratospheric transport and possible changes in the transport pathways are necessary." An article referencing this paper: Does Global Warming Lead To A Change In Upper Atmospheric Transport? ScienceDaily (Dec. 24, 2008) — Most atmospheric models predict that the rate of transport of air from the troposphere to the above lying stratosphere should be increasing due to climate change. Surprisingly, Dr. Andreas Engel together with an international group of researchers has now found that this does not seem to be happening. On the contrary, it seems that the air air masses are moving more slowly than predicted. This could also imply that recovery of the ozone layer may be somewhat slower than predicted by state-of-the-art atmospheric climate models.
  16. surely not! Are you really suggesting that "equilibrium is a weird and non-existant concept?" There isn't a quality more fundamental to the natural world than "equilibrium" Quietman. Let me give you a simple example. You've been away on a trip during the winter. You come back to your chilly house left without any heat on. You turn on the heating and set the thermostat to 18oC. What happens? Does the house temperature instantaneously become 18oC? Not really. And when the temperature eventually reaches 18 oC what's going on? I think you'll find that the temperature in your house has settled at an equilibrium temperature of 18 oC as a result of a balance between warming from your radiators and heat loss to the surrounds. When you switched on your heating the house temperature was far from the equilibrium temperature you defined with your thermostat, and as it became closer and closer to 18 oC it became closer to equilibrium. Your heater transported the temperature of your house from one equilibrium temperature (in which the temperature was in or near equilibrium with the surrounds) to another equilibrium temperature (in which the rate of heat input and loss is in equilibrium).
  17. Between 1970 & 2000, CO2 levels rose from 324ppm to 368ppm with a decadal increase of around 4~4.5%. (1970~324, 1980~337, 1990~353, 2000~368) The GISS data shows a decadal increase in GMT of 0.17C over the same period, ie. GMT rose 0.51C during those 30 years.(15% of that 3C doubling) But the CO2 level rose 14.8% in the same period (48ppm) So what happened to the logarithmic progression? Also, in 1800 the GMT was between -0.5 to -0.8C below GMT in 2000: The CO2 level in 1800 was 280ppm and in 2000 was 368...an increase of 67% that yielded a rise in GMT of less than 1C.
  18. chris Your house is engineered, the planet is not. Equilibrium as a concept does not apply to climate because it does not exist in nature. There is NO natural balance, NO natural state of the Earth, NO Earth normal temperature or climate. There is only a desired equilibrium but it is man's desire, not natural.
  19. ps Your argument sounds like applying the 2nd law of thermodynamics to living organisms. Are you a creationist by any chance?
  20. pps Someone once tried to tell me the earth was a closed system too. You are not in that camp are you?
  21. Don't be silly Quietman. Of course "equilibrium as a concept" applies to natural systems. Of course the 2nd law of thermodynamics applies to living organisms. One needs a basic level of understanding to address these things, but we're only talking about High School level.
  22. Re #94 It's not obvious what your point is Mizimi. You've quoted lots of numbers, but they can only be considered with respect to specific relationships that address real or potential correlations between the parameters defined by the numbers. It's not clear what you consider the relationships to be, as so we can't really address your point...
  23. #99 I'm asking a question. In the 30yrs from 1970 - 2000, the CO2 level rose 14.8% and the GMT rose 0.51C. From 1800 - 2000 the CO2 level rose 67% and the GMT rose between 0.5 and 0.8C How do you reconcile these ??
  24. I don't see your point Mizimi. If you take the US NASA GISS or UK Hadcrut data, the Earth's global temperature has risen by 0.8 - 0.9 oC since the mid-late 19th century until 2000 (I'm using your end date of 2000, but not your start date of 1800, since I don't think we know quite so well what the temperature was in 1800). In this time the atmospheric CO2 concentration rose from 287 ppm (around 1860) to 371 ppm (2000). An increase of atmospheric CO2 from 287 ppm to 371 ppm will eventually give at equilibrium a temperature increase of around 1.1-1.2 oC within an idealized climate sensitivity of 3 oC of warming per doubling of atmospheric CO2. So even if atmospheric CO2 were to have magically steadied exactly at 2000 levels, we'd still have 0.3-0.4 oC or so of warming still to come if the earth responds exactly as predicted with a climate sensitivity of 3 oC per doubling. So there's nothing that needs reconciling is there? Of course in the real world we have to factor in the effects of atmospheric aerosols, changes in the output of the sun, volcanic eruptions, ocean currents and so on, if we want to address the specific profile of the warming trend over the past century or more.
  25. Chris, the CO2 increase your figures give is 29% resulting in a GMT increase of 0.8 to 0.9C (for 1860/2000) The figures for 1970/2000 show a CO2 increase of 14.8% which yielded an 0.51C rise. If T response is logarithmic to CO2 concentration then we should see a proportionately lower T rise between 1970/2000, and that is not obvious from the figures.

Prev  1  2  3  4  5  6  7  8  9  10  11  12  13  14  15  16  17  18  19  20  Next

Post a Comment

Political, off-topic or ad hominem comments will be deleted. Comments Policy...

You need to be logged in to post a comment. Login via the left margin or if you're new, register here.

Link to this page


The Consensus Project Website

THE ESCALATOR

(free to republish)


© Copyright 2024 John Cook
Home | Translations | About Us | Privacy | Contact Us