


 Arguments


Sun & climate: moving in opposite directions
What the science says...
| Select a level... |
 Basic
Basic
|
 Intermediate
|
 Advanced
| ||||
|
The sun's energy has decreased since the 1980s but the Earth keeps warming faster than before. |
|||||||
Climate Myth...
It's the sun
"Over the past few hundred years, there has been a steady increase in the numbers of sunspots, at the time when the Earth has been getting warmer. The data suggests solar activity is influencing the global climate causing the world to get warmer." (BBC)
At a glance
Thankfully for us, our Sun is a very average kind of star. That means it behaves stably over billions of years, steadily consuming its hydrogen fuel in the nuclear reaction that produces sunshine.
Solar stability, along with the Greenhouse Effect, combine to give our planet a habitable range of surface temperatures. In contrast, less stable stars can vary a lot in their radiation output. That lack of stability can prevent life, as we know it, from evolving on any planets that might orbit such stars.
That the Sun is a stable type of star is clearly demonstrated by the amount of Solar energy reaching Earth's average orbital position: it varies very little at all. This quantity, called the Total Solar Irradiance, has been measured for around forty years with high accuracy by sensitive instruments aboard satellites. Its average value is 1,362 watts per square metre. Irradiance fluctuates by about a watt either way, depending on where we are within the 11-year long sunspot cycle. That's a variation of no more than 0.15%.
From the early 1970s until today, the Solar radiation reaching the top of Earth's atmosphere has in fact shown a very slight decline. Through that same period, global temperatures have continued to increase. The two data records, incoming Solar energy and global temperature, have diverged. That means they have gone in opposite directions. If incoming Solar energy has decreased while the Earth continues to warm up, the Sun cannot be the control-knob of that warming.
Attempts to blame the sun for the rise in global temperatures have had to involve taking the data but selecting only the time periods that support such an argument. The remaining parts of the information - showing that divergence - have had to be ditched. Proper science study requires that all the available data be considered, not just a part of it. This particular sin is known as “cherry-picking”.
Please use this form to provide feedback about this new "At a glance" section, which was updated on May 27, 2023 to improve its readability. Read a more technical version below or dig deeper via the tabs above!
Further details
Our Sun is an average-sized main sequence star that is steadily using its hydrogen fuel, situated some 150 million kilometres away from Earth. That distance was first determined (with a small error) by a time consuming and complex set of measurements in the late 1700s. It led to the first systemic considerations of Earth's climate by Joseph Fourier in the 1820s. Fourier's number-crunching led him to realise a planet of Earth's size situated that far from the Sun ought to be significantly colder than it was. He was thereby laying the foundation stone for the line of enquiry that led after a few decades to the discovery of what we now call the Greenhouse Effect – and the way that effect changes in intensity as a response to rising or falling levels of the various greenhouse gases.
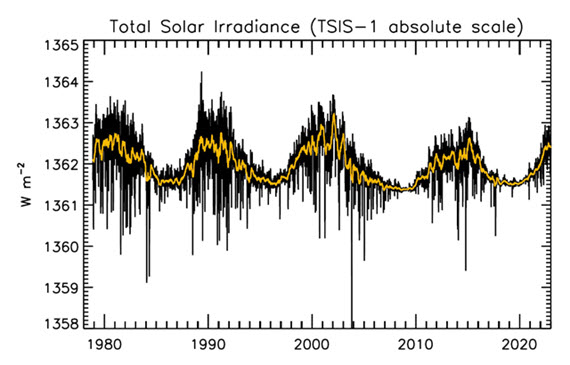
Figure 1: Plot of the observational record (1979-2022) on the scale of the TSIS-1 instrument currently flying on the space station. In this plot, the different records are all cross calibrated to the TSIS-1 absolute scale (e.g., the TSIS1-absolute scale is 0.858 W/m^2 higher than the SORCE absolute scale) so the variability of TSI in this plot is considered to be its “true variability” (within cross calibration uncertainties). Image: Judith Lean.
The Sun has a strong magnetic field, but one that is constantly on the move, to the extent that around every 11 years or so, Solar polarity flips: north becomes south, until another 11 years has passed when it flips back again. These Solar Cycles affect what happens at the surface of the Sun, such as the sunspots caused by those magnetic fields. Each cycle starts at Solar Minimum with very few or no sunspots, then rises mid-cycle towards Solar Maximum, where sunspots are numerous, before falling back towards the end. The total radiation emitted by the Sun – total solar irradiance (TSI) is the technical term – essentially defined as the solar flux at the Earth's orbital radius, fluctuates through this 11-year cycle by up to 0.15% between maximum and minimum.
Such short term and small fluctuations in TSI do not have a strong long term influence on Earth's climate: they are not large enough and as it's a cycle, they essentially cancel one another out. Over the longer term, more sustained changes in TSI over centuries are more important. This is why such information is included, along with other natural and human-driven influences, when running climate models, to ask them, “what if?"
An examination of the past 1150 years found temperatures to have closely matched solar activity for much of that time (Usoskin et al. 2005). But also for much of that time, greenhouse gas concentrations hardly varied at all. This led the study to conclude, "...so that at least this most recent warming episode must have another source."

Figure 2: Annual global temperature change (thin light red) with 11 year moving average of temperature (thick dark red). Temperature from NASA GISS. Annual Total Solar Irradiance (thin light blue) with 11 year moving average of TSI (thick dark blue). TSI from 1880 to 1978 from Krivova et al. 2007. TSI from 1979 to 2015 from the World Radiation Center (see their PMOD index page for data updates). Plots of the most recent solar irradiance can be found at the Laboratory for Atmospheric and Space Physics LISIRD site.
The slight decline in Solar activity after 1975 was picked up through a number of independent measurements, so is definitely real. Over the last 45 years of global warming, Solar activity and global temperature have therefore been steadily diverging. In fact, an analysis of solar trends concluded that the sun has actually contributed a slight cooling influence into the mix that has driven global temperature through recent decades (Lockwood, 2008), but the massive increase in carbon-based greenhouse gases is the main forcing agent at present.
Other studies tend to agree. Foster & Rahmstorf (2011) used multiple linear regression to quantify and remove the effects of the El Niño Southern Oscillation (ENSO) and solar and volcanic activity from the surface and lower troposphere temperature data. They found that from 1979 to 2010, solar activity had a very slight cooling effect of between -0.014 and -0.023°C per decade, depending on the data set. A more recent graphic, from the IPCC AR6, shows these trends to have continued.
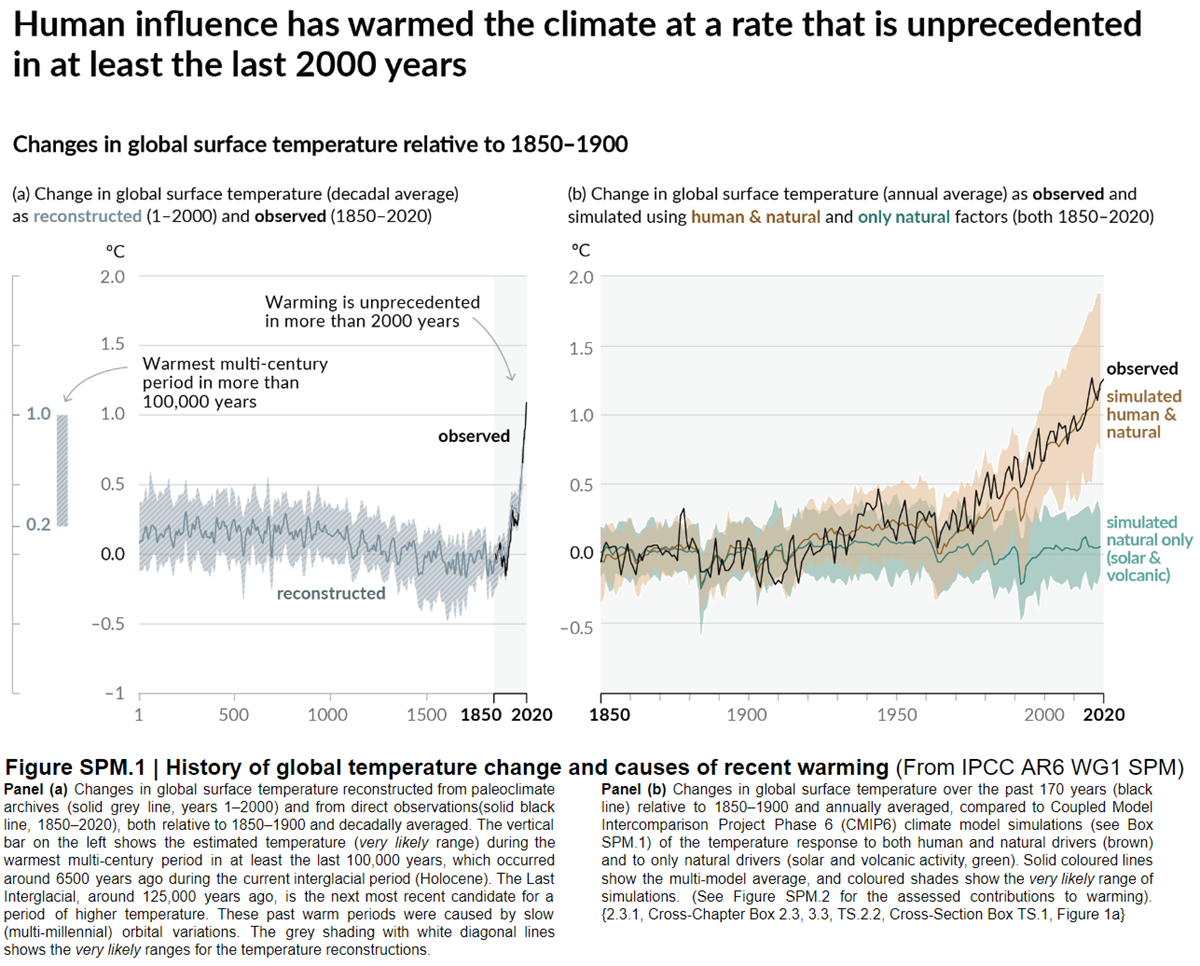
Figure 3: Figure SPM.1 (IPCC AR6 WGI SPM) - History of global temperature change and causes of recent warming panel (b). Changes in global surface temperature over the past 170 years (black line) relative to 1850–1900 and annually averaged, compared to Coupled Model Intercomparison Project Phase 6 (CMIP6) climate model simulations (see Box SPM.1) of the temperature response to both human and natural drivers (brown) and to only natural drivers (solar and volcanic activity, green). For the full image and caption please click here or on the image.
Like Foster & Rahmstorf, Lean & Rind (2008) performed a multiple linear regression on the temperature data, and found that while solar activity can account for about 11% of the global warming from 1889 to 2006, it can only account for 1.6% of the warming from 1955 to 2005, and had a slight cooling effect (-0.004°C per decade) from 1979 to 2005.
Finally, physics does not support the claim that changes in TSI drive current climate change. If that claim had any credence, we would not expect to see the current situation, in which Earth's lower atmosphere is warming strongly whereas the upper atmosphere is cooling. That is exactly the pattern predicted by physics, in our situation where we have overloaded Earth's atmosphere with greenhouse gases. If warming was solely down to the Sun, we would expect the opposite pattern. In fact, the only way to propagate this myth nowadays involves cherry-picking everything prior to 1975 and completely disregarding all the more recent data. That's simply not science.
Longer-term variations in TSI received by Earth
It's also important to mention variations in TSI driven not by Solar energy output but by variations in Earth's orbit, that are of course independent of Solar activity. Such variations, however, take place over very long periods, described by the Milankovitch orbital cycles operating over tens of thousands of years. Those cycles determine the distance between Earth and the Sun at perihelion and aphelion and in addition the tilt the planet's axis of rotation: both affect how much heat-radiation the planet receives at the top of its atmosphere through time. But such fluctuations are nothing like the rapid changes we see in the weather, such as the difference between a sunny day and a cloudy one. The long time-factor ensures that.
Another even more obscure approach used to claim, "it's the sun" was (and probably still is in some quarters) to talk about, "indirect effects". To wit, when studies can't find a sufficiently large direct effect, bring even lesser factors to the fore, such as cosmic rays. Fail.
In conclusion, the recent, post 1975 steep rise in global temperatures are not reflected in TSI changes that have in fact exerted a slight cooling influence. Milankovitch cycles that operate over vastly bigger time-scales simply don't work quickly enough to change climate drastically over a few decades. Instead, the enormous rise in greenhouse gas concentrations over the same period is the primary forcing-agent. The physics predicted what is now being observed.
Last updated on 27 May 2023 by John Mason. View Archives


Will somebody please add to the "It's the Sun" rebuttal, a section explicitly focused on addressing the sub-myth that the Earth's temperature still is catching up to the TSI increase that peaked around 1960?
At the least, that section should show that TOA energy imbalance has continued to grow since then, in contrast to its shrinkage that would be required if insulation was constant, since input has been constant (or even decreasing) and increasing temperature requires increasing output. For example, a good graph of imbalance was pointed to by jja in a comment.
It would be nice if that new section also explained that temperature response lag to increased TSI was taken into account by the many regression analyses.
Possibly relevant existing posts: "Has Earth Warmed As Much As Expected?" and "How We Know Global Warming Is Happening: Part 2." I recall that John wrote another relevant post that included energy imbalance, but I can't find it now.
HK also commented on energy imbalance, with material that might be used in the new section I requested be added to "It's the Sun."
Climate Dialogue has a good and recent overview of the Sun's potential role in Earth's temperature increase--not just with regard to the effect of a new Maunder Minimum--in its "Introduction" to its New Maunder Minimum topic.
If TSI is a forcing, shouldn't the comparison on the graph be between the temperature change and the time-integral of the TSI which exceeds break-even?
Dan Pangburn - When total forcing changes, so does the climate in response. That changes the break-even point, and the imbalance goes away.
Now if the total forcing continues to change, as we see with our GHG emissions, the climate will follow along (albeit with a lag due to thermal inertia and slower feedbacks, primarily ocean heat content on the decadal level), but if the forcing ceases to change any imbalance will decay accordingly. There is no 'fixed offset' from a TSI change in the presence of a dynamic climate response.
Short answer - a step change in forcing will cause a climate change, after which there won't be an imbalance to integrate.
KR - To have an effect, forcings, must exist for a duration. The time-integral of the forcing accounts for both a variation in magnitude and the duration.
Break-even is defined (by me) as the constant net forcing that would result in the same average global temperature (AGT) at the end of a duration as existed at the beginning. For example, the duration could start at some time during the MWP and end at a more recent time when the AGT was the same.
If net forcing exceeds break-even, AGT will rise (AGT at the end of the duration will be higher than it was at the beginning) or if it is less than break-even, AGT will decrease. (Break-even is not the static (steady-state) solution to a dynamic heat transfer problem)
The net (or total) forcing is the algebraic sum of all constituent forcings. The constituent forcings could each vary but the algebraic sum of the time-integrals of the individual constituents is the same as the time-integral of the algebraic sum of the constituents (for the same time period).
The time-integral of the algebraic sum of the constituent forcings is the energy change of the planet (for the duration of the forcings) and the energy change divided by the effective thermal capacitance (sometimes called thermal inertia) of the planet is the AGT change (during the time period).
If TSI is considered to be one of the constituent forcings, then its effect on AGT (as one of the constituents, its contribution to the total AGT change) is determined by its time-integral. To be conceptually correct, when on the same graph, the time-integral of TSI is the correct metric for comparison with AGT change.
Dan Pangburn @1106:
1) Your formulation ignores Outgoing Longwave Radiation (OLR), which is to a close approximation a linear function of Global Mean Surface Temperature (GMST). You also ignore change in heat content. Specifically:
αΔT = ΔQ - ΔF,
where ΔT is the change in temperature, ΔQ is he change in heat content, and ΔF is the change in forcing, and α is the climate feedback parameter, ie, the change in OLR in Watts per meter squared per unit change in temperature in degrees Kelvin. (The climate senstitivity parameter should not be confused with the climate sensitivity factor, λ, which is 1/α.)
Because OLR is a function of temperature, you can in theory have identical forcing histories with different temperature histories and end up with a different final temperature as a result. Ergo, your concept of "break-even" is undefined. There is no unique integral of forcing history such that given that forcing history the temperature will always be the same at the initial and final points of the period of integration.
2) Ignoring point (1), if your analysis is correct, then if we have a period, t, over which we have an integral of forcing, then we also have two non-overlapping periods of lenght t/2 in which the same reasoning applies.
Now consider three possible forcing histories, each with the same integral of forcing. In history A, forcing is constant over the full period at "break even". In history B, forcing stars at half of the level in history A, and increases linearly to 1.5 times the forcing in history A. In history C, forcing is the mirror image of history B, starting high and ending low. In each case, the integral of forcing over the full history is identical, and at break even.
Given your reasoning, however, the integrals of forcing for the first half of t are 0.5, 0.375 and 0.625 for A, B and C respectively, treating the forcing integral over the full period as being 1. Conversely, the integrals over the second period are 0.5, 0.625 and 0.375 respectively. Ergo, according to your reasoning, temperatures will stay constant in history A, initially fall, and then rise in history B, and initially rise and then rise in history C. Ergo, according to your theory we can distinguish as to whether a given forcing is an adequate account of a temperature change by tracking not just the integral, but the integral over subunits of the total time.
Indeed, according to your theory, if we make the subunits the smallest value for which we have clear resolution of the data, temperatures over those subunits should track the integral of forcing over those subunits. In fact, ignoring noise, if a given factor is the dominant forcing, temperature should track the actual forcing with high correlation.
But, of course, temperature does not track TSI with high correlation. That is why you introduced your theory to begin with. Ergo, your theory actually disproves your contention unless you deliberately avoid applying it critically. That is, your argument only looks good by avoiding detailed analysis.
Tom - It appears that your equation has forcing, in Joules per sec (aka watts) subtracted from energy, in Joules. That would be like subtracting your speed in mph from your distance traveled, in miles.
Perhaps it is unclear that the beginning and ending temperatures are the same in the definition of break-even. Given that requirement, the time-integral of the forcing from beginning to end must be zero. Then each of the periods A, B, and C must (by definition) begin and end at the same temperature and the time-integral of the forcings for each of them must all also be zero.
This has only to do with the meaning of the word 'forcing' as used in discussing climate change.
Dan Pangburn @1108:
1) ΔQ is actually average rate of change of heat content per unit area. That means all units on the right hand side are in terms of Watts per meter squared, and on the left hand side the units are Degrees Kelvin times Watts per meter squared per degree Kelvin = Watts per meter squared. I apologize for the mistatement. My mistatement in no way, however, justifies your failure to account for either OLR or ΔQ in your formulation.
2) Forcing is by definition "...is the change in the net, downward minus upward, radiative flux (expressed in W m–2) at the tropopause or top of atmosphere due to a change in an external driver of climate change, such as, for example, a change in the concentration of carbon dioxide or the output of the Sun" (AR5). As the forcing is a change, it must be specified relative to a particular index time. By convention, and by specification in AR5, that time is 1750. It can, however, be any time. There is no need for it to be the start time of any given period. Ergo, your definition of "break-even" is satisfied by my examples on condition that ΔQ = 0 at the initial point.
That, however, is entirely a distraction. My example can be easilly reworked so that the forcing in Scenario A is 0, that in Scenario B it starts at - N, and ends at + N, with a linear trend throughout, and so that in Scenario C it starts at + N and ends at - N, with a linear trend throughout. Once N, and the duration is specified, the logical consequences are the same. That, I believe is self evident so I wonder why you are distracting with irrelevant (and fallacious) trivia rather than actually trying to deal with the argument.
Until you get the 'trivia' right, it's not a distraction.
A forcing must act for a period of time to have an effect on average global temperature (AGT). The forcing is not the difference between what it was at one time (1750) compared to what it is at another time (now). To determine the effect that a forcing has on AGT requires the time-integral of the difference between the forcing and the break-even forcing. If the forcing goes from .5 below break-even linearly to .5 above break-even during the time period, the time-integral for that time period is zero.
Dan Pangburn - The integrated imbalance is of great interest, and is perhaps best seen in ocean heat content changes that in fact tell what what the long term imbalances have been. But the direction of change is driven by the sign (and magnitude) of that forcing imbalance against the thermal inertia of the climate, hence the graph in the (Basic) opening post showing changes in solar forcing is indeed quite relevant.
However, I have to say that it's very unclear to me what your actual point(s) might be in this exchange. Are you arguing for a larger influence from solar changes than is generally accepted? Do you have an alternate graph to in your opinion better display the information already presented?
Dan Pangburn @1110:
You say:
Yet I have now corrected for the trivial points you raised, and you are still not responding to the thrust of the argument. Ergo, your intent was not to correct the trivia but to distract from the thrust of the argument, which you are unable to answer.
You go on to say:
Except that is plainly false. I quoted from the IPCC AR5 WG1 glossary as to the definition of forcing. You can trace that definition back through the reports, and through the scientific literature if you want, but the definition is as I have given it. If you want to introduce a different concept into climate science, introduce a new term and define it explicitly. Stop using ambiguity to conceal the weakness of your argument. Alternatively, if you want to use the currently accepted term in climate science, "forcing", use it as currently defined, and stop trying to give it an idiosyncratic defintion.
I will note that there are very good reasons for the standard definition. Explicitly, your definition only works if there is no change in temperature due to other reasons (ie, no other forcings, and no internal variability). It also only works if the time integral of (OLR minus initial OLR) is zero over the "break even" period. Further, it depends on there being intervals of zero net change in OLR, temperature and heat flux to benchmark the 0 value of the forcings. When you show me that period over which we have reasonably accurate measurements of all relevant values, I might consider using your definition.
Finally, you comment that:
Well, yes. But the time integral over the first half of the period is negative, and the time integral over the second half is positive. Ergo, you are compelled (of you wish to be reasonable) to accept that even with your abberant and idiosyncratic definition of forcing, the temperature histories of scenarios A, B and C will be different. That being the case, only looking at the initial temperature and final temperature to determine whether a particular forcing could be the main driver of change in GMST is to simply avoid the majority of the evidence. It is to argue by hiding data, not by examining it.
KR - I don't believe that atmospheric CO2 increasing from 3 parts in 10,000 to 4 parts in 10,000 has significantly changed the way that the oceans absorb sunlight.
My only point in this discussion is, to be a meaningful comparison, the temperature change should be compared to the time-integral of the forcing instead of the forcing itself.
Tom - It is puzzling why you declare that my definition of forcing is bogus when I have not even defined forcing. I assumed that everyone knew what cosntituted a forcing. My understanding is no different from AR5 (except my analysis has found that CO2 has no significant effect on climate).
I HAVE defined 'break-even'.
If you cannot see that the energy change (which, when divided by effective thermal capacitance, is temperature change) is the time-integral of the energy change rate (AKA net forcing) this isn't going anywhere and you are destined to wonder why the average global temperature isn't increasing.
[PS] And your analysis is published where? Time to show us some data I think. It is pretty hard to accept the word someone who cannot calculate the radiative effect from an increase in CO2 without some pretty convincing mathematical analysis including all definitions used.
Dan @1113... It's not a matter of "belief." You have to understand the physics involved. For one, atmospheric concentrations of CO2 don't affect incoming radiation that warms the ocean.
Dan Pangburn - Reality doesn't care about beliefs.
With respect to the significance of CO2 concentration changes, I suggest reading the CO2 is just a trace gas thread. Your statement sounds like an argument from incredulity.
Atmospheric GHGs (active in the IR) have very little effect on how the oceans absorb sunlight. But by warming the surface atmosphere, they have a significant effect on how fast the the oceans lose energy to the atmosphere, and hence create a forcing imbalance on the oceans themselves. See the discussion here.
"...you are destined to wonder why the average global temperature isn't increasing."
What? How can you possibly claim this? There are short term variations in atmospheric temperatures, but if you look at the global temperatures including the oceans, or even just examine a sufficiently long period for statistical significance in atmospheric temperatures, they are indeed increasing. That statement of yours is nonsense.
Dan Pangburn - "...my analysis has found that CO2 has no significant effect on climate..."
Then, with all due respect, your analysis is simply wrong.
Rob - I agree and restate: Atmospheric CO2 increasing from 3 parts in 10,000 to 4 parts in 10,000 can not significantly change the rate that the oceans absorb sunlight.
KR - The effect of CO2 is not the point of discussion here.
Temperature change, in degrees K, multiplied by the effect thermal capacitance (thermal inertia?), in Joule sec/m/m/K results in units Joule sec/m/m.
Forcing is in Joule/m/m.
My only point here is that it is misleading to compare these on the same graph. The correct comparison is between the temperature change and the time-integral of the net (you can call it total) forcing.
Dan Pangburn - If CO2 isn't the point of discussion (or rather, the relative influences of anthropogenic GHGs and the myth that 'it's the sun' responsible for all recent climate changes), then why did you bring it up? Particularly when your claim is so unsupported?
In the meantime, since we are concerned with changes in temperature, graphing those against changes in TSI is entirely appropriate to investigate correlations.
Regarding the oceans, both Rob and I have agreed that GHGs have little effect on how the oceans absorb SW radiation - but you seem to be missing the physics where GHG changes greatly affect how the oceans lose that energy, causing a forcing imbalance and therefore warming the oceans.
Climate temperatures are a balance between incoming energy gain and outgoing loss scaled by the Stephan-Boltzmann relationship, and changes in a balance can come from a finger on either side of the scales.
KR - To see the effect that TSI has on temperature requires the time-integral of TSI. Without even that trivial science skill, further discussion is useless.
[PS] By all means feel free to link to or post what you mean by a "time integral of TSI". Be sure to do the same for the CO2 forcing.
Dan Pangburn - "...further discussion is useless." I'm afraid I would have to agree.
As Dan Pangburn does not appear interested in following reason, I thought I would short cut the argument. His claim is that the integral of TSI explains the temperature history since 1880. Therefore, I took the record of TSI forcing used in Kevin C's simple response funtion climate model (default setting). I tested the regression of offsets of that forcing to 1960 to determine which best correlated with the GISS LOTI. As it happened, 0 offset was best. I then regressed the resulting integral of TSI against the GISS LOTI up to 1960, and projected the regression on to 2010:
For the record, the correlation over the full interval is 0.917 and the r squared is 0.841. I did not calculate the Root Mean Squared Error, but as you can see it is lousy. Sufficiently so as to falsify the model.
For comparison, here are the full forcings with a simple, two box response function as shown with default settings minus ENSO from Kevin's model:
R squared is given as 0.877. Better than the integral of TSI, but not stunningly so. The overall fit, however, smashes the Pangburn model. If you hold to the quaint notion that scientific results should be determined by empirical evidence, then there is no question as to which model is superior.
Dan Pangburn may not be happy with my regression. If not, however, it is incumbent on him to do better - and to tell us how he did it. Absent such an attempt, his counter theory is not science. It is merely a thought bubble. And until he does better, showing us the graph of the regression and explaining his methods, we are quite right to ignore that thought bubble.
[PS] As you pointed out earlier, there is rather large gap in Dan's physical understanding. Are you going to put up the CO2 time integral as well?
PS inline @1121, no, there is no point in putting up the time integral of CO2 forcing. The correct relationship is Heat Content (not temperature) to the time integral of (Incoming energy - outgoing energy). CO2 changes the time integral of outgoing energy by reducing OLR. Increasing temperature changes the time integral of outgoing energy by increasing OLR. Because Pangburn persistently ignores OLR, his formulation is nonsense. However, it is his formulation I wanted to test, hence the first graph.
[PS] frankly not much point to time integral of TSI either but I thought that might help see the issue.
Dan Pangburn's argument appears to be one I've seen before - where a 'break-even' point is defined in some fashion (TSI, or a particular sunspot number as in an earlier Pangburn post here, etc.) - it's assumed that any energy above that breakpoint will integrate and accumulate positively, and any below that breakpoint will integrate negatively.
Utterly neglecting the other side of the equation, the outgoing LWR which scales with temperature and effective Earth emissivity, and that climate energy is driven by the difference between incoming and outgoing energies. There is no fixed break-even since temperatures change in response to forcing, the difference is between two moving values, and hence no fixed threshold.
In fact, since the sign of the speculative integration against a particular 'break-even' is solely and rather arbitrarily set by where that breakpoint is defined, different breakpoints can suggest either ridiculously large warming or cooling depending on how they relate to the time series as a whole. It's a hypothesis focused entirely on the climate energy input, wholly ignoring energy output - and therefore it's meaningless.
Pangburn has been pushing this hypothesis for several years, in the face of multiple replies pointing out these issues - it's unlikely he's going to change his mind now. But readers should be aware of the difference between a fixed integrative threshold, and an imbalance (the case in reality) between two moving values. And judge such simplistic hypotheses accordingly.
[PS] Thank you for bringing up Dan's previous posting history. This shows excessive repetition and amount now to just sloganeering without supporting evidence.
PS - In all fairness, Pangburn hasn't been arguing on SkS for very long, and has yet to make a clear causal claim (something I've been trying to extract). But given his history on other sites and his own blog posts, I'm not sanguine about better results here.
I find it ironic how this group is only skeptical towards proof that violates in what they believe. Climate Change/Global Warming believers are eager to believe others are cherry picking data because their follow acolytes have been proven to cherry pick data and promote biased readings since the beginning.
http://wattsupwiththat.com/2015/03/10/study-climate-change-is-nothing-new-in-fact-it-was-happening-the-same-way-1-4-billion-years-ago/
http://www.livetradingnews.com/orbital-variations-key-cause-earths-climate-change-98741.htm
http://www.aip.org/history/climate/solar.htm
http://science.nasa.gov/science-news/science-at-nasa/2003/17jan_solcon/
http://www.newsmax.com/Newsfront/scientists-Milankovitch-cycles-orbit-variations/2015/03/11/id/629605/
https://www.heartland.org/sites/all/modules/custom/heartland_migration/files/pdfs/24807.pdf
All the Climate Change/Global Warming acolytes have to answer to this is to cherry pick one major study and then imploy impropriety based on who funded the research. They use degrading, false, slanderous insults instead of actual proof that any impropriety actually occured.
As I said, the acolytes are merely reflecting their own lack of morals or ethics on everyone else. Apparently it is inconcievable to them that someone may actually have a backbone and tell a sponsor to go pound sand.
However, please continue with this elementary sandbox mentality. Those who are without the mental illness of statism are the opposite of impressed.
[PS]
Please note that posting comments here at SkS is a privilege, not a right. This privilege can be rescinded if the posting individual treats adherence to the Comments Policy as optional, rather than the mandatory condition of participating in this online forum.
Please take the time to review the policy and ensure future comments are in full compliance with it. Thanks for your understanding and compliance in this matter.
Pick one topic where you think science has wrong and your fellows believe they have truth. Comment on that topic and that topic only, support your statements with references rather than repeating grossly misinformed slogans for misinformation sites and then be prepared to discuss the topic in keeping with the comments policy. Take note in particular of inflammatory tone, sloganeering, and staying on topic. This is a site to discuss the science. If you find the requirements of the comments policy too burdensome, then there are plenty of other sites which would welcome your kind of contribution.