


 Arguments


Global warming and the El Niño Southern Oscillation
What the science says...
| Select a level... |
 Basic
Basic
|
 Intermediate
| |||
|
El Nino has no trend and so is not responsible for the trend of global warming. |
|||||
Climate Myth...
It's El Niño
"Three Australasian researchers have shown that natural forces are the dominant influence on climate, in a study just published in the highly-regarded Journal of Geophysical Research. According to this study little or none of the late 20th century global warming and cooling can be attributed to human activity. The close relationship between ENSO and global temperature, as described in the paper, leaves little room for any warming driven by human carbon dioxide emissions. The available data indicate that future global temperatures will continue to change primarily in response to ENSO cycling, volcanic activity and solar changes." (Climate Depot)
At a glance
This particular myth is distinguished by the online storm that it stirred up back in 2009. So what happened?
Three people got a paper published in the Journal of Geophysical Research. It was all about ENSO - the El Nino Southern Oscillation in the Pacific Ocean. ENSO has three modes, El Nino, neutral and La Nina. In El Nino, heat is transferred from the ocean to the atmosphere. In La Nina, the opposite happens. So within ENSO's different modes, energy is variously moved around through the planet's climate system, but heat is neither added nor subtracted from the whole. As such, in the long term, ENSO is climate-neutral but in the short term it makes a lot of noise.
The paper (link in further details) looked at aspects of ENSO and concluded that the oscillation is a "major contributor to variability and perhaps recent trends in global temperature". First point, sure. Second point, nope, if you accept climate trends are multidecadal things, which they are.
That might have been the end of it had the authors not gone full-megaphone on the media circuit, promoting the paper widely in a certain way. "No scientific justification exists for emissions regulation", they loudly crowed. "No global warming", the denizens of the echo-chamber automatically responded, all around the internet. This is how climate science denial works.
Conversely, the way that science itself works is that studies are submitted to journals, peer-reviewed, then some of them get published. Peer review is not infallible - some poor material can get through on occasion - but science is self-correcting. So other scientists active in that field will read the paper. They may either agree with its methods, data presentation and conclusions or they may disagree. If they disagree enough - such as finding a major error, they respond. That response goes to peer-review too and in this case that's exactly what happened. An error so fundamental was found that the response was published by the same journal. The error concerned one of the statistical methods that had been used, called linear detrending. If you apply this method to temperature data for six months of the Austral year from winter to summer (July-December), it cannot tell you that during that period there has been a seasonal warming trend. So what happens if you apply it to any other dataset? No warming! Bingo!
A response to the response, from the original authors, followed but was not accepted for publication, having failed peer-review. At this point, the authors of the rejected response-to-the-response started to screech, "CENSORSHIP" - and the usual blogosphere battles duly erupted.
It was not censorship. Dodgy statistical techniques were picked up by the paper's highly knowledgeable readership, some of whom joined forces to prepare a rebuttal that corrected the errors. The response of the original paper's authors to having their errors pointed out was so badly written that it was rejected. That's not censorship. It's about keeping garbage out of the scientific literature.
Quality control is what it's all about.
Please use this form to provide feedback about this new "At a glance" section. Read a more technical version below or dig deeper via the tabs above!
Further details
ENSO, the El Nino Southern Oscillation, is an irregular but well-understood phenomenon that affects the Eastern and Central Pacific Oceans. It is important both on a local and global basis, since it not only causes changes in sea-surface temperatures. It also affects the thermal profile of the ocean and both coastal and upwelling ocean currents.
Such changes can and do affect the diversity and abundance of important edible seafood species. Cold and warm-water forms are forced to migrate to where they find the conditions more to their liking. El Nino events in particular, where warm waters prevail close to the sea surface, can inflict a temporary loss of commercially important species of fish and squid from where they are traditionally fished. Some coastal communities along the Pacific seaboard of South America have a strong dependency on such fisheries. As such, prolonged El Nino conditions can be seriously problematic.
The warm El Nino mode of ENSO also affects global temperatures, as heat energy is transferred from ocean surface to the atmosphere. A strong El Nino is easily capable of raising temperatures above the upward slope that represents the change in radiative forcing caused by our increasingly vast greenhouse gas emissions - global warming, in other words. Conversely, the opposite to El Nino, La Nina, suppresses global temperatures. When several La Nina years occur in a row, climate science deniers are given the opportunity to insist that the world is cooling. This has happened before, most notably in the post-1998 period.
However, as fig. 1 shows, global temperature is rising independently of the short-term ENSO noise. Fig. 1 also shows that 2022 was the warmest La Nina year in the observational record. In fact, El Nino, La Nina and neutral years are all getting warmer.
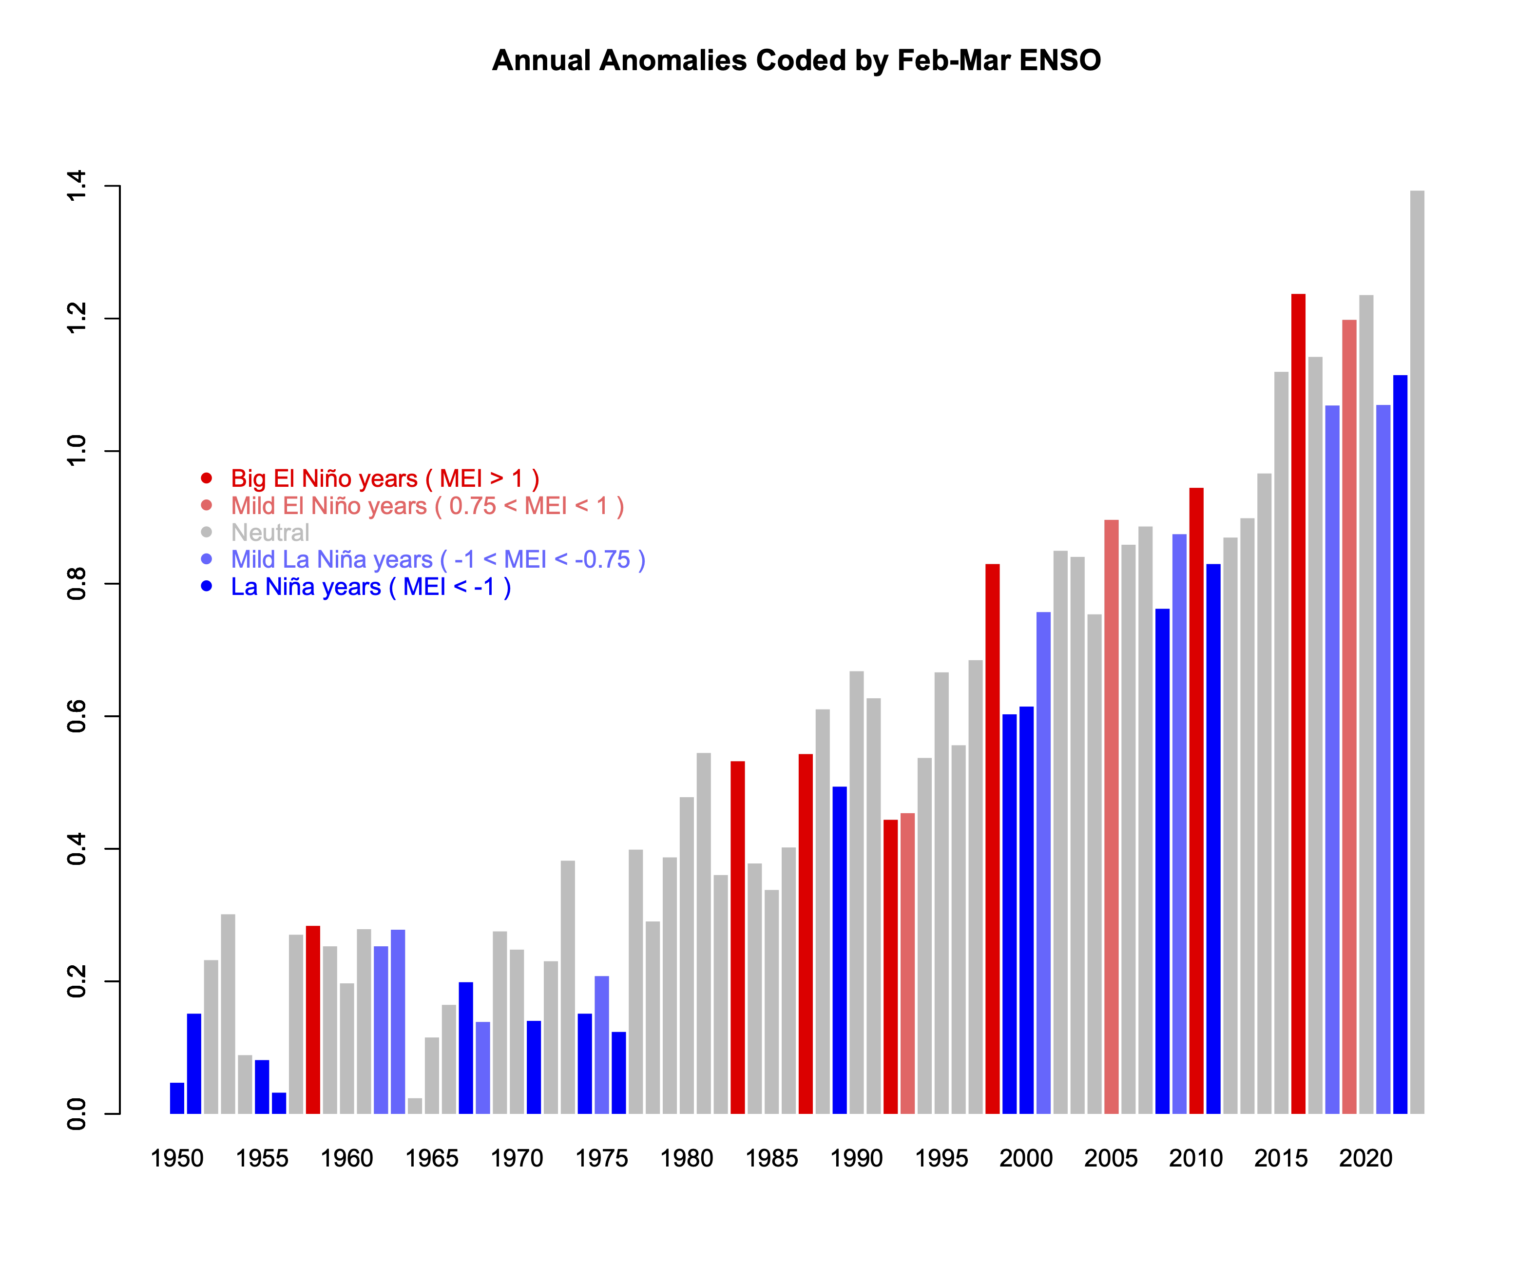
Fig. 1: variations in ENSO in a warming world. This plot therefore shows two independent phenomena that affect climate: the noisy ENSO and the underlying relentless upward climb in temperatures caused by our rapidly-increasing emissions of CO2 and other greenhouse gases. Temperature records typically get broken in El Nino years because the temperature is given an extra boost. 2016, a major El Nino year, held the global temperature record for a few years, but 2023 saw that record fall again. 2023 is in grey because that El Nino did not develop until later in the year. Graphic: Reaclimate.
The reader should by now be in no doubt about the difference between the long term global temperature trend caused by increased greenhouse gas forcing and the noise that shorter-term wobbles like ENSO provide. You would have seen something similar during the descents into and climbs out of ice-ages too. That's because ENSO has likely been with us for a very long time indeed. Ever since the Pacific Ocean came close to its present day geography, millions of years ago, it has likely been there.
The reader should by now be in no doubt about the difference between the long term global temperature trend caused by increased greenhouse gas forcing and the noise that shorter-term wobbles like ENSO provide. You would have seen something similar during the descents into and climbs out of ice-ages too. That's because ENSO has likely been with us for a very long time indeed. Ever since the Pacific Ocean came close to its present day geography, millions of years ago, it has likely been there.
Nevertheless, here we have something that warms the planet, even if that's on a temporary basis. As a consequence, some people with ulterior motives might just become interested. Over a decade ago now, that's what happened. A paper, 'Influence of the Southern Oscillation on tropospheric temperature' (Mclean et al. 2009) was published in the Journal of Geophysical Research. One of its co-authors, a well-known climate contrarian, commented:
"The close relationship between ENSO and global temperature, as described in the paper, leaves little room for any warming driven by human carbon dioxide emissions."
If you enter the above quote, complete with its quotation marks, into a search engine, you will get lots of exact matches. Strange? Not really, if you have studied the techniques of climate science denial.
- a paper is published that barely mentions global warming.
- its authors go on to distribute slogans implying that they have put yet another Final Nail in the global warming coffin.
- right-wing media of all sorts from newspapers to blogs ensure wide distribution of the talking-points.
- individuals serve to fill in the circulation-gaps.
This is how it works, time and again. However, glaring errors were soon noticed in the paper, leading a group of specialists to offer a rebuttal, published in the same journal a year later (Foster et al. 2010).
Statistics is not everyone's cup of tea, but a very straightforward explanation of the key error was provided by Stephen Lewandowsky, writing at ABC (archived):
"This is best explained by an analogy involving daily temperature readings between, say, July and December anywhere in Australia. Suppose temperature is recorded twice daily, at midday and at midnight, for those 6 months. It is obvious what we would find: Most days would be hotter than nights and temperature would rise from winter to summer. Now suppose we change all monthly readings by subtracting them from those of the following month—we subtract July from August, August from September, and so on. This process is called "linear detrending" and it eliminates all equal increments. Days will still be hotter than nights, but the effects of season have been removed. No matter how hot it gets in summer, this detrended analysis would not and could not detect any linear change in monthly temperature."
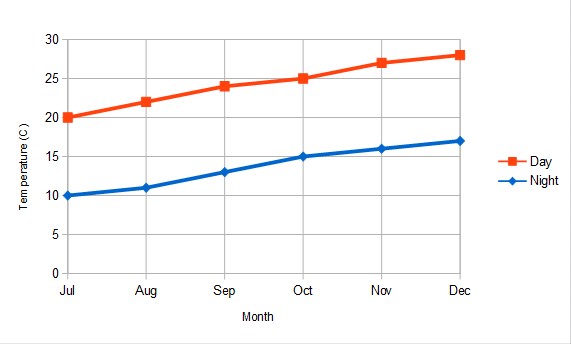
Anyone can do this in Excel. First input a series of representative temperatures for the transition from Austral winter into summer:
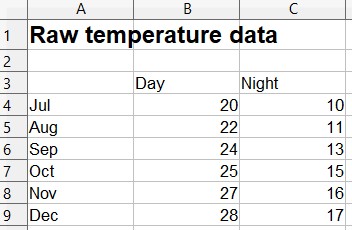
Reasonable? OK, then let's plot them. Still looks like what we'd expect. It gets warmer in Australia from July to December and nights are usually colder than days, right?
Now, let's do that detrending. This is what you get:
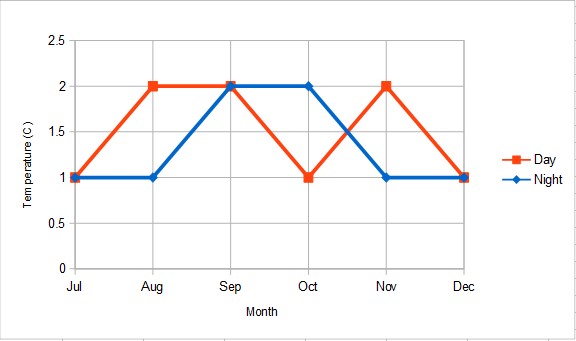
As Lewandowsky pointed out in his ABC article:
"Astonishingly, McLean and colleagues applied precisely this detrending to their temperature data. Their public statements are thus equivalent to denying the existence of summer and winter because days are hotter than nights."
In other words: Fail.
Last updated on 24 March 2024 by John Mason. View Archives


Li et al. 2013 might be a good basis for an intermediate article here:
"Predicting how the El Niño/Southern Oscillation (ENSO) will change with global warming is of enormous importance to society. ENSO exhibits considerable natural variability at interdecadal–centennial timescales5. Instrumental records are too short to determine whether ENSO has changed6 and existing reconstructions are often developed without adequate tropical records. Here we present a seven-century-long ENSO reconstruction based on 2,222 tree-ring chronologies from both the tropics and mid-latitudes in both hemispheres. The inclusion of tropical records enables us to achieve unprecedented accuracy, as attested by high correlations with equatorial Pacific coral and coherent modulation of global teleconnections that are consistent with an independent Northern Hemisphere temperature reconstruction. Our data indicate that ENSO activity in the late twentieth century was anomalously high over the past seven centuries, suggestive of a response to continuing global warming. Climate models disagree on the ENSO response to global warming, suggesting that many models underestimate the sensitivity to radiative perturbations. Illustrating the radiative effect, our reconstruction reveals a robust ENSO response to large tropical eruptions, with anomalous cooling in the east-central tropical Pacific in the year of eruption, followed by anomalous warming one year after. Our observations provide crucial constraints for improving climate models and their future projections."
Hey guys: Bob Tisdale’s crowing about the recent studies attributing slowed surface warming to La Nina:
“Anyone with a little common sense who’s reading the abstract and the hype around the blogosphere and the Meehl et al papers will logically now be asking: if La Niña events can stop global warming, then how much do El Niño events contribute? 50%? The climate science community is actually hurting itself when they fail to answer the obvious questions.
And what about the Atlantic Multidecadal Oscillation (AMO)? What happens to global surface temperatures when the AMO also peaks and no longer contributes to the warming?
The climate science community skirts the common-sense questions, so no one takes them seriously."
http://wattsupwiththat.com/2013/08/28/another-paper-blames-enso-for-the-warming-hiatus/#more-92630
How’s this for a summary argument against the Tisdalian hypothesis (if it constitutes one):
Tisdale and his crowd at WUWT seem to think temperature is just a number that just moves up and down somewhat arbitrarily, like a stock price. They don't conceptualize things properly in terms of heat energy, which can't be created or destroyed.
ENSO doesn’t generate, absorb or destroy heat. So when Tisdale says La Nina “stops” global warming and El Nino “contributes”, he’s got it totally wrong. Nothing is being stopped – the heat energy is simply being moved around. That's why we use the term "oscillation".
And the proper question to ask Tisdale is simply, Where is the heat coming from?
I'm probably getting it all mucked up, as I have little science background, but I'm trying to put it in easy terms for non-sciencish people like myself.
Also, what do you think of this graphic from Hotwhopper:
ENSO without AGW:

ENSO without AGW:

Actually SkS has been writing about this oscillation for years, a.k.a the Interdecadal Pacific Oscillation (IPO). For the latest discussion see this recent(ish) SkS post: A Looming Climate Shift: Will Ocean Heat Come Back to Haunt us?.
The oceans are warming due to the increased (enhanced) Greenhouse Effect (this is the upward slope in the 2nd graphic below), but the wind-driven ocean circulation moves back-and-forth between intense and sluggish phases, which results in the 'hiatus' and 'accelerated warming' decades. The net effect is illustrated in the graphics below:
SkS will have upcoming posts/rebuttals explaining this in some more detail. You'll see how the observations by Kosaka & Xie (2013) tie in nicely with the wind-driven ocean circulation.
Good to see Bob is slowly coming around to our way of thinking though. He still has a looooong way to go.
Thanks for the info, Rob, but what do you think of my characterization of the problem with his hypothesis? I'm trying to sum it up in a way that is hospitable to people like myself without a solid science background.
dvaytw - it's not strictly true that El Nino and La Nina simply move heat around. But over time, in a stable climate, they would balance out to zero. The only reason the climate system is gaining energy in the long-term is because the increased Greenhouse Effect is trapping more heat in the surface ocean.
That's why global temperature, and therefore subsurface ocean temperature, tracks atmospheric CO2 so well in the ice core records over the last 800,000 years.
I don't consider it a worthwhile exercise spending time on crank ideas from Bob Tisdale.
Rob thanks.
I understand why as a serious scientist you don't want to spend time on crank ideas. That said, I'm debating people in online forums where there are a lot of non-science people, and pseudo-scientists often know their pseudo-science better than do those defending the real science, which means they can actually appear to be winning debates even when wrong - and this can influence people's opinions.
This is why I make the effort to actually find out what's wrong with Tisdale's "hypothesis" - because a fellow in a debate is using Tisdale's video about ENSO (which specifically targets SkS, incidentally!), and for the scientifically challenged, it can seem convincing.
So based on your response, my next question is this: how do we know that "over time, in a stable climate, they would balance out to zero?" I seems in the information provided above, our measurements only go back to 1980.
PS - is there a way to set the thread so I get an email notification when there's a response?
This is perhaps a simple question but I see the Oceanic Niño Index (ONI) defined as "3-month running mean of SST anomalies (ERSST.v3, 1971-2000 base period) in the Niño 3.4 region"
The NDJ nunber is shown as -0.4°C, which doesn't seem to be the mean of November 2013 (0.01°C) December 2013 (-0.04°C) and January 2014 (-0.51°C).
Am I missing something terribly obvious?
[JH] Link fixed.
Maybe someone could explain a problem, I have with this topic. If we conclude that the increase in global temperatures is not due to natural causes, can anyone explain the data contained on the NASA-GISS GLOBAL LAND-OCEAN TEMPERATURE INDEX graph located at the following web address: http://data.giss.nasa.gov/gistemp/graphs_v3/Fig.A2.gif .
This graph shows temperatures for the last 135 years. If you will observe there is an almost "identical" increase in temperature shown for the periods of ~1910 to ~1942 and from ~1972 to ~2002. The problem is that the level of CO2 was supposed to be fairly constant at 280ppm, until maybe the mid 1950's, and from the mid 1950's it was supposed to be increasing from 280ppm to its current value of 400ppm due to anthropogenic causes. If you accept that the two periods of warming depicted on the graph are almost identical in duration and even slope/rate, what caused the first increase before AGW became a factor??? If it was natural causes like the PDO, AMO, NMO, AO, and maybe even changes in the Sun's radiation/magnetic field flux, why couldn't the same thing be responsible for the the period from 1972-2002???
Additionally, If you will notice there is also a period between ~1942 and ~1972, which looks strangely like the current pause we have started to experience. Maybe if you google:
MULTIDECADAL TENDENCIES IN ENSO AND GLOBAL TEMPERATURES RELATED TO MULTIDECADAL OSCILLATIONS
Energy & Environment, Volume 21, Number 5, pp. 437-460, September 2010
by Joseph D’Aleo and Dr. Don Easterbrook
it might shed some enlightenment on this topic and the topic of "CAGW", especially when trying to explain the temperature graph mentioned above from the NASA-GISS website. I presume this is acceptable data to the CAGW crowd. Thank you for your time.
[JH] The use of "all caps" constitutes shouting and is prohibited by the SKS Comments Policy. In addition, making snarky statements on our comment threads is not acceptable.
Please note that posting comments here at SkS is a privilege, not a right. This privilege can be rescinded if the posting individual treats adherence to the Comments Policy as optional, rather than the mandatory condition of participating in this online forum.
Please take the time to review the policy and ensure future comments are in full compliance with it. Thanks for your understanding and compliance in this matter.
Dan Sage, you should rely on real data instead of "supposedlys." CO2 levels have not been fairly constant until the mid 1950s; the rise got drastically steeper around 1950.
Nobody claims that CO2 is the only driver of climate. (After you read the Basic tabbed pane, read the Intermediate one.)
Attribution of global warming across natural and anthropogenic causes has been studied exhaustively. Relative contributions have varied, with correspondingly varying attributions of human versus natural over different periods.
Dan Sage, for attribution of the causes of warming between about 1942 and 1972, see "Why did climate cool in the mid-20th Century?"
Dan Sage, Don Easterbrook's claims are wildly wrong.
Don Sage, for more insight to the errors (and "errors"--ahem) in Don Easterbrook's claims, see Dana's other Easterbrook post, "It's PDO," "It's the Sun," and "Climate's Changed Before." Many Skeptical Science posts have Basic, Intermediate, and Advanced tabbed panes; read them all. Also, be sure to post comments only on the relevant threads. You can monitor all comments on all threads by clicking the "Comments" link in the horizontal blue bar at the top of every page.
. . . and then there is Hot Topic's disassembly of Don Easterbrook's abuse of Central Greenland temperatures.
Hi
Climate models predicts higher air than sea temperature; is it el-niño effect no ?
The last two big el niño were in phase with the 18.6 lunar tidal effect, it' s seems to have construct an hiher amplitude...it's seems to impeach la niña in the las two before that.
The next is in 2034; sea surface temperature is actually far below the air temperature. Could we experience an almost flat line in the air temperature to 2034 while the sea surface will continue to rise gently ?
Max or not @@197,
It is difficult to understand much of what you actually ask.
But regarding the 18;6 year cycle of the lunar orbital plane and ENSO. The 2015/16 El Niño did coincide with the 'minor lunar standstill' which occurs every 18.6 years. And the 2015/16 El Niño was 18 years behind the 1997/98 El Niño. If the 18.6 year lunar cycle were triggering major El Niños perhaps there should have been a major El Niño in 1978/79 (2 x 18.6 yrs before 2015) and perhaps another in 1960/61 (3 x 18.6 yrs before 2015). Yet there wasn't. (See ONI data here.) That there were no such El Niños in those years surely suggests your proposed linkage between ENSO and the lunar orbit is solely based on a single conicidence that has not been repeated in the past, and so probably will not repeat in the future.
I don't think it is the cause of el niño but that it is pushing ONI value higher whatever the value are negative, neutral or positive.
Max or not @199,
And what basis do you see for such "pushing"? The ENSO activity that we have record-of during previous 'minor lunar standstill' appear to be stiffled rather than pushed anywhere.