


 Arguments


Is the CO2 effect saturated?
What the science says...
| Select a level... |
 Basic
Basic
|
 Intermediate
|
 Advanced
| ||||
|
The notion that the CO2 effect is 'saturated' is based on a misunderstanding of how the greenhouse effect works. |
|||||||
Climate Myth...
CO2 effect is saturated
"Each unit of CO2 you put into the atmosphere has less and less of a warming impact. Once the atmosphere reaches a saturation point, additional input of CO2 will not really have any major impact. It's like putting insulation in your attic. They give a recommended amount and after that you can stack the insulation up to the roof and it's going to have no impact." (Marc Morano, as quoted by Steve Eliot)
At-a-Glance
This myth relies on the use (or in fact misuse) of a particular word – 'saturated'. When someone comes in from a prolonged downpour, they may well exclaim that they are saturated. They cannot imagine being any wetter. That's casual usage, though.
In science, 'saturated' is a strictly-defined term. For example, in a saturated salt solution, no more salt will dissolve, period. But what's that got to do with heat transfer in Earth's atmosphere? Let's take a look.
Heat-trapping by CO2 in the atmosphere happens because it has the ability to absorb and pass on infra-red radiation – it is a 'greenhouse gas'. Infra-red is just one part of the electromagnetic spectrum, divided by physicists into a series of bands. From the low-frequency end of the spectrum upwards, the bands are as follows: radio waves, microwaves, infrared, visible light, ultraviolet, X-rays, and gamma rays. Gamma rays thus have a very high-frequency. They are the highest-energy form of radiation.
As our understanding of the electromagnetic spectrum developed, it was realised that the radiation consists of particles called 'photons', travelling in waves. The term was coined in 1926 by the celebrated physicist Gilbert Lewis (1875-1946). A photon's energy is related to its wavelength. The shorter the wavelength, the higher the energy, so that the very high-energy gamma-rays have the shortest wavelength of the lot.
Sunshine consists mostly of ultraviolet, visible light and infra-red photons. Objects warmed by the sun then re-emit energy photons at infra-red wavelengths. Like other greenhouse gases, CO2 has the ability to absorb infra-red photons. But CO2 is unlike a mop, which has to be wrung out regularly in order for it to continue working. CO2 molecules do not get filled up with infra-red photons. Not only do they emit their own infra-red photons, but also they are constantly colliding with neighbouring molecules in the air. The constant collisions are important. Every time they happen, energy is shared out between the colliding molecules.
Through those emissions and collisions, CO2 molecules constantly warm their surroundings. This goes on all the time and at all levels in the atmosphere. You cannot say, “CO2 is saturated because the surface-emitted IR is rapidly absorbed”, because you need to take into account the whole atmosphere and its constant, ongoing energy-exchange processes. That means taking into account all absorption, all re-emission, all collisions, all heating and cooling and all eventual loss to space, at all levels.
If the amount of radiation lost to space is equal to the amount coming in from the Sun, Earth is said to be in energy balance. But if the strength of the greenhouse effect is increased, the amount of energy escaping falls behind the amount that is incoming. Earth is then said to be in an energy imbalance and the climate heats up. Double the CO2 concentration and you get a few degrees of warming: double it again and you get a few more and on and on it goes. There is no room for complacency here. By the time just one doubling has occurred, the planet would already be unrecognisable. The insulation analogy in the myth is misleading because it over-simplifies what happens in the atmosphere.
Please use this form to provide feedback about this new "At a glance" section. Read a more technical version below or dig deeper via the tabs above!
Further details
This myth relies on the use of a word – saturated. When we think of saturated in everyday use, the term 'soggy' comes to mind. This is a good example of a word that has one meaning in common parlance but another very specific one when thinking about atmospheric physics. Other such words come to mind too. Absorb and emit are two good examples relevant to this topic and we’ll discuss how they relate to atmospheric processes below.
First things first. The effect of CO2 in the atmosphere is due to its influence on the transport of 'electromagnetic radiation' (EMR). EMR is energy that is moving as x-rays, ultraviolet (UV) light, visible light, infrared (IR) radiation and so on (fig. 1). Radiation is unusual in the sense that it contains energy but it is also always moving, at the speed of light, so it is also a form of transport. Radiation is also unusual in that it has properties of particles but also travels with the properties of waves, so we talk about its wavelength.
The particles making up radiation are known as photons. Each photon contains a specific amount of energy, and that is related to its wavelength. High energy photons have short wavelengths, and low energy photons have longer wavelengths. In climate, we are interested in two main radiation categories - firstly the visible light plus UV and minor IR that together make up sunshine, and secondly the IR from the earth-atmosphere system.
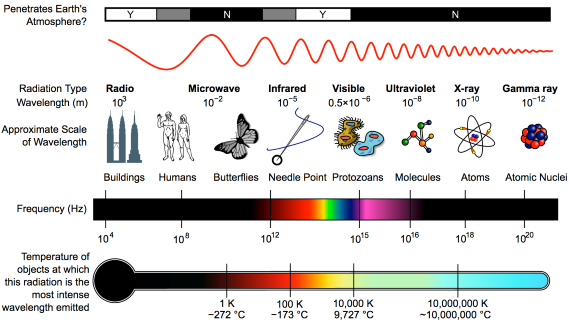
Fig. 1: diagram showing the full electromagnetic spectrum and its properties of the different bands. Image: CC BY-SA 3.0 from Wikimedia.
CO2 has the ability to absorb IR photons – it is a 'greenhouse gas'.So what does “absorb” mean, when talking about radiation? We are all familiar with using a sponge to mop up a water spill. The sponge will only absorb so much and will not absorb any more unless it's wrung out. In everyday language it may be described, without measurements, as 'saturated'. In this household example, 'absorb' basically means 'soak up' and 'saturated' simply means 'full to capacity'. Scientific terms are, in contrast, strictly defined.
Now let's look at the atmosphere. The greenhouse effect works like this: energy arrives from the sun in the form of visible light and ultraviolet radiation. A proportion reaches and warms Earth's surface. Earth then emits the energy in the form of photons of IR radiation.
Greenhouse gases in the atmosphere, such as CO2 molecules, absorb some of this IR radiation, then re-emit it in all directions - including back to Earth's surface. The CO2 molecule does not fill up with IR photons, running out of space for any more. Instead, the CO2 molecule absorbs the energy from the IR photon and the photon ceases to be. The CO2 molecule now contains more energy, but that is transient since the molecule emits its own IR photons. Not only that: it's constantly colliding with other molecules such as N2 and O2 in the surrounding air. In those collisions, that excess energy is shared with them. This energy-sharing causes the nearby air to heat up (fig. 2).
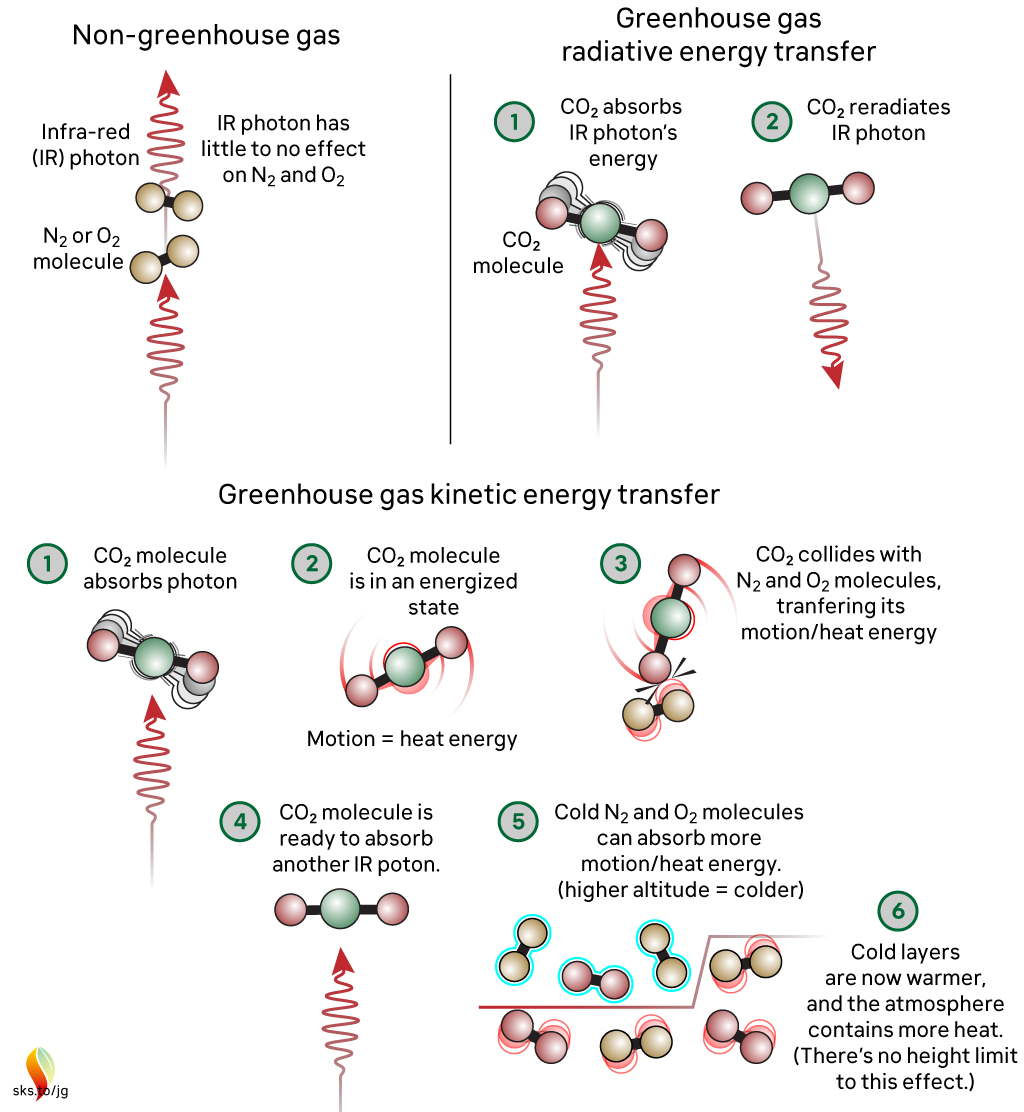
Fig. 2: The greenhouse effect in action, showing the interactions between molecules. The interactions happen at all levels of the atmosphere and are constantly ongoing. Graphic: jg.
The capacity for CO2 to absorb photons is almost limitless. The CO2 molecule can also receive energy from collisions with other molecules, and it can lose energy by emitting IR radiation. When a photon is emitted, we’re not bringing a photon out of storage - we are bringing energy out of storage and turning it into a photon, travelling away at the speed of light. So CO2 is constantly absorbing IR radiation, constantly emitting IR radiation and constantly sharing energy with the surrounding air molecules. To understand the role of CO2, we need to consider all these forms of energy storage and transport.
So, where does 'saturation' get used in climate change contrarianism? The most common way they try to frame things is to claim that IR emitted from the surface, in the wavelengths where CO2 absorbs, is all absorbed fairly close to the surface. Therefore, the story continues, adding more CO2 can’t make any more difference. This is inaccurate through omission, because either innocently or deliberately, it ignores the rest of the picture, where energy is constantly being exchanged with other molecules by collisions and CO2 is constantly emitting IR radiation. This means that there is always IR radiation being emitted upwards by CO2 at all levels in the atmosphere. It might not have originated from the surface, but IR radiation is still present in the wavelengths that CO2 absorbs and emits. When emitted in the upper atmosphere, it can and will be lost to space.
When you include all the energy transfers related to the CO2 absorption of IR radiation – the transfer to other molecules, the emission, and both the upward and downward energy fluxes at all altitudes - then we find that adding CO2 to our current atmosphere acts to inhibit the transfer of radiative energy throughout that atmosphere and, ultimately, into space. This will lead to additional warming until the amount of energy being lost to space matches what is being received. This is precisely what is happening.
The myth reproduced at the top – incorrectly stating an analogy with roof insulation in that each unit has less of an effect - is misleading. Doubling CO2 from 280 ppm to 560 ppm will cause a few degrees of warming. Doubling again (560 to 1130 ppm) will cause a similar amount of additional warming, and so on. Many doublings later there may be a point where adding more CO2 has little effect, but recent work has cast serious doubt on that (He et al. 2023). But we are a long, long way from reaching that point and in any case we do not want to go anywhere near it! One doubling will be serious enough.
Finally, directly observing the specific, global radiative forcing caused by well-mixed greenhouse gases has - to date - proven elusive. This is because of irregular, uncalibrated or limited areal measurements. But very recently, results have been published regarding the deep reinterrogation of years of data (2003-2021) from the Atmospheric Infrared Sounder (AIRS) instrument on NASA's Aqua Satellite (Raghuraman et al. 2023). The work may well have finally cracked the long-standing issue of how to make finely detailed, consistent wavelength-specific measurements of outgoing long-wave radiation from Earth into space. As such, it has opened the way to direct monitoring of the radiative impact (i.e. forcing + feedback) of greenhouse gas concentration changes, thereby complimenting the Keeling Curve - the longstanding dataset of measured CO2 concentrations, down at the planet's surface.
Note: Several people in addition to John Mason were involved with updating this basic level rebuttal, namely Bob Loblaw, Ken Rice and John Garrett (jg).
Last updated on 31 December 2023 by John Mason. View Archives


Elsewhere, SASM asked some questions that were snipped for being off topic. They are on topic here, so I will address them. He says:
Turning to the WUWT post, it is complete nonsense. It does not indicate how the values of any of its tables were determined, and makes absurd false statements such at that at least 200 ppmv is required in the atmosphere for plant life to grow (CO2 concentrations dropped to 182.2 ppmv at the Last Glacial Maximum, giving the lie to that common claim).
More importantly, the claim that the "...proportional values shown above present are universally accepted by skeptics and Global Warming alarmists alike..." (PDF) is complete bunk. They are not accepted universally by AGW "skeptics" and are accepted by no defenders of climate science. Specifically, the "universally accepted" formula for radiative forcing is RFt = 5.35* ln(ct/c0). That is, the radiative forcing due to CO2 at time, t, relative to time, 0, equals 5.35 times the natural log of the CO2 concentration at time t divided by the CO2 concentration at time 0. The equilibrium temperatue response to that radiative forcing is a linear function of the radiative forcing, so that it follows the same logarithmic relationship.
An immediate consequence of that logarithmic relationship is that the temperature response for a doubling of CO2 concentration is the same for any doubling of CO2 concentration across the range over which that formula is valid (it clearly does not apply for very low values of CO2). That is, if the temperature response for increasing CO2 from 100 to 200 ppmv is X, then the temperature response for increasing it from 200 to 400, or 300 to 600, or 400 to 800, or 500 to 1000 ppmv will also be x.
Contrary to that relationship, however, Hoskins shows the increase from 100 to 200 as being 10.1% of some unknown value; that from 200 to 400 as being 7.3% of the same value; that from 300 to 600 as being 5.2%; that from 400 to 800 as being 4.6%, and that from 500 to 1000 as being 2.1% (PDF). As such his tables contradict the best known, and most widely accepted formula in climate science. Even worse, he then goes on to say that "beyond 1000+ ppmv the effect of increasing levels of CO2 can only ever be
absolutely minimal even if CO2 concentrations were to increase indefinitely." (PDF) That claim is the basis of setting the temperature response to 1000 ppmv as 100%, but is complete bunk. As per the standard formula, the temperature response of an increase in CO2 level from 1000 to 2000 ppmv is the same as the the temperature response for an increase from 100 to 200 ppmv.
Hoskins does not even apply his formula consistently. Based on his first table, the increase in temperature for a given increase in CO2 concentration expressed as a ratio of earlier increases should be constant regardless of whether you use IPCC values, or "skeptical" values. Yet in his second table (WUWT post) that condition is not met. In other words, his calculated temperature responses in his second table are inconsistent with those in his first table.
Anyway, with the standard IPCC climate sensitivity of 3 C per doubling of CO2, increasing CO2 from 400 to 1000 ppmv will increase temperature by 3.9 C. That will represent a 5.4 C increase over pre-industrial levels - an increase equivalent to the difference in temperature between the coldest period of the last glacial and the pre-industrial.
Stealth... If you genuinely want to take a "skeptical" approach to the issue of climate change, WUWT is clearly not the place to go. If you want to confirm your predetermined position that nearly all the published research and nearly all the actively publishing climate scientists are wrong... then WUWT is your one stop shop.
To add to what Tom said, the flip side of the absurdity put forth by that WUWT post is that is fails to acknowledget that atmospheric CO2 in very high concentrations is clearly responsible getting the earth out of past deep glaciation events. That well documented relationship could never occur if the CO2 effect was fully saturated at lower concentrations.
Tom Cutris @ 201
Thanks for the long reply. I have dug into what you have said and have some additional questions:
You stated: “WUWT makes absurd false statements such at that at least 200 ppmv is required in the atmosphere for plant life to grow (CO2 concentrations dropped to 182.2 ppmv at the Last Glacial Maximum, giving the lie to that common claim).”
I have done a Google search on CO2 and plant growth and have find many sources (some unrelated to climate and on plant research) that indicate plant growth is stunted at 200 ppmv CO2. At 150 ppmv a lot of plants are not doing very well. Based on this WUWT doesn’t seem absurd to me, why do you think so?
Sources:
http://www.es.ucsc.edu/~pkoch/EART_229/10-0120%20Appl.%20C%20in%20plants/Ehleringer%20et%2097%20Oeco%20112-285.pdf
CO2 Science
As for the rest of your post, I went to the very nice calculator (http://forecast.uchicago.edu/Projects/modtran2.html) pointed to me by scaddenp @ 46 from http://www.skepticalscience.com/imbers-et-al-2013-AGW-detection.html. It models the IR flux of various gases and looks pretty cool. I ran the calculator to produce the table below, which shows the upward IR flux in W/m^2 for various levels of CO2. With no CO2 and using the 1976 standard US atmosphere (I left the tool’s default setting in place and only changed to the 1976 USA atmosphere and the amount of CO2), the upward IR flux is 286.24 W/m^2. The first 100 ppmv reduces the upward IR flux to 264.17 W/m^2. If CO2 doubles from the current 400 ppmv to the hypothesized 800 ppmv, then upward IR flux drops to 255.75 W/m^2. From a “zero CO2” atmosphere, total reduction in IR flux at an 800 ppmv CO is 30.49 W/m^2. Of this total amount, 72.4% is captured by the first 100 ppmv of CO2. If CO2 increases from 400 ppmv to 800 ppmv, based on my math it appears that 91% of the heat trapping effect of CO2 is already “baked in” at 400 ppmv of CO2. This seems to line up very closely to what WUWT is stating, unless I made a mistake.
CO2 ppmv Upward IR Flux
0 286.24
100 264.17 72.4% 72.4%
200 261.41 81.4% 9.1%
300 259.74 86.9% 5.5%
400 258.58 90.7% 3.8%
500 257.67 93.7% 3.0%
600 256.91 96.2% 2.5%
700 256.29 98.2% 2.0%
800 255.75 100.0% 1.8%
Rob Honeycutt @ 203 and @ 204
Like Tom Curtis, you also assert that WUWT “is absurb”, yet using the very sources provided by other posters on this web site, I have seemed to confirmed what WUWT is saying about CO2, namely, the majority of the effects of CO2 are mostly captured due to logarithmic absorption of increasing CO2. Based, on the MODTRAN calculator, doubling CO2 to 800 ppmv is only going to trap and additional 2.83 W/m^2, which is 0.21% of the solar energy hitting the top of the atmosphere. I fail to see how this is can possibly be so bad – either things are so bad now, or the additional 2.83 W/m^2 isn’t going to matter at all. And natural variability has to be greater than 0.2%, especially since the change in total solar output varies by 0.1% over a solar cycle (http://en.wikipedia.org/wiki/Solar_constant). Given that global temperatures really haven’t increased much over the last 17 years, I suspect that things may not be “that bad.” If I am missing something, please help me out. Thanks! Stealth
[RH] Fixed link that was breaking page formatting.
Stealth...
I think you're getting some figures wrong here. The variation in the 11 year solar cycle is about 0.25W/m^2. The change in radiative forcing for doubling CO2 over preindustrial, including feedbacks, is in the neighborhood of 4W/m^2. (And we're potentially talking about TWO doublings if we do nothing to mitigate emissions.) Natural variability doesn't add any energy to the climate system. Global temperatures over the past 17 years represent only a fraction of the energy in the climate system, and that trend is still well within the expected model range.
We are likely to see an increase in surface temps for doubling CO2 of around 3C. Two doublings would put us at 6C over preindustrial. Even 3C is a change that take us well outside of what this planet has experienced in many millions of years, and we will have accomplished this in a matter of less than 200 years. Do you really think that species and ecosystems can near-instantly (genetically and geologically speaking) adjust to such changes?
When you read at WUWT about the logarithmic effect of CO2, you're reading a straw man argument. Scientists understand the logarithmic effect and it's built into every aspect of the science and has been ever since Svante Arrhenius at the turn of the 20th century. In fact, that position is directly contradicted by their own contrarian researchers like Roy Spencer and Richard Lindzen.
And Stealth... Think of this as a simple reality check. We are very close to seeing seasonally ice free conditions in the Arctic. This is a condition that has not seen on Earth in well over a million years. The global glacial ice mass balance is also rapidly declining. The Greenland ice sheet and the Antarctic ice mass balance are both in decline. These are all well outside the range of natural variation.
If an "additional 2.83 W/m^2 isn’t going to matter at all" then why do we see such a dramatic rapid loss of global ice?
Stealth, Tony Watts et al. have ridden Phil Jones for years in his honest statement about the significance of a surface temp trend, knowing full well that the short-term surface trend is meaningless without extremely careful analysis. I'm not giving Watts one angstrom of wiggle room. Watts is in the game for rhetoric, not for science. He's paid to cast doubt, not to advance science. He wants to be able to say "all plants die at 200ppm CO2" rather than get it right. If he could squeak 250ppm and get away with it, he'd do it. How many errors does a guy get before we find him not worth the trouble? Pointing out Watts', Eschenbach's, and Goddard's absurdities is a cottage industry.
Stealth... You also need to understand who the CO2 Science folks are. These are the Idso's who are, literally, paid by the FF industry to produce material to cast doubt on climate science.
The experimental test you link to is patently absurd. You just can't compare CO2 concentrations in an aquarium to planetary level systems. The very notion that this experiment has any larger implications should be a clue as to the motivations of the Idso's (and their conclusions are contradicted by published research).
There is a large body of actual research published on this topic (which is going off topic for this thread) that you can read. You just have to get out there and find it. I would link to it for you but you should probably locate it yourself so that you know that I'm not trying to mislead you in any way.
My favorite quote of all time related to the climate change issue comes from the late Dr Stephen Schneider, where he says, "'Good for us' and 'end of the world' are the two lowest probability outcomes." So, when you see people like the Idso's claiming this is all good for us, that speaks volumes about their reliability.
Craig Idso is paid over $11k/month. (Just wanted to source the claim above.)
Hmm. Check those figures. From pre-industrial to double CO2, the increase is 3.7W/m2. That is 1.1C above preindustrial without feedbacks. However, you cant raise temperature without increasing water vapour, so at very least you need this feedback. Ice loss gives you an albedo feedback (and remember this is largely the driver for glacial-interglacial cycle) and on longer scale you have carbon cycle feedback. I dont see how can say "not too bad" without actually running the numbers. That's what models are for.
By the way, if you stepping into a sewer like CO2 "Science" makes sure you actually read any reference he gives. This site is specialist at misrepresenting papers safe in the knowledge that most readers want good news and wont check. Dont fall for it.
Stealth @204, you appear to have ignored the substance of my critique, while simply repeating distortions from the WUWT article. Specifically, two key errors on the WUWT article that I focussed on was that there table of "universally accepted" was anything but, and that it did not show the most important feature of the "universally accepted" values CO2 forcing, ie, near constant forcing for each doubling of CO2. You present your own table of values derived from the Univesity of Chicago version of Modtran, which is superficially similar to that at WUWT, without noticing that it supports my criticism, rather than rebuts it. To illustrate that, I have expanded your table of values using Modtran, and shifted the baseline percentage to the forcing for 1000 ppmv so that the percentages match those at WUWT. The result is as follows:
Doubling: Forcing: Percentage: WUWT Perc:
50-100___ 2.86____ 9.10%
100-200__ 2.76____ 8.78%_____ 10.10%
200-400__ 2.83____ 9.00%_____ 7.30%
300-600__ 2.83____ 9.00%_____ 5.20%
400-800__ 2.83_____9.00%_____ 4.60%
500-1000__2.86____ 9.10%_____ 2.10%
800-1600__2.85____ 9.07%
Average:___2.83____ 9.01%
Please note that while the WUWT values descend rapidly with increased CO2 concentration, the Modtran values are near constant for each doubling of CO2, regardless of the initial CO2 concentration. In that, the Modtran values reflect the standard physics the radiative forcing of CO2. In constrast, the WUWT figures are simply bullshit, as also is the claim that they are universally accepted values.
A third key error was the claim that increases of CO2 concentration above 1000 ppmv "... can only ever be absolutely minimal even if CO2 concentrations were to increase indefinitely." That claim is superficially supported by the declining values per doubling shown by WUWT, but are definitively refuted by the near constant forcing per doubling of CO2 shown by the general equation for radiative forcing of CO2 (see Table 1), as also by the Modtran model, which reflects the same radiative physics. Again this can be shown on the Modtran model by simply redoubling from 140 ppmv, which show successive increments in radiative forcing for each doubling of 2.8, 2.82, 2.83, 2.86, 2.95, and an average of 2.85 W/m^2. You will note that while all values are approximately the same, the final value, for a doubling from 2,240 to 4,480 ppmv is the largest. I ran the values out to 4,480 ppmv because it is near, but below the upper limit of the increase to atmospheric CO2 that could be caused by humans by the combustion of fossil fuels.
The argument in the WUWT article is based on the accuracy of their radiative forcing data, which we have seen to be bullshit; the absurd claim that radiative forcing reaches an assymptote at (or slightly above) 1000 ppmv, and an absurdly low value for radiative forcing which I did not adress. You have shown nothing to the contrary, and indeed if you look carefully at your data, it contradicts the WUWT article as clearly as I did.
Finally, with regard to the minimum CO2 concentration for the growth of plants, it is known that plants using C3 photosynthesis are dependent of ambient CO2 concentration for their growth rate. In contrast, C4 plants rates of photosynthesis are "... independent of the intercellular CO2 concentration" (Ehlereringer and Bjorkman, 1977). On a hunch, I looked up the pathway of Golden Pothos, the plant used by the Idsos' in their experiment. Unsurprisingly it was a C3 plant. Odd that they should not mention this important fact, and the importance of the fact in relation to their experiment. Nevertheless, their experiment does show that for C3 plants, atmospheric CO2 concentrations << 150 ppmv are to low for growth when they are adapted to a high CO2 environment. Given a multigeneration adaptation process to lowering CO2, however, it is quite possible that C3 plants would survive and even flourish on lower CO2 levels. The would, however, be at a competitive disadvantage to C4 plants. Any further discussion of this topic should be taken to the relevant thread, whose advanced article I highly recomment to you. As related to my original criticism, it is IMO absurd to benchmark a minimum CO2 level at levels 33-100% higher than laboratory estimates of the minimum required, and 10% higher than CO2 concentrations plantlife is known to have survived for periods longer than the lifespan of most trees.
Dont want to get too far into "CO2 is plant food junk", (see the articles here if you swallow this stuff), but also note that photosynthesis is temperature dependent and declines from 25C
stealth @204 replied to Rob Honeycutt, saying:
To begin with, let's notice that Modtran is a simple Line-by-line Radiative Transfer Model (LBLRTM), and the version online at the University of Chicago is a 1987 version of that Line-by-line model. By its nature a LBLRTM only determines the radiative flux up and down at different levels of the atmosphere. It does not show changes of surface temperature or any other response to differing conditions. Further, no single model of atmospheric conditions can be the equivalent of "average" conditions. This is especially so of the 1976 US Standard atmosphere, which was designed for the aerospace industry rather than for modelling radiative transfer. This is evident in the approx 2.83 W/m^2 per doubling of CO2 on that model with the 1976 US standard atmosphere. To determine the true forcing for a doubling of CO2, you need to run a LBLRT model for a variety of conditions to match the variety of conditions met on Earth, then weight the results according to the proportion of the Earth's surface on which those conditions are met. Alternatively you can use a Global Circulation Model. Myhre et al, 1998 did both, determining that the radiative forcing of CO2 equals 5.35 times the natural log of the new CO2 concentration divided by the initial CO2 concentration. For doubling CO2, that is 3.7 W/m^2.
Further, it is misleading to take the doubling from the current CO2 concentration. The Earth's CO2 concentration has increased by 43% from the preindustrial, and temperatures have not yet reached the equilibrium temperature for that increase. Estimating the further increase by taking a doubling of CO2 from current concentrations ignores the temperature increase still in the pipeline. You can partially compensate for that by adding the current radiative imbalance (0.6 W/m^2) to the radiative forcing of doubling CO2, but only partially because the slower feedbacks such as sea ice and snow cover have not yet reached equilibrium for the current temperature, indicating future warming from constant CO2 at 400 ppmv is greater than would be estimated from the current radiative imbalance alone.
Ignoring those additional factors, just how big, in relative terms is the 3.7 W/m^2 from a doubling of CO2?
Stealth measures the relative scale by taking the Total Solar Irradiance (TSI), or approximately 1366 W/m^2. That value, however, is the power of sunlight falling on a disc perendicular to the sunlight at the Earth's orbit. The Earth is not a disc. It is a sphere, and hence has 4 times the surface area of a disc of the same radius. Therefore the TSI needs to be divided by 4 to determine the TOA insolation. Further, 30% of the sunlight is simply reflected back to space. As a result, the actual "solar forcing" is 239 W/m^2. One doubling of CO2 concentration has a forcing equal to 1.5% of that value.
The sun is a mildly variable star. The range of its variability is about 1.2 W/m^2, or 0.21 W/m^2 for decadal average insolation between the Maunder minimum and the recent grand solar maximum. The forcing of a doubling of CO2 is approximately 18 times (1,760%) that difference.
The difference in radiative forcing between the Last Glacial Maximum (LGM) and the present is approximately 8 W/m^2. The CO2 forcing for doubling CO2 is 46% of that amount. More importantly, the CO2 forcing of increasing CO2 from preindustrial levels to 850 ppmv (the likely value in 2100 with no mitigation) increases radiative forcing by 5.9, or 74% of the difference between the LGM and now.
Set against these values, we see that Stealths calculation of a 0.21% difference is both wrong, and misdirected. Wrong because it uses the wrong value for both denominator and numerator. Correcting that, the value rises to 1.5%. But wrong also because it does not use a human scale. Humans could not survive on an Earth with zero solar radiation. They could not survive on an Earth with even a 10% reduction or increase in solar radiation either. The radiative forcing of CO2 introduced by industrialization, however, is very large compared to levels which humans could survive with great discomfort. It is potentially larger than those which permit humans to maintain their civilization. Trying to gloss over that fact by irrelevant comparisons does nobody any favours.
Tom Curtis' comment is so incisive, devastating, and, in his usual clear style, makes plain the point of doing something about emissions so well, that I felt compelled to share it specifically on Facebook.
You may now return to your regularly-scheduled discussion.
Very nice Tom. Stealth, hopefully that analysis will also show you how easy it is for "simple facts" like you found, to be arranged in a way that results in a misleading conclusion when you lack expert domain knowledge. Skepticism is good but even better is your current practise of running your skeptical conclusions past other folks. Keep it up. Honest stuff like this is very educational.
If the CO2 effect is saturated, then you'd better go and tell the people over at Licor. They seem to think that their infrared gas analyzers are capable of measuring CO2 from 0-3000ppm. If IR is saturated at the current 400ppm, then Licor is going to have to give a lot of money back to people that bought their sensors expecting to be able to get good measurements at higher CO2 values.
And not just the size of the increase in atmospheric CO2 but also the rate, which may be unprecedented.
I have been looking more carefully at the PDF which is the detailed explanation of the WUWT story which is the basis of Stealth's comments. The inconsistency and, frankly, the dishonesty of the author, Ed Hoskins, is shown in the fifth chart of the PDF (page 3). It purports to show the expected temperature response to increases in CO2 according to a group of "skeptics" (Plimer, Carter, Ball, and Archibald), and three "IPCC assessments" by three authors. It also shows a "IPCC average", but that is not the average value from any IPCC assessment, but rather the average of the three "IPCC assessments" by the three authors.
The first thing to note about this chart is that it gets the values wrong. Below are selected values from the chart, with the values as calculated using the standard formula for CO2 forcing, and using their 100-200 value as a benchmark for the temperature response:
Concentration Skeptic Lindzen Krondratjew Charnock “IPCC” Mean IPCC
100-200______0.29____0.56____0.89________1.48______0.98_______3
200-300______0.14____0.42____0.44________1.34______0.73
Calc 200-300_0.17____0.33____0.52________0.87______0.57_______1.76
400-1000_____0.15____0.7_____1.19________1.78______1.22
Calc 400-1000_0.38___0.74____1.18________1.96______1.29_______3.97
The "Calc" values are those calculated using the standard formula for radiative forcing, with a climate sensitivity factor determined by the claimed temperure response for a doubling of CO2 from 100-200 ppmv. The '"IPCC" Mean' column is the mean of the three prior columns.
Clearly the values in the table are not consistent with the standard formula, typically overestimating the response from 200-300 ppmv, and underestimating the response from 400-1000 ppmv. That pattern, however, is not entirely consistent, being reversed in the case of Kondratjew. Other than that odd inconsistency, this is just the same misrepresentation of temperature responses shown in my 211 above.
More bizarre is the representation of the IPCC by Lindzen, Kondratjew and Charnock. As can be seen, their values, and the mean of their values significantly underrepresent the best estimate of the IPCC AR4 of 3 C per doubling of CO2. That is a well known result, and the misrepresentation can have no justification. It especially cannot have any justification given that neither Kondratjew nor Charnock are authors (let alone lead authors) of any relevant chapter in the IPCC AR4. Nor are they cited in any relevant chapter of the IPCC AR4. Presenting their work as "IPCC assessments" is, therefore, grossly dishonest.
Moving on, Hoskins shows another chart on page 2, which helps explain at least one cause of his error. It is a reproduction of a chart produced by David Archibald, purportedly showing the temperature response for succesive 20 ppmv increases in CO2 concentration. Looking at Archibald's article, he claims it is a presentation, in bar graph form, of a chart posted by Willis Eschenbach on Climate Audit:
As a side note, the forcing shown is 2.94 log(CO2)+233.6, and hence the modtran settings used do not correspond to the global mean forcing. The method used by Eschenbach, therefore, cannot produce a correct value for the global mean forcing of CO2. As it happens, his values produce a forcing per doubling of CO2 of 2 W/m^2 per doubling of CO2, and hence underestimates the true forcing by 46%. Note, however, that it does rise linearly for each doubling of CO2, so Hoskins has not even mimmicked Eschenbach accurately.
Far more important is that it is a plot of the downward IR flux at ground level with all non-CO2 green house gases (including water vapour) present. The IPCC, however, defines 'radiative forcing' as "... the change in net (down minus up) irradiance (solar plus longwave; in W m–2) at the tropopause after allowing for stratospheric temperatures to readjust to radiative equilibrium, but with surface and tropospheric temperatures and state held fixed at the unperturbed values". (My emphasis.)
It does so for two reasons. First, the theory of radiative forcing is essentially a theory about the energy balance of the planet. Therefore it is not the downward radiation at the surface that is at issue, but the balance between incoming and outgoing radiation at the top of the atmosphere.
Second, the temperature at the tropopause and at the surface are bound together by the lapse rate. Therefore any temperature increase at the tropopause will be matched by a temperature increase at the surface. Given reduced outward radiation at the tropopause, the energy imbalance between incoming solar radiation and outgoing IR radiation will result in warming at the surface and intermediate levels of the atmosphere. Adjustments in the rate of convection driven by temperature differences will reestablish the lapse rate, maintaining the same linear relationship between tropopause and surface temperature (ignoring the lapse rate feedback). The net effect is that the same effective temperature increase will occure at all levels, resulting in a larger downard radiation at the surface than the initial change at either the tropopause or the surface.
So, Eschenbach (and Hoskins) derive their values incorrectly because they simply do not understand the theory they are criticizing, and which is accepted without dispute by knowledgeable "skeptics" such as Lindzen and Spencer. They are in the same boat of denying simple physics as are the "skydragon slayers" who Watts excoriates. Watts, however, publishes pseudo-scientific claptrap on the same level as the "skydragon slayers" on a daily basis, however, because he also is completely ignorant of the theory he so vehemently rejects.
Thanks, Tom. This material needs to be worked into some sort of category level collection point -- e.g. WUWT Debunkings or WWWT (Watts Wrong With That). I am most anxious to read Stealth's response, as s/he is a prime candidate for developing an authentic case of DK.
DSL @ 219: what does “DK” mean? I’d guess “denialist knowledge”.
By the way, I am male, 52, with a BS in computer science and physics. And for the record, I do not blindly accept what you guys say, nor do I blindly accept what WUWT or Dr. Spencer’s website has to say. My natural inclination is to think that natural variability is a significant cause of recent warming, but I think CO2 may have a sizable role, hence the reason to discuss this with you guys. I figure you all are pro AGW, have access to the data, and can backup your position. I can be convinced with the right data and good arguments.
Since Tom Curtis appropriately moved my question to this thread, I wanted to read the whole thing to avoid rehashing the same stuff all over. Overall, good stuff and information in this thread. As for my conversation with you guys, I think Tom Curtis made an excellent point @213, namely that energy at the TOA is not 1366 W/m^2 over the entire globe. I knew this since the curvature of earth reduces the W/m^2 as a function of the incidence angle. I was going to compute this with integration, but I like the clever way to just divide by 4 to arrive at an average “effective” energy input over the whole globe. Therefore, I agree that the average effective energy at the TOA is, over a 24 hour period, 341.5 W/m^2. I also think that the solar variance over a solar cycle probably isn’t meaningful to this value. It may be 1.3 W/m^2, but when divided by 4 we get a relatively small 0.325 W/m^2. I’m good with that.
As for CO2 being fully saturated, I agree that it isn’t. The doubling of CO2 is probably on the order of 3 W/m^2 of reduced IR flux based on my computations with MODTRAN. What is the consensus value for the amount of reduced IR flux from the increase in CO2 from 1950 until now (CO2 increasing from 310 ppmv to 400 ppmv)? Running MODTRAN, I figure it is about 1 W/m^2.
Next, I have some questions about energy balance, which related to TC’s @218 comments, but I don’t think those belong in the CO2 saturation thread. John Cook commented @132 of this thread to the moderators about starting a thread on the energy budget. Is there such a thread for that? If so, please post a link here.
stealth @220, the version of Modtran available at the University of Chicago website is an early version (1987), which has been superceeded by 4 other versions since then. More importantly, no single atmospheric condition will effectively model the mean effect over the entire Earth. You need to take representative samples from a large number of conditions (tropical over forest, tropical over sand, tropical over ocean, various cloud conditions etc) and determine an average effect to get accurate values. Unfortunately the University of Chicago interface does not allow that level of flexibility in conditions. Nevertheless, Gunnar Myhre and associates did exactly that in 1998. There result was that over a broad range of values, the radiative forcing of CO2 was 5.35 * ln(CO2c/CO2i) where CO2c is the new value and CO2i is the initial value. The error given is +/-1%. This yields a forcing for the doubling of CO2 of 3.7 W/m^2, and a forcing of 1.36 W/m^2 for the CO2 increase from 310-400 ppmv.
NOAA maintains a usefull webpage showing the relevant formulas for the most significant GHG that do not condense at normal atmospheric pressures and temperatures, along with their estimated radiative forcing. For what it is worth, this is the aspect of climate science that even Spenser and Lindzen agree with, and which Anthony Watts feels insulted if you suggest he does not, even though he frequently publishes and publicly endorses articles which disagree with it.
Regarding your questions, it is hard to suggest an appropriate thread without knowing what they are. You could either use the search function on this site to find an appropriate topic, or ask the questions and we can switch topic for the answers if appropriate.
Stealth - The 'go-to' reference for direct CO2 forcing is Myhre 1988, who estimates it at a simplified (curve-fit to the more complex radiative computations) expression of:
This means that the radiative forcing increase from 310 to 400 ppm of CO2 would be 5.35*ln(400/310), or about 1.36 W/m2. A doubling of CO2 will produce a non-feedback ΔF of 3.7 W/m2.
Stealth,
DK = Dunning Kruger, an unwarranted belief in one's own expertise (and an inability to recognise true expertise in others) due to lacking the expertise necessary to recognise that one's own expertise is limited. Note that it's not the same as "stupid", and it can apply to anyone, no matter how much of an expert they are in their own domain, when they venture outside of that domain — xkcd's "Physicists" comic is a good example of this.
Regarding energy balance, a quick Google search came up with this, although it's a few years old now. The basic point is that the difference between energy entering the system and energy leaving the system has not only been modelled, it's been empiracally observed. Basic physics dictates that if there is a difference, then due to conservation of energy, that energy must be going somewhere. You can work out the accumulation of energy in the earth by trying to physically measure it everywhere you can think of, or you can just integrate the energy imbalance measured by the satellites at the top of the atmosphere over time. This last point really puts all the arguments over thermometer placement and adjustments into context.
TC @221 and KR @222: I think my back-of-the-envelop hacks with MODTRAN are close enough to your 5.35 * ln(c1/c0) equation. They both produce relatively close numbers; but I’ll use the accepted 1.36 W/m^2 for CO2 from 310 ppmv to 400 ppmv. But this 1.36 W/m^2 is only 0.4% of the total back radiation from the sky based on the IPCC AR 4 energy balance (http://www.ipcc.ch/publications_and_data/ar4/wg1/en/faq-1-1.html). That is not very much relative to the whole earth system.
JasonB @223: LOL. I’ve been so wrong on so many things I think I would have a hard time being DK; I doubt I can have an unwarranted belief in my climate expertise, because I don’t have any (just a BS in physics).
Stealth - It doesn't matter what the baseline is. Really. Because the baseline represents the current situation, the Holocene, the environment we have dealt with for the last 8-10 kY.
What matters is the change. The forcing deltas, the temperature deltas, the shifts in growth zone, in sea level, in heat wave frequencies, etc. Only 0.4%? Irrelevant! How much will the change affect us, what do we have to do to adapt - that is the real question.
See CO2 is just a trace gas - the baseline is comprised of multiple elements, of many components, and it simply doesn't matter what the magnitude of various components are. What matters is the change in components, in forcings, and how those changes affect us. Focusing on the scale of a change versus a baseline, without looking at how that change affects us in real terms, is a false minimization of the issue.