Climate Science Glossary

Term Lookup

Enter a term in the search box to find its definition.

Settings

Use the controls in the far right panel to increase or decrease the number of terms automatically displayed (or to completely turn that feature off).

Term Lookup

Settings


All IPCC definitions taken from Climate Change 2007: The Physical Science Basis. Working Group I Contribution to the Fourth Assessment Report of the Intergovernmental Panel on Climate Change, Annex I, Glossary, pp. 941-954. Cambridge University Press.

Home Arguments Software Resources Comments The Consensus Project Translations About Support

Bluesky Facebook LinkedIn Mastodon MeWe

Twitter YouTube RSS Posts RSS Comments Email Subscribe


Climate's changed before
It's the sun
It's not bad
There is no consensus
It's cooling
Models are unreliable
Temp record is unreliable
Animals and plants can adapt
It hasn't warmed since 1998
Antarctica is gaining ice
View All Arguments...


Username
Password
New? Register here
Forgot your password?

Latest Posts

Archives

CO2 lags temperature - what does it mean?

What the science says...

Select a level... Basic Intermediate Advanced

Increasing concentration of CO2 in the atmosphere increases global temperature. Increasing global temperature also increases the concentration of CO2 in the atmosphere. Yes, you can have both. Antarctic ice core records of past climate change help us understand earth’s climate system and show that human-caused climate change is fundamentally different from natural glacial-interglacial climate cycles.

Climate Myth...

CO2 lags temperature

"An article in Science magazine illustrated that a rise in carbon dioxide did not precede a rise in temperatures, but actually lagged behind temperature rises by 200 to 1000 years.  A rise in carbon dioxide levels could not have caused a rise in temperature if it followed the temperature." (Joe Barton, US House of Representatives (Texas) 1985-2019) - Full Statement

Background of the myth:

Earth’s climate has varied widely over its multi-billion year history - from ice ages characterized by large ice sheets covering many land areas, to warm periods with no ice at the poles. Several factors have affected past climate change, including solar variability, the tilt and wobble of the Earth's orbit relative to the sun, volcanic activity, and changes in the composition of the atmosphere. Using data from Antarctic ice cores, we can explore what climate cycles have looked like over the past 800,000 years (Figure 1). Over this time period, CO2 and temperature are closely correlated, which means they rise and fall together. However, based on some Antarctic ice core data, changes in CO2 appear to follow changes in temperatures by about 600 to 1000 years. That is to say that changes in CO2 lag, or come after, changes in temperature. This has led some to incorrectly conclude that CO2 cannot be responsible for the current rise in Earth’s temperature.


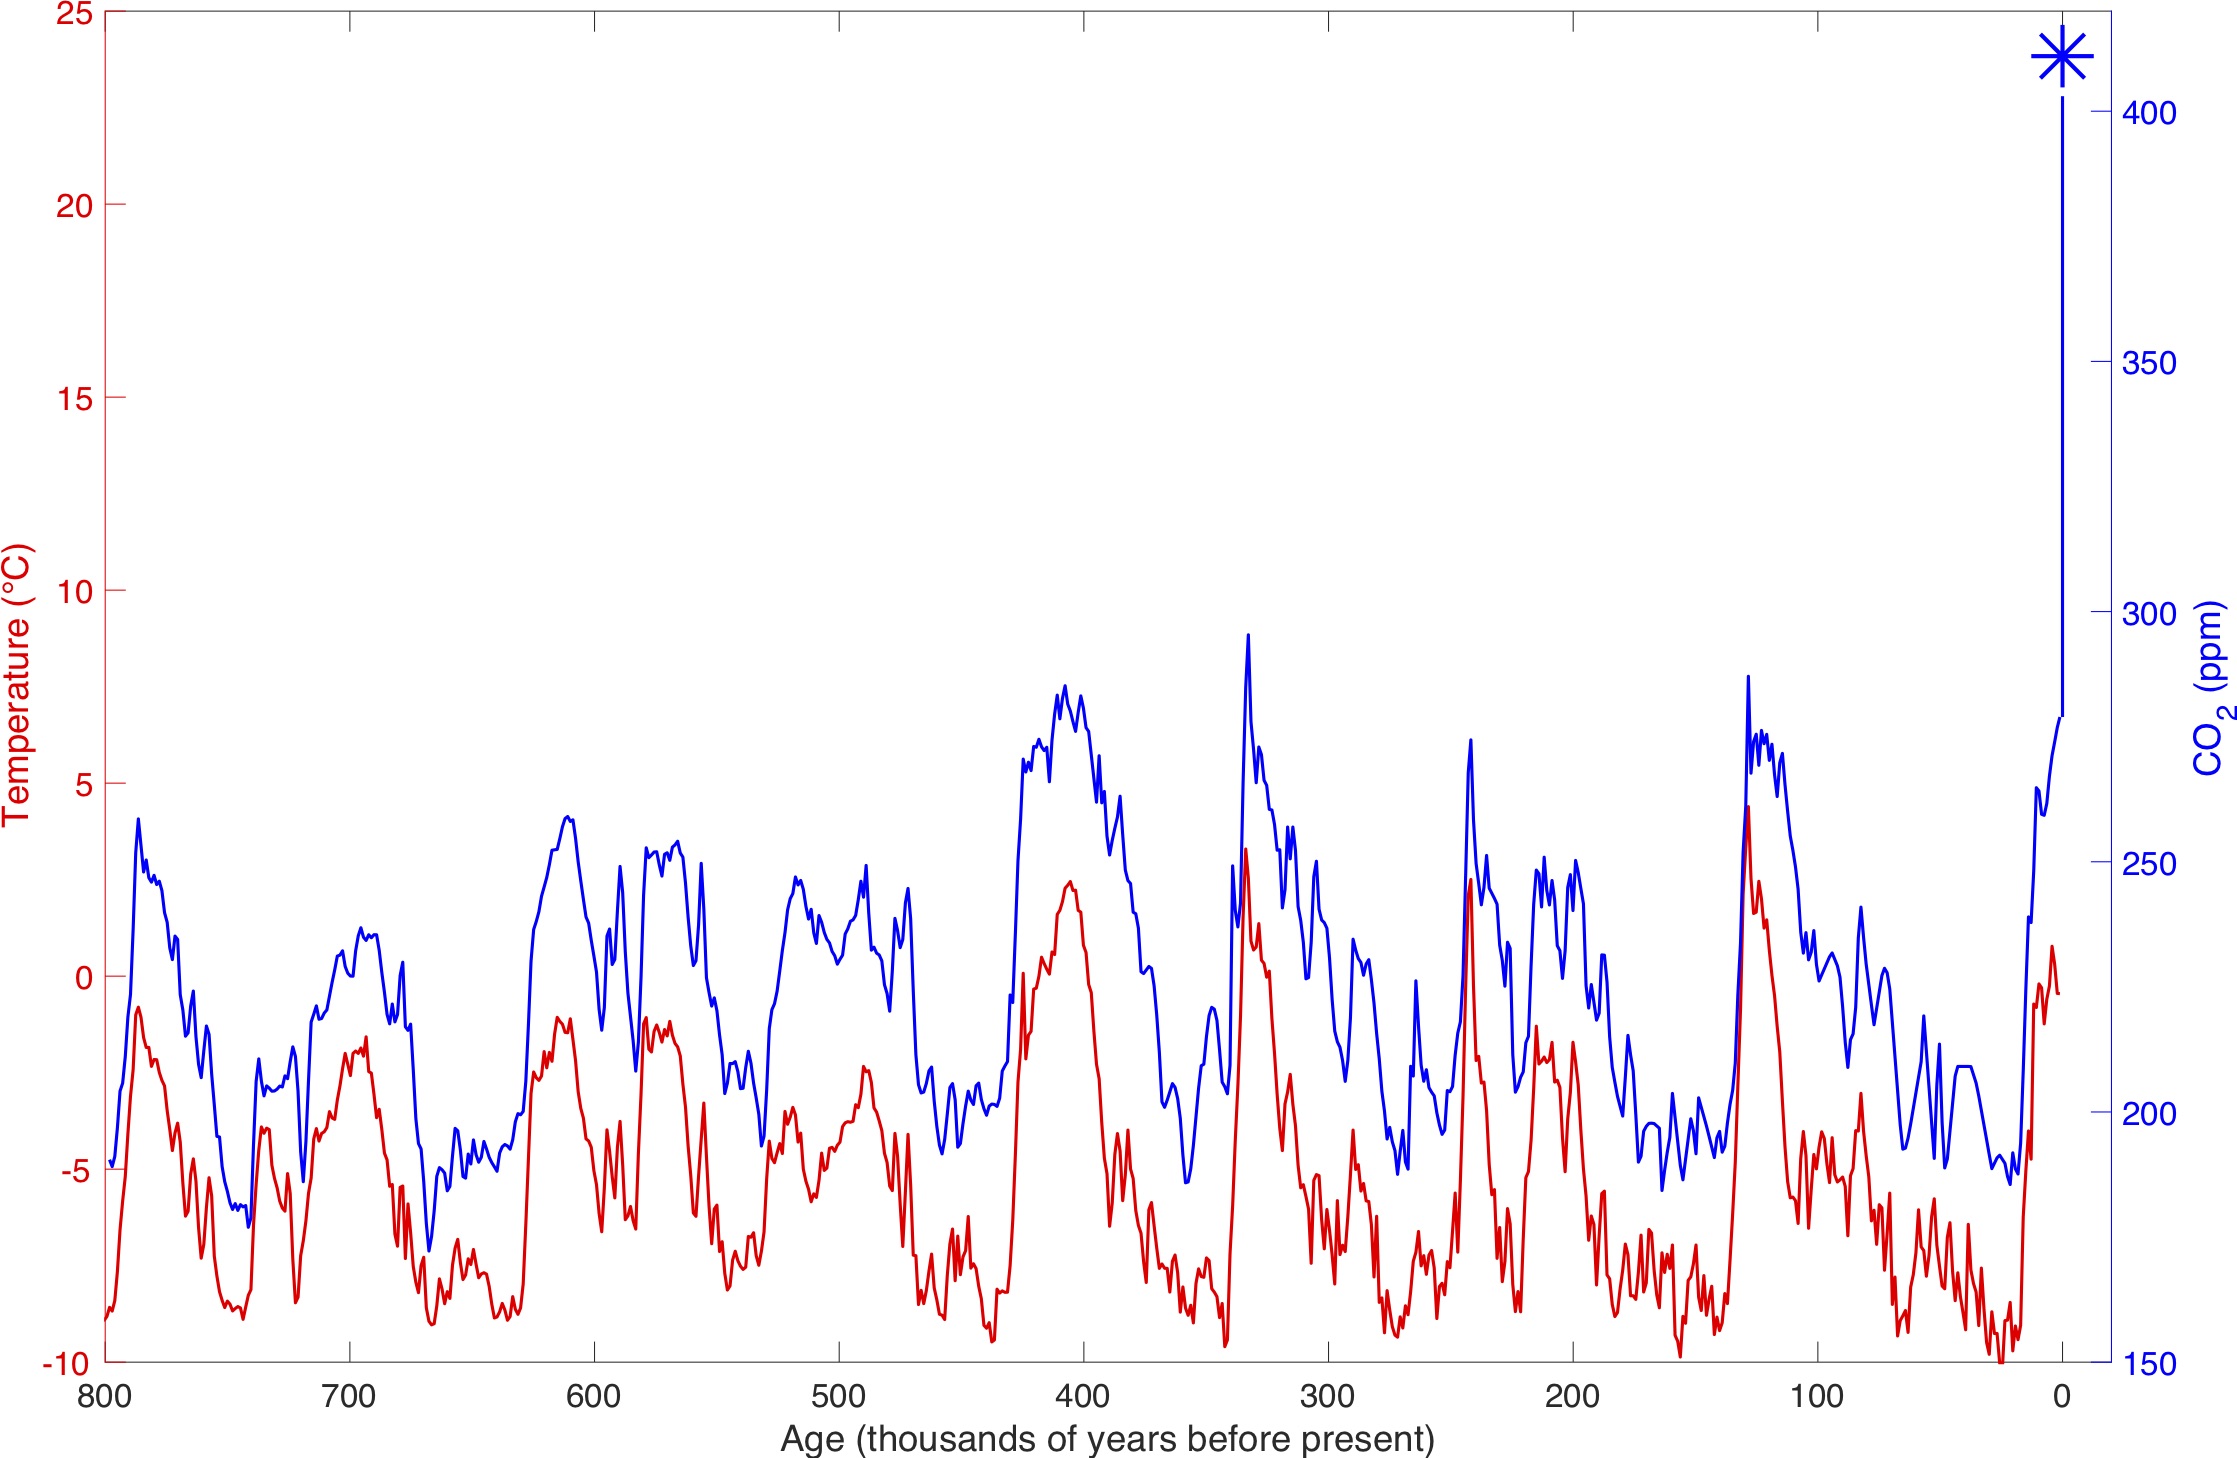
Figure 1. The EPICA Dome C ice core from East Antarctica provides the current longest ice core record, going back 800,000 years. From the core, scientists can measure past levels of CO2 in the atmosphere and estimate temperature changes over the period of the record. The modern level of CO2 in the atmosphere is plotted with the * to provide a reference.

This myth misses the mark for a number of reasons:

(see Intermediate Rebuttal for a full breakdown)

  1. It presents a false dichotomy by claiming that if atmospheric CO2 increased before temperature, then an increase in temperature cannot cause an increase in CO2. In fact, both of these causal relationships are true.
  2. It doesn’t distinguish between Antarctic and global temperature. Antarctic ice cores give a measure of Antarctic temperature, which increased before global CO2 levels. However, global temperature, as estimated from records all over the planet, increased after rises in CO2.
  3. It conflates past climate changes with present climate change. Though it’s true that we can learn a lot about Earth’s climate from studying the past, we cannot assume that changes that occurred in the past are the same as changes occurring today. In fact, ice core data shows us that present climate change is fundamentally different from past climate changes. Past changes were driven by small changes in Earth’s orbit, while current climate change is driven by human emissions of CO2.
  4. It is based on old data. While the old data aren’t wrong, newer ice cores with higher-resolution data show that the changes in CO2 and Antarctic temperature occurred so close together, that we cannot fully distinguish which happened first.

Each of these four issues with the myth relates to past and present changes in temperature and atmospheric CO2. To fully understand these changes, we need to breakdown the processes within Earth’s climate system as a whole.

Climate System Components

Within the Earth's climate system, there are many complex relationships between the processes that occur in different components of the system. Some of the main components of the system are the atmosphere, ocean, and ice sheets. Each component and the timescale over which it changes play important roles in impacting the state of Earth’s climate at any given time. 

Earth’s atmosphere covers the entire planet and can quickly circulate between the northern and southern hemispheres (over 10s of years). Gases like CO2 persist in the atmosphere for long enough that their concentration is uniform across the planet. Temperature and pressure of the atmosphere impact the circulation patterns of the atmosphere across the planet.

Over much of the Earth, the atmosphere is in direct contact with the surface of the ocean. The temperature and CO2 level of the atmosphere is directly related to those of the ocean surface. However, the ocean is very deep (12,000 feet on average), and the depths of the ocean are isolated from the surface. This large body of water circulates much more slowly than the thin, fast-moving atmosphere and thus is slow to move water between the hemispheres (over 100s of years).

Ice sheets build up over thousands of years on land areas that are cold enough that snow doesn’t melt in the summer. The presence of an ice sheet can affect the ocean circulation by providing a source of cold, fresh water melting off the ice and into the adjacent ocean. This input water has a different density than warmer, saltier water in the ocean and can thus affect how water sinks and mixes, in some cases driving ocean circulation on a global scale. A tall ice sheet can also affect atmospheric circulation simply because it pushes air higher in the atmosphere and can effectively sit in the way of moving air masses. In turn, the atmosphere and ocean can affect ice sheets by causing them to grow (with cold temperatures and lots of snow fall) or to retreat (with warm temperatures). Of these three components, ice sheets change over the slowest timescales, taking 1000s of years in some instances to respond to changes in climate conditions.

External Forcing on Earth's Climate

Earth’s climate cycles in and out of ice ages about every 100,000 years, which we can clearly see in the ice core record (Figure 1). This timing is driven by small changes in the orbit around the sun, known as Milankovitch cycles (Hays 1976). We call this an external forcing because it depends on the timing and distribution of energy received from the sun, a component outside of the Earth system. 

There are three main changes to the earth's orbit. The shape of the Earth's orbit around the sun (eccentricity) varies between an ellipse and a more circular shape. The earth's axis is tilted relative to the sun at around 23°. This tilt oscillates between 22.5° and 24.5° (obliquity). As the earth spins around its axis, the axis wobbles from pointing towards the North Star to pointing at the star Vega (precession).

Figure 2: The three main orbital variations. Eccentricity: changes in the shape of the Earth’s orbit. Obliquity: changes in the tilt of the Earth’s rotational axis. Precession: wobbles in the Earth’s rotational axis.

The combined effect of these orbital cycles causes long term changes in the amount of sunlight, or insolation, hitting the earth at different seasons, particularly at high latitudes. However, on their own, these small changes in Earth’s orbit would not cause very large fluctuations in Earth’s climate. Instead, these small changes are amplified into full-blown ice ages due to reinforcing processes that occur between the components of the atmosphere, ocean, and ice sheets (Cuffey 2016).

Internal Feedbacks on Earth's Climate

The global ice age cycles follow changes in the northern hemisphere insolation because the components of the Earth system amplify the impact in the north over the entire planet. The well-mixed greenhouse gases in the atmosphere play an important role in synchronizing temperature changes in the north and the south due to the direct impact of atmospheric CO2 on temperature. Additionally, interactions between the components of Earth’s climate system cause further changes in the global temperature and atmospheric CO2 level (Brook and Buizert 2018). We call these interactions internal feedbacks because they describe changes that depend entirely on processes within the Earth’s climate system.

Among the three components of the climate system described above, there are many internal feedbacks that affect both global temperature and atmospheric CO2 level. Because there is more land surface in the northern hemisphere, large ice sheets form over much of North America and Eurasia during ice ages. These large piles of ice in the north begin to melt when northern insolation increases. This cold and fresh melt water disrupts the ocean circulation, slowing the mixing of the global ocean and the transport of heat between northern and southern hemispheres in the water, which is important for determining global temperature (Stocker and Johnsen 2003). These changes in ocean circulation also impact how biological processes in the ocean affect atmospheric CO2 level, for example changes in ocean circulation affect how efficiently plankton move CO2 from the atmosphere into the ocean via photosynthesis (Sigman 2010). At the same time as these ocean changes affect the transport of heat between hemispheres over 100s of years, changes to atmospheric circulation caused by these feedbacks impact this transport much more quickly, over 10s of years (Markle 2017). These examples give just a taste of the many internal feedbacks that occur between the components of the climate system and affect global temperature and atmospheric CO2 level on both slow and fast timescales.

Putting It All Together

Given the many internal feedbacks that occur between the components of the climate system in response to external forcings on Earth’s climate, it’s no surprise that the transitions into and out of ice ages are complex. Data from ice cores show us the total effect of these simultaneous processes, all of which we must consider in order to understand what caused the Earth to warm out of the last ice age. The ice core data that show near-simultaneous increase of Antarctic temperature and atmospheric CO2 level provide important information for scientists studying the interplay of these processes. These data reflect the fact that both increased global temperature leads to increased atmospheric CO2 level AND increased atmospheric CO2 level leads to increased global temperature. Scientists use these data alongside computer models of Earth’s climate system to better understand how these interactions have caused climate changes in the past and how they may impact future change. Although the primary drivers of past changes differ from current and future changes (variations in Earth’s orbit around the sun vs. human emissions of greenhouse gases), the internal feedbacks of the climate system remain the same. Understanding these processes is essential for projecting the impacts of current and future climate change.


References and Related Reading

Hays, J. D., Imbrie, J., & Shackleton, N. J. (1976). Variations in the Earth’s orbit: pacemaker of the ice ages. science, 194(4270), 1121-1132.

Broecker, W. S., & Denton, G. H. (1990). The role of ocean-atmosphere reorganizations in glacial cycles. Quaternary science reviews, 9(4), 305-341.

Lorius, C., Jouzel, J., Raynaud, D., Hansen, J., & Le Treut, H. (1990). The ice-core record: climate sensitivity and future greenhouse warming. Nature, 347(6289), 139-145.

Stocker, T. F., & Johnsen, S. J. (2003). A minimum thermodynamic model for the bipolar seesaw. Paleoceanography, 18(4).

Anderson, R. F., Ali, S., Bradtmiller, L. I., Nielsen, S. H. H., Fleisher, M. Q., Anderson, B. E., & Burckle, L. H. (2009). Wind-driven upwelling in the Southern Ocean and the deglacial rise in atmospheric CO2. science, 323(5920), 1443-1448.

Sigman, D. M., Hain, M. P., & Haug, G. H. (2010). The polar ocean and glacial cycles in atmospheric CO 2 concentration. Nature, 466(7302), 47-55.

Pedro, J. B., Rasmussen, S. O., & van Ommen, T. D. (2012). Tightened constraints on the time-lag between Antarctic temperature and CO2 during the last deglaciation. Climate of the Past, 8(4), 1213.

Shakun, J. D., Clark, P. U., He, F., Marcott, S. A., Mix, A. C., Liu, Z., ... & Bard, E. (2012). Global warming preceded by increasing carbon dioxide concentrations during the last deglaciation. Nature, 484(7392), 49-54.

Fudge, T. J., Steig, E. J., Markle, B. R., Schoenemann, S. W., Ding, Q., Taylor, K. C., ... & Alley, R. B. (2013). Onset of deglacial warming in West Antarctica driven by local orbital forcing. Nature, 500(7463), 440-444.

Parrenin, F., Masson-Delmotte, V., Köhler, P., Raynaud, D., Paillard, D., Schwander, J., ... & Jouzel, J. (2013). Synchronous change of atmospheric CO2 and Antarctic temperature during the last deglacial warming. Science, 339(6123), 1060-1063.

Buizert, C., Gkinis, V., Severinghaus, J. P., He, F., Lecavalier, B. S., Kindler, P., ... & White, J. W. (2014). Greenland temperature response to climate forcing during the last deglaciation. Science, 345(6201), 1177-1180.

Marcott, S. A., Bauska, T. K., Buizert, C., Steig, E. J., Rosen, J. L., Cuffey, K. M., ... & McConnell, J. R. (2014). Centennial-scale changes in the global carbon cycle during the last deglaciation. Nature, 514(7524), 616-619.

Buizert, C., Adrian, B., Ahn, J., Albert, M., Alley, R. B., Baggenstos, D., ... & Brook, E. J. (2015). Precise interpolar phasing of abrupt climate change during the last ice age. Nature, 520(7549), 661-665.

Markle, B. R., Steig, E. J., Buizert, C., Schoenemann, S. W., Bitz, C. M., Fudge, T. J., ... & Sowers, T. (2017). Global atmospheric teleconnections during Dansgaard–Oeschger events. Nature Geoscience, 10(1), 36-40.

Buizert, C., Sigl, M., Severi, M., Markle, B. R., Wettstein, J. J., McConnell, J. R., ... & Fujita, S. (2018). Abrupt ice-age shifts in southern westerly winds and Antarctic climate forced from the north. Nature, 563(7733), 681-685.

Brook, E. J., & Buizert, C. (2018). Antarctic and global climate history viewed from ice cores. Nature, 558(7709), 200-208.

Rae, J. W., Burke, A., Robinson, L. F., Adkins, J. F., Chen, T., Cole, C., ... & Stewart, J. A. (2018). CO 2 storage and release in the deep Southern Ocean on millennial to centennial timescales. Nature, 562(7728), 569-573.

Uemura, R., Motoyama, H., Masson-Delmotte, V., Jouzel, J., Kawamura, K., Goto-Azuma, K., ... & Ohno, H. (2018). Asynchrony between Antarctic temperature and CO 2 associated with obliquity over the past 720,000 years. Nature communications, 9(1), 1-11.

Last updated on 18 February 2021 by eckahle. View Archives

Printable Version  |  Offline PDF Version  |  Link to this page

Argument Feedback

Please use this form to let us know about suggested updates to this rebuttal.

Related Arguments

Further reading

That CO2 lags and amplifies temperature was actually predicted in 1990 in a paper The ice-core record: climate sensitivity and future greenhouse warming by Claude Lorius (co-authored by James Hansen):

"Changes in the CO2 and CH4 content have played a significant part in the glacial-interglacial climate changes by amplifying, together with the growth and decay of the Northern Hemisphere ice sheets, the relatively weak orbital forcing"

The paper also notes that orbital changes are one initial cause for ice ages. This was published over a decade before ice core records were accurate enough to confirm a CO2 lag (thanks to John Mashey for the tip).

Also, gotta love this quote from Deltoid in answer to the CO2 lag argument: See also my forthcoming paper: "Chickens do not lay eggs, because they have been observed to hatch from them".

Further viewing

Denial101x video

Myth Deconstruction

Related resource: Myth Deconstruction as animated GIF

MD Lag

Please check the related blog post for background information about this graphics resource.

Comments

1  2  3  4  5  6  7  8  9  10  11  12  13  14  15  16  17  18  19  20  Next

Comments 1 to 25 out of 663:

  1. Nice correlation between T and CO2 level. However, given a correlation between two variables one has still to clarify which is doing what. One might of course notice that in the most recent "burst" CO2 gets well above the temperature curve, unlike the previous cases. Does anyone know what in the past produced the "fast" T and CO2 growths? Marco
  2. It is reasonable that warming of the oceans is in fact causing CO2 increase in the paleo record. What I wonder about is how anyone can turn this into evidence that CO2 causes warming? When I first saw this at an ACS function nearly 20 years ago these curves were presented as proof of CO2 caused warming; despite the obvious fact that the graphs, even then, showed that the temperature change was not following but rather was leading the CO2 change. Now we are trying to explain away T changing first invoking creative models. It appears the fundamental premise that CO2 causes warming is simply not supported by the paleo record. It may still be true, but what evidence do we have in the climate record that supports this hypothesis? Here is another question: If ice ages are on 100,000 year cycles because the Earth's orbit is more elongated on 100,000 year cycles why is the Earth's orbit so round now? Shouldn't it be nearing maximum excentricity?
    Response: The paleo record shows that Antarctic temperatures rise about ~800 years before CO2 and Greenland temperatures rise after the CO2 rise. The CO2 warming effect is necessary to explain both how weak orbital forcing can get us out of an ice age and also how an orbital forcing that affects only southern areas can spread through the globe. The paleo record also enables us to compare Co2 forcing with temperature change to calculate climate sensitivity.
  3. Provide error bars for the reconstructions, they tell quite a different story. Error bars are always necessary for meaningful interpreration of graphs like this.
    Response: Not sure what your point is - are you disputing that CO2 lags temperature? Monnin 2001 doesn't display error bars but quantifies the lag as around 800 ± 600 years:

    Caillon 2003 constrains the CO2 lag to 800 ± 200 years (but again, no error bars):


    Stott 2007 finds similar results - a CO2 lag of 1000 ± 300 years. Stott does include 200 year uncertainty on the benthic ages (in fact, Stott's graph includes everything but the kitchen sink):

  4. RE: response Are we sure about that? I am sure the original data from way back then was actually from Greenland ice cores, showing that temperature was rising before CO2, there as well as in the Antarctic. The Antarctic data was not yet around. If CO2 is rising first in Greenland than your hypothesis may be correct. I know CO2 is supposed to cause warming, and I think I understand why. But, the data still seems to scream corelation does not equal cause and effect.
    Response: The "original data from way back then" was probably Monnin 2001 which used the Dome Concordia ice core or Caillon 2003 which used the Vostok core - both are from Antarctica. Caillon concludes "The sequence of events during Termination III suggests that the CO2 increase lagged Antarctic deglacial warming by 800 ± 200 years and preceded the Northern Hemisphere deglaciation." More recently, Stott 2007 found that tropical temperatures lag southern warming by ~1000 years. I agree with you - correlation does not necessarily imply causation. But the ice core record is consistent with the warming effect of CO2 and explains both the degree of deglaciation and how a localised warming (increased insolation in the south) spread across the globe.
  5. No, the American Chemical Society Conference at which I noted this discrepency in a presented paper was in 1989 because I was in Grad Chemistry courses at the time, so I much doubt that it was 2001 or 2003 data. Other than that I hope you're right because otherwise 1)we are being led down the primrose path and 2) I am freezing my butt off up here. The presenter after having this error spotted by a lowly physics type grad student was not well recieved in the question session by the roomful of chemistry PhD's that were present. None the less his hypothesis that CO2 causes global warming is still widely discussed. :)
    Response: I would be surprised if ice core records were of sufficient resolution back in 1989 to clarify CO2 was lagging temperature - it's only been more recent ice core records that have been of high enough resolution to clarify the CO2 lag. Spencer Weart has published a great online history of ice core measurements that is well worth a read.

    Without knowing which older studies you're talking about, the most recent studies with up to date (and dare I say the most accurate) data (Monnin 2001, Caillon 2003) paint a similar picture of Southern warming -> CO2 rise -> Northern warming. But if you do know of any pertinent older papers, it'd be great if you could post the links here. And kudos for sticking it to the man :-)
  6. First of all, John, thanks for spending the time to create and maintain this site. I do realize it must be quite substantial time commitment. Although, it is not exactly neutral and is somewhat driven by your current opinion that GW is mostly due to anthropogenic CO2 emissions, the forums on the site are still one of the few places where we can have some more meaningful debates based on some scientific thinking and facts. So, in some respect the website is just like Churchill's quote on democracy (I think, he is the right man to quote since as you've correctly noticed many things in the GW debates on both sides are politically motivated consciously or not): "It has been said that democracy is the worst form of government except all the others that have been tried. " Of course there are another two quotes from him that I think very much apply to the GW debate: "The best argument against democracy is a five-minute conversation with the average voter. " & "A lie gets halfway around the world before the truth has a chance to get its pants on." Well, enogh quotes. On a more serious note, sadly enough, the whole field of Climate Science and Global Warming has become just like Finance. There is so much easy money flowing around that there is a great number of people with all sorts of backgrounds and levels of knowledge that have no relation to climate/physics or anything distinctly related (although by all means I am not saying we should only used established scientists' work as a guideline) that would make most outrageous claims/predictions with arbitrary certainty backed up many low-quality science booklets/papers/reports, posh presentations and heavy media support to streer more funds their way. In general, what I'm refering to is the so-called "press release science", unfortunately endemic to so many other fields besides climate. And finally, refering to the following quote from your bio section: "I'm still yet to meet a skeptic argument that is even vaguely convincing." I would suggest looking at some arguments that come from people that don't exactly fit the typical skeptic stereotype you describe, for example take a look at this list http://www.warwickhughes.com/hoyt/climate-change.htm and the following scorecard on the same website http://www.warwickhughes.com/hoyt/scorecard.htm
    Response: Love those quotes from Churchill. I must confess, I'm not particularly impressed with Warwich Hughes' climate change page which reads a lot like my Skeptic Arguments page (except mine is more comprehensive :-) His scorecard is interesting - if I have more time after maintaining this site (and responding to your comments), I'll give it a closer look.
  7. All of the conclusions you make in your rebuttal of the skeptics argument are valid only if the Milankovitch cycles (which as you note provide relatively weak forcing) are indeed the sole cause for this whole process. This seems like a big assumption to me and I don't think the science behind that has been settled. Most of people sort of automatically assume it, but there are number of scientists starting with John Imbrie (the guy who led the whole CLIMAP effort and published the infamous Ice Ages: Solving the Mystery) that say Milankovich cycles (Earth's orbital variations and such) seem to explain only 50-60% of the whole insolation variance. So, adjusting one's model only using insulation curves generated by orbital modeling as they do in the papers you mention seems unjustified to me. In essence, the authors of the above papers precondition themselves to look only for models that fits their believes (that are only limited to Milankovich cycles as a driver). There are many other additional hypothesis that also make sense even though their quantification is not as simple as just writing an orbital mechanics models which is all nice and simple with nice math functions. A major examples for additional forcings on these time scales include changes in the solar irradiation due to the long-term manifestations of the solar activity that are ought to be much bigger that what we've observed with satellites for the past 20 years (I refer to the TSI measurements) and are not only related to the TSI, but to things like the solar diameter, the solar wind and its interactions with Earth's magnetic field and many other process on the Sun and inside the Earth's core. Many things in the Solar System seem to work in synergy. So, that many cycles and superpositions of cycles of completely different physical processes external or internal to the Earth's climate have similar length and appear as if only one factor is at work when in fact there are several. I acknowledge that there is the Occam's razor that advocates simplicity, but I don't necesesarily think it is the best approach when we are considering Earth's climate and the near-Earth environment. So, I wasn't really asking about the lags, but whether we can even begin to consider that these lags mean anything. As far as the error bars, I was asking for the errors of the reconstruction models that create those curves on the graphs you show. The lines only follow the positions of the 50% quantile of each model output point but tell us nothing about its possible range (due to original measurement errors and other uncertainties).
    Response: There's still a lot to be worked out re the whole mechanism of deglaciations. For example, there are various theories on what causes the CO2 increase after temperature increase, the most accepted theory being degassing from the deep ocean. I've read of theories that the 100,000 year cycle is caused by solar variations rather than orbital changes although the Milankovitch theory seems to be more established and confirmed by at least several papers I've read. But the main point of this page is to answer the argument that "the CO2 lag debunks anthropogenic global warming". The current scientific understanding of the CO2 record (and the papers quoted in citing CO2 lag) state that the CO2 lag confirms the warming effect of well mixed atmospheric CO2.
  8. This discussion goes on as if the only evidence we have to decide whether CO2 has a warming effect is the paleoclimate data. That's a very, very narrow perspective. What everyone needs to appreciate is that we have fundamental physics and really, really extensive laboratory analysis of the absorption spectra gases alone and in combination, at all sorts of temperatures and pressures. You can look up the raw data on HITRAN at http://www.cfa.harvard.edu/hitran/ and you can read the conclusions drawn from this raw data about the greenhouse effect at, e.g. Ray Pierrehumbert's free access draft of his "Climate Book" http://geosci.uchicago.edu/~rtp1/ClimateBook/ClimateBook.html This is a university level physics textbook, not aimed at the general public. If you need more basic accounts of how GHGs absorb infrared, you can check out www.realclimate.org where Dr. Pierrehumbert is an active contributor. I'm linking to the academic text just to point out that belief in CO2 being a greenhouse gas, able to *cause* warming as well as respond to warming, is built on over a century of physics and lab analysis, and really, really NOT just on a few graphs taken from ice cores and put up on the screen by Al Gore. Way too much online discussion has treated this as if the whole line of reasoning rested solely on the paleo graphs and nothing else. To sum it up: temperature changes do indeed drive CO2 changes, *and vice versa*. The positive feedback between the two accounts for how ice age terminations get moving so much faster than the very gradual Milankovic forcings. The feedbacks don't run away forever because, for one, the carbon dissolved in the ocean is not infinite, the ice albedo feedback runs out when the glaciers and sea ice have retreated, etc.
    Response: Thanks, very pertinent comment and the link to Pierrehumbert's page is useful, particularly the latest draft of his upcoming Textbook on climate. Down the track, I hope to update this page fleshing out the point that CO2 warming is not dependent on ice core records but on fundamental physics (yet another on the to-do list :-)
  9. I have two questions regarding this "CO2 lags temperature" argument. You say that the Milankovitch cycle is to weak to explain the big temperature difference and that it requires strengthening through energy absorption by means of CO2. How do we know that CO2 is the main cause and not something else, e.g., the change in Earth's albedo due to ice and snowcover ? Also you say that it is not fully understood how oceans give up CO2. What about the reverse, the removal of CO2 from the atmosphere when the Milankovitch cycle drives the temperature down ? Hope you have time to answer these.
  10. This idea that Malinkovitch needs CO2 feedback to do the job is clearly false. Since it relies on a WATTS-PER-SQUARE-METRE model which is a light-and-air-only model. If we allow for the accumulation and decumulation of joules in the planet and the oceans then it is the factor of TIME ALONE that needs to be taken into account and not this sideshow of CO2-feedback. We ought to be looking at a model which relies on STRATA AND HEAT BUDGETS. Not on WPSM. The WPSM model is a first draught that people came up with looking through telescopes. They couldn't see anything else so they imagined the whole thing could be determined by spectroscopy alone. But what we are talking about is the accumulation and decumulation of joules. Another thing that these WPSM models fail to take into account is the distance travelled through the atmosphere. The stratosphere ends about 50km up in the air. But that doesn't mean that a "ray" of light hitting the stratosphere has to travel only 50km. This is only true at the equator and at high noon. And this is important since the climate guys talk as if only greenhouse gas and ozone can attenuate this radiation. But all gasses inhibit radiation and a lot of this radiation has a very long way to go. Not taking into account of this and failing to think about ACCUMULATION and DECUMULATION of joules over many decades and years is a fatal flaw to these climate models.
  11. The problem with your comment birdbrainscan is that its already part of the armchair hypothesis so it can scarcely be included as evidence. The armchair thinking goes like this: If the colour of CO2 is such that it absorbs a little bit of the infrared spectrum then industrial-CO2-release ought to substantially warm things up on a global scale. Now the fact is that there isn't a scrap of evidence for this thesis. One-step inductive armchair inferences don't always turn out to be true. This one has failed all experimental tests. CO2 might well COOL the temperature of the earth in the long run. An armchair inference with billions of dollars behind it is still an armchair inference.
  12. Actually, Milankovitch hypothesis requires much more than WATTS_PER_SQUARE_METRE. The thing is that GLOBAL year-average solar flux does not change more than 0.1% during those cycles. Climatologists like to plot amplitude of "Milankovitch forcing" at one spot on Earth - at latitude 65N, which does not represent in any way or form the GLOBAL change in incoming radiation. I find this very misleading, especially when the whole talk is about GLOBAL warming. For the Milankovitch to have any effect on Earth, climatologists have to use a hidden assumption that Nothern Hemishpere controls the whole climate by having some sort of "rectifier effect". So far this rectifier has not been identified, and ony speculations exist that it has something to do with more land in NH than in SH, and maybe with Arctic ice having contact with land (Greenland etc).
  13. birdbrainscan wrote: "What everyone needs to appreciate is that we have fundamental physics and really, really extensive laboratory analysis of the absorption spectra gases alone and in combination, at all sorts of temperatures and pressures. You can look up the raw data on HITRAN at http://www.cfa.harvard.edu/hitran/ and you can read the conclusions drawn from this raw data about the greenhouse effect at, e.g. Ray Pierrehumbert's free access draft of his "Climate Book"" I am familiar with this book, it is really a university level physics textbook, under which I mean "entry level". One needs to realize that the explanation of GH effect inherently relies upon so-called "atmospheric lapse rate", to link the height of "effective emission layer" with surface temperatures. One really needs to realize that so-called "lapse rate" must be an average of all atmospheric structures and weather patterns over the whole globe and from ground up to the whole troposphere. One needs to realize that the atmospheric patterns include turbulent boundary layer, global circulation patterns (Hadley, Ferrel, and polar cells), jet streams, hurricanes and other tropical depressions. More importantly, the lapse rate is strongly affected by moisture, which, in turn, is strongly affected by sea temperature. What is more important is that the moisture tends to condense into clouds under certain atmospheric/aerosols conditions. The laps rate ("moisture adiabate") tends to DECREASE with higher moisture content providing a negative feedback. Clouds also provide negative feedback by reducing insolation. Needless to say that all of listed processes occur under strong non-isotropic turbulent conditions, and are way beyond the reach of any direct computer modeling. As result, either a hand-made parameterizations have to be used, or parameterizations of experimental data. Given the spatio-temporal complexity of atmospheric patterns, data from few weather balloons cannot be seriously considered as a good representation of average atmospheric structure. The reference to HITRAN/MODTRAN serves no purpose for this discussion since the code uses a pre-selected fixed MODEL of atmospheric profile. In MODTRAN, there are 84 different models for atmospheric profiles; each gives different result for amount of OLR and surface temperature. So, what would be your selection of models across the globe to include into a global greenhouse model? How objective or subjective it could be? As you see, the "fundamental physics" of absorption spectra or two-stream Schwarzschild equations are not all the sophistications you need to build a model of GH effect and calculate its amplitude.
  14. Tekhasski, you sure can pile on the jargon but the basic argument is not affected by what you or GMB are saying: sunlight comes in with a small amount of long-wavelength infrared (so does not get absorbed so much by CO2, methane, NO2, etc.), gets absorbed, then tries to head out again as blackbody radiation, which is mostly in the long-infrared range and is strongly absorbed by the accumulating CO2, methane, NO2, etc. in the atmosphere. No matter what the atmosphere is doing, if you add heat you get warming. You don't need a PhD to understand that. The main outcome of the above research is to suggest that heating of the planet causes more carbon dioxide in the atmosphere (with some delay). We already know that increased carbon dioxide causes warming, so this means that the warming will be amplified by increased CO2 emission from the oceans. GMB, everything you are saying has already been taken into account in the current climate models. Climatologists have been out of their armchairs for decades now; where are you sitting?
  15. Nice personal attack Farmer but it added nothing to this discussion. Your Comment "No matter what the atmosphere is doing, if you add heat you get warming. You don't need a PhD to understand that." makes no sense in this context. There is no heat being added unless you are talking about variation in Solar output. The warming is supposed to be the result of Earth holding on to more heat and releasing it more slowly. The Earth is not a Black body radiator, but that doesn't even matter because CO2 isn't a big absorber of black body radiation at this temperature. Or this comment "We already know that increased carbon dioxide causes warming, so this means that the warming will be amplified by increased CO2 emission from the oceans." This is simply not correct. We think it should work this way, we have some theoretical reason to believe it should. But, it has rather badly failed the experimental test so far. In addition if your assertion were true this would be a positive feedback loop that is clearly not present in the Earth's paleo record. If the climate really worked this way the Earth would be vastly warmer than it is and would never have had any ice ages because once the CO2 got high, as it has many times in the past, it would cause a warming spiral. The idea that you can "take into account" in models affects that we simply don't understand is absolutely silly.
  16. What if CO2 is meaningless? The graphs show measured concentrations of CO2 for the past how many years? Modern direct measurement of gases using a bench and means of interpreting past CO2 are not going to give the same results. Even trapped gas pockets in ice suffer from osmotic action. Past climates are mostly guesswork. As Wondering Aloud points out "it would cause a warming spiral." but that did not happen. The graph shows 450K years, ALL of which were within the oscillations of an ice age. We assume that this is an interglacial period. What if it isn't? How do we know that the planet isn't returning to Earth Normal or Earth Mean temperature? The fact is, we don't know.
  17. Quietman 'How do we know that the planet isn't returning to Earth Normal or Earth Mean temperature?' Are you seriously proposing a new theory - that the Earth has a memory? Do you have a mechanism? Or a 'setting' to which this 'memory' is adjusted? Is there any peer-reviewed literature as a source? CO2 clearly cannot be meaningless, it has long been known to be infra-red active and remains resident in the atmosphere for a long time, from memory ~33% remains after one hundred years and 20% after a thousand years, but there is a long tail meaning that some will remain for tens of thousands of years, causing significant warming. Inevitably, this alone will affect the net heat balance of the Earth. Of course CO2 is NOT the only GHG and as temperature increases, so does the water vapour, which acts as a positive feedback amplification. But while water vapour is a stronger GHG than CO2, it does not remain in the atmosphere for long. The source of the excess CO2 is explained by the shifting isotopic ratio of the atmospheric carbon. From this it is known to originate from non-biological sources - i.e. fossil carbon: coal, oil & gas. Regarding CO2, the Mauna Loa CO2 readings overlap ice core data during the period 1959-1978. The CO2 readings obtained match perfectly during the overlap. AFAIK, the oldest ice cores are ~ 1000 ky old. Here's one with the source data and references - so that YOU can check its authenticity! Image:Carbon_History_and_Flux_Rev_png and Image:Carbon_Dioxide_400kyr_Rev_png Sorry, but I couldn't locate a version in the p/r literature. I've seen them before, it's just that I couldn't find any. We are clearly performing a global experiment and no-one can be absolutely certain as to the precise outcome, but if it does all go dreadfully wrong, the trouble is that we are INSIDE the test-tube! It would therefore be a really good idea to heed the scientists and stop trying to light the Bunsen burner! Let's cut-back on the use of fossil-fuels, through improved technology, energy conservation & efficiency and renewable energy generation. The economic argument that carbon taxes will damage the US economy is bogus. “As Congress prepares to debate new legislation to address the threat of climate change, opponents claim that the costs of adopting the leading proposals would be ruinous to the U.S. economy. The world’s leading economists who have studied the issue say that’s wrong” http://www.cis.yale.edu/opa/newsr/08-03-19-02.all.html We owe it to the next generation and generations to come to hand over the Earth in the same condition as it was when we received it. Sadly, this will not be the case.

    Response:

    Note - globalwarmingart.com usually cites his sources if you want to track down the original studies where he get the data from.

  18. Quietman, Another thought: Those graphs in my previous post show a rapid upward acceleration of CO2 in recent decades, one that matches the accelerated warming. If what you suggest were true: namely that Earth is [your hypothesis] 'returning' to 'normal', then one would expect an ever decreasing asymptotic approach. Instead, what is seen in the second graph is a rapid departure upwards from the upper bound historic values - the exact reverse of what is expected. Image:Carbon_Dioxide_400kyr_Rev_png Oops! your theory is shot full of holes!

  19. During a glacial period (between interglacials), the graph shows many changes in temperature direction, trend up, followed by trend down, followed by trend up, followed by trend down and so on for many cycles. If the theory is that a trend up causes atmospheric carbon dioxide to increase which adds to warming, why, with atmospheric carbon dioxide level higher than it had been during the temperature increase, would the temperature stop going up and go down instead?
  20. ScaredAmoeba 1. I said "what IF. (food for thought). There is a CO2 feedback effect and a contribution by AGW regardless. 2. Not one single graph that I have seen matched the rise in CO2 to the rise in temperature without some serious manipulation. Show me a graph of rising surface temperaturs that is based solely on rural weather stations and a chart of CO2 with a matching slope. You won't be able to.
  21. ScaredAmoeba Re: "The economic argument that carbon taxes will damage the US economy is bogus." This is an unknown. It could go either way depending on exactly who is taxed and how much as well as who is hired and how many. If we are heavily taxed to pay for green products made in India we loose. If we are lightly taxed for production within the US by non-illegals we win. Can you assure us that the latter will be the case rather than the former?
  22. Dan Pangburn Very astute observation. Another look at those graphs will also show that temperatures fell dramatically when CO2 was at it's peak.
  23. In johns skeptic of the week article it says "Moreover, the Earth has experienced no discernible temperature increase since 1998, nearly nine years ago. Remember, too, that the atmosphere is approaching CO2 saturation--after which more CO2 will have no added climate forcing power." This I don't understand. Is this at all credible?
  24. lest we forget. http://www.geocraft.com/WVFossils/Carboniferous_climate.html
  25. If you are refering to the saturation idea, credible yes, possible yes, right? I just don't know. It does look to me like most of the forcing predicted from a doubling of CO2 should have already occured unless there is a big time lag in the system that is un accounted for. this is why I asked on other threads if there was a lag of perhaps 30 years we didn't have identified. Without it we are down to only those large, but not now apparent, feedback numbers or a relatively small total signal on the order of 1 C.

1  2  3  4  5  6  7  8  9  10  11  12  13  14  15  16  17  18  19  20  Next

Post a Comment

Political, off-topic or ad hominem comments will be deleted. Comments Policy...

You need to be logged in to post a comment. Login via the left margin or if you're new, register here.

Link to this page


The Consensus Project Website

THE ESCALATOR

(free to republish)


© Copyright 2024 John Cook
Home | Translations | About Us | Privacy | Contact Us