


 Arguments


What's the link between cosmic rays and climate change?
What the science says...
| Select a level... |
 Basic
Basic
|
 Intermediate
|
 Advanced
| ||||
|
Cosmic ray counts have increased over the past 50 years, so if they do influence global temperatures, they are having a cooling effect. |
|||||||
It's cosmic rays
"When the Sun is active, its magnetic field is better at shielding us against the cosmic rays coming from outer space, before they reach our planet. By regulating the Earth’s cloud cover, the Sun can turn the temperature up and down. ... As the Sun’s magnetism doubled in strength during the 20th century, this natural mechanism may be responsible for a large part of global warming seen then." (Henrik Svensmark)
At a glance
Space may often be regarded as dark, cold, empty and lifeless but there is plenty going on out there, including the streams of high-energy particles that whizz around at close to the speed of light. These are galactic cosmic rays, discovered by Austrian-American physicist Victor Hess in 1912. Galactic cosmic rays is a catch-all term that includes high-energy particles with sources ranging from the Sun to remnants of ancient supernovae – exploded stars – in other galaxies.
When cosmic rays hit the top of our atmosphere, a highly crowded environment compared to deep space, they interact with the atoms up there producing showers of charged particles known as ions. The ions then head on down towards the surface, where they make up just over ten percent of our typical yearly radiation dose. That's approximately equivalent to three chest x-rays.
The Solar wind protects Earth from cosmic rays and Earth's strong magnetic field in turn shields us from both. In this respect we are fortunate: if you want to find out what happens to a planet that has lost its strong magnetic field, go and take a look at Mars. As a result of these planetary defences, the amount of cosmic rays reaching the lower atmosphere and surface of Earth is minimised.
Direct recording of the cosmic ray flux has been possible since the beginning of the satellite era, since the satellites can carry particle detectors. We therefore have over a half-century worth of data on the changes in the intensity of the flux.
The idea that changes in the cosmic ray flux could drive the observed global warming has a small but determined number of fans. In short, their hypothesis suggests that the ions produced by cosmic rays can 'seed' clouds. That means more cloudiness - and clouds reflect sunlight, reducing the energy reaching Earth's surface. So, it imagines, if there are fewer cosmic rays reaching Earth, there will be fewer clouds, more sunlight reaching the Earth's surface, and thus more global warming. In a sense, this is a variant of the “It's the Sun” argument, because the cosmic ray flux falls when the Sun is in the active phase of its 11-year sunspot cycle and the Solar wind is typically stronger.
In 2017, the Cosmics Leaving Outdoor Droplets (CLOUD) experiment reported in. It had been created to test the link between cosmic rays and climate and was specifically looking for any connection between ions resulting from cosmic rays and cloud-seeding. The CLOUD experiment succeeded in unlocking many of the mysteries of cloud formation and growth in our atmosphere. That greatly improved our understanding of human influences on climate. In particular the study concluded that the effect of changes in cosmic ray flux intensity on the cloud condensation process is small. To quote its authors, it is, "unlikely to be comparable to the effect of large variations in natural primary aerosol emissions" - things like volcanic eruptions, wildfires and so on. So no, cosmic rays do not have much of an effect at all.
Please use this form to provide feedback about this new "At a glance" section. Read a more technical version below or dig deeper via the tabs above!
Further details
It was at one time hypothesised that galactic cosmic rays (GCRs) may play a part in helping form clouds. A leading proponent of this idea was Danish scientist Henrik Svensmark. If this hypothesis were correct, an increase in the GCR flux, creating an increase in cloud condensation nuclei, would lead to more cloud cover in our lower atmosphere, reflecting more sunlight and resulting in a global cooling effect. Conversely, a decrease in GCR flux would lead to a reduction in cloudiness, warming the planet by letting more sunlight through.
People look at new hypotheses in order to test them. In order to calculate the maximum possible role of GCRs in recent warming, global temperatures have been compared to variations in the GCR flux, as measured by particle detectors aboard satellites and by neutron monitors at the Earth's surface. We'll take a look at some of these studies, for there are many, mostly reaching the same conclusion but with improvements in methodology through time, as always tends to occur in scientific research.
A 2003 paper observed that while there was some correlation between GCR levels and temperature prior to 1970, the correlation breaks down sharply after that point. The analysis concluded that "between 1970 and 1985 the cosmic ray flux, although still behaving similarly to the temperature, in fact lags it and cannot be the cause of its rise. Thus changes in the cosmic ray flux cannot be responsible for more than 15% of the temperature increase" (Krivova & Solanki 2003).
Figure 1: Reconstructed cosmic radiation (solid line before 1952) and directly observed cosmic radiation (solid line after 1952) compared to global temperature (dotted line). All curves have been smoothed by an 11 year running mean (Krivova & Solanki 2003).
Another analysis from the 2000s scrutinises the link between GCRs and cloud cover and finds several discrepancies. As GCR flux shows greater variation in magnitude in high latitudes, one would expect larger changes in cloud cover in polar regions. This, the authors found, was not observed. They also examined the aftermath of the nuclear reactor accident at Chernobyl: the thinking was that if the GCR hypothesis was correct then since the Chernobyl site was a strong source of ionising radiation, some effect on cloud formation might be expected. They found none (Sloan & Wolfendale 2008).
The chance to soundly test the Svensmark hypothesis came up again in a particularly extended Solar minimum (between solar cycles 23 and 24, 2008-2010). This minimum was associated with a record high level of GCR flux, but at the same time, there was a record low level of cloudiness in the lower atmosphere – the bottom ~10 kilometres of the atmosphere where most of the weather occurs. If the GCR/cloud seeding idea was correct, the reverse should have been the case (Agee et al. 2012; fig. 2). Also in 2012, an important review paper, covering the past 35 years of research, concluded, “it is clear that there is no robust evidence of a widespread link between the cosmic ray flux and clouds.” (Laken et al. 2012).
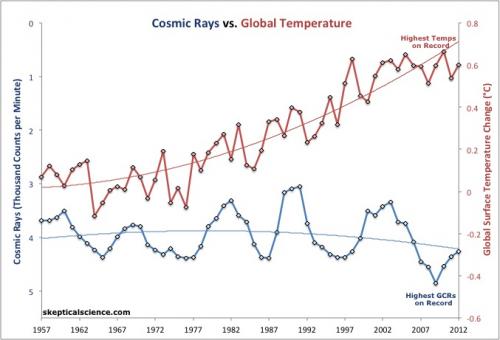
Figure 2: Annual average GCR counts per minute (blue - note that numbers decrease going up the left vertical axis, because lower GCRs should mean higher temperatures) from the Neutron Monitor Database vs. annual average global surface temperature (red, right vertical axis) from NOAA NCDC, both with second order polynomial fits.
More recently, the Cosmics Leaving Outdoor Droplets (CLOUD) experiment, created to systematically test the link between GCRs and climate, reported in. It had been specifically looking for any connection between ions resulting from GCRs and aerosol nucleation and thus cloud condensation nuclei and cloud formation. The CLOUD experiment succeeded in unlocking many of the mysteries of nucleation and cloud growth in our atmosphere, greatly improving our understanding of human influences on climate. In particular the study concluded that the effect of changes in GCR flux intensity on the cloud condensation process is small and “unlikely to be comparable to the effect of large variations in natural primary aerosol emissions” - things like volcanic eruptions, wildfires etc (Gordon et al. 2017).
This story illustrates nicely how science proceeds. Someone thinks up a hypothesis and it is repeatedly put to the test and is found to be wanting. In turn that leads to further research and important discoveries, providing progressively better understanding into the details of how certain processes work – atmospheric ones in this case. In recent years, Svensmark has been associated with the likes of the Global Warming Policy Foundation, the Heartland Institute and other such organisations who prefer their own version of reality (details at DeSmog). Meanwhile, the science has moved on and left him behind.
Update June 17, 2023 - Based on feedback received, added a concluding paragraph to the at-a-glance section.
Last updated on 18 June 2023 by John Mason. View Archives


Climate Myth...