


 Arguments
Software
Resources
Comments
The Consensus Project
Translations
About
Support
Arguments
Software
Resources
Comments
The Consensus Project
Translations
About
Support
![]()
![]()
![]()
![]()
![]()
![]()
![]()
![]()
![]()
![]()


![]()


Latest Posts
- Skeptical Science New Research for Week #24 2026
- June update: Help still needed to get translations prepared for our website relaunch!
- How many people does heat actually kill?
- Check out the brand-new hurricane ‘cone of uncertainty’ graphics arriving this season
- 2026 SkS Weekly Climate Change & Global Warming News Roundup #23
- SkS Housekeeping: Updating the Comments Policy
- Skeptical Science New Research for Week #23 2026
- Nobody knows the future of energy
- Fact brief - Do electric vehicles almost always have a lower carbon footprint than gasoline-powered cars?
- Solar, wind, and EVs have knocked out a doomsday climate scenario
- 2026 SkS Weekly Climate Change & Global Warming News Roundup #22
- Skeptical Science New Research for Week #22 2026
- The next era of Atlantic hurricanes could be far more destructive
- On the death of RCP8.5
- RCP8.5 Update
- 2026 SkS Weekly Climate Change & Global Warming News Roundup #21
- Skeptical Science New Research for Week #21 2026
- What’s a ‘super El Niño’? And other El Niño questions, answered
- Fact brief - Does electromagnetic radiation from wind turbines pose a threat to human health?
- Five things you need to know about El Niño’s likely comeback
- 2026 SkS Weekly Climate Change & Global Warming News Roundup #20
- Skeptical Science New Research for Week #20 2026
- Higher warming predictions for 2026 and 2027
- A look back at ‘An Inconvenient Truth,’ 20 years later
- Two videos about the Atlantic Meriodonal Overturning Circulation (AMOC)
- 2026 SkS Weekly Climate Change & Global Warming News Roundup #19
- EGU2026 - Five days of virtual learning
- Skeptical Science New Research for Week #19 2026
- Climate Adam - Climate Change is Destroying Lives... Now
- EGU2026 - Presentation about the Skeptical Science Experiment
Comment Search Results
Search for albedo
Comments matching the search albedo:
- Human-caused climate change is unmistakably distinct from Earth’s natural climate variability
MA Rodger at 22:44 PM on 23 April, 2026Eric (skeptic) @7,
I was a little taken aback in your comment by you saying in the context of 'slow feedbacks' that "feedback increases CO2." That is not the normal understanding of 'slow feedbacks' which are the main difference between ECS & ESS.
Folk are usually rather vague about the nature of the things dividing ESS from ECS but carbon feedbacks isn't what I find mentioned (as per here). It's usually the changing vegetation & ice cover that gets the mention, along with deep ocean warming. Melting ice/permafrost and oceans will have an associated thermal-lag element but I can't see that aspect being very great. This suggests the big part of Δforcing remaining out-of-equilibrium after ECS arrives is albedo changes.
I see two points of note - (1) The value of ESS & (2) Its relevance to the AGW situation.
(1) The main evidence supporting a significant ESS is of course the temperature and the CO2 records. And those don't come with labels showing the Δforcing involved in ESS. However, they do show ESS significantly above the usual range of ECS values (ECS =+2.0ºC to +4.5ºC) although there remains the "fat tail" in ECS analyses which sits yet higher.
The accounts of ESS have in the past put ESS = 1.5 x ECS or ESS = 2 x ECS, whatever that means number-wise. The analysis is usually applied to pre-ice age data although the OP above has also used mainly ice-age data-points and spliced them onto Judd et al (2024). (The OP figures show the Cenozoic data points of Judd et al below 700ppm CO2. So not shown is the seven Cenozoic points at higher CO2 levels. If these high points were missing also from the OP's analysis, it may explain the discrepancy between the Judd ESS [+7.7ºC] and the OP ESS [+8.2ºC].)
Judd et al (2024) Fig 4b
Of course, the ESS analyses are dependent on these temperature and CO2 reconstructions. And there is significant variation here as Judd et al Fig 4a below and Rae et al (2021) fig 7 below-again demonstrate. (At 50My bp, Judd et al have CO2 at 1,200ppm & Temp at 33ºC while Rae et al have CO2 at 1,500ppm & Temp at 27ºC which would make a significant difference in caculating ESS.)
Judd et al (2024) Fig 4a
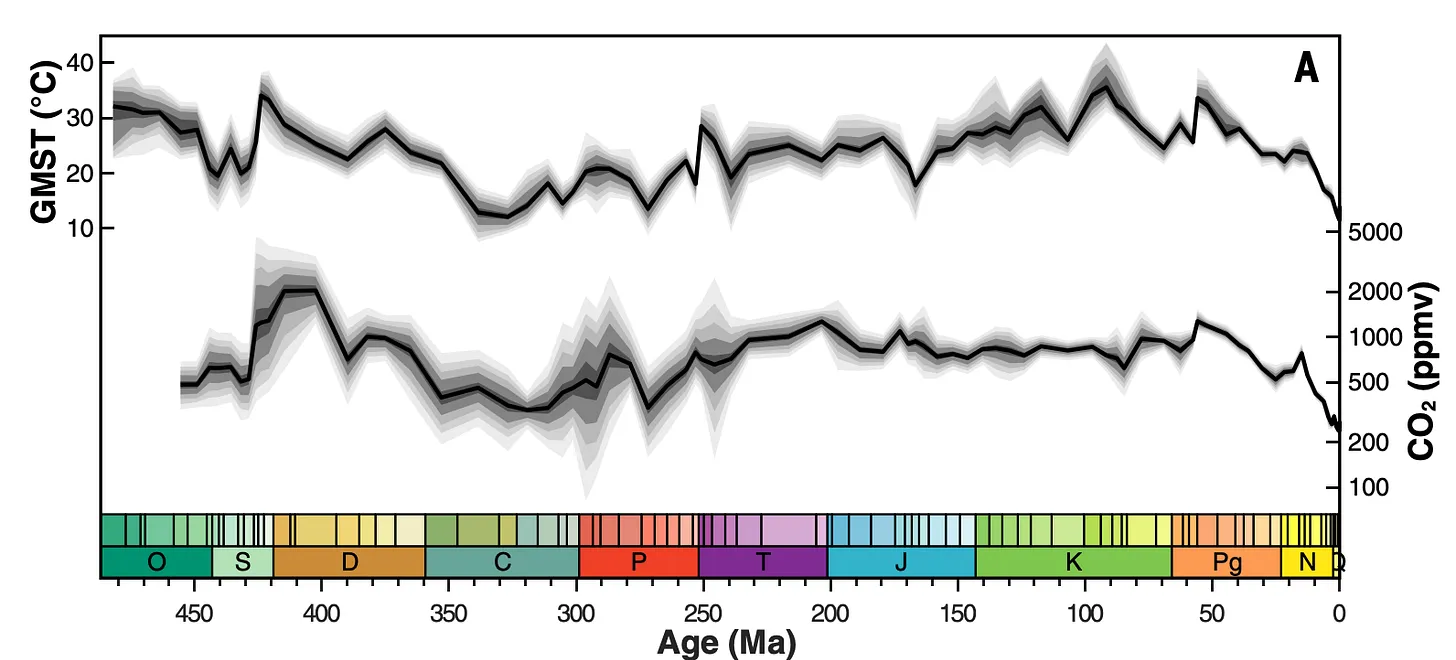
Rae et al (2021) Fig 6

So what value ESS? Presumably somewhere +5ºC to +9ºC.
But does it matter?
(2) Both ECS and ESS warming assumes the CO2 levels (or equivalent) are maintained until the respective equilibrium is reached. Give the draw-down of CO2 over the millennium will amount to roughly half the CO2 level increase of today, that maintenance of CO2 levels over the millennium would require a lot of CO2 coming from somewhere. The carbon feedbacks aren't that big. (See this CarbonBrief article which suggests natural feedbacks could amount to perhaps 15% or so.) If CO2 levels will not be maintained over centuries post-net-zero, that suggests that even ECS lacks relevance, although beyond the millennium and into ESS-territory there is no significant CO2 draw-down.
Of course, with AGW rapidly approaching +1.5ºC and the emissions still up where they shouldn't be, I don't think any reassurance given about AGW not reaching ESS levels or ECS levels (ECS levels which still may be higher than the 'usual range' due to the "fat tail"): any such perceived reassurance should not be allowed to lessen the efforts to rapidly cut emissions and reduce the bad effects of AGW we are creating for the future. (And note that the less-dreadful IPCC scenarios also include net-negative anthropogenic emissions post-net-zero to add to the natural draw-down.) - Human-caused climate change is unmistakably distinct from Earth’s natural climate variability
rkcannon at 17:14 PM on 18 April, 2026Rebuttal: Systems Analysis vs. Circular Reasoning
Subject: Response to Moderator Comments regarding Bhatta (2024) and Marks-Peterson (2026)
While the ad hominem labels—"amateur" and "naive"—provide a look into the moderator’s temperament, they do not address the physical and statistical discrepancies presented. As a Professional Engineer (PE), I prefer to evaluate the Transfer Functions of a system rather than the consensus of the "grown-ups."
1. On Circular Reasoning and System Gain
The moderator admits that the Nature paper (Marks-Peterson et al., 2026) requires "important contributions" from albedo and ocean circulation to explain a 2.5°C cooling while CO2 remained stable.
The Logic: To claim CO2 is the "key" control knob, only to demote it to a "passenger" whenever the data shows the planet cooling without its help, is circular reasoning.
The Math: Since the early 1900s, human CO2 emissions have increased by over 1,700%. If a seventeen-fold increase in the supposed "driver" results in a warming rate statistically similar to 1910, a rational systems analysis concludes the system is insensitive to that input.
2. The Failure of "Aerosol Masking"
The argument that mid-century cooling was "masked" by aerosols fails the spatial and modern test.
The Discrepancy: If industrial aerosols were a primary "cooling shield," China—with the world’s highest coal-related aerosol loading—should have been a global cool spot. Instead, China has warmed faster than the global average.
The Conclusion: You cannot invoke a "masking shield" to explain the 1940s cooling while ignoring its failure to stop warming in modern Asia. This is curve-fitting, not physics.
3. The Measured Driver: Albedo and the CERES Data
The moderator’s focus on 21-year surface trends ignores the most robust data set we have: the CERES satellite record.
The Data: Since 2000, CERES has measured a 0.8% drop in Earth’s albedo. This change in reflectivity has added roughly 2.7 W/m2 to the Earth's energy budget—effectively 100% of the warming forcing that the IPCC attributes to CO2 over the last 250 years.
4. The Missing "Fingerprint" and UHI Bias
If CO2 were the driver, the laws of physics dictate a "Tropical Hot Spot" in the upper troposphere. Decades of radiosonde and satellite data show this fingerprint is missing. The warming we do see is surface-based and highly correlated with Urban Heat Island (UHI) contamination. When you "homogenize" data by forcing rural stations to match urban trends, you aren't measuring global climate; you're measuring the encroachment of asphalt on thermometers.
Conclusion
Rational skepticism demands that models reconcile with empirical history. If the planet cooled 2.5°C with no change in CO2 in the Pliocene, and cooled for 40 years during a CO2 surge in the 20th century, the "Control Knob" theory is functionally dead. It is fascinating to watch the "Immune System" of this forum react; the Killer T-cells are working overtime to neutralize empirical data that looks like a "foreign invader" to the dogma. Nature doesn't care about your PhD or your moderation policy if your math is wrong. - Why Science Communication Fails: How to Break Down Misleading Arguments and Inoculate Against Misinformation
Just Dean at 20:01 PM on 16 March, 2026The issue is straightforward. You're treating CO₂ as a dependent variable from various sources and sinks, rather than as the forcing function that drives temperature. The radiative physics doesn't care how CO₂ got into the atmosphere. A molecule from volcanoes or the ocean and a molecule from a coal plant have identical greenhouse properties.
The ice age data illustrate this precisely. During glacial cycles, orbital forcing, ice-albedo feedback, and ocean circulation drove CO₂ and temperature through completely different cycles than today — yet those data points land on exactly the same CO₂-temperature relationship as the deep-time Cenozoic record. Different mechanisms, same curve. That's not a coincidence. That's the physics.
In this news release about the Science article, Tierney states this directly:
"Carbon dioxide is the dominant control on global temperatures across geological time. When CO₂ is low, the temperature is cold; when CO₂ is high, the temperature is warm.”
“We found that carbon dioxide and temperature are not only really closely related but related in the same way across 485 million years."
The slope of the modern instrumental record is much shallower than the Judd curve — not because the physics is different, but because the ocean's enormous thermal inertia means it absorbs heat slowly over decades to centuries. Nature moved CO₂ over millennia. We've done the equivalent in 175 years. The lag between the green trajectory and the equilibrium curve in the diagram is that difference in rates made visible.
- Why Science Communication Fails: How to Break Down Misleading Arguments and Inoculate Against Misinformation
Eric (skeptic) at 09:23 AM on 16 March, 2026Just Dean, thanks for the explanation and updated version of your essay. I signed up for a Science account and read through Judd 2024. They explain geography thusly:
the change in the proportion of land to ocean area relative to today (29, 84). The impact of these paleogeographic changes on planetary energy balance can be treated as a forcing (ΔFgeog) (29, 81). In the Ordovician, subaerially exposed continents constituted only ~15% of the total surface area of the planet (compared to ~30% today), with the value increasing quasi-linearly across the Paleozoic (fig. S12). This results in an overall lower surface albedo for the Paleozoic and thus a positive forcing.
My question to you is are they claiming that geography, which they simplify to a forcing, is solely a temperature effect in the context of equilibrium? We agree that geography drives the CO2 and temperature to different sections of the curve, but the key question is how. I may be mistaken but I believe your main claim is that ocean circulation and temperarture changes affecting CO2 are a key determinant of equilibrium, minus current manmade CO2 which you would consider similar to examples in Judd such as Siberian traps and PETM.
Do you believe that current ocean circulation is unimportant (or perhaps I should say non-consequential) for long term equilibrium given present day geography? Or perhaps as some suggest, deepwater formation will slow with global warming? If so then we can perhaps reach a point close to the Judd curve as the long term feedbacks add more sequestered CO2 to atmosphere overwhelming the slowing uptake.
However I believe we are currently in a cold geography evidenced by the million year ice age, reaching CO2 starvation levels during full glaciation. The primary measurement of cold geography is ocean temperature sustained by cold deepwater formation but warmed from above by manmade warming. AI tells me the ocean's warming rate is 2.2 mC per year or 0.22C per century. This affects sea level of course but also CO2 absorption modulated by vertical ocean temperature profile.
In short, it appears that Judd's simplified (perhaps oversimplified) view of geographic forcing treats that forcing as negative with present day geography. Do you believe that would preclude reaching the corresponding temperature on the Judd curve?
- Why Science Communication Fails: How to Break Down Misleading Arguments and Inoculate Against Misinformation
Eric (skeptic) at 09:19 AM on 15 March, 2026Just Dean, the dashed black line in the diagram in justdean.substack.com/p/how-one-diagram-reveals-the-climate comes from geographic changes that drive both temperatuire and CO2. CO2 is an amplifier of temperature and temperature is an amplifier of CO2, but geography dictates global temperature. Prominent examples are Antarctica cooling with opening of Drake Passage www.researchgate.net/publication/256822123_Influence_of_the_opening_of_the_Drake_Passage_on_the_Cenozoic_Antarctic_Ice_Sheet_A_modeling_approach Arctic glaciation with closing of Isthmus of Panama: www.sciencedirect.com/science/article/pii/S0012821X05004048 There are others.
The steepness of the purple dots is due to the combination of CO2 and temperature mutual feedback added to albedo feedback from the forming and retreat of the continental ice sheets.
So we are left with the green and red lines. In the text they assert that CO2 stays high centuries after net zero (" even 700 years after emissions cease, roughly 85–99 percent of peak warming persists. Atmospheric CO₂ remains at more than half its peak value") I beat up the AI to get current numbers:
"Thus, the ocean absorbs ~9.2 Gt of CO₂ per year from the ~1,191 Gt excess currently in the atmosphere." or 0.77% per year. That 0.77% per year will drop as the excess atmospheric CO2 drops and the ocean saturates, but it suggests less than a century to drop to half, not multiple centuries. All hypothetical of course, but it also suggests we can start to see a drop before net zero.
- Venus doesn't have a runaway greenhouse effect
nick51 at 00:21 AM on 5 January, 2026Venus main statistics of the planet.
Size 12,104km
Gravity 8.87 m/s2
Atmosphere co2 96.5%
Clouds circle the planet sulfuric acid
Lapse rate 10.47 K/km
Rotational speed 6.52 km/h
Axis inclination 3 degrees
Energy received from the sun 2,613 W/m2
Super rotational winds (SRW) 100 m/s
Height of sulphuric acid clouds 40 km to 75 km
Direction of rotation of the planet Clock wise
Direction of SRW ACW
Sulphuric acid clouds
clouds are made of 75–96% sulfuric acid.
These are formed by photochemical reactions in the upper atmosphere, involving solar light acting on carbon dioxide, sulfur dioxide (SO2), and water vapor, create the sulfuric acid.
These sulphuric acid clouds drive the climate on Venus.
Properties of sulphuric clouds
Albedo effect is between 0.75 to 0.80, which means they reflect 75-80% of the suns energy
Suns energy is 2,613 W/m2, approximately 2,000 W/m2 reflected back into space.
This leaves 613 W/m2 do drive Venus climate.
Sulphuric acid clouds absorb energy in the ultra violet (UV) which is about 10% of the suns energy and the remaining 20% of visible light left which enters the sulphuric acid cloud, 10% of this is absorbed
UV 450 nm, with a sharp edge around 400 nm. The iron-bearing mineral phases, such as rhomboclase and acid ferric sulfate, dissolved within the sulfuric acid droplets are the likely candidates for this absorption
No IR is absorbed by these clouds.
So the final figures are:-
Suns energy = 2613 W/m2
Reflected by the albedo effect = 2000 W/m2
Absorbed by the UV = 11% = 287 W/m2
Absorbed by the Visible Light = 11% = total = 577 W/m2.
This leaves 2,613 - 2,577 = 36 W/ms arriving at the surface (12 W/m2. Average) This means there can be no greenhouse effect. It is enough to get a faint haze glow on the surface.
So this 577 W/m2 drives the super rotational wind in the Venetian atmosphere.
This heats the clouds, rising the cloud tops to 75km in height.
The clouds are heated on the sunny side most, due to the slow rotation, the super heated clouds move to the cooler atmosphere, 2nd law of thermodynamics, which is in an anti clockwise direction. This causes this super rotational winds of 100 m/s to circle the planet, in a narrow band around the equator, where they lose some energy as the wind circle the planet and spread out towards the poles.
This doesn’t change during Venus year as its axis is only 3 degrees, so there is little or no change as it orbits the sun.
As these SRW approach the dark side the winds increase again as the dark side clouds are lower, and colder, this causes extra turbulence as the hot winds encounter the cooler atmosphere. This also causes more of the winds to migrate towards the poles, combined with the downwelling of the winds. This is shown by the pictures taken by the Japanese orbiter Akatsuki.
The SRW then approach the day side again where they receive extra energy from the sun and continue its journey to where the sun is directly overhead, receiving the 577 W/m2, where the cycle starts all over again.
What happens to the atmosphere as it down wells towards the planets surface.
The atmosphere has its driving force for this rotation now (the super rotation winds down welling):
Adiabatic lapse rate 10.47 c/km (Gravity rating on the specific heat capacity of the atmosphere)
We have the heights that this happens at. (Sulphuric acid clouds between 40-75km) and the temperatures. Two key points are 43km temperature is most earth like 14c, and planets surface temperature 465c.
We also have the adiabatic charts for Venus to check the results
The temperature profile of Venus is shown below:-
Height (km) Temperature (C) Pressure (1 atm)
0 465 93
10. 360 71
20 255 50
30 151 18
40. 49 7
43 14 1
50 -59 -15
60 -164 -37
70 -269 -58
As can bee seen, it explains the pressure on Venus - its driven by the temperature.
- Ice age predicted in the 70s
angusmac at 13:35 PM on 3 December, 2025BL@173, 177 and 178
Before responding to your challenge, I note that the points you raise would not normally be part of the guidelines that a publication would provide for an independent reviewer. Instead, they appear to be points derived by someone who has studied the paper at university and wishes to arrive at preconceived conclusions regarding my ability to carry out an independent review.
I now reply as follows.
Why did he do the work?
- He developed a one-dimensional climate model based on a steady-state energy balance approach to analyse temperature and ice distribution by latitude.
- The study was motivated by the need to understand how variations in solar radiation and atmospheric properties influence global surface temperature and ice coverage, with particular focus on the roles of solar input, surface albedo, and meridional heat transport.
- His work represents an early application of energy balance modelling to demonstrate how changes in climate variables can drive significant shifts in Earth’s temperature and ice extent
What aspects of climate science does he attempt to address?
The paper addresses some aspects of climate science, including:
- The planetary energy budget, focusing on the balance between absorbed solar radiation and outgoing longwave radiation by latitude.
- The role of ice–albedo feedback and the existence of multiple stable climate states, demonstrating how changes in high-latitude ice extent can lead to either warmer climates or near-complete ice coverage.
What part of his paper represents "original work"?
He appears to have made several original contributions, including:
- Developing a zonally averaged, one-dimensional energy balance model structured by latitude, which calculates mean annual sea-level surface temperature for each latitude band. The model incorporates key parameters such as solar radiation, surface albedo, infrared emission, and meridional heat transport.
- Conducting systematic numerical experiments by varying parameters such as the solar constant, albedo, and transport coefficients. This enabled the exploration of climate sensitivity and the identification of distinct equilibrium states, including both warmer climates and scenarios approaching global glaciation.
What part of his paper provides useful guidance to future work in climate science?
Part 2 “The Model” and Part 3 “Applications” provide particularly useful guidance for future climate science research for two main reasons:
- Conceptual: These sections demonstrate that even highly simplified energy-balance models can produce multiple stable climate states. This insight has motivated more detailed investigations into climate feedback mechanisms, such as ice–albedo feedback, and their role in glacial–interglacial transitions.
- Methodological: The modelling framework introduced is straightforward and transparent and has been adopted in subsequent research. It enabled systematic evaluation of climate sensitivity, heat capacity, and meridional heat transport.
Interestingly, Sellers (1973) is classified as neutral, and Sellers (1974) is classified as warming by both PCF-08 and me.
- At a glance - Is the CO2 effect saturated?
MA Rodger at 02:42 AM on 29 January, 2025sychodefender @30,
Another take on answering you questioning....
As you say, the climate forcing from mankind's CO2 emissions does cause feedbacks, these most evident in the water cycle, humidity, cloud cover, cloud height (this last the least understood). But there is no "self-sustaining loop" or even any significant CO2 emissions consequent from mankind's emissions as a feedback. There is thus no need for a natural mechanism to prevent run-away global warming.
You mention CO2 in this "natural mechanism" and CO2 has operated naturally as the major control knob for the climate through the eons. (Calling CO2 the 'control knob' should not be in any way controiversial.) The ancient Earth's climate is a bit of a mystery as the sun was less energetic in the early solar system (and from its weak beginning will continue to strengthen) and with no means of knowing the ancient atmospheric composition the 'faint sun paradox' remains unexplained. More recently, over the last 500 million years the temperature record is reasonably well known. (Through that time the sun has brightened by about 5% which is a climate forcing equivalent to roughly a quadrupling of CO2.)
There are a few very-long-term mechanisms at work altering the carbon available for the carbon cycle (in the atmosphere, bliosphere and ocean waters, these being in equilibrium for multi-millenial periods).
Taking CO2 from the atmosphere into rocks as coal was a major process in warm climates for early parts of this 500My period as back then fungi were not well developed enough to decompose plants which could thus be buried and turned to coal. Modern fungi prevents such significant coal formation.
A second mechanism is the water-weathering of mountain rocks which allows the formation of carboniferous rock in sea water. When the 700Gt(C) humanity has emitted so far has reachen equilibrium between biosphere, ocean and atmosphere (which takes abut a millenium), the remaining 25% of our emissions in the atmosphere (assuming only natural processes) will require rock-weathering to be extracted, this taking tens of millenia to complete. At a similar rate of action, the formation of the Himalayas and associated increase in rock-weathering has seen the atmospheric CO2 content drop over the last 50 million years and with it the cooling of the planet.
Once this deposit of carbon into the geology occurs, it is volcanism that works to return it to the carbon cycle. Thus when the planet is so cold that there is no rain to weather rocks and no significant biosphere at work, the volcanic activity will slowly pump CO2 back into the atmosphere restoring the level of greenhouse effect. The emissions are very small relative to mankind's emissions (perhaps about 1%).
You mention Milankovitch cycles which have been waggling the planet's temperature for the past 3 million years (initially as a 40ky cycle, then 100ky).
The Milankovitch cycles are not so strong in themselves but are amplified by positive feedbacks. Within these cycles, CO2 is part of that positive feedback (increasing the size of the wobbles) with carbon being locked away under frozen land and in cooling oceans under increased sea ice. However the big driver of recent ice ages is albedo not CO2.
You mention the logarithmic relationship between CO2 levels and climate forcing. This is an empirical relationship for concentrations in the range 150ppm to 1300ppm. As Zhong & Haig (2013) fig 6 shows, beyond 1300ppm the forcings increase faster than logarithmic. By then, of course, an increase in the CO2 consentrations would need to be four-times an increase to add the same extra forcing. But we don't want to be creating a world with 1300ppm. It would have already been under a forcing of 8.4Wm^-2 from the extra CO2, perhaps global warming of +7ºC.
- Models are unreliable
Bob Loblaw at 06:48 AM on 13 November, 2024A further follow-up to Syme_Minitrue's post @ 1332, where (s)he finishes with the statement:
A climate model probably contains hundreds of model parameters. Can you adjust them so that you get a good fit with historical data, and good predictive capability at a significantly lower, or even completely excluded CO2-dependency?
Let's say we wanted to run a climate model over the historical period (the last century) in a manner that "excluded CO2-dependency". How on earth (pun intended) would we do that, with a physically-based climate model?
- We could decide to remove the part of the model that says CO2 absorbs (and emits) IR radiation.
- Unfortunately, that would make our model run far too cold for the entire period, since the 19th century CO2 level of 280-300ppm is a significant source of heating that helps keep us in a stable climate of roughly 15C (as opposed to -18C that we'd expect with no atmosphere)
- This would defy the physics of IR absorption by CO2 that is easily demonstrated in a laboratory.
- We could arbitrarily decide that CO2 remain at 300ppm.
- This would be a useful experiment, and is probably what was done for the graph I included in comment 1334...
- ...but this defies the actual physical measurements of rising CO2, so it can hardly be argued that this model experiment can explain actual temperature observations.
- We could run the model so that the first 300ppm of CO2 absorbs IR radiation, but the CO2 content above 300ppm does not.
- This makes no physical sense, since all CO2 molecules act the same. We can't use "special pleading" for some.
- And once we remove the effects of rising CO2, how would we change other model calculations to compensate for the lack of CO2 warming? i.e., what would "fit" the model to the observed increase in temperatures?
- We could arbitrarily increase solar input...
- ...but this defies our physical measurements of solar irradiance.
- We could arbitrarily change cloud cover
- but we have no physical measurements that would support this.
- We could arbitrarily change surface albedo, vegetation, etc...
- but we run into the same problem: we have physical measurements of the properties of these factors, and it's hard to justify using values that are different from the known measured values.
In comment 1334, I linked to a review I did of a paper that claimed to be able to fit recent temperature trends with a model that showed a small CO2 effect. I said it was badly flawed.
- The paper in question did pretty much what Syme_Minitrue expressed concern about: doing a statistical fit to a large number of parameters, many of which defied any plausible physical meaning.
- As long as your parameters can perform all sorts of non-physical gymnastics in an effort to fit the data, you can easily come up with some rather odd results.
- When your model parameters are limited to physically-measurable values, "fitting" gets a lot harder.
Physically-based models in climate science generally get "fit" by trying to get the physics right.
- 4 Hiroshima bombs worth of heat per second
MA Rodger at 21:02 PM on 16 October, 2024One Planet Only Forever @55,
The CO2 level in the atmosphere has been accelerating through the decades and indeed the resulting climate forcing has also been accelerating. The total GHG forcing is less 'acceleraty' due to the cuts in CFC emissions back in the 1990s. The table below shows the average annual increase in CO2 forcing and total GHG forcing (WM^-2) from the NOAA AGGI.
1980s ... ... 0.026 ... ... 0.047
1990s ... ... 0.023 ... ... 0.033
2000s ... ... 0.028 ... ... 0.033
2010s ... ... 0.034 ... ... 0.040
2020s ... ... 0.032 ... ... 0.040
The big omission is the negative forcings from aerosols and a lot of ink has been spilt addressing that particular omission. (For instance, the marine regs of 2020 have often been mentioned as a possible cause of the "bananas" temperatures seen from the back half of 2023.) While it is a big omission, I'm not of the view that it will not prove an essential ingredient in understanding the EEI and 'bomb increase' measured both by CERES and in OHC.
There are plenty of rabbit-holes to jump down when tring to explain the CERES data. (I note recently a couple of the 'usual suspects' Nikolov & Zeller
trying to argue that it is the 'bomb increase' that has been forcing the whole of AGW.)
The 'bomb increase' is a net result from (1) a warming world which is thus leaking more IR into space and thus lowering EEI and (2), a less reflective world due to a reducing albedo increasing EEI. These both present reasonably good correlations with global temperature (1) -1.53Wm^-2/ºC and (2) +2.81Wm^-2/ºC with thus a net increase in EEI running +1.2Wm^-2/ºC.

What makes me sceptical about any very significant role of aerosol-reduction in the albedo numbers is both that there is the significant correlation with temperature wobbles (which suggests the reduced albedo results from climate feedbacks) and that the peiod where that albedo-temperature correlation looks less than convincing (2007-14 which are those dreaded hiatus years) doesn't coincide with any explained event (like the marine emissions regs) where we would expect something to be seen. [I posted a pink graphic of these correlations 5th December 2023, which you can scroll down-to here]
There remains the thorny question of whhat lies behind these correlations.
Back-of-envelope calculations appear to suggest something must be at work beyond simple AGW. The AGGI numbers above suggest the 2000-20 additional forcing totals +0.73WM^-2 which is roughly equal to the EEI increase through the period. But with SAT also rising +0.6ºC through the period, increases in AGGI and in EEI should not at all be equal.
If they are actual correlations with global temperature, what was happening pre-2000?
Do they otherwise include some wobble or some aerosol-effect?
Another rabbit hole is that while the rate of change in temperature (acceleration) over short periods fits with the wobbles in EEI, the increasing EEI does not fit at all well with the longer term temperature accelerations.
So there is a lot of rabbit holes and to-date no sensible-sounding explanation.
- CO2 effect is saturated
NavierStokes at 18:40 PM on 16 October, 2024Eclectic@718:
Whoever wrote the Basic Rebuttal doesn't understand the greenhouse effect at all. They seem to believe that the GHG molecules absorb IR radiation directly from the incoming sunlight instead of the upwelling terrestrial IR from the surface as indicated in the following quote:
Sunshine consists mostly of ultraviolet, visible light and infra-red photons. Objects warmed by the sun then re-emit energy photons at infra-red wavelengths. Like other greenhouse gases, CO2 has the ability to absorb infra-red photons.
Remember that 99%+ of the incoming EMR from the sun is in the visible spectrum and is absorbed by the earth (except of course for what is reflected as albedo). The earth then re-emits this absorbed energy as a 288-294 deg. K blackbody at the surface. We then get the greenhouse effect when the GHG molecules absorb this upward-bound IR and convert it into thermal energy in some manner. Therefore, this Basic Rebuttal badly needs to be rewritten and my question still stands.
[Snip]
- On Hens, Eggs, Temperature and CO2
MA Rodger at 19:27 PM on 4 September, 2024rkcannon @16.
Assuming Mark Johnson @18 is correct and you do refer to the graphic posted @6 (which seems entirely sensible), your question has still not been properly addressed.
And that presumably is to ask why the CO2 fluctuations through recent ice ages (180ppm to 280ppm) are associated with large temperature fluctuations (10ºC peak-to-peak) but the larger recent anthropogenic CO2 (280ppm to 420ppm) doesn't result in any commensurate temperature increase in the graph.
There are a number of factors to consider.
(1) The forcing from changes in CO2 is logarithmic, so the recent CO2 forcing would be slightly smaller than the ice age forcing (2.2Wm^-2 as opposed to 2.4Wm^-2).
(2) It takes time for the temperature to react to an imposed forcing so only about two-thirds of any CO2-forced increase would have occurred in the decades of man-made warming so far.
(3) The ice age CO2 forcing was not the major forcing through ice ages. The change in albedo due to the shrinking ice sheets and the rising oceans would be double the CO2 forcing. Other factors like methane and dust were also in play. (The orbital forcing that triggers ice ages is very minor.) Increasing CO2 contributed perhaps a third of the ice age forcings.
(4) The temperatures being plotted are from the EPIC ice core data and thus Antarctic temperatures which wobbled tiwce as much as global temperatures through the ice ages. (Note the modern CO2 value has been added, marked with an asterisk. Grafting on the modern EPIC temperature record would be difficult, and would not show much as the instrument record is more wobble than rise.)
So taking (1) to (4) into account, the 10ºC ice age cycle in the graphic @6 would be a little smaller, say 90% (1) then a third off (2) then two-thirds off (3) and finally halved (4). So the global temperature should be very roughly something like [10ºC x 0.9 x 0.67 x 0.33 x 0.5 =] +1ºC which is pretty-much what we see globally today. - Are climate models overestimating warming?
Bob Loblaw at 00:57 AM on 21 August, 2024ubrew12:
As MA Rodger says, climate models do include soil moisture and surface albedo. The surface component of these models will also include vegetation cover, as this strongly influences the evapotranspiration rates. This is an essential part of the climate modelling process, as the surface energy balance has major implications in partitioning energy within the climate system.
The surface energy balance involves:
- solar radiation reaching the surface,
- IR radiation emitted from the atmosphere to the surface,
- IR radiation emitted from the surface to the atmosphere,
- energy transported as "sensible" heat (temperature) between the surface and the atmosphere (on average, upward)
- energy transported as "latent" heat (evapotranspiration, condensation) between the surface and the atmosphere (on average, upward, representing water movement from the surface to the atmosphere)
- energy transported via the conduction of heat between the surface and the subsurface (soil or water).
The concept of a "surface energy balance" is based on the idea that the surface is an infinitely thin plane that separates the atmosphere and the earth (land/sea). With no thickness, it has no mass, so it cannot store energy. There must be an energy balance that sums to zero for all energy flows to or from the surface. In this concept, the land itself is the sub-surface (which can store energy).
NCAR has a good web page describing their models. The overall climate model is built from several components: atmosphere, land, ice, etc. For the land component, the docuimentation table of contents lists (under "special cases") things like "Running the prognostic crop model" and "Running with irrigation".
So yes, it is possible to run these models with various aspects of surface conditions. Whether anyone has is another question - and getting appropriate historical surface data to do so accurately is an even bigger question.
- Are climate models overestimating warming?
MA Rodger at 02:08 AM on 20 August, 2024ubrew12 @3,
The models do certainly calculate soil moisture and account for surface albedo. I don't know how accurately this is done. Presumably, if it were done badly enough to affect the modelling generally, such a failing would be quickly corrected.
You ask this because you wonder whether the 'Dust Bowl' could be the reason for these Corn Belt states having seen such low warming rates 1973-2022. Perhaps they began the period with warming already in place.
The GISTEMP web site easily allows such ideas to be tested. Over the full 1880-2022 period of data, the same low warming trend is still seen across the eastern USA thro' summer months on a global map. It is actually there all year and strongest in Autumn,weakest in Winter & Spring. So using this region to be representative of AGW, it is simply a dishonest cherry-pick (which is what 'Derwood Turnip' is doing). And as a region testing the climate models, as shown in the global map above in the OP, it is again a dishonest cherry-pick (which is what Roy Spencer is doing), although Montana/North Dakota would give a more dramatic result, indeed the most dramatic result.
- The science isn't settled
Bob Loblaw at 05:54 AM on 11 May, 2024To follow up on MA Rodger's comment (#106) on TWFA's comment (#104) that presents data from Delague and Bard (2010).
- MAR has provided a link to a free copy of the paper.
- The journal page is here,
- That journal page includes a link to Supplementary data, which is a CSV file that includes their TSI reconstruction (discussed, but not graphed or presented in the paper).
With respect to Delague and Bard's TSI reconstruction, it is worth noting:
- It provides values on a roughly 10-year interval.
- The first value is for the year 695.
- The last value is for 1982.
- The graph presented by TWFA says "5-per running mean", so it is a smoothed graph where each point represents roughly 50 years.
- The difference between the maximum and minimum in Delague and Bard's TSI data is 1.2 W/m2. You need to divide by 4 to compare it to the CO2 forcing, to get 0.3 W/m2. You need to then adjust for the earth's albedo, since 30% of TSI is reflected, further reducing the absorbed radiation to 0.21 W/m2.
We can graph the original data (no smoothing) for the period 1900 to present. It looks like this:

Question for TWFA:
How much of the warming observed since 1900 do you think is accounted for by the changes in TSI, as indicated by your source (Delague and Bard)?
- The science isn't settled
Eclectic at 11:39 AM on 10 May, 2024TWFA @104 :
(Thanks ~ good timing ~ I was about to leave the house.)
Your question would be better expressed, not as "nature bringing temperature up stopped [in 1850]" . . . but rather as : nature reducing the greater downward pressure (by about 1850). Of course, from a Milankovitch-cycle aspect, we would expect the slow gradual line of temperature decline . . . to continue for about 15,000 years, until "the ice really hits the fan" . . . ;-) . . . and the world plunges deep into the next Glacial Age (a genuine Ice Age).
[ So there was no rush for humans to burn all their coal to keep the next glaciation at bay. ]
TWFA, the forcing from the sun ~ is only one factor in the big picture. And as best I currently understand it, the Little Ice Age was caused by two roughly equal factors. Those factors being (A) the Grand Solar Minima [Spoerer, Maunder, etc] . . . and [B] a period of greater frequency of major volcanic eruptions [stratospheric particulates causing cooling ]. A Grand Solar Minimum, by itself, is rather weak in its cooling effect.
The major factors causing climate change are : Albedo, Sun, Particulates, and CO2 (currently!)
Yeah, it's complicated. But the scientists have been doing good work in getting an understanding of it.
Fair to say : the science is settled enough for our current practical purposes. It is the politics of how to tackle our self-made problem . . . which is the difficult part to carry out efficiently.
- Climate's changed before
Eclectic at 11:22 AM on 21 April, 2024Spooky @899 , you should not really be surprised ~ since the OP article is referring to Global temperature changes.
Not to the local rapid changes in the boreal icesheet region (e.g. Denmark, Greenland, Alaska : during the last glacial age) as shown in the Bolling-Allerod warming and in the briefer Dansgaard-Oeschger events. Those local northern regions are affected by "sudden" changes in local oceanic currents ~ both smaller & larger (e.g. the AMOC). But that has little effect on the global scale, except when it involves a massive event like the melting of the Laurentide Ice Sheet (i.e. the Younger Dryas).
In India, the Indian Monsoons (to which you allude) show much fluctuation resulting from very small alterations in local temperatures & winds (winds which may bring more oxygen18-rich water) . . . even in the absence of a 30-year climate change.
For global temperature changes, there need to be global-scale changes in albedo / insolation / particulates / or greenhouse gasses.
- Climate - the Movie: a hot mess of (c)old myths!
scaddenp at 06:38 AM on 3 April, 2024Two dog. The OHC content data in red comes from the Argo array. You can find reasonable description here. The old pentadecadal data is ship-based and has much bigger error bars. I cant immediately find the paper that determined the accuracy of the Argo data but if interested I am sure I dig it out.
On interannual and to some extent the decadal scales, variations in surface temperature are strongly influenced by ocean-atmosphere heat exchange, but I think you would agree that the increasing OHC rules that out as cause of global warming?
"I did also read that the warming effect of CO2 decreases as its concentration increases so the warming is expected to reduce over time. Is there any truth in that?"
Sort of - there is a square law. If radiation increase from 200-400 is say 4W/m2, then you have to increase from CO2 from 400 to 800ppm to get 8W/m2. However, that doesnt translate directly into "warming" because of feedbacks. Water vapour is powerful greenhouse gas and its concentration in the atmosphere is directly related to temperature. Also as temperature rises, albedo from ice decreases so less radiation is reflected back. Worse, over century level scales, all that ocean heat reduces the ability of the ocean to absorb CO2. From memory, half of emissions are currently being absorbed there. Hot enough and the oceans de-gas. These are the calculation which have to go into those climate models.
Which brings us to natural sources. Geothermal heat and waste heat are insignificant so would you agree that the only natural source of that extra heat would be the sun? Now impact of sun on temperature has multiple components that climate models take into account. These are:
1/ variations in energy emitted from the sun.
2/ screening by aerosols (natural or manmade). Important in 20th century variations you see.
3/ changes in albedo (especially ice and high cloud)
4/ The concentration of greenhouse gases in the atmosphere.
Now climate scientist would say that changes to all of those can account for all past natural climate change using known physics. They would also say very high confidence that 1/ to 3/ are not a significant part of current climate change (you can see the exact amount for each calculated in the IPCC report). Why are they confident? If you were climate scientist investigating those factors, what would you want to measure to investigate there effects? Seriously, think about that and how you might do such investigations.
Is it possible there is something we dont understand at play? Of course, but there is no evidence for other factors. You can explain past and present climate change with known figures so trying to invoke the unknown seems to be clutching at straws.
- Climate - the Movie: a hot mess of (c)old myths!
Doug Bostrom at 03:27 AM on 28 March, 2024There's a lot of "inside baseball" language in play involved with meta-climate discussion, Two Dog.
"Climate change denial" seems to have become shorthand for "climate science denial" and "climate change denial." Both phenomena have rich factual basis.
There is still to this day a shrinking population of folks who don't believe Earth's climate and climate-mediated systems are changing at what current and paleoclimate data indicate are unusually rapid rates. This would be "climate change denial" as labeled on the tin.
Meanwhile another population are focused on what is still slightly more fertile ground, that of calling into question the scientific community's (geophysicists in this domain, specifically) competence of understanding the controlling processes of Earth's climate. This is "climate science denial.'
While often uttered in a context of emotional heat and frustration, "climate change denial" and "climate science denial" are not fundamentally emotive but rather are descriptive language attached to facts.
Both species of denial face what will prove an insurmountable common challenge: consilience. By example, biologists are observing phenonena that would demand answers from geophysicists focused on Earth's climate systems. As it happens, geophysicists already had substantially useful explanations for what biologists are seeing in the natural world. This is retail level consilience. One of the purposes of our weekly climate-related academic research listing is to help people to see consilience on anthropogenic climate change, understand the overall perspective of experts having connection to matters influenced by climate— which includes numerous disciplines not directly connected with geophysics.
if one follows climate research output and its present concerns, it's plain to see we're quite far past the "huge unknowns" stage with respect to the geophysics of climate. The accidental perception of "huge unknowns" in climate geophysics is a mark of the success of climate science deniers in the public square. It's a product of what we might clinically term "synthetic ignorance," a feeling of not knowing what we actually know perfectly well enough, thanks to calculated practice in public messaging.
Is every stripe on every graph we see 100% about us? No. Certainly the climate change we see today is influenced by "natural variation," on the time scale we're concerned with a matter of dithering around a mean. However, numerous and broad secular trends we're seeing not only in direct geophysical attributes of climate but myriad other features having climate as a major controlling variable find reliable explanation and predictive power in one naturally evolved feature of Earth, namely the planet's human population and culture— and how we've powered ourselves by liberation of energy from fossil fuels. We can hypothesize elaborate mechanisms for system-wide changes of the type we're seeing but scientific parsimony asks "why invent where no invention is necessary?" The dominant rationale for such invention seems to lie outsiide of scientific practice.
As to greening, greening enthusiasts should note that this phenomenon is accompanied by loss of albedo for a variety of reasons. Loss of albedo is not something we need at this juncture. It's also notable that for "climate change deniers" of all stripes, greening is a powerful contradiction of the basis of preferred beliefs.
- Greenhouse effect has been falsified
MA Rodger at 18:48 PM on 15 December, 2023Is it healthy to pander to crazy sock-puppet nonsense by discussing 'what-if' ideas when the sock-puppet is wedded to a 'surely it is' idea?
The idea that the existing GHE can be attributed to 50% water vapour, 25% cloud and this forced by 25% CO2 which thus attributes cloud as a warming agent does overlook the full impact of cloud on planetray albedo and which could be used to calculate cloud as a cooling agent.
The sock-puppet @176 suggests a cloudless Earth would see albedo drop from 30% to 15%, the latter being roughly the Moon's effective albedo which would suggest the Moon woud have an average temperature of 267K. However the measured temperature of the Moon averages at 201K and this because the Moon rotation is so slow that it sheds massive amounts of energy during its day with Moon equatorial temperatures reaching 390K.
Of course, the Earth spins fast enough to prevent such a large duirnal range and if there had never been CO2 to form a GHE, there would never have been oceans to slow it down from its 4 hour day back when the Earth-Moon began.
But unlike the Moon, there is a lot of water on Earth and the albedo of ice is high. That is reduced by the dust which would cover the ice on a GHE-free Earth but albedo would remain high, and perhaps higher than today. De Vrese et al (2021) suggests the albedo of 'meteoric ice' is 65% which, if the Earth's albedo, would indicate a 250K Earth and a GHE of 38K.
- Greenhouse effect has been falsified
ClimateTruthSeeker at 16:43 PM on 14 December, 2023The often-quoted 255K black body temperature of the earth is wrong and the 33K GHE is overstated. This is due to the albedo being too high in the calculation which is meant to show what the temperature would be if the earth had no atmosphere at all.
However, the calculation falsely uses the albedo when an atmosphere exists, completely ignoring the fact that if there is no atmosphere, there are no clouds. Using a conservative estimate that 50% of albedo is attributed to clouds, this decreases the albedo from 0.3 to 0.15 resulting in a black body temperature of approximately 268K, reducing the GHE to 20K.
However, there would be further impacts on ice and water, and a more realistic albedo when there is no atmosphere at all is 10%, as others have postulated. This leads to a black body temperature of approximately 271K (-2.15C) and a theorized GHE effect of 17K, just over half of what was previously estimated.
- Skeptical Science New Research for Week #49 2023
nigelj at 04:35 AM on 10 December, 2023MS Sweet. Good information to know.
"I note that Dr. Hansen has long held an Earth System Sensitivity of 6 C. The IPCC consensus has been 3C"
The IPCC number is "equilibrium climate sensitivity", a different thing from earth system sensativity as below. Making it hard to compare the two numbers.
"By definition, equilibrium climate sensitivity does not include feedbacks that take millennia to emerge, such as long-term changes in Earth's albedo because of changes in ice sheets and vegetation. It includes the slow response of the deep oceans' warming, which also takes millennia, and so ECS fails to reflect the actual future warming that would occur if CO2 is stabilized at double pre-industrial values.[38] Earth system sensitivity (ESS) incorporates the effects of these slower feedback loops, such as the change in Earth's albedo from the melting of large continental ice sheets, which covered much of the Northern Hemisphere during the Last Glacial Maximum and still cover Greenland and Antarctica)...."
(Climate sensitivity, wikipedia)
We will probably never know any of these numbers for sure because you can't put the planet in the laboratory. (Although I think paleo studies like the one you posted have a lot of credibility - because they are based on real world conditions). But IMHO that uncertainty is not necessarily a crucial problem. Current rates of warming are bad and are having very visible effects, and huge implicatrion in the short to medium term, and so whatever the level of climate sensitivity using whatever definition, we clearly have a huge problem.
- 2023 SkS Weekly Climate Change & Global Warming News Roundup #44
MA Rodger at 21:23 PM on 8 November, 2023This Hansen et al (2023) paper was pre-published back in January and did result in a bit of discussion here at SkS. And there was supposed to be a second paper specifically on SLR.
Hansen et al rattle through a pile of stuff, some of which I would agree has merit and some which I find difficult to accept, some very difficult. The high ECS is one of the very difficult ones. (Perhaps the point that the big part of the difference between high ECS values and the IPCC's most likely value ECS=3ºC, [something the IPCC tend not to identify preferring a range of values as in AR6 Fig1.16]: the difference is due to warming that follows the forcing by a century or more. That time-lag is one of the reasons the ECS estimates are not better nailed down and still has its 'fat tail' . It also would give mankind a fighting chance of dodging it.)
SLR is certainly a big subject of concern. It is a long-term problem, multi-century. The equilibrium position for a +1.5ºC is perhaps 3m and the threat of setting Greenland into unstoppable meltdown at higher levels of warming would triple that. I do tend to get irked by the SLR by 2100 being the sole subject of discussion.
Of course, predictions of that 2100 SLR being massive (5m) is one of Hansen's foibles. The worry is, I think, specific to Antarctica and it is a genuine worry. But to achieve 5m by 2100 would need massive numbers of icebergs bobbing around in the southern oceans and result in global cooling. And there is also the awkward point for climatologists that increased snowfall over Greenland/Antarctica could provide a significant reversal of SLR.
The final issue raised by Hansen et al (2023) is the impact of the reduction of aerosols from our falling SO2 emissions. Quantifying the impact of SO2 emissions is not entirely global a thing, so emissions in, say, China may induce more cooling than, say, Europe. But that said, global SO2 emissions data I identify tends to be way out-of-date. The most recent is this one from a Green Peace publication. This shows the reduction in SO2 is well in hand over the last decade. And the CERES data showing EEI does show a drop in albedo (yellow trace in the 2nd graphic) through that period. My own view of these CERES numbers is that they include a lot of bog-standard AGW-feedback-at-work.

There is also the last 5 months of crazy global temperatures (so post-dating Hansen et al's pre-publication). I don't see these as being sign of things to come. I'd suggest it is casued by the January 2022 Hunga Tonga eruption which threw both SO2 and H2O into the stratosphere, the cooling SO2 dropping out leaving the warming H2O to do its thing before eventually it too dropping out.
And the in-the-pipeline thing. Climatology is/has-been saying we need to halve CO2 emissions b 2030, and following the point of net zero in mid century we enter a century-plus of net-negative CO2 emissions. That would see all emissions 2008 to year-of-net-zero removed by human hand and stored away safely. So that is on top of the natural draw-down of CO2 into the oceans. And if we don't do that, it will not be from ignorance of the situation.
- John F. Clauser: the latest climate science-denying physicist
Rob Honeycutt at 02:09 AM on 29 October, 2023TWFA... "The climate would and will continue warming at this phase even if man never existed..."
Here, yet again, you literally have no clue what you're talking about but present something as if it were fact.
If you look at the paleo record it is very clear that the Earth was entering a cooling phase due to slow changes in orbital forcings. It's only when humans started burning fossil fuels and substantially altering surface albedo (deforestation, farming, etc) that the planet abruptly changed and entered a steep warming trend.
- CO2 effect is saturated
MA Rodger at 18:47 PM on 27 October, 2023chuck22 @709,
I would suggest it is more that Venus shows what a thick atmosphere does to climate while Mars shows it for a thin atmosphere. Both have an atmosphere comprising about 95% CO2. Yet the surface of Mars has zero GH-warming while on Venus it is an impressive +407ºC.
Venus has about 80% of the solar warning relative to Earth, this due to its higher albedo (left hand graphic below) which more than compensates for being closer to the Sun. Thus the "naked planet" temperature for Venus (230K) is lower that Earth's (254K). Venus has a 92 bar atmosphere and the clouds in such a thick atmosphere are a major insulation mechanism preventing IR across the entire spectrum from escaping to space from anywhere near the surface.

Zhong & Haig (2013) show (their Fig6b) that the climate forcing on Earth from CO2 (which at 389ppm provides with feedbacks GH-warming of +34ºC) would be perhaps trebled by CO2 levels up near the 90% mark, (Fig6b shows the direct forcing up to ~30% CO2) an unrealistically high level, but it does show that additional CO2 does not "saturate".
- Cranky Uncle: a game building resilience against climate misinformation
Eclectic at 23:41 PM on 16 June, 2023Peppers @9 ~ I raise my hand to "second" Philippe's point. Please help!
I must be a Cranky Uncle of low I.Q. , for I am failing to grasp the points which you are (or may be) making.
Why are you mentioning "concluding" and "science" as (possibly) excluding each other? And why undertake a scientific process, if not to reach a conclusion? Is confirmatory scientific investigation somehow invalid? (And please do not bring Sartre into your explanation!)
Chaos and the Butterfly Effect ~ how connected with Milgram's 6 degrees? If this is a Mixed Metaphor of some sort, then it is too subtle for me . . . so please explain !
[ Unlike the changes of weather, the changes of climate are not chaotic. Cloud cover & albedo changes are not chaotic, even though difficult to compute precisely. ]
- Cranky Uncle: a game building resilience against climate misinformation
peppers at 21:19 PM on 16 June, 2023I have an ex wife who a year or so later, was 'fond' of me. I have an adversion to the word now!
How do we reconcile these 2 premises:
1. Characterizing another who does not conclude at this juncture, as; someone who is fond of misunderstanding climate science matters.
2. Oxford Dictionary; The systematic study of the structure and behavior of the physical and natural world through observation, experimentation, and the testing of theories against the evidence obtained (the definition of Science bearing no mention of conclusion, and also applies the inference that a conclusion would be an impediment to the process of science).
I dont think you mean to have a conflict with others still observing and testing theories.
Milgram's Six Degrees of Separation famously said that a butterfly can flap its wings in Peking, and in Central Park, you get rain instead of sunshine. As opposed to being settled, you cannot operate a scientific understanding without first not knowing. If you are steering to a conclusion, thats not science nor even close.
To add a bit more meat to the above poetic insertion, I'd like to add 2 observations. On November 22nd 2022 the world hit 8 billion, having increased exactly at the pace and curve of the famous hockey stick graph from 1 billion in the same time span. For a discussion about the planets ability to handle such a change, the clouds and atmosphere contain all the energy and ability to moderate that. However it is impossible to model any of it.
I say we need to observe, experiment and add theories to our incomplete knowledge of our world and of the solar system. More warmth, more moisture, more clouds, more albedo, etc.
Theories do not require immediate citations or proofing, however that would be the next thing sought. For the sake of theory ( not a belief nor desiring antagonizing), if we stay to any natural progression of things, the increase of our species having caused changes, if the natural offset were more warmth, moisture, cloud cover and albedo to offset this, are we interferring with natures response just because we would not want a warmer world, more weather, higher coastlines, etc.?
- 2nd law of thermodynamics contradicts greenhouse theory
EddieEvans at 06:06 AM on 7 June, 2023Likeitwarm
It sounds like the energy captured by greenhouse gases changes the Earth's energy balance. Without the greenhouse gases, Earth would freeze. From the page, "he Second Law does not state that the only flow of energy is from hot to cold - but instead that the net sum of the energy flows will be from hot to cold. That qualifier term, 'net', is the important one here. The Earth alone is not a "closed system", but is part of a constant, net energy flow from the Sun, to Earth and back out to space. Greenhouse gases simply inhibit part of that net flow, by returning some of the outgoing energy back towards Earth's surface.
The myth that the greenhouse effect is contrary to the second law of thermodynamics is mostly based on a very long 2009 paper by two German scientists (not climate scientists), Gerlich and Tscheuschner (G&T). In its title, the paper claimed to take down the theory that heat being trapped by our atmosphere keeps us warm. That's a huge claim to make – akin to stating there is no gravity."
More though, it seems that melting albedo on the Arctic Sea allows solar radiation to warming the ocean, which is something else to consider. I'm not a scientist, just interested.
- CO2 is not the only driver of climate
Bob Loblaw at 07:54 AM on 9 May, 2023piotr @ 73:
I am not sure what your "not directly" statement refers to. I presume that the Martin Mlynczak quote is the one in comment 69. To put it simply, the thermosphere and the earth's surface respond to solar radiation in very different ways. You can read about the thermosphere on Wikipedia. Note that the thermosphere is at very high altitudes (>80km), and its temperature structure is the result of the absorption of UV radiation. It also has very low density, so even though average kinetic energy is high ("temperature") it does not hold a lot of heat. It is not strongly linked to the surface, which is heated by the absorption of solar radiation over the full spectrum.
This paper by Lean, Beer, and Bradley (1995) shows in figure 2 that variations in total solar irradiance are much less than for the UV range (in %).

To use the 4W/m2 drop in that figure, you need to first reduce it by a factor of 4 (area of a sphere vs. area of a circle), and then adjust for global albedo (0.3), giving an overall forcing of only about 0.7 W/m2. Sustained over only a period of about 50 years, this is not going to have a major cooling effect on its own.
You say that "it noticeabl[y]e cooled large parts of the no[r]thern hemisphere", which I presume is a claim with respect to surface temperature responding to these solar variations. You then throw in volcanic effects. You seem to grossly overestimate those solar effects, though - with no references to any supporting information. If you look at this SkS post, the first figure shows that reconstructed global temperatures for that period are much smaller than your claimed "decrease up to 1.5°C".

In your second paragraph, you start talking about "The past 10.000 years where up and downs in global mean temperature like +/- 2°C for dozen decades, even for nearly 2000 years - as we can reconstruct with little data-points." This starts to wander into the last glacial period, where Milankovitch cycles start to play a role. You are mixing together a lot of different forcing mechanisms, as if they are all equivalent in some fashion.
You then start into urban heat island effects, and finish off with a couple of paragraphs that represent an argument from incredulity. If you actually want to learn something about temperature reconstructions from proxies, Wikipedia has a decent article on this, too. The Wikipedia page also has a graph that shows even less variation in temperature than the one above:

The numbers you are throwing around in your "just imagine" scenarios seem to be ones that you have a lot of confidence in. The problem is that they also appear to disagree with broad swaths of the scientific literature. You appear to be claiming that science is unsure of what happened in the past - but you are. It seems highly unlikely that you are correct.
If you want to have any credibility here, you are going to have to provide references to the numbers you post. This is not a site where you will be permitted to post a lot of unsubstantiated opinion. As you are a new user here, I strongly suggest that you read the Comments Policy.
- CO2 is not the only driver of climate
Eclectic at 10:20 AM on 8 May, 2023Piotr @70 ,
Think about it this way ~ causes and effects.
In this universe, if you see an effect, there must be a cause (and with enough study, you can find that cause - which may be a single cause, or a combination of causes).
Past studies (by experts) have shown broad changes in climate - not measured in tenths of a degree as per modern thermometers, but in broad assessments of indirect indications of climate average temperatures / sea level changes / vegetation changes / and so on. From this, it is evident that the climate changes when there is a causative change (a change in solar output, or in atmospheric CO2 levels, or in reflective "albedo" from global ice coverage, or in stratospheric aerosol particles from major volcanic eruptions).
All these jig-saw pieces fit together nicely, to give the scientists (and us) a good understanding of how climate "works".
Beware of non-scientists who say that "stuff just happens" [excuse the American expression]. They seem to wish to believe that the past century or two of very rapid global warming is somehow not caused by the obvious causes. And that it came for no identifiable reason. They seem to wish to believe that the modern warming "just happened for no cause" (sometimes expressed in the meaningless phrase "it is just a rebound from the Little Ice Age").
(The Little Ice Age had its own causes - frequent major volcanism plus episodes of reduction in solar output.)
Or they say that the modern rapid warming must instead be caused by "long-term changes/oscillations in ocean currents" ~ which actually does not make scientific sense (if they bothered to think it through).
Piotr, there are definitely some people who do not wish to think.
- The Big Picture
Eclectic at 17:51 PM on 19 March, 2023Gootmud @106 , I've no argument against vitamin D, in moderation.
But when you apply common sense to the situation, it is evident that the "thousand other effects" must be so exquisitely balanced against each other as to be in toto largely insignificant in comparison to the well-known Usual Suspects [insolation, albedo, aerosols, and of course the biggies of the Greenhouse gasses group].
As a follower of (but not disciple of) the vague hand-wavey arguments put forward by Dr Curry, that forces unknown to human science are steering our planet's climate . . . I must say that Dr Curry is a disappointment, for she has provided no worthwhile evidence to back her statements.
I will say two points in Dr Curry's favor :-
(A) She has not actually mentioned Martians in her testimony to Congressional Committees ;
(B) She is not a science-denier of the Greenhouse Effect.
- It's Urban Heat Island effect
Charlie_Brown at 06:29 AM on 28 January, 2023HamletsGhost @69
You say “The Greenhouse Gas model does not account for any heat transfer arising from rain-cooled macadam.” By greenhouse gas model, perhaps you are referring to the models for radiant energy transfer in the atmosphere. MODTRAN In Infrared Light in the Atmosphere is one such model available to everyone and can be used to clearly demonstrate the powerful effect of greenhouse gases. Urban heat island effects, including changes to albedo, evaporation, transpiration, precipitation, and energy production, are negligible compared to radiant energy loss to space. Actually, while the changes in these effects are tiny, the hydrologic cycle, convection, and conduction in the troposphere are built into the atmospheric temperature profile (lapse rate) upon which radiant energy transfer models are based. All that you have described are ways that energy moves around within a small portion of the troposphere and they do not have any significant effect on the global average temperature profile of the atmosphere. You jump to an incorrect conclusion that “In omitting the fact of transfer, the Greenhouse Gas model must be inaccurate.” Then to say that “Within a model that takes into account UHI-created weather patterns and rain-cooled macadam, atmospheric increase in carbon dioxide is less as the cause of global warming than an index of burning” is simply not true.
- It's Urban Heat Island effect
scaddenp at 11:25 AM on 25 January, 2023I am also mystified by the energy budget here. Radiation absorbed by low albedo areas, tend to radiate that back in infrared which is absolutely part of the models. Conductive transfer to rainwater is negible by comparison. Take a small amount of conductive heat transfer from a very small part of the area of the world going into a very large body of water and I would challenge you to measure the effect. I suspect it would hard to measure the effect on even the rivers flowing through a city let alone the ocean but happy to contradicted by data
- It's Urban Heat Island effect
Eclectic at 09:13 AM on 25 January, 2023HamletsGhost @69 :
You propose interesting methods of heat transfer from cities to rural & marine regions (such as Siberia and the Arctic sea).
However, to be worth consideration of this matter, it would be necessary for you to give at least a rough approximation of the actual quantification of this proposed effect. Size matters.
In post #60 above, MA Rodger notes the world's urban area is about 0.12% of global area. How will that percentage (adjusted by its albedo difference from rural) alter the Greenhouse Gas related calculations of global warming? My off-the-cuff guesstimate is that the overall alteration would be a poofteenth* .
[ *poofteenth is a mathematical term recently adopted by analysts assessing various magnitudes of contribution from heating/cooling factors driving Earth's surface temperature ]
- Skeptical Science New Research for Week #52 2022
Daniel Bailey at 07:57 AM on 1 January, 2023
Michael Mann has tweeted against the conclusions in this paper (see these whole threads):
https://twitter.com/MichaelEMann/status/1603437412272726017
https://twitter.com/MichaelEMann/status/1603446912073764865
Reading Hansen's piece, I was wondering why he never mentioned literally at least dozen papers (going back to before the AR5) plus the most recent assessment, the AR6 (I had a hard time believing that his entire author team also missed it, too).
This illustrates the need for peer review by non-affiliated experts prior to making things public...and to rely upon primarily the major scientific assessments and the published, peer-reviewed science.
This is the salient portion of the Lunt paper from 2010 that Mann references:
"Our combined modelling and data approach results in a smaller response (ESS/CS∼1.4) than has recently been estimated using palaeo data from the Last Glacial Maximum, 21,000 years ago (ESS/CS∼2). This is probably due to the fact that transitions from glacial to interglacial conditions in the Quaternary involve large changes in the Laurentide and Eurasian ice sheets (see, for example, ref. 36), which result in a significant large-scale albedo feedback in these regions that is irrelevant for climates warmer than present. Furthermore, the main driver of Quaternary climate change is ultimately orbital forcing, which is close to zero in the global mean, and is therefore difficult to reconcile with a traditional climate sensitivity analysis."
Note the expression of the ratio of ESS to CS (Earth System Sensitivity to Climate Sensitivity). If CS=3 C (per doubling), then therefore ESS would be about 4.2 C (and not 10).
- From the eMail Bag: the Beer-Lambert Law and CO2 Concentrations
Scruffy Scirocco at 23:24 PM on 25 December, 2022Useful article, but the example doesn't accurately reflect CO2 absorption. The example states that if you lost 1% of your energy through absorption in each cylinder, you would still have 37% of your ebergy after 100 cylinders. This is correct. But CO2 absorbs energy far more efficiently than that. Using the NIST data, the transmittance is only 30% through a 10cm path at 200mmHg. It's losing 70% of its energy, not 1%.
Granted, 200mmHg is far more CO2 than the atmospheric .300 mmHG of CO2 we're dealing with, but this means that an equivalent "cell" of absorption at 1 atmosphere with 400ppm CO2 would be 65.8m. After only 5 such "cells" you would have lost 99.76% of your energy to absorption.
We can discount re-radiation passing energy forward, as that's accounted for in the NIST measurements. The lost energy will be converted to heat, which will then conductively transfer to the other 99.96% of the gasses in the atmosphere, which will pass the energy upwards in their own spectral lines.
NO energy will be radiated into space in the CO2 absorption spectra - that atmosphereis completely opaque at those frequencies. Adding more CO2 won't change that. The idea that adding CO2 will change the characteristics of the re-radiation as it goes up the atmospheric column assumes that CO2 is the only gas, and that other gasses won't be conductively robbing the CO2 of the heat it's absorbed.
What WILL happen as CO2 levels increase is that the heat absorption will occur closer to the surface, causing an apparent increase in temperature, but this is offset by cooler temperatures at altitude, not accounting for convection and increased oceanic evaporation, which, while increasing the water vapor in the atmosphere (Major greenhouse gas) will also increase cloud cover and thus surface albedo, lowering the surface temperature of the ocean. - 2022 SkS Weekly Climate Change & Global Warming News Roundup #45
Bob Loblaw at 05:26 AM on 15 November, 2022To illustrate my comment at 18, about time lags, let's consider a very simple case, where we can treat the earth as a zero-dimensional point with an instantaneous addition of CO2 to cause a 4 W/m2 imbalance in the global radiation balance. (This is a number typically associated with a doubling of CO2.)
This imbalance represents a positive energy input that will warm the system. It will not warm it instantaneously, though - we need to account for the heat capacity. (Yes, a point can have a heat capacity, just like calculus tells us a line can have a slope at a point.)
We will consider three heat capacities:
- Just the atmosphere.
- Oceans, but just to a depth of 60m (the mixed ocean layer)
- Oceans to a depth of 2000m.
The low heat capacity of the atmosphere would allow rapid heating. Each addition of ocean mass slows the heating.
This is what we'd see as heating rates for those three scenarios:

We see that if the atmosphere was the only thing heating, we'd be done in less than a year. We see the system reaching equilibrium, with a warming of about 3C. (I have tuned the model's albedo and water vapour feedbacks to get that 3C result.)
Adding the ocean mixed layer slows things down quite a bit, but we still reach equilibrium in roughly 10,000 days (about 30 years). Adding deep oceans really slows things down - we're still far from equilibrium at the end of the graph.
As the system heats, the radiative imbalance decreases. Those values are in the following graph. Atmosphere-only equilibrates quickly; ocean versions more slowly.

The shape and relative position of the three lines in each graph would not change if you did a 2W/m2 initial imbalance, or changed the model sensitivity - it depends on the heat capacity used.
Of course, the real world is more complex. You are not heating a single mass, and the atmosphere, land and oceans have transport between them (and transport to different parts within them). You can't include that in a zero-D model, though.
More importantly, we are not dealing with an instantaneous increase in CO2. It is gradually increasing. We can add those things sequentially over time, though:
- In year one, we add some CO2. The atmosphere reacts quickly, but the oceans react slowly. We still have some warming waiting "in the system".
- In year 2, we add more CO2. Again, the atmosphere reacts quickly, the oceans more slowly - and we also have the heating still going on from year one's "ocean lag".
- In year 3, we get another increase in CO2. Another rapid atmosphere warming, and some slower ocean arming from this year's CO2, plus a one-year lag form last year's ocean heating, and a two-year-lag from the first year's ocean heating.
- ...and so on.
What you can't do is assume that the temperature rise after 30 years is just the year one CO2 value after a 30-year ocean lag. CO2 has been increasing since then, with 29, 28, 27, 26 etc. years of heating since it was added.
- From the eMail bag: A Review of a paper by Ellis and Palmer
Bob Loblaw at 03:43 AM on 9 October, 2022The albedo argument of Ellis and Palmer is an odd one. They explicitly state in their section 3.2 that they think it is incorrect to consider the albedo effect as a global one. In discussing the common approach to albedo feedback amounts, and comparing it to the CO2 feedback, they state:
The strength of the albedo feedback was calculated as being in the same range, or about 3 W/m2 over the full interglacial cycle (Hansen et al., 2012, Fig. 5c and p12). This figure was derived by equating albedo with sea levels, and therefore with ice extent, which spreads the albedo effect out across the entire globe in a similar fashion to the calculation for CO2. But this is likely to be an erroneous procedure.
They go on to argue that their localized "one day, one latitude" calculation of radiative effects is the proper one to use. They conclude one paragraph with:
As Fig. 3 clearly demonstrates, interglacials are only ever triggered by Great Summer insolation increases in the northern hemisphere and never by increases in insolation during the southern Great Summer, so why spread the influence of albedo across the entire globe?
To put it simply, the change in local or regional albedo represents one part of global albedo. To address the question of how much solar radiation the globe absorbs (which is the proper question for looking at global climate), you need to consider all of the globe - each latitude, each day, and each individual surface cover. The contribution of a single location is directly proportional to the area it covers - as a fraction of the total area of the planet.
Global changes in global albedo, caused by large white ice sheets replacing dark forests (or the reverse), is an important feedback. When climate science speaks "albedo feedback", it is this large scale issue that they mean, not Ellis and Palmer's local microclimate one.
The Rapp et al unpublished paper that MA Rodger refers to is an interesting side note. It still focuses on albedo and high-latitude insolation. It at least considers the entire year, not just the summer solstice, but it's efforts at modelling still are extremely simplistic - empirical fits between ice volume and variations in solar input. No actual climate model to provide precipitation inputs or melt processes, or glacier dynamics models to accumulate ice and move it from zones of accumulation to zones of melt.
The Rapp et al paper also seems to be rather confused about CO2 as a feedback vs. CO2 as a forcing. They argue against a straw man: that mainstream climate science thinks that CO2 is supposed to force the glacial/interglacial cycles. (It does not.) CO2 is one feedback. The overall CO2 level influences whether climate will respond to Milankovitch cycles by producing glacial/interglacial cycles, but it does not cause the individual glacial/interglacial periods. A world at 200 ppm CO2, a world at 300 ppm CO2, and a world at 450 ppm CO2 will not respond to orbital changes in solar insolation in exactly the same way.
- From the eMail bag: A Review of a paper by Ellis and Palmer
MA Rodger at 00:49 AM on 9 October, 2022One criticism of Ellis & Palmer (2016) that can be hurled with some confidence is that it has not exactly set the literature alight since it was published six long years ago. That tends to suggest it presents a badly failed hypothesis.
I note one of the citations listed by Google Scholar is for a later unpublished work co-authored by Ellis (evidently 2019 or later) which doen't make such a big thing about this CO2-dust mechanism, although it does continue to stress that CO2 was not the main driver of the ice-age cycles, which most would agree with.
One of the factors working against the grand assertion of Ellis & Palmer (2016), that CO2 leads to reduced plant-growth and thus more dust & lower albedo; one factor is the switch of ice-age period from 40k to 100k. This switch is usually explained by the dust during the earlier 40k phase being diminished as the bare plantless lands close-by glaciated areas were being scoured clean of any dust-generating soils by prior glaciations, scoured back to the bedrock. If this dust is alternatively explained by reduced CO2 suppressing plant-growth, the 40k-100k transition requires a new explanation. And given this requirement the apparent silence by Ellis & Palmer (2016) on the matter is entirely wrong.
- From the eMail bag: A Review of a paper by Ellis and Palmer
Bob Loblaw at 23:20 PM on 8 October, 2022nigel:
You have to read the paper to try to follow the logic (as such) of their argument about CO2 and temperature. It is rather convoluted.
Section 2 of their paper discusses the Milankovitch cycles, and introduces their "see - huge difference in input of energy on summer solstice at 65N" calculation. They use this to argue that albedo reductions due to dust on snow are the real feedback factor explaining how Milankovitch cycles can grow or melt a continental glacier.
In section 3, they do their bogus comparison between the dust-albedo feedback and CO2 radiative effects.
In section 4, they expand on the dust albedo factors.
In section 5, they give their hypothesis how low CO2 leads to reductions in vegetation cover, and how this is what leads to high dust concentrations that accumulate on the ice/snow of the glaciers. It's this last step that allows low albedo that allows the increased solar input (again, summer solstice at 65N) of the Milankovitch cycles to trigger deglaciation.
At the end of it all, they are basically saying that nothing else makes much difference as Milankovitch cycles go through their many wiggles, until vegetation gets so low and albedo of the snow and ice gets low enough so that a high in the 65N summer solstice Milankovitch cycle can finally melt a continent worth of ice.
It's all hanging together by a very thin thread, and their "analysis" is sadly lacking in any sort of model that actually incorporates anything of global/regional climate, the carbon cycle, and glacial dynamics and accumulation/melt.
- From the eMail bag: A Review of a paper by Ellis and Palmer
ubrew12 at 11:59 AM on 6 October, 2022"the paper...[argues] that low CO2 leads to low vegetation, which leads to increased dust" How does this comport with general knowledge? Vegetation requires sunlight, soil, and water, primarily. In what ecosystem is CO2 the limiting factor... deserts? In deserts, low CO2 should shrink the Hadley Cell, shrinking the desert, i.e. more vegetation, not less. I can't think of another ecosystem for which 'low CO2 leads to low vegetation' sufficient to rob the surface of all vegetation, i.e. create dust. As long as there is sunlight, soil, and water, you're going to grow stuff. And, as we've seen with hydroponics, you don't even need soil. Perhaps below 200ppm of CO2, the authors have a case. But, if so, do they prove it? And do they prove it for CO2 above 200ppm? It seems to me that for most vegetative areas, a CO2 above 200ppm precludes it as a limiting factor in vegetative growth.
"low CO2 leads to low vegetation... increased dust... reduce[d]... ice sheet albedo... end of a glacial period...[= higher temperature]." Condensed, the claim is "low CO2... = higher temperature". This demonstrably hasn't been true at any time in the last 400,000 years. If these guys think low CO2 leads to higher Earth temperature, it seems they should have to demonstrate that.
- What’s going on with the Greenland ice sheet?
rip71749 at 11:09 AM on 2 September, 2022It's hard to be optimistic. Record temperatures, record fires (Siberia burns year round and Russia started flaring and burning their natural gas that they don't want to send to Europe because they can't shut down their wells), record floods, shrinking albedo and record amounts of fossil fuels used. Countries are trying to find new sources of fossil fuels. I live in southern Calif and the temp yesterday was 112oF and probably warmer today and all next week, really hot! China is turning more to coal, probably India too. Clearly the world has to work together to solve these problems, and then you look at the top 4 fossil fuel emitters - China, US, India and Russia. It's hard to imagine those 4 ever working together. 6' by 2100 sounds conservative to me.
- 2nd law of thermodynamics contradicts greenhouse theory
MA Rodger at 21:11 PM on 18 July, 2022grindupBaker @1509,
You ask about a particular statement within this talk by Jennifer Kay 2021 'How do clouds affect global warming?'. @6:30 the video addresses the question "How do clouds affect the mean climate?" pointing to a net global mean effect of -21.1Wm^-2 (thus cooling), this comprising -47.3 Wm^-2 (cooling effect) due to albedo and +26.2 Wm^-2 (warming effect) due to a "longwave effect." Thus the statement:-
[From 8:04] "Clouds also have a longwave effect on the system. Just like greenhouse gases in the atmosphere, clouds absorb and re-emit long wave radiation and that actually causes the surface and the atmosphere to be warm."
My own objection to this statement would go no further than pick up on the use of the term "re-emit."
Your objection that "only a tiny portion" of the LW radiation arriving at the surface were 're-emitted' from clouds apparently expresses a similar concern.
But I'm not sure why you would then go beyond simply suggesting the replacement of "re-emit" with "emit". You appear to want to distance these cloud IR emissions from surface warming with description of them setting off "absorb-and-re-emit cycles before succeeding in achieving surface absorption," a description that deploys the very same objectionable "re-emit" term.
The point the video makes is that the climate system ("the surface and the atmosphere") is warm to the level it is significantly because of this long wave cloud effect. And I think we agree it is this warmth that sets the level of IR whizzing about in the atmosphere as well as the level being absorbed and emitted by the surface.
(And as a point of note: I recall that perhaps some 10% of the LWR from clouds will be due to reflection and presumably some will be directly returning surface-emitted IR back to the surface.) - 2nd law of thermodynamics contradicts greenhouse theory
MA Rodger at 22:26 PM on 17 July, 2022This interchange is getting rather forensic and probably unproductive. All agree. There is a troposhperic lapse rate. Radiation from the atmosphere goes in all directions so at any point the net radiation flux emitted by the atmosphere will be 50% one way and 50% the other, this with the caviat that the lapse rate reduces temperature with altitude and thus emission reduces with altitude (at least within the troposphere).
grindupBaker @1507,
You ask for confirmation that absorbed radiation is transferred to atmosphic thermal energy through mollecular collision. This is entirely correct. The average relaxation time for an excited molecule to re-emit is measured in hundredths of seconds while the atmospheric collisions occur in microseconds. Indeed, one of the points I would have made concerning your statements @1505 was use of the term "re-emit" which you allow unchallenged. It is the temperature of the atmosphere that determines (almost all) the radiation it emits, not the radiation being absorbed by that atmosphere.
I guess your comment (not a lot to do with laws of thermodynamics) is prompted by the often dreadful descriptions of the greenhouse effect we all encounter. But I'm not sure your efforts assist in such general descriptions.
When discussing the greenhouse effect, it is usually not linked to albedo (as you do) and is best seen in terms of the effective height (and thus temperature) at which the planet radiates to space. Thus it is not so much 'cloud thickness' which you imply @1505 is the important factor, but it is the 'cloud height'.
Trying to aportion the strength of the GH-effect to particular atmospheric constituents is far from straightforward as their contributions are interdependent. Thus to say O2 & N2 have no part to play is wrong as without them you get a Martian atmosphere which has an insignificant GH-effect. And specific to Earth, while H20 (gas, liquid and solid) is bigger player than CO2, it requires the CO2 to get into the atmosphere.
Trying to aportion the sensitivity of the GH-effect to particular atmospheric constituents is also far from straightforward. - Skeptical Science New Research for Week #26 2022
Doug Bostrom at 08:10 AM on 4 July, 2022"It is physically impossible that the balance is not there."
Yes, and here in the context of CO2 added to the atmosphere that balance is to do with radiative equilibrium. Equilibrium will happen— accompanied by many changes, mostly of an awkward nature as can be seen if one bothers to check research findings. One can easily calculate a ratio of good/bad by following NR, here. The ratio isn't good.
"That meteor 66 millions years ago ( killed dinosaurs and 3- of every 4 living things on earth) lowered the world 5 degrees overnight and darkened the earth completely sunless for 6 years. 30 degree F drop in 6 years, then swinging higher than previous normal and climbing to 2000-2500ppm once the sun returned. It all came back."
After enough death and dying (aka "evolutionary pressure"), everything was fine— right, got it. And the human species is collectively behaving like a brainless rock, yes. How is this good news, consolation, or reassurance? Meanwhile, thinking in geologic time isn't our nature and as well isn't really helpful in terms of dealing with changes happening right now.
The irony kicker:
"More co2 increases foliage (detected by Nasa's MOTIS), more transpiration, more moisture in the air, more low clouds with higher albedo."
If one bothered to follow NR and rather than instantly singing a comforting cantata of vague hopes instead read only titles and abstracts of papers listed here, one wouldn't make such a glib, facilely optimistic remark. One would know that neither of those claims pencil out as salvation.
- Skeptical Science New Research for Week #26 2022
peppers at 00:53 AM on 4 July, 2022I see this as a sort of misplaced approach to this issue, as all this data does little to folks passing by your stand at the swap meet. You are addressing people who may be saying there is no changing happening, and I dont think that remains logical. But some may be saying that to be obstinant or antagonistic. For myself, I dont think that change is happening is hard to see. The crisis stated by all this refers to the hockey puc being a precident in history, and the world will now be ending shortly by a runaway cycle. The train barreling down on a next generations child was the fearsome icon. But the world has experienced this before. That meteor 66 millions years ago ( killed dinosaurs and 3- of every 4 living things on earth) lowered the world 5 degrees overnight and darkened the earth completely sunless for 6 years. 30 degree F drop in 6 years, then swinging higher than previous normal and climbing to 2000-2500ppm once the sun returned. It all came back. My point is that, no matter it happening or the source, the world ( the universe ) balances. More co2 increases foliage (detected by Nasa's MOTIS), more transpiration, more moisture in the air, more low clouds with higher albedo. You will find even more paths of balance if you turn your capable eye to the cycling of nature, meaning the inescapable balance of all cycles. It is physically impossible that the balance is not there, I assure you. I am happy to elaborate more if there is interest. Thanks and best, David
- Climate Confusion
peppers at 21:44 PM on 28 June, 2022Love the balance acknowledgements. I dont hear this much yet it covers all of nature. By nature I extend to include the universe. Balance to me is like gravity. It is everywhere and will drop the apple on your head for lunch or speed you to demise when you step off the ledge. Orbits, plantlife, rivers and mineral cycles; even the milky way is in a 350M year orbit around our galaxy group. Balance. Co2 is a close brother of oxygen, and even though we draw up old reserves of that goo, Ox too is captured in the limestone and will require storms and erosion to bring it back up. Ox is in a steady decline for a M years in another cycle. I am watching for Co2 to balance with the 20% increase in foliage (Nasa) since 2000, 5% each last couple years, and the evaporation and cooling and added clouds and albedo this brings. Until once again there is balance, as this author references. There are millions of cycles interacting and the only constant is change and a desire to balance, without regard to one species or intent (see apple and falling above). Earth balanced after the big one (which sequestered the co2 and ox in the calcium and carbon slew), back from 4k ppm co2. If we consider balance, then warmer and erosion and trusting gravity and balance could mean the bigger picture just has us hubristically interjecting ourselves in to something, well, that might be needed later. Involving ourselves in something, not past our understanding, but past our paygrade. Interjections we are too important to get understanding just from an apple or acknowledging we know truly little, and that we can and will fall when we go past the edge.
- Climate Confusion
Doug Bostrom at 06:54 AM on 28 June, 2022Confusion over "warming in the pipeline" reminds me a bit of the general confusion over the so-called "hiatus" observed in certain temperature records during whenever-to-whenever (1998-...?) any particular study showed a deceleration or halt of temperature rise.
There was never and could never be a "hiatus" in overall planetary warming short of a vast and mysterious disappearance of various GHG species, or some other impossibility. What appeared to be a slowdown or stall in warming to the extent this showed up in our metrics was (had to be) simply lack of perception on our part, incomplete instrumentation. There was no implausible change in radiative balance, sudden (and oddly unobserved) global albedo change or any other physical means of actually reducing the amount of energy accumulating on the planet. The energy was simply going where certain means of measurement couldn't see it.
But "hiatus" means a specific thing in the minds of most people, an actual pause in action.
"Warming in the pipeline" and "hiatus" are both examples of hastily conceived, poor terminology, sharing the feature of being mental pitfalls for information consumers of the normal, average variety.
- SkS Analogy 2 - Ferrari Without Gas
Evan at 08:57 AM on 10 March, 2022OPOF, actually the quilt works fine for the Snowball Earth condition. Consider the following dialogue.
"How many blankets do you need to stay warm at night?"
Thinking of sleeping inside their house, the respondant says, "Two".
"Oh, you mean two blankets will keep you warm outside tonight?"
Now aware that the respondent did not think of background temperature, they quickly revise their answer to "four".
"Oh, you mean four blankets will keep you warm outside tonight in the snow?"
Now aware that the respondent did not think of background temperature and the geography, they quickly revise their answer to "six".
"Oh, you mean six blankets will keep you warm outside tonight in the snow in the middle of Antartica?"
You get the idea. To stay warm, the number of blankets, or the amount of filling in the quilt needed depends on the background temperature, which is controlled partly by the sun's temperature and partly by Earth's albedo, which controls IR radiation. It is never just a matter of the number of blankets or the stuffing in the quilt. :-)
- It's albedo
MA Rodger at 22:27 PM on 5 March, 2022Bob Loblaw @131,
I also have struggled to identify any sign of a significant driver of climate in the arguments presented by blaisct. If we wind back to the initial proposal (in the 'Does Urban Heat Island effect exaggerate global warming trends?' thread @59), I feel the scoping of a direct potential forcing can be scoped quite simply** but refining such an analysis does not appear possible with commenter blaisct who now introduces further speculative feedbacks into the discussion, thus piling unhelpfulness on top of unhelpfulness.
(**According to Wild et at [2015] fig2a, the average land albedo equates to 48Wm^-2(land) = 14Wm^-2(global). If urbaniseation reduced that to zero over 1M sq km, that would equate to a 0.1Wm^-2(global) forcing, thus a maximum value for a quantity which may not even be positive. Note Guo et al [2022] suggest the effect is negative over urbanisation in China.) - It's albedo
Bob Loblaw at 09:04 AM on 3 March, 2022I have been watching this discussion for a while, and I too have a really difficult time understanding what blaisct's real purpose or argument is. With respect to albedo, it seems as if he is implying that albedo causes the change in climate, while ignoring the possibility that other factors are changing the climate and albedo is responding to that - the classical albedo feedback that is a standard part of climate science.
I have access to some high temporal resolution surface radiation data from a continental location. Let's look at four graphs of daily values:
January radiation and albedo:
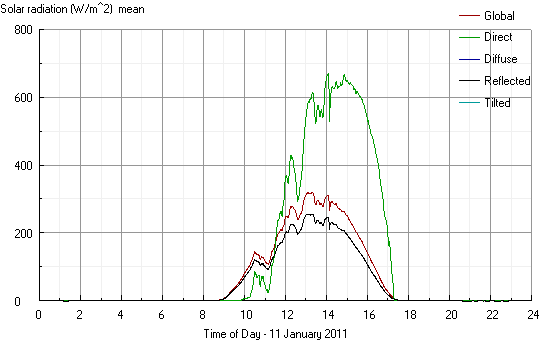
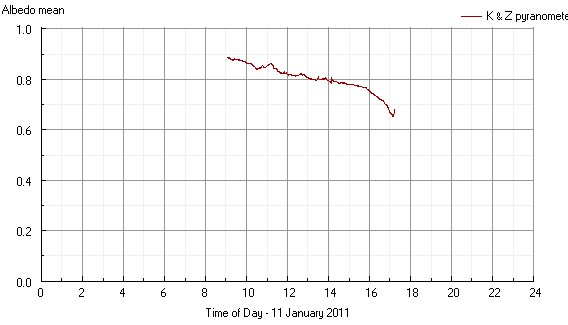
...and the same location in July
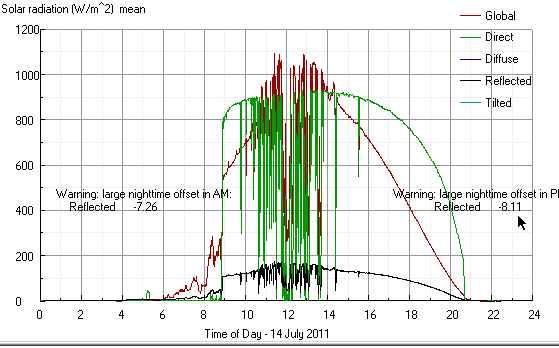
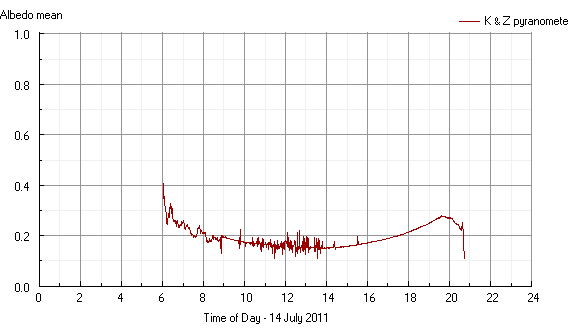
Let's talk about the last two first. It's a mostly sunny day. with some morning cloud and mid-day scattered cloud. Global radiation peaks at over 1000 W/m2. There is a strong diurnal pattern to albedo - lowest in mid-day (less than 0.2), and highest around sunrise and sunset (around 0.3).
Then let's compare these to the first two, from January. A similar day in the sense of morning cloud and afternoon clear skies, but global radiation is much lower - (peaks at about 300 W/m2). Albedo is quite different - it drops from about 0.9 in the morning to
I also know a bit about the temperatures on each day. In July, it was much cooler in the morning and evening, and hottest in the early afternoon. January was much, much colder.
Should I assume that the differences in albedo have caused those temperature differences? After all, there is a strong correlation: albedo drops, and temperature rises. Very high albedo? Very cold temperatures!
...but all I have done is shown that winter is colder than summer, so you can get snow on the ground instead of agricultural crops. After all, the energy input from solar radiation in January peaks at 30% of what it was on that July day, even if we don't account for the higher January albedo and shorter daylight period.
And the diurnal cycle in July? It is well-known and well-documented that surface albedo shows variability with solar zenith angle in clear skies. The sun is high in the sky at solar noon (which is about 1pm clock time on these graphs), and low in the sky at sunrise and sunset. It's not the albedo that is driving temperature differences: it is the change in solar input.
Nothing surprising here. Albedo differences are the result of other factors that affect weather and climate.
I think the same applies to blaisct's humidity and cloud arguments. There is nothing that I can see in his comments that gives any evidence that albedo or humidity are the driving force behind changing climate - they can (and are more likely to be) the result of a changing climate. A feedback, not a forcing.
- It's albedo
blaisct at 12:08 PM on 1 March, 2022Rodger @128
Once again thanks for your input and patience. My objective in these three cases was to show the difference in air quality (temp and RH) of possible man-made land changes. These air changes are related to the cloud ceiling.
Sorry for the errors. I do not do a good job going from my excel sheet to this format. I should have shown the before water step in case 1, and I did copy the results of case 1 wrong.
To correctly compare these cases a base case enthalpy change must be picked based on real world data that represents the middle part of the earth with the sun shining. I have made lots of temp vs RH plots and came up with 8 kJ/kg(da) as a good average change in enthalpy. The same data shows that adding 2g/kg dry air was typical of tropical conditions.
The short cut you suggested is ok as long as it crosses the 18g/kg water line and the 74kJ/kg(da) (66+8) line simultaneously. The two albedo cases are ether side of the 8kJ/kg base case at 6.4 kJ/kg and 9.7kJ/kg. I corrected the cases to include the case 1 with out water added and the enthalpy difference for each case. All cases start at the same 25’C and 80%RH.
Cloud ceiling (m) = (ground temp. – ground dew point)/2.6 *1000*0.3084
I hope all the errors are out of these cases and we can discuss the conclusions.
1. These simple cases show that the beginning (event 1) of the LHAC theory in @121is valid in that land changes that result in lower available moisture will produce higher temperatures and lower RH air even if the albedo is increased.
2. This higher temperature lower humidity air is correlated to cloud ceiling.
Base case water added: typical rain forest (other vegetation or water sources would have less water added)
Base case no water: Just to show what the rain forest would look like without water added. Note same enthalpy change and same dew point of all the other cases.
Low albedo: intended to simulate a UHI.
High albedo: intended to simulate the rain forest conversion in Amazonia.
Summary of these cases:
Base case water added: 8kJ/kg(da), 27.9’C, 75.5% RH, 23.3 dew point calculating 561 m ceiling
Base case no water: 8kJ/kg(da), 32.5’C, 52.0% RH, 21.4’C dew point calculating 1318 m ceiling
Low albedo: 9,7kJ/kg(da), 33.4’C, 47.0% RH, 21.4’C dew point calculating 1543 m ceiling
High albedo: 6.7kJ/kg(da), 31.5’C, 55.5% RH, 21.4’C dew point calculating 1171 m ceiling
Cloud ceiling and cloud cover should have a negative correlation? This exercise also suggests that the LHAC theory is more related to cloud prevention than destruction. The real-world origins of the ceiling correlation to temp and dew point suggest the plume of hot low RH air reaches high into the atmosphere supporting the model in Figure 3 @121.
Comments on how big (% of earth’s surface) this effect is? See event 2 calculation @121. I get 7.8% of the earth surface that could be affected by hot low RH air to some degree. Figure 2 @121 show a decreasing RH over time, suggesting low RH air is being produce. - It's albedo
MA Rodger at 07:51 AM on 28 February, 2022blaisct @127,
I'm not sure this interchange is going anywhere. You are not noting the obvious errors in these numbers you are throwing around and if they were corrected I don't see any relevance to the climate change occuring, either globally or regionally.
On the errors thing, do note that your numbers from the Free Online Interactive Psychrometric Chart are wrong. Consider simplifying the process you are trying to represent. This is not some reversable process so all that matters is the start & end points, not the route between.
Thus if you choose to start at 25°C & RH=80%, you can add the SH from 16g/kg to 18g/kg (that is 11% increase not 22%) giving RH rising to 89.4% & Enthalpy increasing from 66kJ/kg to 71kJ/kg.
Now if you add further energy through warming with SH fixed at 18kJ/kg, the enthalpy will rise and the RH will drop with that warming.
So your Case 3 with an endpoint of 72.3kJ/kg gives a temperature increased from +25°C to +26.2°C & RH drops to 83.6%.
Your Case 1 with an endpoint of 74kJ/kg gives a temperature increase to +28°C & RH dropping to 75.5%.
And your Case 2 with reduced albedo giving additional warming to +9.7kJ/kg from the same start conditions yields an endpoint of +29.3°C & RH dropping to 69.7%.
But these are just numbers. I don't see them relating to what we see of the real world climate change.
- It's albedo
blaisct at 09:33 AM on 25 February, 2022I don't know what went wrong but I tested these; Online psychrometric chart and Tutorial
Please except my assumption and online calculator results in the summary of the three conditions, they are only examples.
Doing some further research on the clouds I found this site Cloud Ceiling Calc that had a correlation used by airplane pilots to predict cloud celling.
Cloud ceiling (m) = (ground temp. – ground dew point)/2.6 *1000*0.3084
The base case is virgin land with lots of trees and vegetation, and is simulated by adding water to the online psychrometric chart calculator. The water added (22% of total water) is typical of data for rain forest type land.
I have added the cloud ceiling calculation to the summary to show that the LHAC cases increase the cloud ceiling no matter what the albedo is. The high albedo case is 20% higher albedo than the base case and much greater than your chart on W/m^2 vs time. The emphasis of the LHAC theory is that cities and cropland do not put as much water into the atmosphere as the orginal virgin land and this lack of water can reduce the cloud cover.
Summary of these cases:
Base case: 29.2’C and 70% RH with 23.3 dew point calculating 701 m ceiling
Low albedo: 33.4’C and 47% RH with 21.4 dew point calculating 1543 m ceiling
High albedo: 31.5’C and 55.5% RH with 21.4 dew point calculating 1171 m ceiling
Cloud ceiling and cloud cover should have a correlation.
- It's albedo
MA Rodger at 21:08 PM on 24 February, 2022blaisct @125,
Your URLs don't work but...
I assume when you say @123 that "the psychometric chart in @106 shows the math" you mean that this Free Online Interactive Psychrometric Chart for HVAC engineers does the aritmentic. The "math" is your own. And I would suggest it includes questionable assumptions as well as error and is incomplete. Certainly the contradiction I posed @122 (that Costa et al [2007] showed increasing albedo rather than the required decreasing albedo yet still showed warming temperatures) remains unexplained.
- It's albedo
blaisct at 07:35 AM on 24 February, 2022Rodger @122
To show that albedo differences are not that significant, let’s do three examples on the psychometric chart. 1) the land the UHI/cropland was on before. 2) the UHI/cropland with decrease albedo 3) the UHI/land with increased albedo. In event 1 of the LHAC theory we have two things going on: one, the pure albedo effect that is about 0.08W/m^2 for a 0.05 albedo change (not very much), and two the total heat from the sun (about 177 W/m^2) is generating hot low RH air. We will use the psychometric chart to calculate the difference in the “cloud killing” capability of this air in the three cases. You chart at @124 is clearer than mine at @106 but does not show that the yellow lines (wet bulb lines) are constant enthalpy lines (on a dry air basis), constant flux (W/m^2) or the albedo over time transferred to the air (W-hr/m^3 or kJ/kg(dry air)). (if you were an air-conditioner installer this would be related to the HP or tons of your unit, in our case it is the sun’s energy.) We need to get to these units to calculate how much cloud cover this hot low RH air can destroy or prevent, then we can go back to W/m^2.
I will be honest with you; I use a free online calculator for these charts at Online Interactive Psychrometric Chart
The site Tutorial is a good tutorial.
The following is from the interactive site;
1) For virgin land let’s pick 25’C and 80% relative humidity a little after the sun rises on a clear day, that will put us on the constant specific humidity, SH, line of about 16 g/kg(dry air), the web site call this “Humid.Ratio”. To simulate an sensible heat rise over the course of the day, move right on the constant 16g/kg(dry air) SH line for this example we will stop at 52% RH and 32.5’C (this would be the conditions with no water added) (The 52% RH will match the 8.0 kJ/kg(da)(differences between starting conditions and end of day enthalpy conditions needed to match most cities temp vs RH line, I am sorry this is a trial and error procedure). We will also assume that vegetation and other water sources add water to 18 g/kg(dry air)(22% increase in SH, this is equivalent to one example I found- not much data out there on this) results in an adiabatic cooling (follow yellow line back to right) to 29.2’C and 70% RH on the 18g/kg line.
2) For decrease in albedo, we will assume 20% higher energy than case 1, or 9.7kJ/kg(da) (this was in range of city data I found), and we will start at the same RH of 80% and 25’C. The trial-and-error calculation yields 33.4’C and 47% RH.
3) For increase in albedo, we will assume 20% lower energy than case 1, or 6.4kJ/kg(da). The trial-and-error calculation yields 55.5% RH and 31.5’C.
Note: the temp vs RH for most cities I plotted match the no water added lines in the psychrometric chart.
Summary of these cases: all cases start at 25'C and 80% RH.
Base case: 29.2’C and 70% RH water added
Low albedo: 33.4’C and 47% RH
High albedo: 31.5’C and 55.5% RH
The base case is just into the cloud killing/prevention range of 80% and the other two cases are well into the cloud killing/prevention area. This is only an example not a conclusion.
The next question is how much of the hot low RH air is produced and how much makes it to cloud destruction/prevention. We know from the plume described in Figure 3 of @121 that it is 2-4 X the area of the UHI/cropland. This calculation would require more expertise than I have. I have looked at some very rough numbers (without mixing and pressure change) and get a significant percentage (4%-45%) of the atmosphere that could be affected not counting the probability of getting a chance at cloud destruction/prevention.
The IPCC has very good mixing and thermo models that should be able to do this. - It's albedo
MA Rodger at 19:08 PM on 22 February, 2022blaisct @123,
It is good we can now see clearly the mechanism (1) to (5) of your LHAC theory in which you propose a driver of increasing global temperatures.
But then we run into a problem or two.
If the driver is step (1), a decrease in surface albedo driven by spreading urban development, how can you now say "the change in albedo is not that significant"? The change in albedo is surely the driver of the process. Or is my "translation of LHAC theory" less than correct?
Perhaps the contradiction I posed @122 (that Costa et al [2007] showed increasing albedo rather than the required decreasing albedo yet still showed warming temperatures) is in some way explained but I do not see it. And identifying the driver of a process is fundamental to such theorising. It appears that has not been achieved.
You also say the chart @106 shows the maths but I would disagree. The chart sinply plots temperature (aka dry-bulb teperature, aka psycometric temperature) against dew-point temperature to allow heating engineers to calculate water content etc. It does no calculating. (A clearer version of the chart may assist.)
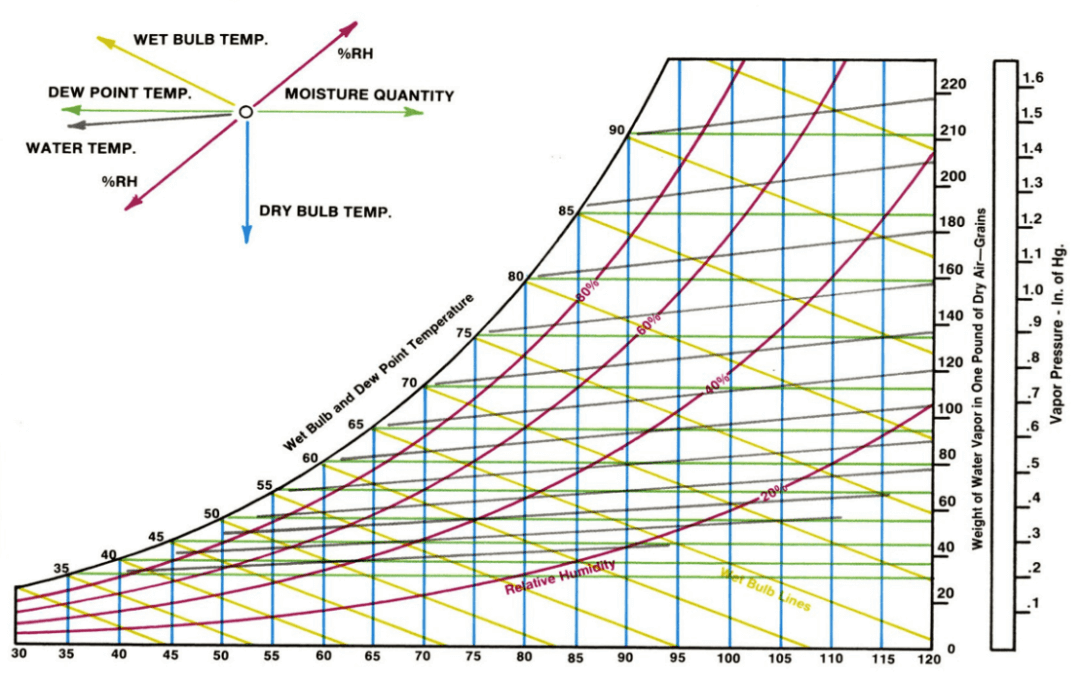
And the process concerns changing energy fluxes. While heating engineers may work in W-hr/m^3, in climatology there are a fixed number of hours in a day and of cubic kilometres in the sky. So Wm^-2 is perfectly adequate as a measure of the proposed mechanism at work.
- It's albedo
blaisct at 03:36 AM on 22 February, 2022Rodger @122
Yes, your translation of the LHAC theory is correct. Sorry for the whole apple, it was the only way to answer your question. One point of clarification. The production (flux over time) of hot low humidity air (through the day when the sun is shining) will occur no matter what the albedo of the UHI or cultivated land is, so the change in albedo is not that significant but the change in moisture availability is. The albedo affects how hot, water availability affects how low the RH, and area affects how much is produced over time. The Amazonia study showed this. The psychometric chart in @106 shows the math. In the LHAC theory, hot low RH air has always been a part of weather. Over time, man has changed how hot, how low the RH and how much is produced with UHI’s and new cultivated land. The generation of hot low RH air deals with W-hr/m^3 not W/m^2 and destruction of clouds should be on the same W-hr/m^3 basis.
Correction in @121
At bottom of @121 should read: we get -1.6W/m^2 change in incoming SW [ 342W/m^2*0.8% cloud cover change*(85% *(1-0.05)+(1-85%)*(1-0.15) – (1- 0.31 earth’s albedo)*(1-50% cloud albedo))] - It's albedo
MA Rodger at 23:33 PM on 20 February, 2022blaist @121
I had the impression the Order of the Day set out @111 was "small bites" but @121 you appear to be serving up a giant five-course meal.
You seem to be proposing a driver of AGW with a mechanism initiated by (1) a decrease in surface albedo due to the spread of urban areas leading to (2) a rise in surface temperature which in turn leads to (3) reduced relative humidity which leads to (4) reduced cloud cover which then amplifies the warming due to (5) a reduction in cloud albedo. Do correct me if I have misunderstood your proposed mechanism.
Yet if this suggestion is to hold water, how does it reconcile with the 'Amazonia report' you cite, Costa et al (2007) which (as you describe) "showed that in despite of an increase in albedo from rain forest to crop/pasture, the temperature increased." And this increase in surface albedo with land-use-change is global and has been on-going since 1700 according to your other citation Ghimire et al (2014) whose Fig 2 is pasted below showing a cooling radiative forcing (inset rising albedo).

So if there is an increase in surface albedo, what is it causing the increasing global temperature and thus kicking-off your proposed mechanism, (1) to (5) above? Why would we be experiencing warming if globally surface albedo has been increasing since 1700? - It's albedo
blaisct at 07:28 AM on 20 February, 2022MA Rodger @112
Before I answer your question on whether there is something other than AGW causing global warming. Let me clarify that I am not a skeptic on Anthropical Global Warming, AGW, I firmly believe that man’s activities are causing AGW. The paper Dubal & Vahrenholt expressed doubt that the 20 years of CERES data showed significant evidence of GHG caused AGW and that clouds were the significant factor. How is cloud cover related to AGW? The Skeptical web site seems to be committed to evaluating theories. Here is the answer to your question:
The data I have looked at (below) suggest that AGW is not cause by one thing but a series of interactive events starting with land albedo and ending with ocean/land albedo and relative humidity (not specific humidity) in the middle. You will see (below) that this cycle of events is a known cycle in weather and that man’s activities have interfered with the cycle to cause AGW. For lack of a better name, I will call the cycle of events the “Low Humidity Albedo Cycle”, LHAC. The LHAC cycle back in the 1700-1800 (with low man-made albedo change) was:
Event 1: Over land on sunny days the temperature rises and the relative humidity, RH, drops through the day no matter what the albedo of the land is. How much the RH drops depends on availability of water from liquid water evaporation or plant transpiration. If no water is added to this daily event the specific humidity, SH, will remain constant while the RH drops. With water available the RH does not drop as much and the SH increase. The energy fueling this event (sunny days) depends on the albedo and latitude of the land, the lower the albedo and the closer to the equator the stronger this event. Clouds greatly dampen this event.
Event 2: The air above this land is hot and dryer and it rises all day long, creating a plume of rising hot low humidity air. That plume of air moves with the prevailing winds usually to the east in a circling pattern due to the Corellas effect.
Event 3: This hot low RH air is hungry for water. If this air finds clouds it eats away at them until the air is saturated with water, this process cools the air and raises the SH and RH. If this hot low RH air does not find a cloud it can cool as the pressure drops at the higher altitudes or it can serve as a deterrent to cloud formation. In all cases it reaches saturation.
Event 4: With fewer clouds more sun can reach the earth and warm the land and oceans, this is the final albedo decrease event. This last albedo event is the strongest because the change in albedo in the greatest with no clouds in the way of direct sun light. The warmer oceans store some of this energy and evaporate more water - find cold air and make more clouds.
This natural LHAC cycle of event will remain stable if the albedo and moisture availability remain constant. Let’s take each event and look at its contribution to the total AGW since 1880:
Event 1: Since 1700-1880 man has made some small changes in land use albedo but a large change in the land area. Most of these albedo changes came along with a decrease in moisture availability. UHI’s are most noted, with albedo changes between 0 and 0.2 depending on what the city replaced. I don’t have a source for the average, I will assume 0.05 average albedo change. The urban area has increased to about 3% of the earth’s land mass for all cities. I have no trouble doubling that to 6% for all man-made structures, rural + urban, they all have lower albedos and generate heat. Go to any city at Climate data and you can find the daytime data for temperature vs RH, in the morning the RH is high and as the day progress the temperature rises and the RH drops sometimes to 40% RH or lower, this is a normal psychometric thermodynamic process. Figure 1 is an example of daily RH from Beijing and is typical of most cities (just focus on the day time).

Figure 1
The change in albedo flux of all the earth’s cities is estimated at 0.08W/m^2 (assuming 177W/m^2 sun to the city, 50% cloud cover, 0.05 albedo change, 3% of land mass cities). Even if we make larger assumptions, we still can’t get to the 2.2W/m^2 we are looking for to account for all the AGW since 1880 or the 1.3 W/m^2 in Dubal & Vahrenholt . These cities can have daily temperature rise of up to 8’C. A large part of this temperature rise is due to the psychometric rise, PR, in temperature while the RH drops at a constant energy input (albedo). Looking at temperature anomalies, SH, and RH all plotted together vs time, Figure 2, we see they are all correlated (Temp and SH positively, and Temp and RH negatively).

Figure 2
If PR were not occurring on a global basis the RH and SH would both have a positive slope. Using the psychometric chart in @106 we can get the average temperature rise per % RH of -0.15 ‘C/%RH. The slope of the RH data in (2) is 0.16%RH/decade, for the 40 years of the chart this is 0.6% change in RH, giving a PR temp rise of 0.1’C for the 40 years vs the 0.7’C observed, small but not insignificant. This hot low RH air has no W/m^2 flux as it leaves the UHI; but, the hot low RH air has potential energy gain in getting saturated with water. Let’s add the crop/pasture land albedo changes to the UHI's. Globally the change since 1880 from virgin land to crop/pasture was about 6% with little change in albedo (Global albedo change); but, with low moisture change. The most notable of these changes was the deforestation of the Amazonian rain forest to make crop and pasture land Amazonia report (and @106). Amazonia report showed that in despite of an increase in albedo from rain forest to crop/pasture the temperature increased, the RH deceased, the cloud cover decreased, and the rain decreased. Classic example of psychometric temperature and RH behavior. Most likely all of this global 6% increase in crop/pasture land is producing hot low RH air just like the UHI’s. Combining the UHI and crop/pasture land changes we get 9% of the earth’s land mass producing more hot low RH air than 1880.
Event 2: This hot low relative humidity air rises and goes downwind from the UHI or changed crop/pasture land. The picture from (6) shows the extent of the UHI plume from Chicago, Il.

Figure 3
This is a computer model tuned with real data and calculates the extent of the plume to be 2 to 4 time the area of the UHI. The model also predicts the shape of the plume, rising to where some clouds could be. Using 3 times as the average extent of the plume we now get 27% of the land mass (7.8% of the earth) being affected by plumes like the one in Figure 3.
Event 3: Cloud destruction/prevention is the closest target for the hot low RH plume; but, if clouds are not available the lower pressure will saturate it or it will mix with cooler air. When this plume of hot low RH air increases its RH to 80% it is no longer is a threat to clouds or cloud prevention. Clouds and RH observations are that almost no clouds can form below 60% RH and significant reductions will occur below 80% RH.

Figure 4
Data shown in the figure 4 shows a 41%/decade decrease in clouds over 40 years. Dubal & Vahrenholt Figure 9 show about 0.57%/decade decrease, this data can be correlated to Figure 2 RH data and get 2.7% change in cloudiness/change in RH (R^2 =0.63). Not the best correlation but shows there is a relationship.
Event 4: The reduce cloud cover exposes more land and ocean to the sun. This land and ocean are located in the middle 75% of the earth where the cloud cover is about 50% vs about 60% for the whole earth, also assuming albedo of clouds is 50%. The sun’s flux to this exposed area is the cloud free flux of 342 W/m^2 (1367/4). Dubal & Vahrenholt suggest this energy is split 85% over ocean (0.05 albedo) and remainder over land (0.15 albedo). Using 40%/decade cloud cover for 2 decades of CERES data we get -1.6W/m^2 change in incoming SW [ 342W/m^2*0.8% cloud cover change*(85% *(1-0.05)+(1-80%)*(1-0.15))]. A little greater than the -1.3 W/m^2 observed; but close enough to show that the LHAC theory is plausible. - It's albedo
nobodysknowledge at 21:28 PM on 12 February, 2022Thank you for your presentation of the Dübal and Vahrenholt 2021-paper blaisct. I think there is a good overall agreement to the CERES data presented by Loeb et al 2021. I have commented this at Science of Doom.
The Dübal and Vahrenholt paper, Radiative Energy Flux Variation from 2001–2020, have got some attention. And for good reason. It is an important discussion. But there are some problems with some of the claims that are made.
«Radiative energy flux data, downloaded from CERES, are evaluated with respect to their variations from 2001 to 2020. We found the declining outgoing shortwave radiation to be the most important contributor for a positive TOA (top of the atmosphere) net flux of 0.8 W/m2 in this time frame.»
According to the CERES data they present (TOA all sky), the trend is LW out 0,28 W/m2/decade (cooling), SW out -0,70 (warming), and solar reduction 0,03 (cooling), wich gives a TOA warming trend of 0,39 W/m2/dec. So far so good. And in good agreement with Loeb et al 2021. EBAF Trends (03/2000-02/2021) 0.37 + 0.15 Wm-2 per decade.
«The declining TOA SW (out) is the major heating cause (+1.42 W/m2 from 2001 to 2020).»
Trend SW out all sky -0,70 W/m2/dec withsolar reduction included (0,70 W/m2/dec TOA warming). Gives 1,40 W/m2 over 20 years. This major heating is composed of SW clear sky heating trend of -0,37 W/m2/dec and a SW cloudy sky heating trend of -0,78 W/m2/dec. In the TOA radiation energy bridge-chart (figure 14) this is shown as SW clear sky increase of 0,15 W/m2 and SW cloudy areas increase of 1,27 W/m2. And the solar change impact is -0,17 W/m2 for 20 years. A great difference between trend and energy bridge-chart.
Loeb et al has a SW TOA heating of 0,63W/m2/dec through albedo change, with clouds increasing absorbed SW Flux 0,44W/m2/dec and surface increased absorption 0,19W/m2/dec. In good agreement with Dübal and Vahrenholt. EBAF Trends (03/2000-02/2021) 0.68 + 0.12 Wm-2 per decade.
«It is almost compensated by the growing chilling TOA LW (out) (−1.1 W/m2).»
But as we have seen, the trend is only 0,28 W/m2/dec. This is composed of LW TOA flux clear sky 0,04W/m2/dec and LW cloudy sky 0,35 W/m2/dec. How can they claim so big «chilling» longwave cooling? It looks like they use the startpoint and endpoint of a graph, and that the «chilling» cooling at TOA was for the year 2020 relative to 2001. In the TOA radiation energy bridge-chart (figure 14) this is shown as LW clear sky increase of 0,46 W/m2 and LW cloudy areas increase of 0,64 W/m2. I think what is presented in the bridge-charts is close to cherrypicking.
Loeb et al EBAF Trends (03/2000-02/2021) -0.31 + 0.12 Wm-2 per decade
The Dübal and Vahrenholt calculations for cloudy areas are clearly showing how thinning of clouds is the greatest component of global warming for the last 20 years, and probably for 40 years when we read the papers of M Wild and other cloud scientists. So when some say that the AGW is the cause of all global brightening or of all increase in water vapor, they are not taking the attribution problem serious. Increasing surface and atmospheric temperatures is contributing a lot, but there is a great complexity behind all this.
- It's albedo
MA Rodger at 23:36 PM on 10 February, 2022blaisct @115,
And concerning your second question - "If all the global warming, GW, came from CO2 radiative forcing alone would not a graph like @111 be flatter...?"
The 'graph @111' is Fig 3 of Dübal & Vahrenholt (2021) and specifically shows a quite-dramatic reduction in albedo 2001-20 with a trend of -0.70Wm^-2/decade. Fig 1 shows a reduction in solar of -0.03Wm^-2/d. Thus Figs 1 & 3 matches Loeb et al (2021) Fig 2d with Absorbed Solar 2002-20 given as +0.67Wm^-2/d. Loeb et al Fig 2d also presents an attribution of this increased absorbed solar warming 2002-20, ☻ 60% cloud albedo, ☻ 7% water vapour, ☻ 4% GHGs, ☻ 26% surface albedo, ☻ 3% aerosol. And note also that Loeb et al Fig 2a shows this 'quite-dramatic' effect occurs almost totally 2013-20.
To explain this attribution; if 4%+7% of this increase-in-Absorbed Solar (decrease-in-albedo) is attributed to GHGs, this means additional GHGs+water-vapour is directly preventing solar being otherwise reflected away and instead directly absorbed by the increased GHG+water-vapour. The underlying cause for the water vapour increase is of course AGW.
Your question implies that you consider there is something other than AGW and increased CO2 driving a significant part of this increase-in-Absorbed Solar (decrease-in-albedo) 2002-20. I don't think I could agree.
Loeb et al does identify the geography of the various components of the net EEI, mapping them out in Fig 3 and pointing to the Surface effect being "greatest in areas of snow and sea-ice, where significant declines in coverage have been observed in recent decades." It is, of course, easy to see that the ice-loss is due to AGW.
And for the biggest component, Cloud, Loeb et al says "Regional trends in net radiation attributable to changes in clouds are strongly positive along the east Pacific Ocean, while more modest positive trends occur off of the U.S. east coast and over the Indian, Southern, and central equatorial Pacific Oceans." Is this the finger print of AGW? If it isn't, it would require an alternative causation.
If AGW is the cause, note that the increase-in-Absorbed Solar (decrease-in-albedo) 2002-20 is mainly occuring 2013-20 which matches the global temperature record showing 70% of the 2002-20 warming occurred in the period 2013-20.
So without further explanation, I see no reason to expect a "flatter" slope from CO2-forcing alone, the slope being presumably all down to AGW.
- It's albedo
MA Rodger at 10:33 AM on 7 February, 2022blaisct @111,
You say you want to "take smaller bites out of albedo apple" which is probably advisable and presumably it is also advisable to start from the first "small bite."
So we have set out in Dübal & Vahrenholt (2021) for the 19 year period 2001-20 a trend in 'Incoming Solar (TOA)' of -0.0035Wm^-2/yr and a trend of 'Shortwave Out (TOA) ' -0.0704Wm^-2/yr of and thus an inferred trend in 'Absorbed Solar' of +0.0669Wm^-2/yr which would thus equate to +1.27Wm^-2 'Absorbed Solar' over the 19 years. So far so good.
You then assert that the "change in global temperature over the CERES time period is about +0.45ºC" which is a reasonable value for global SAT 2001-20 although its best if its derivation was properly explained. But, so good so far.
You then assert that this temperature increase of +0.45ºC is in some way equivalent to +0.9Wm^-2 per 20 yrs. That step does certainly need explaining.
And if that explanation is convincing (warning - that is very unlikely to happen), when that explanation is provided, it would help why the discrepancy between 0.9 and 1.3 can also allow the two to be considered as "an almost perfect fit."
And when these "small bites out of albedo apple" have been digested, the relevance of your first question may be more evident.
- It's albedo
blaisct at 04:24 AM on 7 February, 2022Ref my @104 and @106 replies
Thanks again for the comments. I can see that I need to take smaller bites out of albedo apple in the CERES data. Let me start with Hans-Rolf Dübal et al 2021 graph of CERES data.
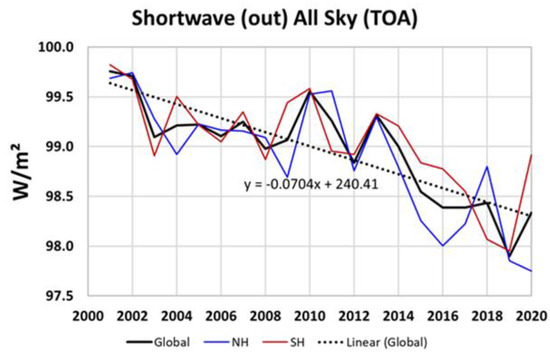
Hans-Rolf Dübal et al 2021 does not have an official albedo change graph (change in sun’s energy out -change in sun’s energy in). The graph above needs to be correct for the small (-0.07 W/m^2/20 years) in coming energy (correction is: -1.3W/m^2/20 years). My post @104 has that correction in a graph. The change in global temperature over the CERES time period is about 0.45’C or -0.9 W/m^2/20 years. Over laying that on the graph above one can see an almost perfect fit (slightly higher slope for CERES data) (can’t show that in this format).
First question: Does an almost perfect fit of global temperature to CERES albedo (in W/m^2) mean albedo is the main cause of global warming for the 20 years of CERES data? (Regardless of what caused the albedo change or the short 20 years of data)
Second question: Should the slope of the albedo graph above be different (flatter) than the actual global temperature if CO2 caused radiative forcing was at work; since, CO2 caused radiative forcing does not use albedo change energy to cause global temperature rise?
Any answer to these questions would help me understand the CERES data before exploring what caused the albedo change in CERES data. - How much has nuclear testing contributed to global warming?
Bob Loblaw at 11:16 AM on 25 January, 2022Clay Hansen:
I was able to open the link in your first comment. It does not make your argument stronger.
A few key errors:
- Equations 2 and 3 are incorrect. You have assumed that energy in = energy out (solar vs earth's emissions to space).
- It takes time for the earth-atmosphere system to respond to an imbalance between energy in and energy out.
- The speed at which it responds depends on the heat capacity.
- For the atmpsphere only - ignoring land or water - the e-folding time is on the order of 200 days.
- If you include the ocean mixed layer (60 to 70m depth), we are talking a decade or two for it to respond to an energy imbalance.
- The deeper ocean takes even longer.
- It is impossible to model temperatures on an annual basis without inclduing these heat capacity issues and non-equilibrium conditions.
- Equation 4 is incorrect. You have assumed that the energy in can be calculated from the difference between the σT4 terms for solar (6000K) and terrestrial (assuming about 255K or 288K, you don't specify) along with a "shape factor".
- No such constant "shape factor" can be used for both sources (solar, terrestrial).
- σT4 for solar temperature gives a flux at the surface of the sun. The earth is not located that close to the sun. You need to account for the difference in area between a sphere with the radius of the sun, and a sphere with a radius of the earth's distance from the sun.
- The solar radiation received from the sun also needs to be reduced by a factor of 1/4 to account for the area of the earth as a sphere vs the area of the earth as a disk.
- The solar radiation absorbed by the earth also need to account for global albedo.
- You may claim that your shape factor accounts for this - but the "shape factor" for solar radiation (which is simple geometry) is vastly different from any "shape factor" for earth's emissions to space, and you only have one "shape factor".
- Since the solar "shape factor" is purely geometric, it will not vary over time as you assume in equation 5b.
Given these fundamental errors in the first equations of your model, the rest is nonsense. I did not bother to try to follow the rest of your mathematics, as the initial assumptions are fundamentally wrong.
- It's albedo
Bob Loblaw at 02:19 AM on 28 December, 2021blaisct @ 106:
Although it has been almost two weeks since your post, and others have commented, I wish to respond to one statement you have in your opening paragraph. You state:
My understanding has been expanded to include: AGHs hotter temperature will reduce humidity and thus reduce cloud cover, expose more earth surface to the sun thus reduce earths albedo; therefor, albedo vs time for AGHs may not be flat.
The "hotter temperatures will reduce humidity" does not follow. If air temperature increases and absolute humidity does not change, then yes, relative humidity will decrease, but we have no a priori reason to expect this to be the case.
I suggest that you review the use of differnt terms for "humidity", which can get quite confusing at times. Wikipedia has a decent page covering this.
A warmer atmosphere is expected to increase evaporation, which will add water vapour to the atmosphere. This cannot go on indefinitely, and globally we expect a new equilibriium where increased evaporation is matched by increased precipitation. At this new equilibrium, we expect global absolute humidity to be higher, and global relative humidity to be roughly the same as now.
Spatial variation will almost certainly be different, and exactly how cloud cover will respond has uncertainties, but it is not as simple as you describe.
Usually, the incorrect assumption you will see in the comments here goes along the lines of "more evaporation = more cloud". This is also far too simplistic. The balance between temprature, evaporation, cloud formation, and precipitation is a complex and delicate one.
- It's albedo
MA Rodger at 09:45 AM on 17 December, 2021blaisct @108,
You talk of a "correlation in figure 2(f) CERES 20 years 2 (aka Loeb et al 2021)" which I find most odd as I see no correlation there. The figure 2(f) simply presents an attribution of the increasing IEE 2005-20, the sum of the attributions presented in figs 2(d) & 2(e). I thus fail to see any "conflict" between Fig 2(f) & fig 1. The total of the attributed components presented in fig 2(f) (+0.41Wm^-2/decade) is also the trend for the data shown in fig 2(c), CERES data which differs from fig1 only in that it covers a slightly extended period. I am thus not seeing any "conflict".
And do be aware that the "in situ" (data which is in the main Ocean Heat Content data) is presented as a check on the CERES net values. If there was not a good fit between the OHC & CERES data, the CERES data would be seen as le robust with its use within the analysis thrown into some doubt. So the view that CERES should show less trend than "situ data if GHGs were a significant effect" doesn't stack up at all.
Loeb et al (2021) is saying that CERES shows an increasing trend in downward radiation of +0.65Wm^-2/decade, part balanced by an increasing trend of +0.24Wm^-2 upward radiation, yielding a net downward EEI trend of +0.41Wm^-2. And a 'Partial Radiative Perturbation Analysis' attributes this net EEI trend almost entlrely to factors directly or indirectly resulting from AGW, these factors being:-
+0.25Wm^-2/decade due to cloud albedo (which will comprise a reduction in cloud fraction and an indirect aerosol effect which presumably will be negative through this period).
+0.31Wm^-2/deacde due to increasing water vapour (this due to global warming).
+0.22Wm^-2/decade due to "other" effects (dominated by increased GH gases as well as a small solar variation which would have been negative through the period).
+0.18Wm^-2/decade due to secreasing surface albedo (this shown in polar and mountain ragions and thus again a product of global warming reducing ice/snow cover.
+0.01Wm^-2/decade due to a reduced direct aerosol effect.
-0.53Wm^-2/decade due to a warmer planet increasing outward radiation.
I do not see any correlation between albedo and global temperature, certainly not in Loeb et al (2021). Perhaps you could explain where you see it.
These EEI trends acting since 2005 have collectively added some 0.7Wm^-2 to the EEI over the period to a start-of-period EEI of 0.4Wm^-2. Finally there is a concern that these 2005-20 trends are perhaps not representitive of the long-term trend. One factor not addressed by the analysis is the potential for significant short-term effects due to the situation prior to the period (thus the start-of-period EEI of 0.4Wm^-2 may be a poor start point). Loeb et al do consider short-term effects acting during the period 2005-20 that may abate long-term, specifically the PDO.
- It's albedo
blaisct at 01:39 AM on 17 December, 2021MA Rodger @107
Thanks for your comments. The correlation in figure 2(f) CERES 20 years 2 (aka Loeb et al 2021) to GHG was noted but it is in conflict with the extremely good fit of CERES data to in situ in figure 1 CERES 20 years 2 which should show a smaller slope (of the statical fit) than the in situ data if GHGs were a significant effect. The conflict could be explained by the GHG if their effect on cloud formation is so strong that the GHG effect can not be seen in Figure 1 only the cloud effect can be seen; or that the GHG data in Figure 2(f) is confounded with another variable. With just 20 years of data, we can’t tell yet.
My biggest takeaway from the reports in @106 was finally seeing a correlation to albedo that fit the observed temperature rise over 20 years. You are right in that this is only 20 year and not the 150 years of concern.
The unproven theories at the bottom of @106 are just possible theories of unknown significance that may explain the Figure 1 correlation. I put them there incase someone had someone data on the subject. - It's albedo
blaisct at 05:08 AM on 15 December, 2021Once again thanks for your comment (MA Rodger and the editor) and the additional papers on the subject. I will try to do better with the links.
The earlier data I was referring to was earthshine 10 years and CERES 10 years which showed that the data for the earths albedo was very noisy and flat. The flat part was what was expected for anthropogenic greenhouse gas , AGH, global warming. My initial understanding of AGH radiative forcing was that AGHs absorbed radiation (got hot) and that the higher the AGH concentration (at constant radiation) the more heat it could hold back thus the temperature would increase but the energy in vs out of the zone where this occurred would be the same (albedo would be flat). My understanding has been expanded to include: AGHs hotter temperature will reduce humidity and thus reduce cloud cover, expose more earth surface to the sun thus reduce earths albedo; therefor, albedo vs time for AGHs may not be flat.
The new (new to me) data I sited Earthshine 20 years showed a decrease albedo from both earthshine and CERES data – my only interest is this report was the agreement with earthshine an CERES data. The editor’s link CERES 20 years 1 and another link CERES 20 years 2 provided a lot more CERES data with different analyses. These three papers are the first time I have seen data showing a decrease in albedo (increase in TOA radiation) vs time. If all climate change was due to AGHs this graph would be flat. Using the CERES 20 years 2 graph for TOA radiation out. (of the three links I chose this one because it has the In Situ data (earth surface temperature)) one can see the good correlation between In Situ data and CERES data

Figure 1
“Comparison of overlapping one-year estimates at 6-month intervals of net top-of-the-atmosphere annual energy flux from the Clouds and the Earth's Radiant Energy System Energy Balanced and Filled Ed4.1 product (solid red line) and an in situ observational estimate of uptake of energy by Earth climate system (solid blue line). Dashed lines correspond to least squares linear regression fits to the data.”
. If there was any AGH global warming mixed In with the TOA (red) data it would have a slope lower than the In Situ data. The report CERES 20 years 1 did look for the AGH flat line signal and found it in the “Clear Sky” LW (long wave) data but nowhere else (1 of four graphs).
Two of these reports put a lot of emphasis on clouds decrease (new to me). (Decrease in cloud cover increased surface exposure to suns radiation and heats the earth more.) The report CERES 20 years 2 also found correlation to Water vapor, trace gases, surface albedo, as well as clouds. Both of these reports express doubts on the current understanding of climate change and make recommendation to further understand what is causing cloud cover to change.
While this new data is interesting and worth following up on it is still very noisy (low R^2) and another 20 years would be better.
I recognize that AGH global warming would promote other forcing including reduce clouds, reduced ice, reduced snow cover all exposing more surface to direct rays of the sun. Other man-made albedo changes can do the same thing. Here are two examples that may relate to the new papers.
Let’s start with the “heat island effect”, UHI. While the global warming from UHI’s lower albedo is small it does have observable effect on cloud formation, CERES 20 years 2.

“Figure 3
Attribution of Clouds and the Earth's Radiant Energy System net top-of-atmosphere flux trends for 2002/09–2020/03. Shown are trends due to changes in (a) clouds, (b) surface, (c) temperature, (d) combined contributions from trace gases and solar irradiance (labeled as “Other”), (e) water vapor, and (f) aerosols. Positive trends correspond to heat gain and negative to loss. Stippled areas fall outside the 5%–95% confidence interval. Numbers in parentheses correspond to global trends and 5%–95% confidence intervals in W m−2 decade−1.”
When air rises from a UHI it is hotter than the incoming air without a source of moisture to saturate it; so, it leaves as dryer air. This air generally rises and moves to the east. Look at figure 3 (a) and see the lower cloud formation change off the coast of east USA, Tokyo, and downwind Europe. With time (1880-2021) the UHI does not get hotter but it gets bigger thus the volume of low moisture air gets bigger. I am not going to argue the significances of the albedo part of UHI other than to recognize it is lower than 1 W/m^2 but not zero. What UHI is not given credit for is what happens downwind to this hotter low humidity air. Does it cool the ocean, reduce the snow line, melt ice, or reduce the cloud cover down wind, since this hot dry air should rise the clouds should be the first target. I can also see a chain of events: Hot low moisture air (from AGHs, UHIs, or other land changes) rises and go downwind, reduces cloud cover, over water the sun heats the ocean, the hotter ocean currents circulate to the poles, and melt some ice.
I’ll leave the quantification of this observable (figure 3 (a)) new (to me) correlation to others. A new UHI contribution to GW will be the albedo effect + the lower cloud effect + any other.
Second, is land use changes such as forest to crop or pasture land or grass land to crop land. Albedo decrease in grass land to crop land change is documented in Grass to Crops. Forest to crop land change increase in albedo is documented in Forest to Crops. Over 205 years the paper Global albedo study calculates that all the pluses and minuses add up to little change in albedo from land use changes. It is assumed (by me) that decreased albedo of a parcel of land means an increase in temperature and vs/vs. The study Amazonia Forest to Crops shows that increasing albedo does not always mean cooler temps. This report shows that when rain forest was replaced with crop land that the temperature increased, the rain decreased, and the cloud cover decreased. The Figure 3 (e) above shows bright red spot for “water vapor” (I assume that is change to lower humidity) in Amazonia. This is not an uncommon effect from replacing forest with crop or pasture land. The report Forest study observes that forests vs crop/pasture conversion gets warmer as the conversion gets south of 35’N latitude.
This unintuitive (to me) observation that an increase in albedo does not always result in a decrease in temperature can be explained by moisture. The resulting temperature depends on a constant enthalpy (total heat in the air= gases + moisture). Enthalpy is usually determined by the albedo (higher albedo lower enthalpy vs/vs); therefore, land exposed to the same albedo (enthalpy) can have a wide range of temperatures depending on the moisture (relative humidity) of the albedo (enthalpy). This relationship has been captured in a psychrometric chart,
(Sorry for the poor quality of this chart)
Example of a rain forest conversion to crop land: Start out with a rain forest at 25’C (bottom scale) go straight up to 90% humidity curve; this is our hot humid rain forest. If we convert this rain forest to crop land with a higher albedo, we move to a lower enthalpy line (anyone will do). The constant enthalpy line run diagonal (upper left to lower right). If the moisture is maintained at 90% the temperature will drop as expected for the higher albedo. Following the same enthalpy line (same albedo) go to a lower humidity curve that may result (and does in Amazonia) and one will see the temperature will increase (even to above the starting rainforest temperature at very low humidity).
A concern is how NASA and the IPCC pair surface temperature data with relative humidity and albedo. The three all connected in enthalpy. A misunderstanding of climate change could occur if Amazonian (rain forest to crop land) high albedo, high temperature, lower humidity type data was included in correlations with Canadian (forest to crop land) lower albedo, cooler temperatures, high humidity, type data. Does anyone know if this has been looked at? The report CERES 20 years 1 has looked at ocean enthalpy correlations. I have not seen any land enthalpy data. - It's albedo
blaisct at 07:22 AM on 9 December, 2021The data presented earlier in this thread has been updated in document Earth's Albedo 1998–2017 as Measured From Earthshine

Figure 3
“Earthshine annual mean albedo anomalies 1998–2017 expressed as reflected flux in . The error bars are shown as a shaded gray area and the dashed black line shows a linear fit to the Earthshine annual reflected energy flux anomalies. The CERES annual albedo anomalies 2001–2019, also expressed in , are shown in blue. A linear fit to the CERES data (2001–2019) is shown with a blue dashed line. Average error bars for CERES measurements are of the order of 0.2 .”
This new data shows a good agreement between earth shine data and CERES satellite data one can also add the earth’s temperature for this time to this graph and fined good agreement with the albedo (+0.4'C or 0.8 W/m^2 in 20 years). The implication is that the earths albedo change can account for all the temperature rise over this time period. The document suggest that this albedo change was possibly due to reduced cloud cover. Leaving the question what caused the reduced cloud cover.
- CO2 lags temperature
MA Rodger at 01:53 AM on 13 November, 2021Yoshi @635,
I fear you misinterpret the 90% figure. As described by Skakun et al (2012) (& discussed in this SkS post), the 90% is not the percentage of warming coming out of an ice age that is caused by CO2. It is the percentage when increases in CO2 occur prior to increases in global temperature.
The actual post-ice-age warming resulting from increased CO2 is a portion of the GHG warming (which also includes methane). The GHG warming is given as 37% of the total in this CarbonBrief explainer. (The remainder is given as 50% ice albedo & 13% dust & aerosols.) The actual CO2 forcing is about 2.5Wm^-2.
The cooling of the world that leads to a glacial maximum is much slower than the warming of the world that leads to an interglacial. The cooling begins with increased albedo in high northern latitudes as they lose sunlight through the orbital wobbles.
The warming is quicker because it takes less time to melt down an ice sheet than it does to build it up. As with the warming, CO2 reacts to this cooling and increases the effect.
- It's the sun
cph at 21:57 PM on 11 November, 2021
Diagram showing the monthly fluctuations in total global cloud cover since July 1983. During the observation period, the total amount of clouds fluctuated from about 69 percent in 1987 to about 64 percent in 2000. The annual variation in cloud cover follows the annual variation in atmospheric water vapor content, which presumably reflects the asymmetrical distribution of land and ocean on planet Earth.
Within the still short period of satellite cloud cover observations, global cloud cover reached a maximum of about 69 percent in 1987 and a minimum of about 64 percent in 2000 (see diagram above), a decrease of about 5 percent. This decrease corresponds roughly to a net change in radiation of around 0.9 W / m2 within a period of only 13 years, which can be compared with the total net change estimated by the IPCC 2007 report from 1750 to 2006 of 1.6 W / m2 for all climate drivers including greenhouse gas emissions from fossil fuel burning(cooresponds to your mentioned 2,5-3W/m² in 2021). These observations leave little doubt that cloud cover variations can have a profound impact on global climate and meteorology on almost every time scale considered.
The total reflectance (albedo) of the planet earth is about 30 percent, which means that about 30 percent of the incident short-wave solar radiation is reflected back into space. If all the clouds were removed, the global albedo would drop to around 15 percent and the short-wave energy available to warm the planet's surface would increase from 239 W / m2 to 288 W / m2 (Hartmann 1994). However, long-wave radiation would also be affected, which emits 266 W / m2 into space compared to the current 234 W / m2 (Hartmann 1994). The net effect of removing all clouds would therefore still be an increase in net radiation of around 17 W / m2. So the global cloud cover has a significant overall cooling effect on the planet, although the net effect of high and low clouds is opposite.
HK: - "but also through its warming effect through its strong greenhouse effect, which is the most important of all positive (reinforcing) feedbacks on a global level."

According to the current status, the net radiation effect of clouds is -19W / m² (Wild 2019) and corresponds very well with + 0.9W / m² per 5% less cloud cover.
High levels of global cloud cover are associated with low global temperatures, demonstrating the cooling effect of clouds. A simple linear fit model suggests that a 1 percent increase in global cloud cover corresponds to a global temperature decrease of about 0.07 ° C.
- It's the sun
HK at 06:44 AM on 10 November, 2021My point in #1292 was that the 0.5 W/m2 of forcing from clouds and snow/ice is small compared to the overall net forcing over the last 150 years or so and that the albedo change brought up by you is at least partly a direct consequence of the warming, i.e., one of the positive feedbacks.
However, I will admit that clouds and humidity are complex and can be influenced by other factors in addition to the direct result of man-made greenhouse gases. Desertification and deforestation in general and especially cutting down tropical rainforests can have a profound impact on the local hydrological cycle, changing humidity, cloud cover, rainfall and run-off and thus have an impact on the local temperature as well. So yes, man-made climate change isn't only about the greenhouse effect and the warming caused by it, but it's definitely the most important part of it on a global scale.
It's also worth noting that even if the relative humidity seems to have decreased somewhat for the reasons explained here, the absolute or specific humidity has in fact increased, just as expected in a warming world.

Water has an impact on the temperature not only via its removal of latent heat through evaporation – which has a local cooling impact – but also through its warming impact via its strong greenhouse effect, which is the most important of all the positive (amplifying) feedbacks on a global scale. - It's the sun
cph at 22:01 PM on 9 November, 2021HK@1292 - "BTW, if clouds and snow/ice changed by themselves and not as a feedback to warming caused by GHGs, we wouldn't get a cooling stratosphere..."
--- I did not understand your last sentence. I am of the opinion that, for example, a changed cloud albedo cannot be explained by a rise in temperature alone. Changes and anomalies in global mean cloud cover can also be caused by fewer (sulfate) aerosols or expanding deserts (dry regions become drier).
https://www.carbonbrief.org/satellite-data-reveals-impact-of-warming-on-global-water-cycle

Evaporation increases by + 2.3 mm / year, which is not fully compensated for by increased precipitation of + 1 mm / year. A decreasing runoff through the rivers of -1.01 mm / year and a falling groundwater level of -0.75 mm / year quantify the drainage of the continents. This drainage (through drained bogs, wetlands, groundwater, aquifers, canalization of rivers and a constantly growing sealing of urban areas) is just as man-made as the CO² emissions, rising temperatures and the resulting higher evaporation. Too little H²O in desert regions and the earth's atmosphere, which in summer extend through droughts up to the Arctic Circle, are a temperature driver. Too much CO² is just as warming as too little H²O. Less evapotranspiration -> less cloud albedo -> higher incoming radiation energy and record temperatures on the earth's surface -> even faster drying out with even higher temperatures - imho, similar to the ice-snow albedo, form a vicious circle.
The authors estimate a "statistically significant" increase in evapotranspiration of around 10% above the long-term mean (corresponds to a temperature increase over land areas of ~ + 1.44 ° C). During the same period, precipitation only increased by 3% and global river runoff decreased by 6%.
---
What is noticeable here is a simultaneous decrease in relative humidity and cloudiness, which certainly correlates with a general increase in the number of hours of sunshine.

")
- SkS Analogy 25 - Emissions vs Accumulation
cph at 08:33 AM on 9 November, 2021michael sweet@19 - "It appears that large scale irrigation lowers the temperature a little. This has been known for a long time..."
-— What you call a wild plan - I call it water cooling. It is much more efficient than air cooling and is generally described in climate science as the Bowen ratio. While it is ~ 0.1 over tropical oceans and rainforests, it reaches ~ 10 in deserts.
Decreasing surface BR plays a major role in the surface energy budget. It is estimated that the cloud feedback may increase albedo by 0.13 and reduce Rnet by 25 W m−2 in summer over agricultural land.
ms: - " The suggestion of piping enourmous volumes of water to the desert is absurd. / ...all available water is already used for irrigation and no additional water remains. "
-— I suggested a water transfer without pipeline ! Absurd - is to think that you only have to turn on the tap to get water. / Perhaps in the Central Valley people should start thinking about using the water retention measures I described above. - In principle a simple, worldwide request to politics, agriculture, industry but also to private persons to build up extensive water reserves wherever & whenever possible in order to use them generously in plant growth, evaporation, clouds and "water cooling" during periods of drought in spring and summer.
- It's the sun
HK at 01:05 AM on 7 November, 2021"Explained by the cloud and snow / ice albedo that has decreased in the last few decades (0,5W/m² which is a lot)."
The net forcing from the preindustrial period when counting both the positive forcing from the greenhouse gases and the negative forcing from man-made aerosols is now roughly 2.5–3 W/m².
Changes in clouds and the snow/ice albedo are positive feedbacks amplifying that warming. The most important and fastest of those is the water vapour feedback which roughly doubles the initial warming.
BTW, if clouds and snow/ice changed by themselves and not as a feedback to warming caused by GHGs, we wouldn't get a cooling stratosphere or more warming in winter than summer at high northern latitudes.
- It's the sun
cph at 00:09 AM on 7 November, 2021HK@1290 -
"The only explanation making sense is that the Earth gives off less heat to space."
--- Another additional explanation would be the fact, that the earth absorbs more short-wave solar energy from space, although the solar constant(1360,5W/m²) tends to decrease actually.
Explained by the cloud and snow / ice albedo that has decreased in the last few decades (0,5W/m² which is a lot).
- SkS Analogy 25 - Emissions vs Accumulation
Jim Eager at 07:14 AM on 3 November, 2021Are you deliberately missing the point? It has nothing to do with the radiative forcing of H2O, it has to do with the fact that you can not directly increase the amount of water vapour in the atmosphere without first warming the atmosphere, otherwise the added H2O will simply condense out.
Thought experiment: Remove all other greenhouse gasses from the atmosphere except water vapour. What will happen?
The greenhouse effect will be reduced, cooling the surface and atmosphere. As a result the atmosphere will be able to hold less water vapour, so it, too, will be reduced by condensation and precipitation, thereby further reducing the greenhouse effect. As a result the atmosphere will be able to hold even less H2O. And so on. Pretty soon this will effect surface albedo as the precipitated water freezes into snow and ice, which will reflect more sunlight and reduce temperature still further.
The point is you can not directly increase H2O, which means it can not be a driver of greenhouse warming, only contribute to it as a feedback.
As for referring to Wikipedia as an authority on anything, you're joking, right?
- SkS Analogy 25 - Emissions vs Accumulation
Jim Eager at 01:13 AM on 3 November, 2021cph: "what do you think of H2O as the most strongest one"
While H2O is by far the main greenhouse gas, it is condensible at normal Earth temperatures so it can only act as a feedback, not as a driver or forcing. Why? To increase the amount of water vapor in the atmosphere the atmosphere must first warm by some other means, either by an increase in incoming sunlight, a change in surface albedo, or by an increase in CO2 and/or CH4 in the atmosphere, neither of which are condensible at normal Earth temperatures.
cph: "Cows and sheep livestock generate more greenhouse gases as measured in CO2 equivalents than the entire transportation sector."
This is shear nonsenese perpetuated by strident vegans who have hijacked climate change to further their own agenda. See the sector graph MA Roger posted. One could commit the same slight of hand by combining portions of the mining, smelting, petrochemical, manufacturing, and construction sectors related to the tranport system into the transportation total. It is fundamentally dishonest to do that with livestock but not with other sectors, and it renders sector attribution meaningless.
- It's albedo
MA Rodger at 01:40 AM on 26 October, 2021I was reluctant to look into the values of Cloud Radiative Effect by location as up-thread the idea that added cloud & associated albedo came without added warming from water vapour seemed to be too difficult to accept by an insistent commenter and I wasn't sure how supportiive the result would turn out to be.
However, Calisto et al (2014) does provide in its Fig 7 the positive and negative components of CRE by latitude for both Land & Ocean and they can be easilyare here adapted to show net CRE as in the following graphic (assuming the graphic is visible to others when I link to it). The net CRE by latitude is the gap between the bold red trace & the green/blue trace in the upper panels.
- It's albedo
Bob Loblaw at 04:49 AM on 20 September, 2021I have no idea why the "hot link" problem occurs. When a simple click didn't get me to the graph, I tried copying the URL. When that worked, I thought I'd let others know.
The sum of the trends isn't that far off 0:The balance is ET = Pr - Q - dS/dt, or 2.30 = 1.00 + 1.01 + 0.75 ==> 2.30 = 2.76, so only off by 0.46.
(Pr, Q, and dS/dt are defined in the figure in MAR's comment.)
I was able to download the Pascolini-Campbell et al paper through work. They do discuss the uncertainty in trends. On p 544, they say:
"Propagated uncertainty in the trend is greatest for Pr (±0.41 mm yr−1 ), followed by Q (±0.32 mm yr −1), and smallest for dS/dt (±0.05 mm yr −1). This leads to a bounded ET trend estimate of 2.30 ± 0.52 mm yr−1 (determined by summing the square of the error in the trend of each component). The fractional uncertainty from Pr is 61%, 38% from Q and 1% from dS/dt. From this analysis it follows that the ET trend is positive and significant in light of the propagated error, and ranges from 1.78 mm yr−1 to 2.82 mm yr−1."
This is getting off-topic for albedo, though.
- It's albedo
MA Rodger at 05:23 AM on 18 September, 2021The commenter @97 is no-longer a participant here but as this response to his comment @97 is albedo-stuff, I hope the moderators will allow it.
☻ Concerning the spectrum of reflected light in earthshine:- @97, the objection was to Woolf et al (2004) using an arbitrary ordinate scale on their Fig 1 (shown @96) rather than Wm^-2. Addressing this objection (although Woolf et al Fig 2 should have sufficed as it shows a roughly constant % albedo with wavelength), below is a graph of spectrum for wavelengths 0.25 to 6.5 microns (so into the UV) with a Wm^-2 ordinate scale. (Woolf et al above shows the spectrum 0.48 to 0.92 microns, so into the IR.)
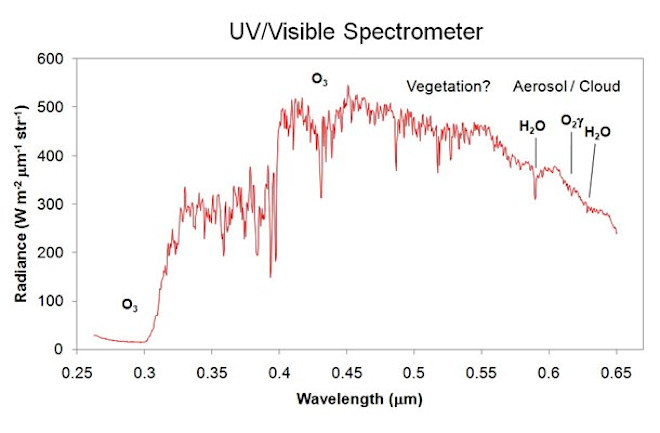
☻ Concerning Wild et al's -19Wm^-2 clear-sky radiation:- Indeed, as commented @97, it is "visa versa" @96 as "cooling" was written in error and should have been "warming" from clear-sky relative to all-sky.
Do note that the cooling from an AGW-induced decrease in albedo is greatly due to the reduction of tropical marine cloud. AR6 provides a better assessment of such cloud today that allows AR6 to state that "A net negative cloud feedback is very unlikely" with a potential range of -10Wm^-2ºC^-1 to +9.4Wm^-2ºC^-1 ['very likely' =1.67sd]. (Although half the range given in AR5, these remain broad confidence intervals.)
Yet the -19Wm^-2 result from Wild et al (2019) was not misunderstood. The value is saying that the net energy balance under clear skys is -19Wm^-2 relative to the global average. (Note a coincidental -19Wm^-2 is also given by Wild et al for Land relative to Global.)
It doesn't follow that a reduction of clear-sky conditions would result in a comenserate cooling of the planet (just as an increase in the land area of the planet would not be expected to increase planetary cooling). It is not so simple.
Note what Wild et al consider their finding would be useful for:- "To better constrain (global climate models from CMIP5), we established new clear-sky reference climatologies." There is no mention of geo-engineering. (And note that if it were, the net planetary cooling would be -19Wm^-2 for the extra cloud and a further -19Wm^-2 for the loss of clear sky - this assuming a 50% global cloud fraction.) However, the impact of altering the global level of clear-sky conditions would depend entirely on the particulars of the alteration.
Indeed, consider the cloud-effect in its totality. If the models take all the clouds out but keep everything the same, the GH-effect is diminished by about 15%. This would suggest increased cloud warms (and so does not cool,) a warming with a back-of-fag-packet global value of [33ºC GH-effect x 3.7Wm^-2/ºC x 15% =] +18Wm^-2. So +ve and not -ve. An interesting result.
☻ Finally, the mistake within the annotations of Fig3 of Pascolini-Campbell et al (2021) - It a trivial mistake (that the value of 2.3mm/yr in Fig3a should be 2.3mm/yr/yr and likewise elsewhere) as the mistake is quite evident. Simply look at the regression line. The graphed regression line rises from an anomaly of -18mm/yr in 2003.0 to +21mm/yr in 2020.0, so a rise of 39mm/yr over the 17-year period graphed = 2.3mm/yr/yr.
- It's albedo
coolmaster at 15:37 PM on 17 September, 2021@96
MA Rodger: you state that "albedo is ... depends primarily on the wavelength of the light that hits the body/molecule." This is not correct. The reflected light is pretty-much independent of wavelength being no more than "bluish". The spectrum of reflected light is thus not significantly different from the spectrum of sunlight.
coolmaster: I'm not sure if you know that e.g. plants are green (wavelength = ~ 550nm), a tomato red (~ 650nm) and blueberries (~ 450nm) blue when illuminated by sunlight with a full spectrum.
Illuminated by a full spectrum (white), the objects appear to your eyes & brain in more or less monochrome light. So - many of the incident wavelengths are absorbed and only single colors are reflected.
A snow surface is white and has a high albedo because all wavelengths are reflected in the range that is visible - nevertheless, snow absorbs very strongly in the long-wave range of IR radiation.
What you describe as "bluish" is the Raleigh scatter.
This has absolutely nothing to do with absorption, relative reflection and albedo.
Your posted graph shows the spectral properties of the light emanating from the earth - and not the energy content of sunlight, that matters in an energy balance.
Without having read the article - I guess you will hardly find the unit W / m², which is the important one for the radiation budget of the earth. So please don't mix it all up here. (MOD)
MA Rodger: The TOA radiation balance under clear sky conditions averaged globally by Wild (2019) shows 19Wm^-2 more cooling than his all-sky average.
coolmaster: No you are utterly wrong - it is vice versa.
Or do you feel yourself cooler in sun under clear sky - and feel heat when a cloud covers the sun ????
The radiation net effect of clouds and water vapor (CRE = -19W / m²) You still seem to confuse CRE with the atmospheric feedback of the clouds, which consists in the fact that with increasing temperature less cloud cover, changed lapse rate and optical depth are determined (+ 0.42Wm-2 ° C-1). Earth - is - loosing - the clouds !
MA Rodger: ☻ And to correct your bold assertions @94 / Your own derivation of a greatly different value of 344km^3/yr uses solely Fig 3a of the former paper which gives an annual rate of increase as 2.3mm/yr (it should actually be 2.3mm/yr/yr)???? and for the 16-year period the increase would be thus 5,500km^3/yr, in the circumstance not a significant difference from 7,000km^3/yr.
coolmaster: 1500km³/yr is more than I suggested to retain.
www.carbonbrief.org/satellite-data-reveals-impact-of-warming-on-global-water-cycle
Can you give us just a reference or a page in the www. quote where the unit mm / yr / yr is used ???? You should then definitely get in touch with Ms. Madeleine Pascolini-Campbell and explain to her that she was mistaken by a factor of ~20.
After all, her work and GRACE-FO are regarded worldwide as one of the most important findings of the last few years. So if you know better - go ahead ... Your pocket calculator with the built-in joker must have been very expensive.
- It's albedo
MA Rodger at 21:30 PM on 16 September, 2021coolmaster @94+,
Trying to keep this on-topic for the thread (and I would have considered transferring this interchange on what is geo-engineering to another thread if it had a chance of being usefully continued), some Albedo issues which you raise.
☻ Firstly, within the deleted comment @95 (still visible to commenters), you state that "albedo is ... depends primarily on the wavelength of the light that hits the body/molecule." This is not correct. The reflected light is pretty-much independent of wavelength being no more than "bluish". The spectrum of reflected light is thus not significantly different from the spectrum of sunlight as Fig1 of Woolf et al (2002) demonstrates.

☻ Your annotated graphics @71 are probably taking the simplisitic calculations a step-or-two too far.
Want we can say from Wild (2014, 2019) is that Land Cloud albedo is shown as 19.7% with Land Surface albedo shown as 26.1%. Likewise Ocean Cloud albedo is given as 23.1% and Surface albedo as 8.1%.
The TOA radiation balance under clear sky conditions averaged globally by Wild (2019) shows 19Wm^-2 more cooling than his all-sky average. Yet this result does not mean that cloud and its resulting albedo is overall a cooling influence. Cloud is well-known to cool if low and to warm if high and the latitude is also important. The usual climatological consideration is whether today cloud presents a positive or negative feedback to a warming world, the present understanding being that it is very likely positive, a position reinforced by recent work (eg Ceppi & Nowack (2021) [Abstract] (@94 you cite resumably IPCC AR6 with a similar finding.)
We have up-thread shown very large increases in anthropogenic water 'use' on land and measured increases in evaporation over land. Thus to suggest an increase in evaopration over land would result in a higher cloud fraction and a strong cooling based solely on Wild's 19Wm^-2 is based on very shaky ground.
And the following back-of-envelope calculations suggest there would not be cooling but warming.
We see from Fig 2 Wild (2014) an all-sky Land Cloud albedo of 64Wm^-2. If cloud albedo were increased 1% that would pro rata present a global climate forcing of -0.19 Wm^-2 cloud albedo but with a loss of +0.05 Wm^-2 surface albedo. There is also reduced OLR cooling of +0.08 Wm^-2 pro rata suggested in Wild (2019) Fig14 and a water vapour forcing from the 1% increased humidity over land of roughly +0.12 Wm^-2. This would suggest a net warming from a 1% increase in Land evaporation of +0.06 Wm^-2, this a warming climate forcing larger than AGW.
☻ And to correct your bold assertions @94 concerning arithmetic. The 10% percent increase in land evaporation 2003-19 reported by Pascolini-Campbell et al (2021) multiplied by the 69,000/yr (+/-10%) land evaporation given by Abbott et al (2019) yields the 2003-19 increase of 7,000km^3/yr I present @93 (along with the references). The other values alongside which you object to are similarly derived.
Your own derivation of a greatly different value of 344km^3/yr uses solely Fig 3a of the former paper which gives an annual rate of increase as 2.3mm/yr (it should actually be 2.3mm/yr/yr) and for the 16-year period the increase would be thus 5,500km^3/yr, in the circumstance not a significant difference from 7,000km^3/yr. - It's albedo
coolmaster at 23:46 PM on 13 September, 2021@GPWayne:
"We know the planet is warming, and that human agency is causing it. What we cannot say yet is how climate change is affecting albedo, how it might be affected in the future, and what contribution to climate change - positive or negative - it may make."
coolmaster: The albedo is relative ... and depends primarily on the wavelength of the light that hits the body/molecule. We should therefore always specify a wavelength range for the albedo. Otherwise, strictly speaking, the entire incoming spectrum of the sun ( UVC140nm up to Micro waves10cm) is decisive. This relativity to the albedo is particularly important for an element as widespread worldwide as H²O. I.e. ice and snow with an albedo of up to 0,9 in the visible range(380-780nm) has an albedo in the micro wave range of only < 0,1.
Albedo of the earth ist 0,3 because absorbtion is 0,7(0,5 on the surface + 0,2 in the atmosphere) --> so the atmosphere has an albedo. Higher concentrations of GHG specially CO² is lowering the albedo of the atmosphere and is thus increasing temperature. We could always increase the albedo elsewhere: clouds, white color in the outdoor area or lighter field crops through foliar fertilization with light clays are just a few of the many possibilities.
The temperature of the earth's surface is globally determined by the radiation balance, the radiation budget. This records the interaction between absorption and reflection as well as re-emission and scattering.
But no matter which albedo you are looking at, whether short or long wave - a higher albedo can never cause a rise in temperature or energy. Conversely, every falling albedo increases temperatures or energy on earth.
So I suggest that you update the last sentence of your basic rebuttal.
@Moderation response: "last warning"
In my last comment, which you would like to see in the slr section, the word albedo appears 3 times - the words clouds and cloud cover even more often. You should also warn others, who do exactly the same(i.e. MAR,BL).
The inseparable connection between albedo - clouds - water and SLR was invented by an immovable mover (Aristotle's definition of God) ! not me !
I don't want to discuss religion here, if only because I don't belong to any official religious community and because my religion is art. For me, climate science is a discipline, just like painting, sculpture, dance, music, and theater, etc.
Nevertheless, I noticed that there once was a man who said he wanted to save the world. Among other things, because he supposedly could move over the water ...
I also want to save the world ... and move (spiritually & physically) over the water.
If you don't like my holistic, alternative climate protection strategy, which lowers sea level rise and earth temperatures - I can't change it, but I can't understand it either. In my opiniont it is the very last opportunity for you, your readers, commentators, your descendants, and the rest of creation to escape from climate hell (as long as anybody presents a much better, faster or cheaper concept.)
That was my last warning to you...
- It's albedo
coolmaster at 10:47 AM on 13 September, 2021MA Rodger93:
MAR: "Your proposed grand scheme seems to be assuming atmospheric water can increase by 0.001335M km^3 annualy, or a 10% annual increase."
No - I never ever assumed, wrote or thought about that I plan or can increase atmospheric water by 1335km³ annualy.
You are making a very similar mistake as Prof. Stefan Rahmstorf from PIK in Potsdam in response to my comment in another climate forum.
Your mistake is probably that you have not read my posts with due attention, even though they are kept very simple and straightforward.
An increase in atmospheric water by 10% / year would mean that, according to the CCF, earth temperatures rise by approx. 1.4 ° C per year. A state of the climate which means certain death for all life on earth.
So you also completely misunderstood me.
My climate protection strategy would like to take the volume of 3.7mm SLR(1335km³) from the global rivers discharge when their water levels are sufficient(&clean) or even specially in flood events after rain- !!! to store it in soil moisture and groundwater over the land mass.
In principle a simple, seasonal storage of retained river water also to adapt to droughts and floods.
In dry seasons, this water will be mainly evaporated from agriculture, but also the before mentioned “amunas” of the old inca culture and their water management are a perfect way to rewet forests & moors.
hidraulicainca.com/lima/sistema-hidraulico-amunas/
This in turn ensures an increasing relative (and specific) humidity and additional cloud formation over land in a regional drought season.
After an average of ~8.5 days in the atmosphere it will return – even with a relatively high probability – as precipitation over another land area. There will be a multiplier effect that increase together with soil moisture and evaporation rate (wet regions become wetter).
As a result, the water cycle over the land areas is intensified by ~ 1-1,5% and thus the increasing size of the annual mean cloud cover over land areas leads to a higher albedo & CRE, which I estimate to be at least a cooling RF of ~ -0.2W/m² / year.
A really cooling, additional radiative forcing, which, in my opinion, can more than compensate for the current annual radiative forcing caused by CO² .
A holistic, functioning climate protection strategy,(stopping SLR AND global temperature rise & adaptation to droughts and floods) which works alternatively and independently of the reduction in CO² emissions, which only promises to stop the temperatures rise perhaps after ~ 2070 (if we as humanity can reduce emissions immediately – which I personally do not believe)
In the latest IPCC report / WG1 Chapter 7.4.2.4.3, the positive feedback of the cloud cover on an atmosphere warmer by 1 ° C is given with +0.42W m-2 ° C-1.
We are slowly but steadily losing not only areas of ice and snow albedo, but also the clouds albedo due to decreasing global mean cloud cover and higher lapse rate.
The cooling CRE with ~-19W m-2 (chapter 7.2.1. in the same report) should decrease accordingly.
The slower warming of the oceans means that there has not been enough moisture evaporated into – and then held in – the air above the oceans to keep pace with the rising temperatures over land. This means that the air is not as saturated as it was and – as the chart below shows – relative humidity has decreased, desertification is spreading rapidly mainly caused by human activities.
Dryness is a temperature driver and cloud killer.
That is why I (as an artist - not a climate scientist) think it's a good idea to create additional “artificial” clouds by additional artificial irrigation retained by river discharge from the superfluous water of the oceans.
---
MAR: but the reported 10% increase in evaporation rate 2003-19 over land equates to some 7,000km^3/y while the reported 3% increase in rainfall equates to 3,300km^3/y and the decrease in direct discharge from land to ocean a further 3,000km^3/y.
This suggests your grand scheme wouldn't make a ha'p'orth of difference. Evaporation over land is shown to have increased five-time the amount you propose yet AGW and SLR continued apace.
coolmaster: ???
360.57M km² ocean area * 3.7mm SLR = 1334.1km³ water = 8.93mm above the land area.
149.43M km² land area * 2.3L / m² increasing evaporation per year = 343.689km³ water.
* 1L / m² increasing precipitation per year = 149.43km³
* -1.01L decreasing runoff through the rivers per year = -150.92km³
* -0.75L decreasing groundwater level per year = -112.07km³
Your calculator probably has a built-in joker.
And if you are holding a PhD, you should hand it over (to me ?) as soon as possible. - It's albedo
MA Rodger at 21:56 PM on 12 September, 2021coolmaster @92,
Your final paragraph is packed full of unsupported assertions which you say will result from your grand scheme of annually diverting 1,335km^3/y of water that would otherwise discharge into the oceans and thus radically increase global albedo through increased cloud. The "unsupported" nature of your assertions is easily demonstrated with the two references you provide.
♣ The graphic you present is from Wikithing but is adapted from Abbott et al (2019) 'Human domination of the global water cycle absent from depictions and perceptions' who provide the numbers in their Fig 3. Relevant to your grand scheme is the size of the various global water reservoirs. The giant reservoir is of course the oceans which hold 1,340M km^3. Next is ice with 25M km^3 and surface/soil water with 23M km^3 while trailing along far behind is the atmosphere holding just 0.0125M km^3 water.
Your proposed grand scheme seems to be assuming atmospheric water can increase by 0.001335M km^3 annualy, or a 10% annual increase. Note this 10% annual increase in atmospheric water would add to the GH-effect, perhaps by some 4Wm^-2 annually, so 100x stronger than today's AGW.
♣ The CarbonBrief reference describes Pascolini-Campbell et al (2021) 'A 10 per cent increase in global land evapotranspiration from 2003 to 2019' which is iteslf paywalled [Abstract] but the reported 10% increase in evaporation rate 2003-19 over land equates to some 7,000km^3/y while the reported 3% increase in rainfall equates to 3,300km^3/y and the decrease in direct discharge from land to ocean a further 3,000km^3/y.
This suggests your grand scheme wouldn't make a ha'p'orth of difference. Evaporation over land is shown to have increased five-time the amount you propose yet AGW and SLR continued apace.
- It's albedo
Philippe Chantreau at 03:03 AM on 12 September, 2021I've followed this exchange somewhat distractedly, but now I'm noticing this from coolmaster when confronted with the lack of cooling that has happened from exactly the physical process he argues would cause it:
"NO. The water consumption of civilization and agriculture has increased steadily with the population growth.
Agriculture in particular, as the largest consumer, has already dangerously lowered and polluted the water table in many places. Consumption continues to rise and the switch to river and rainwater is actually inevitable."
How does that constitute any kind of response? It is completely beside the point and has nothing to do with the initial argument that the retained water would promote cloudiness, change albedo and lower temperatures. From that point of view, where the water comes from is irrelevant. The fact remains that the cooling imagined by Coolmaster from the physical process he described has not happened.
- It's albedo
Bob Loblaw at 11:49 AM on 11 September, 2021coolmaster @ 82:
Congratulations. Another comments policy violation. You can't find anything using Google? Maybe if you look at the Skeptical Science Team page, you will find some clues about my background and why your Google search failed.
It is amusing that you complain about a lack of links or references, when you still have yet to provide a reference for your claim that local surface evaporation will lead to a 1% increase in cloud cover. Just in case you have forgetten it, here is your original claim again:
This volume can be retained by a wide variety of measures before it flows into the oceans and converted into evaporation. - 9L / m² corresponds to ~ 1% of the average annual rainfall over land and should therefore create ~ 1% additional clouds over the land mass.
You repeat a diagram previously linked to. Let's us try to find the evidence we seek in that diagram.
- Cloud cover data? Yes, for three types (high, middle, and low).
- Clear annual cycles, especially for middle and low.
- Global total cloud cover? We don't see sums, but it is obvious that the low and middle cloud amounts are counter-cyclical... when one goes up, the other goes down. Less variation in high cloud. Could it be possible that these cloud types are responding differently to whatever the seasonal cycles are? Maybe there are changes in geographical distribution? Maybe differences between land and sea?
- Trends over time? Yes, And different trends for different cloud types.
Oh, there is that pesky cloud type issue again. Maybe it's actually important?
Now, let's look for evaporation data, so we can finally verify the elusive "1% increase in evaporation causes 1% increase in clouds" story.
Hmmm. I'm looking hard, but I don't see it.
- I see "atmospheric water". Is that "evaporation"? I don't think so. I seem to remember that "evaporation" is a flux from the surface to the atmosphere, not the storage in the atmophere.
- Are we looking at a system where increased evaporation is actually causing these cloud changes? I see no evidence of that.
- Oh, wait. Coolmaster has pointed out that this graph shows "...clouds feedback during the last decades triggered by a warming atmosphere..." My mistake - I thought you were trying to show data that supported your grand theory.
This is typical of what coolmaster has produced here: links to papers or diagrams, with no explanation as to how they are supposed to support his argument, leaving the reader to try to examine the paper or diagram in search of something only coolmaster sees. There is no "there" there.
You seem to like the IPCC reports. Since you appear to have a copy of AR6, I'll skip linking to it. Maybe it has something to say about your grand theory that irrigation can increase evaporation and cool the planet.
[search]
[search]
Oh, maybe this is it!
Section 7.3.4.1 Land use.
It mostly covers albedo changes for land, but the second last paragraph says: "The contribution of irrigation (mainly to low cloud amount) is assessed as –0.05 [–0.1 to 0.05] W m -2 for the historical period (Sherwood et al., 2018)."
Hmmm. With those error bars, it's hard to tell if the effect is positive or negative. It's also the total effect attributable to all the increases in irrigated land over the historical period. If the -0.05 number is correct, would there be a linear response to more irrigated land, so that 100x the historical area would lead to -5W/m2 and offset the CO2 forcing? How much water is used each year for current irrigated land?
That might give coolmaster a glimmer of hope. Why has he not presented this information before? Maybe the more detailed results in the reference the IPCC uses do not support coolmaster's grand theory? Maybe he just doesn't know what to look for?
Maybe coolmaster will eventually provide us with the evidence we need, but I won't hold my breath.
- It's albedo
coolmaster at 09:19 AM on 10 September, 2021BL@78
BL: you double-down on your claim of a strong cooling effect for clouds. Let's examine some actual science.
I have already sent you the current science in this regard. The graphics for the global radiation balances all_sky, clear_sky, land & ocean were created and published by Prof. Dr. Martin Wild / ETH Zurich. He is a very nice person and lead author of the IPCC AR6 WGI Chapter 7: The Earth’s energy budget, climate feedbacks, and climate sensitivity. (Chapters 7.2.1 and 7.4.2.4.3 are relevant for our topic.)
You will not find our topic much more actual and precise anywhere, and if you continue to have doubts about the strong cooling influence of clouds - you should contact with Prof. Dr. M. Wild directly.
BL: summary diagrams are summary diagrams - not detailed models."
You will surely see that a slr volume of 1335km³ / year has to be distributed globally and that I therefore use global, summarizing radiation balances.
Using the posted information in the explanatory file on land use and irrigation,
https://www.frontiersin.org/articles/10.3389/feart.2020.00245/full
you also have the opportunity to observe my claims about irrigation, cloud formation, precipitation, temperature, radiative forcing etc. on a more regional level.
BL: ...it condenses to form cloud, but this is not always the case. ...So will this "extra" moisture cause more clouds? Maybe. Maybe not.
You have provided no scientific justification for this claim, or references to suitable scientific publications to support it. You are completely wrong here. You claim that there is some kind of rest room for water vapor in the atmosphere. Could you please prove that.
99,999% of atmospheric water vapor will form a cloud before it return as precipitation. Dew e.g. is also considered to be a form of precipitation.
BL: As a consequence of increasing evporation, the location where the evaporation occurs will also see less thermal energy transfer to the atmosphere, so temperatures are also affected.
Yes Sir - that´s what I mean. More latent heat flux = less sensible(thermal as you say) heat flux. H²O in the air will form clouds - dry and hot air in the atmosphere will kill them. Soil and air temperatures will decrease - and that's exactly what I intend to do with my strategy. You should also know that the extra amount of 1% precipitation/irrigation/evaporation is planed to released predominantly in spring / summer allways into a relatively unsaturated, dry and hot clear_sky atmosphere, which most closely corresponds to a drought period or desert.
Intensification of the global hydrological cycle is a robust feature of global warming, BUT at the same time, many land areas in the subtropics will experience drying at the surface AND in the atmosphere. This occurs due to a ! limited water availability ! in these regions, where the cloudiness is consequently expected to decrease.
Your speculations about different clouds, with their different effects on the albedo and SW / LW radiation effects, are not conducive to the discussion and are unimportant for my assessments. In a dry, hot, sunny high pressure atmosphere, I guess at least that mostly convective fair-weather clouds or thunderclouds (cumulus or c.-nimbus) will arise.
1% more precipitation / evaporation will not have a major impact on the general cloud pattern. The natural regional variability of the amount of precipitation is often 200mm or more between dry and humid years. Since 9mm more or less per year will regionally cause no noticeable changes in the cloud regime. Maybe there will be 3-4 rainy days/year instead of increasing hours of sunshine.
BL: Coolmaster's diagrams are nice pictures that help illustrate a few aspects...
Again - these diagrams are not mine. They are calculated by professionals of IPCC experts. You have no clue about the difference between water- & air cooling, heat capacity & efficiency. That's your problem - not mine. - It's albedo
coolmaster at 10:43 AM on 3 September, 2021Also in response to blaisct's comment #66 posted over on the Urban Heat Island discussion.
The albedo is relative ... and depends primarily on the wavelength of the light that hits the body. We should therefore always specify a wavelength range for Albedo. Otherwise, strictly speaking, the entire spectrum of the sun is decisive. This relativity to the albedo is particularly important for an element as widespread worldwide as H²O.
As water vapor, it absorbs (28W / m²) largely only in the long-wave range and lets most of the visible light pass through.
As liquid water on the surface, it absorbs long-wave and short-wave light very strongly, although as a cloud in the same aggregate state, finely distributed in the atmosphere, it again reflects a high proportion (-47W / m²) of the high-energy, short-wave radiation.
As solid ice or snow on the surface, it reflects short-wave radiation as well as clouds. On the other hand, in the long-wave range it behaves like a black body and a layer of ice over the open sea isolates the one below
warmer water and prevents it from emitting its heat radiation to the atmosphere and space which in turn relativizes the ice albedo effect.
So @bleisct is not that wrong if he ascribes the Earth's albedo a major influence on global temperatures. The atmosphere (and every single component - including CO² molecules) also has an albedo if the solar spectrum is viewed holistically across all wavelength ranges and light refraction and transmission are taken into account as factors. Higher levels of GHG lower earth`s albedo by absorbing ~20% of radiation energy.
@MA Rodger is right when he remarks that the cloud albedo ingeniously has the strongest albedo and the global albedo(change) is of very minor importance over urban areas.
With a global mean surface albedo of 13.5% and net shortwave clear-sky flux of 287 Wm−2 at the TOA this results in a global mean clear-sky surface and atmospheric shortwave absorption of 214 and 73 Wm−2, respectively. From the newly-established diagrams of the global energy balance under clear-sky and all-sky conditions, we quantify the cloud radiative effects(CRE) not only at the TOA, but also within the atmosphere and at the surface.

 cloud radiative effects (CRE)")
When assessing the earth`s albedo, it`s also helpfull to have a look to the different radiation balances from land and sea and the fact that the cloud albedo is very closely interlinked with latent heat flux of evaporation in the radiation balance.
Do not confuse the strongly cooling CRE (-19W / m²) with the warming cloud radiative feedback CRF of ~ + 0.42Wm-2 ° C-1, which is a missing +RF in the above graphic by @Bob Loblaw as is also the radiative forcing of the ice Albedo effect.
.


- The new IPCC Report includes – get this, good news
MA Rodger at 19:26 PM on 15 August, 2021anticorncob6 @1,
The CO2 budgets quickly become very complicated and comparing them takes a little spade-work. Here is my simplistic take on it.
That 2013 Carbon Budget you link to is quite a generous one, even though it is for +2ºC AGW. Its 1,000Gt(C) emissions budget or 3,664Gt(CO2) with an Airborne Fraction of 45% would yield [1,000 x 0.45 / 2.13 + 275ppm=] 486ppm atmospheric CO2 by 2090 (followed by negative emissions). Other Carbon Budgets, for instance the IPCC SR1.5 budget from 2018 set a budget at 432ppm for a 66% chance of avoiding +1.5ºC AGW, this with large negative emissions to follow the reaching of zero. (My assessment here using the simplistic Af=45%.) The AR6 SSP1-2.6 with its 2% annual reductions for a +2ºC AGW, again followed by negative emissions post 2075, I'd assess at something like 285Gt(C) post-2020 so 474ppm, not greatly less than that 2013 Budget you linked to @1. Mind the real wake-up numbers come from AR5 which put the 66% +1.5ºC AGW at 417ppm.
You mention the "positive feedbacks" and perhaps nigelj @2 should have added that land ice will continue melting away unless global temperatures are reduced, the worry being that Greenland will melt down (taking millennia) with warming somewhere between +1.0ºC & +2.0ºC AGW and with nothing to stop it once its summit drops down to warmer altitudes. And the stability of the West Antarctic ice is potentially even more sensitive to warming.
Specific to being "positive feedbacks" (which melted ice fields are not unless they entirely disappear & so reduce albedo), the melting tundra is also a process which will continue for centuries without a return to a chillier climate. The size of such the feedback from melting tundra will depend on how hot we make it.
Keeping the ice sheets intact and the tundra frozen is one of the more obvious reasons why limiting AGW to +1.5ºC is a sensible policy.
- It's Urban Heat Island effect
Bob Loblaw at 02:38 AM on 15 August, 2021blaisct:
I have also replied to your post # 66 over on the Albedo Effect where Michael Sweet has responded.
- It's albedo
Bob Loblaw at 02:35 AM on 15 August, 2021Also in response to blaisct's comment #66 posted over on the Urban Heat Island discussion.
Blaisct:
You continue to make poor choices in the numbers and calculations that you are doing. Going over your latest effort by number:
1. You continue to select an albedo for urban areas that is too low for anthropogenic surfaces, and you have failed to cite a reference for your value. In my comment # 64 on the Urban Heat Island discussion, I gave a reference to several artificial surface materials, all with albedo values that exceed the the value you have chosen. "Urban" areas are a mix of things like grass, roads, houses, etc. You would need to calculate how much of the surface is covered by each type, and work out an albedo for an "urban" area that way. If that is what you have done, you need to show your detailed calcuations on how you arrive at the 0.08 value.
2. There are no assumptions in the 0.31 albedo value for the earth as a whole. That is based on satellite measurements, and includes reflection from the surface, clouds, clear atmosphere, etc. Note that the only part of the surface reflection that reaches space is the part that makes it back out through the atmosphere and cloud cover. To calculate this in a model (which is what you are trying to do), you need to account for spatial variations (and daily/seasonal cycles) of solar input, surface albedo, cloud cover, and atmospheric conditions.
3 to 14. You continue to make unreasonable assumptions about the area that is undergoing a surface change, and how it relates to population. There is no reason to think that they are related through a simple proportion.
15 to 20. You continue to make errors in converting solar output (1367 W/m^2 measured perpendicular to the sun's rays) to an areal average over the surface of the earth. As MIchael Sweet points out, there is a factor of 4 involved, not a factor of 2. I also mentioned this in my earlier comment. If you do not understand why this is the case, then it is difficult to see how you can expect to do any useful calculations. You also need to consider seasonal variations in solar radiation distribution and seasonal albedo.
21. Converting radiative forcing to global temperature change involves looking at the top-of-atmosphere changes (what is seen from space), not surface changes alone. To properly incorporate surface changes into a calcuation, you need to use a much more complicated model of climate response to surface albedo changes.
22. You still get a wildy incorrect answer, due to bad data input and bad assumptions.
I have not bothered to follow the link to the Mark Healey document you mention. If that is the source you are getting your incorrect ideas from, then it is not worth bothering. The result you quote (that albedo changes can account for all the obsvered temperature rise) is completely inconsistent with the science.
Over at RealClimate, they have recent posted several articles on the just-released IPCC reports. One of those summarizes 6 key results. In that post, they provide the following graph from the IPCC report, which shows the estimated temperature response due to a variety of factors over the last 100 to 150 years. "Land use reflection and irrigation" is the second-last bar on the right. Note that the calculated effect is minor cooling, not warming.

Michael Sweet's suggestion to read the IPCC reports is a good one. I often suggest that people start with the first 1990 report, as this covers a lot of the basic climate science principles in a manner that is easier to understand for the non-expert. In the 1990 report, they mention the Sagan et al paper I linked to in my first comment. Google Scholar can probably help you fnd a free copy.
https://science.sciencemag.org/content/206/4425/1363.abstract
- It's albedo
michael sweet at 01:05 AM on 15 August, 2021blaisct:
From here: It is generally a waste of time to do your own calculations. The albedo of urban areas cannot have changed more that 50%. The area of urban areas is less than 1% of the Earth's surface. A 50% change in albedo in such a small area cannot have such a large effect.
For starters you need to devide incoming solar radiation by 4 and not 2 to account for day/night and the curvature of the Earth.
Vacant land converted into farmland has significant (possibly greater) changes in abedo than urban areas and is a much greater part of the Earth's surface. The melting of Arctic ice causes a greater change in albedo than the rural/urban change does. We see that reflected in the Arctic increasing in temperature faster than the rest of the Earth. If urban areas caused 30% of the warming they would all be extremely hot during the day. This is not observed. If your calculations were correct than albedo changes would account for all of global warming and that is not what is observed.
If you look in the just released IPCC report you will undoubtedly find a chapter on albedo change. See what the scientists say. An old saying among grad students is "An hour in the library will save you a week in the lab". See what you can find in the IPCC report and come back here to inform us.
- It's Urban Heat Island effect
blaisct at 01:01 AM on 14 August, 2021Thanks All for the input. You are increasing my understanding of the albedo effect. I appreciate the articles you mentioned and see that the subject is very complex and calculations like mine are only useful for understanding the simple significance of the many variables and not useful for reaching conclusions or predictions. One general conclusion that seem to come from all the articles and papers is that albedo is most likely significant but there is not agreement on how significant, or the range of each of the variables, or the total interaction of all the albedo variables. I sure hope that the GW experts are improving their models with new NASA satellite data. Does anyone out there know how much of the current GW data (1.1’C) in the IPCC model is accounted for by albedo change?
For entertainment only, I redid the significance of the 0.7% urban of total earth surface what if calculation to include some of the comments.
1. The reported albedo of urban areas is about 0.08 (double the 0.04). (Albedo on a 0.0 to 1.0 scale)
2. The reported total albedo of the earth is about 0.31. (Assume that includes clouds and urban albedo)
3. % of earth that is urban: =0.7%
4. The non-urban area of the earth is: 100%-0.7%= 99.3%
5. The contribution of urban areas to the total albedo is: 0.08 * 0.7% = 0.00056
6. The total non-urban area albedo contribution to the total is: (0.31-0.00056)/ 0.993 = 0.31162
7. Assume the non-urban area albedo in the 1880 era was the same as today: =0.31162
8. Current earth population is about = 7.8 B
9. 1880 era population is about =1.3 B (Using 1880 as the approximate start of IPCC temp data)
10. Assume the 1880 era urban area was proportional to population: = 1.3/7.6*0.7% = 0.12%
11. The 1880 era urban area contribution to total albedo was: 0.07*0.12% = 0.0000933
12. The 1880 era non-urban area contribution to the total albedo was: (1- 0.12%)*0.31162 = 0.311257
13. The 1880 era total albedo estimate is: 0.311257+ 0.0000933 = 0.311351
14. The difference in 1880 vs 2021 albedo is : 0.311351 – 0.31 = 0.00135 (or about 0.14% albedo change)
15. The reported output of the sun reaching the earth is about: 1367 W/m^2
16. Assume that the urban albedo is only seeing one half (balk of urban areas are in the middle half of the earth’s surface) of the above due to the curvature of the earth: 50%
17. Average surface of the earth cloud cover: =67%
18. Average albedo of clouds: = 50%
19. Total sun’s output reaching cloud covered urban areas + non cloud covered urban (corrected for curvature) is : 455 W/m^2.
20. Therefore, this energy of the albedo difference is: 0.00135* 455= 0.61W/m^2
21. I have seen conversion factors for converting this to ‘C in earth temperature rise of 0.5 to 0.7 ‘C/W/m^2. I’ll use the 0.5.
22. The equivalent earth temperature rise of the above albedo change from 1880 to now is: 0.61*.5 = 0.31’C
The IPCC reported temperature rise over the 1880 to now is about 1.1’C. This what if calculation implies that a 0.7% urban area could account about 30% of this temperature rise – not insignificant.
One of the papers (in your previous references) on land use albedo change seems to agree that man-made albedo changes (mainly in agriculture by Mark Healey https://www.scirp.org/pdf/ijg_2020062914563820.pdf) are significant and could account for all the IPCC temperature rise. Mark Healey’s paper suggest that land use changes since 1910 are stronger than the UHI albedo effect.
I am switching over to the “It’s albedo” thread. What are all the possible albedo changes since 1880? - It's Urban Heat Island effect
MA Rodger at 06:51 AM on 28 July, 2021blaisct @62,
Perhaps repeating some of the criticism @64:-
You say "The IPCC seems to give man-made albedo changes low significance because it is hard to measure and hard to detect change." But difficulty does not appear to be something to dampen your enthusiasm.
Do note that 0.04 albedo is far too low and, while potentially applicable to a sky-pointing piece of asphalt, is not applicable to urban areas. Also note that clouds float above cities forests and oceans alike and they contribute some 75% of the planet's albedo. And also note that the sun sets every evening and never rises to be overhead except at noon in the tropics. You need to divide the tropical noon-day value by four to satisfy the very simple geometry of spheres.

The solar radiation actually reflected spacewards by the Earth's surface is shown in the diagram at 23Wm^-2. If by 2100AD, the planet's urban spread were somehow to reach over 0.7% of the planet's surface area (as the most extreme projection in the graphic @60 suggests is possible) and even if that 0.7% had an albedo of zero, that 23Wm^-2 would only reduce by [23 x 0.007 =] 0.16Wm^-2 which, despite the use of the most exaggerating numbers, is significantly smaller (x10 smaller) for 2100AD than the value you arrive at for today's value. Using more realistic numbers would return an insignificant result (x100 smaller).
- It's Urban Heat Island effect
Bob Loblaw at 06:45 AM on 28 July, 2021Blaisct @ 62.
As Rob Honeycutt says, there is something clearly amiss in your calculations. Let me point out the obvious ones.
1. You do not cite a sources for your urban albedo of 0.04. Wikipedia lists 0.04 as a value typical for fresh asphalt. Most urban areas are not fresh asphalt. I have a well-worn copy of Tim Oke's Boundary Layer Climates, where he lists typical urban surafaces as follows (p 281):
- Asphalt 0.04 to 0.20
- Concrete 0.10 to 0.35
- Brick 0.20 to 0.40
- Roofing materials (various) 0.08 to 0.35
Your estimate of urban albedo is way too low.
Typical natural land surfaces (Ok.e op cit, p 12)
- Soils (wet to dry) 0.05 to 0.40
- Deserts 0.20 to 0.45
- Grass 0.16 to 0.26
- Crop land 0.18 to 0.25
- Forests 0.05 to 0.20
You need to consider just what urban material is replacing what natural material. Then you can estimate a change in albedo. Most urban landscapes are not that different from natural ones.
4. Global albedo is not just a surface albedo. You need to factor in cloud cover. For a global cloud cover of 50%, only half the surface is seen from space - and surface albedo changes only have half the effect you get when you ingore cloud cover. You'd need to know the cloud cover over the urban areas you are doing calculations for.
Your estimate of the contribution of urban surface albedo is an over-estimate. A serious over-estimate.
7 through 13. Urban area is not proportional to population. Haven't you ever noticed how much more closely packed people are in cities, compared to rural areas? Population density is not uniform. Oke (op cit, p291) notes that the urban heat island effect tends to be proportional to the log of population, not linear. You are seriously over-estimating the amount of global albedo change in relation to urban population growth.
14 and 15. The 1367 W/m^2 figure is for a measurement perpendicular to the sun's rays, in full sun. To compare to CO2 and other forcings, you need to divide by four, as the CO2 forcing is calculated for the entire globe, perpendicular to the earth's surface - not the sunlit side perpendicular to the sun's rays.
You are over-estimating the effect by a factor of 4.
16. As you have the wrong forcing in W/m^2, you are getting the wrong temperature rise.
17. Essentially, garbage in, garbage out.
Real scientists have been doing this the right way for decades. Try this one from way back in 1979:
https://science.sciencemag.org/content/206/4425/1363.abstract
- It's Urban Heat Island effect
blaisct at 03:59 AM on 28 July, 2021Thanks MA Rodger, my fault, I used the % (3%) of the earth land mass that was urban instead of the % of the total earth that was urban. The number from your graph of 0.7% urban (of the total earth area) seems to agree with other published information. I assume the heat from the “heat island” effect would be well mixed around the earth and become part of the total measurement of climate change. I present the following to check out the significance of the 0.7%.
1. The reported albedo of urban areas is about 0.04. (Albedo on a 0.0 to 1.0 scale)
2. The reported total albedo of the earth is about 0.31. (Assume that includes clouds and urban albedo)
3. The non-urban area of the earth is: 100%-0.7%= 99.3%
4. The contribution of urban areas to the total albedo is: 0.04 * 0.7% = 0.00028
5. The total non-urban area albedo contribution to the total is: (0.31-0.00028)/ 0.993 = 0.31190
6. Assume the non-urban area albedo in the 1880 era was the same as today: =0.31190
7. Current earth population is about = 7.8 B
8. 1880 era population is about =1.3 B (Using 1880 as the approximate start of IPCC temp data)
9. Assume the 1880 era urban area was proportional to population: = 1.3/7.6*0.7% = 0.12%
10. The 1880 era urban area contribution to total albedo was: 0.04*0.12% = 0.000047
11. The 1880 era non-urban area contribution to the total albedo was: (1- 0.12%)*0.3119 = 0.31154
12. The 1880 era total albedo estimate is: 0.311538+ 0.000047 = 0.311585
13. The difference in 1880 vs 2021 albedo is : 0.311585 – 0.31 = 0.001585 (or about 0.16% albedo change)
14. The reported out put of the sun reaching the earth is about: 1367 W/m^2
15. Therefore, this albedo difference is: 0.001585* 1367 = 2.1680W/m^2
16. I have seen conversion factors for converting this to ‘C in earth temperature rise of 0.5 to 0.7 ‘C/W/m^2. I’ll use the 0.5.
17. The equivalent earth temperature rise of the above albedo change from 1880 to now is: 2.168*.5 = 1.08’C
The IPCC reported temperature rise over the 1880 to now is about 1.0’C. This calculation implies that a 0.7% urban area could account for all of that temperature rise. I know this is over simplified, and was only done to find out the significance of small changes in a higher heat source ( over 4X lower albedo in urban areas vs the earth as a whole) on the earth surface. Other factors in albedo change should also be included: roads, forest fires land area, sea ice melting, land ice melting, rain forest destruction, and farming practices. I can only guess that including these albedo changes in the above would increase the man-made albedo global warming calculation.
The IPCC seems to give man-made albedo changes low significance because it is hard to measure and hard to detect change. Population change and even atmospheric CO2 change should also be an indicator of historical man-made albedo change, just need a reference point. - It's Urban Heat Island effect
blaisct at 02:23 AM on 22 July, 2021Should we be looking at the surface area of the earth these differences in trends represents? These graphs would better be related to climate change if they included some correction for urban area change. Over time this urban area may be increasing (and suburban area decreasing) thus the total heat into the atmosphere is also increasing proportional to that area change. I expect that including urban area increase due to population would show a significant increase in total heat going into the atmosphere over time vs the suburban areas. When urban areas of the earth were small (less than 1%) the “heat island” effect was probably insignificant. Now that the urban area is over 3% of the earth’s surface an area correction is needed. There may also be some differences in the albedo of cities due to construction practices and population density.
More than 100 comments found. Only the most recent 100 have been displayed.

More than 100 comments found. Only the most recent 100 have been displayed.


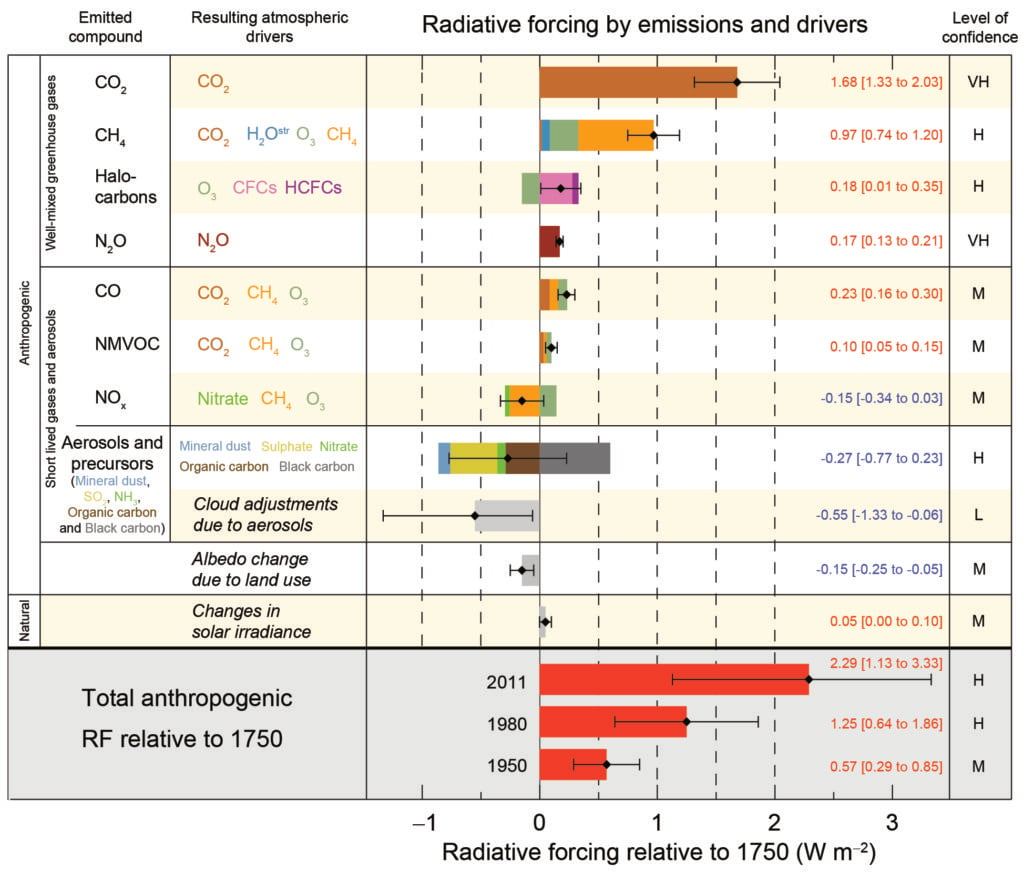
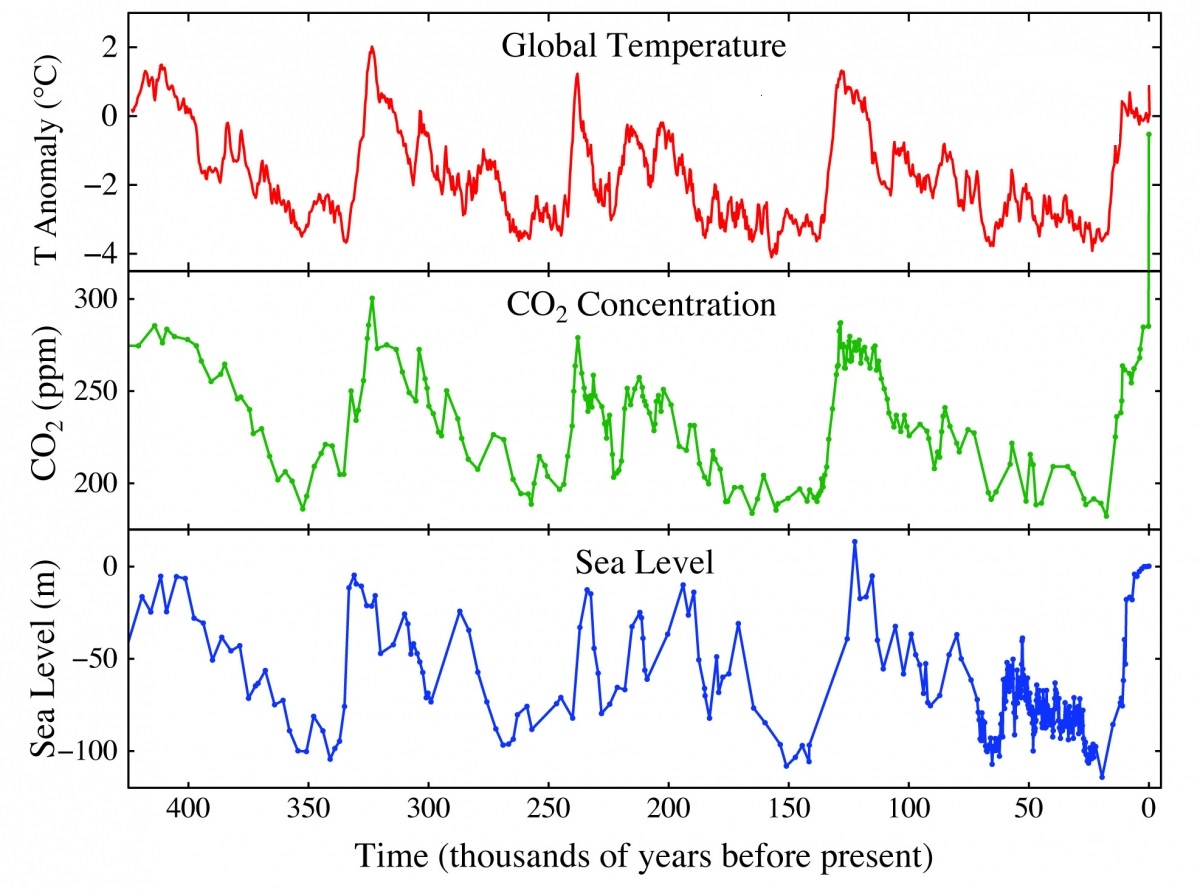
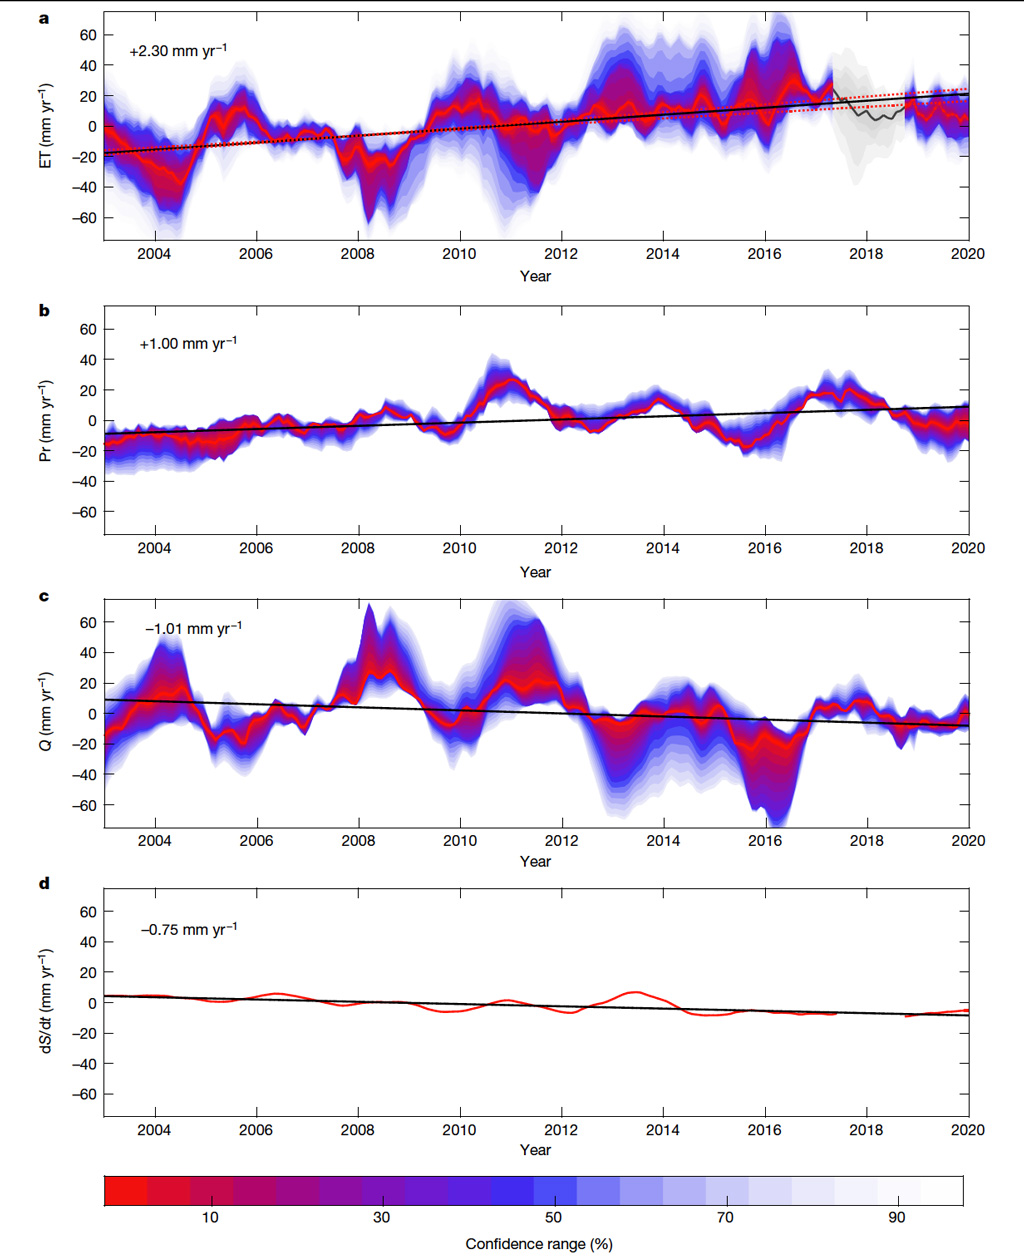
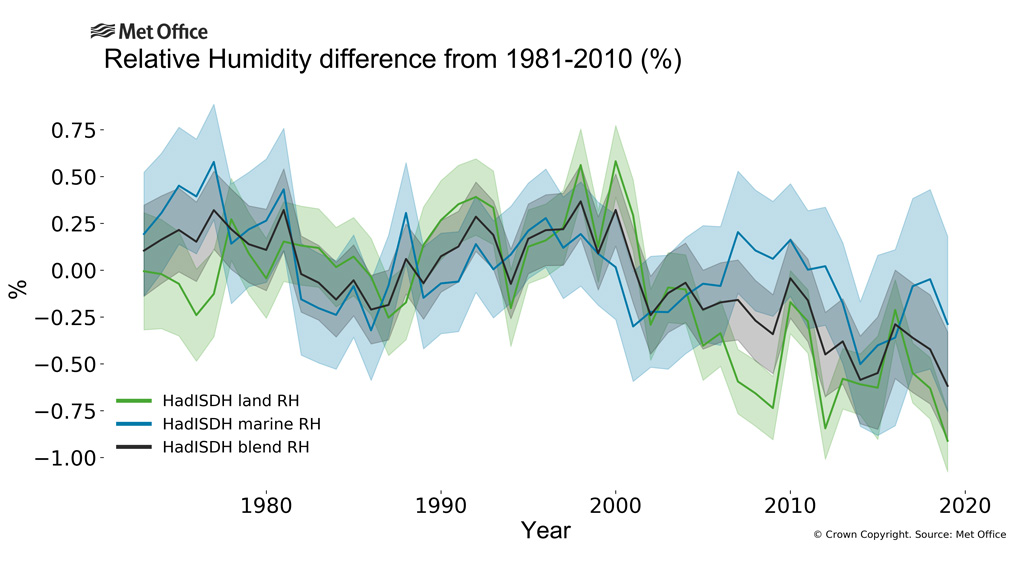
.jpg)
THE ESCALATOR

(free to republish)