


 Arguments
Software
Resources
Comments
The Consensus Project
Translations
About
Support
Arguments
Software
Resources
Comments
The Consensus Project
Translations
About
Support
![]()
![]()
![]()
![]()
![]()
![]()
![]()
![]()
![]()
![]()


![]()


Latest Posts
- Skeptical Science New Research for Week #31 2026
- The government canceled this nature study. Scientists finished it anyway.
- Fact brief - Do solar plants require backup from fossil fuels?
- Hot days, cold thermometers
- 2026 SkS Weekly Climate Change & Global Warming News Roundup #30
- Skeptical Science New Research for Week #30 2026
- Canada's boreal wildfires aren't just bad forest management
- Dangerous and historic wildfire smoke pollution event engulfs the U.S. and Canada
- The Strongest El Niño Ever
- 2026 SkS Weekly Climate Change & Global Warming News Roundup #29
- Skeptical Science New Research for Week #29 2026
- Home batteries could become the next must-have household appliance
- Fact brief - Do electric vehicles stop working in extreme heat?
- Deadly heat wave in France shows the future of climate risk
- 2026 SkS Weekly Climate Change & Global Warming News Roundup #28
- Skeptical Science New Research for Week #28 2028
- Six charts show how clean power was world’s largest source of new energy in 2025
- Eastern U.S. broils after heat wave kills over 1,300 in Europe
- How climate change influences extreme weather
- 2026 SkS Weekly Climate Change & Global Warming News Roundup #27
- Skeptical Science New Research for Week #27 2026
- Climate Adam - Is Climate Change Ramping Up El Niño Risks?
- Fact brief - Are injuries from wind turbines common?
- How bad is AI for the environment?
- 2026 SkS Weekly Climate Change & Global Warming News Roundup #26
- Skeptical Science New Research for Week #26 2026
- What Americans can learn from London’s war on cars
- New Publication: Identifying Flawed Reasoning in Contrarian Claims about Climate Change
- The Merchants of Doubt are coming for Extreme Event Attribution science
- 2026 SkS Weekly Climate Change & Global Warming News Roundup #25
Comment Search Results
Search for co2
Comments matching the search co2 :
- Dangerous and historic wildfire smoke pollution event engulfs the U.S. and Canada
prove we are smart at 13:20 PM on 22 July, 2026Lets be clear, 25% of the CO2 in the globes atmosphere has been spewed out by one country to last for centuries. This country willingly elects known climate change deniers as their leaders and role models. May the smoke from these new normal fires settle over their land and force the consequences of climate change inaction into their thoughts.
- From the eMail Bag: the Beer-Lambert Law and CO2 Concentrations
Bob Loblaw at 05:49 AM on 22 July, 2026a female Faust @ 34:
Three problems with your idea of using CO2 in water:
- You need to use a source of radiation that is at a wavelength where CO2 absorbs. That means a non-visible source of radiation (somewhere in the IR band). You will not be able to see the radiation with the human eye - you'd need an appropriate detector.
- Liquid water absorbs IR radiation pretty much completely. Adding CO2 will not absorb more, as all relevant IR radiation is already absorbed.
- As a near-perfect absorber of IR radiation, liquid water also is a near-perfect emitter of IR radiation. Any IR radiation detected coming from the liquid water will be IR radiation that was emitted by the water, not passing through it.
- From the eMail Bag: the Beer-Lambert Law and CO2 Concentrations
a female Faust at 02:19 AM on 22 July, 2026re your experiment: i am curious what you think would result from using CO2 itself, rather than dye, to adulterate the water (and if you think that information interesting, relevant, or useful). curious enough that i had to sign up to submit this comment...curious enough, in fact, that, especially should that curiosity be shared, i may just have to replicate the experiment with that alteration, that is, using water that is carbonated instead of coloured.
- Dangerous and historic wildfire smoke pollution event engulfs the U.S. and Canada
prove we are smart at 18:39 PM on 21 July, 2026Here is another example of the environment affecting the people in a very damaging way. Along with increasing horrific algae blooms, fresh water declines, weather patten anomalies, ad nauseam.
Many people understand the existential threat the co2 increase in the atmosphere is creating day by day, yet till it affects them meanfully, personally and constantly, this is what most people in the world really worry about, www.gallup.com/analytics/701519/worlds-most-important-problem-report.aspx?utm_source
We can come together every 4 yrs for sport or to save our ozone layer yet I'm told constantly not to scare people with the truth of an increasingly malevolent weather from our modern industrial practises and lifestyles.
- Six charts show how clean power was world’s largest source of new energy in 2025
Philippe Chantreau at 11:44 AM on 11 July, 2026I'm not one to condemn nuclear systematically, but also not one to give a pass to ERCOT. In the Texas outage of 2021, one could legitimately make the argument that the (much) larger share of gas/combined-cycle suddenly reduced, and the expectation that it is supposed to be baseload, i.e. not subject to weather, were factors.
Taking a swipe at wind power like their politicians did was grandstanding nonsense. However, I noticed from the link provided by David acct that even coal dipped when the thing went down, so there is certainly an issue with the larger picture, including grid and exchanges with neighboring states. The integration of the European grid is a strength and France still has one of the lowest CO2/kw of electricity in Europe. However, they are facing problems, as the current very longand intense heat wave shows.
- Greenhouse effect has been falsified
MA Rodger at 17:15 PM on 27 June, 2026Philippe Chantreau @225,
The work you cite concerns the mesosphere/thermosphere which are a long way up and far enough not to significantly impact surface climate. The stratosphere which is close enough to have an effect thro' the tropopause is also still giving up the details of its inner workings. Published just last month Cohen et al (2026) 'Stratospheric cooling and amplification of radiative forcing with rising carbon dioxide' was paywalled until a couple of days ago. (The pre-print version was a bit too dramatic with some of its language.) A cooling stratosphere warms the troposphere below as well as outer space. Cohen et al describe the detail of the interactions between rising CO2 and the H2O and O3 up there.
- Greenhouse effect has been falsified
Bob Loblaw at 10:16 AM on 26 June, 2026NOGHE4ME:
In addition to MA Rodger's comment, I'll say the following.
You claim "The claim that the Earth's Surface emitts 340w m**2 has been disproved experitmentally.[sic]" Well, here is some experimental (read "real" or "measured") data that shows the earth's surface emitting considerably more than 340 W/m^2 - varying from about 375W/m^2 at the coolest time of day, increasing to over 450W/m^2 at the hottest part of the day for that location and date.
- Since this measurement shows that the surface is quite capable of emitting 340W/m^2 (and more..), how does your physics explain that measurement?
- If by "surface", you mean upward-directed IR radiation in the atmosphere at some distance above the surface, then please clarify. But in that image, also note that the downward-directed ("IRin") flux from the atmosphere back to the surface ranges from about 275W/m^2 to over 375W/m^2. So the atmosphere is also quite capable of emitting 340W/m^2.

As MA Rodger points out, your argument about CO2 losing energy to surrounding molecules skips over the part where CO2 also gains energy by collision with other molecules. That's why CO2 will be at the same temperature as other molecules: the higher-energy ones pass energy to lower-energy ones, passing energy back and forth, until things average out. You can read the details over at Eli Rabett's blog.
The simple fact is that CO2 will always emit some IR at 15um as long as it is at a temperature above 0K. To argue otherwise ignores more than a century of physics.
Your "version 1.0" is simply wrong. Your version 2.0 is also far too simplistic. There is a version 3.0 out there that you need to learn, that explains the role of CO2 in atmospheric radiation, and how it is involved in the greenhouse effect.
- Greenhouse effect has been falsified
MA Rodger at 09:17 AM on 26 June, 2026NOGHE4ME @221,
So let us indeed be "ignoring #1 for a moment." If CO2 is not re-emiting IR at 15mu, where is all the IR at 15mu measured within the atmosphere coming from?
It is true that the vast majority of such IR when absorbed by CO2 in the atmosphere results in IR-excited-CO2. That excitation is almost always neutralised by collision and the energy transferred to thermal in the atmosphere.
What you overlook is the vast number of CO2 molecules excited by collision. And in the same manner as the IR-excited-CO2, most of that collision-excited-CO2 will in turn be neutralised by collision. But because there are so many collisions and thus so many more collision-excited-CO2 than IR-excited-CO2, the number of them that do not get neutralised by collision but instead relax to emit 15mu IR. Effectively the rate of emission is the same as the rate of IR-excitation of CO2.
And it has to be this way or the laws of thermodynamics won't work.
Concerning your assertion that "These two pieces of evidence are more than sufficient to falsify the hypothesis," can you clarify what "these two pieces of evidence" comprise? Your comment is far from clear in this matter.
- Greenhouse effect has been falsified
NOGHE4ME at 05:14 AM on 26 June, 2026Has the Greenhouse Effect Hypothesis been falsified? I think the answer depends on which version of the Hypothesis you are speaking of. I think we can agree that the Earth's Atmosphere is an isulator that keeps the plant warm and supports life. There are at least two versions. The two versions differ largely on what is the predominent energy transport mode in the "lower" atmosphere. 1) Version 1.0 suggests the 'predominent' energy transport mode in the lower atmospher is conduction and convection (latent heat) and no contribution from IR or CO2. 2) Version 2.0 is IR and C02 predominently driven from the bottom to the top of the atmosphere. Version 1.0 is grounded in basic physics and needs little explanation. Version 2.0 has a least two fatal flaws. #1, The claim that the Earth's Surface emitts 340w m**2 has been disproved experitmentally. I would direct you to Tom Shula's YT video. https://www.youtube.com/watch?v=NS55lXf4LZk. #2) The hypothesis calls for CO2 to asbsorb AND emit IR. Ignoring #1 for a moment, C02 in the atmosphere, while capable of absorbing IR at 15mu, it does NOT re-emit IR as called for. The reason is that the CO2 molecule in the excited state loses it's energy to surrounding non-IR gases (N2 and O2) thru a process called thermalization. The quenching rates for C02 are well documented e.g. Siddles, WIlson, and Simpson. These two pieces of evidence are more than sufficient to falsify the hypothesis.
- Plateauing CO2 emissions have slowed atmospheric growth
MA Rodger at 01:40 AM on 24 June, 2026michael sweet @8,
Further to the 'Texas annecdote' @7, the value of 10,000 sq miles as the area of solar PV in Texas to provide all the primary energy used by USA is indeed low. Perhaps 20,000 sq miles would be a better value.
A simplistic calculation would run as follows:-
The daily solar irradiance in Texas averages up to 6.6kWh/m^2 = 6.6e3Wh/m^2 = (x 1.6e3^2) 1.7e10Wh/sq mile.
Thus with a 20% PV efficiency, annual output would be (1.7e10 x 0.2 x 365 =) 1.23e12 Wh/sq mile = 1.23e16Wh/10,000 sq mile.
The annual US primary energy use is 2.6e16Wh.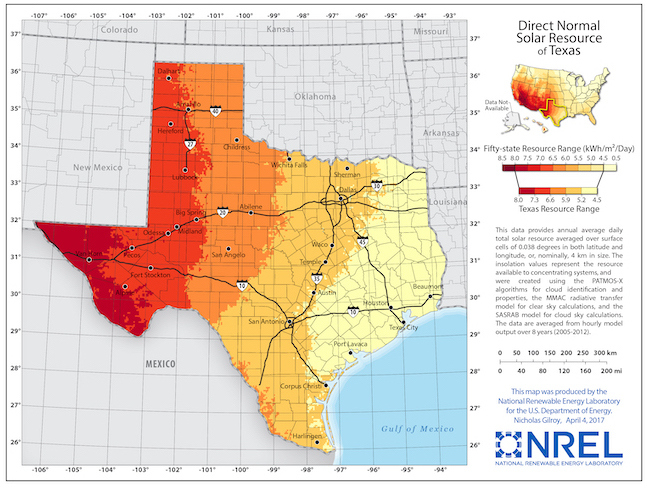
And this result is generally in agreement with this decade-old Fact Check of an Elon Musk statement which was shown correct. This was that 10,000sq km (or 4,000sq miles) of solar PV in Texas would produce the 425GW (= 3,725TWh) of electricity used annually in the US. The calculated output was 500GW (= 4,380TWh). That would equate to (4,380TWh x 2.59 =) 1.13e16Wh, The PV efficiency is put at 24% with the location the slightly-less-sunny NW Texas rather than W Texas.
The other half of the anecdote was the area of US that has been strip-mined for coal. The Ai function on Google offered up a reference that talks of a land area of 4 million hectaes (=10,000 sq miles) in the US that "open-pit mining of 124 billion tons of coal in the United States will destroy." [My Bold] Sadly this is derived from "data released by the National Research Council (NRC) of the United States" but the actual NRC document is not referenced. (The Google-offered reference concerns open-caste coal mining in Mongolia not the USA.)
However, this reference does give a measure of land 'destroyed' by open-caste coal mining. And data on good-old Wikki-thing shows perhaps 30 billions tons of open-caste-mined coal produced in the US since 1945. This suggests the land 'destroyed' by US open-caste coal mining is perhaps 2,500 sq mile.

Mind, there is another comparitor, The electricity that could be generated by that 10,000sq-mile-destroying mining, 124 billion tons would (generously) amount to [2e6Wh/ton x 1.24e11 ton =) 2.48e17Wh, enough to provide all US primary energy for 10 years. As well as the 10,000 sq mile of 'destroyed' land, this coal-use would double global CO2 emissions for that 10 years.
It's a shame the Solar PV required to provide the same annual energy output (and provide it for ever) would be twice the area. Perhaps in the future when the PV efficiencies are improved and if the calorific value of US coal continues to fall, those land areas will be more comparable.
- Plateauing CO2 emissions have slowed atmospheric growth
MA Rodger at 18:39 PM on 20 June, 2026johnpead @6,
I can't accept that CO2 emissions are 'falling'. They are barely staying flat, and that due to reductions in emissions from Land-Use-Change.
To put some numbers on that from the GCP 'budget':-
Average Annual Global CO2 Emission increases
... ... ... ... ... Fossil Fuel ... ... [LUC emissions]
1990-2000 .... +82Mt(C) ... ... [+4Mt(C)]
2001-2012 ... +215Mt(C) ... .. [+12Mt(C)]
2013-2024 .... +83Mt(C) ... ... [-48Mt(C)]
But to address your question, the additional annual atmospheric CO2 burden is often called the "Airborne Fraction" which very roughly sits a 50% of annual emissions. But this fraction is not a single year thing. The draw-down of our emissions into ocean & biosphere is a multi-year thing. Thus that 50% comprises illustratively 3.00% of year one, 2.90% of year two, 2.75% of year three, etc, this draw-down completed over a millenium when about 75% (or less for high levels of emissions) in total will have been drawn out of the atmosphere. The final tiny-tiny component is absorbed when the last bit of deep ocean water eventually surfaces and absorbs its CO2. The remaining 25% requires geological processes or a helping human hand.
So if emissions level-off, the Keeling Curve will stop bending upwards, accelerating. Identifying that disappeared acceleration amongst the wobbles will take a decade or two. If there were a drop to 50% of our emissions, the Keeling Curve will plateau a while, and if emissions continue to fall below that 50%, the Keeling Curve will dip.
That doesn't sound very encouraging. That is not to say the problem is unnsoilvable. My own view of it is that solar PV is the solution along with its use for hydrogen/ammonia/methane production.
I recall an anecdote from a couple of decades ago. A clever environmentalist tells a dumb climate skeptic that the USA could get all its energy requirements (so all primary energy) from 10,000 sq miles of solar farms in Texas. The skeptic replies that 10,000 sq miles is a massive area - the task is far too great to be delivered. The environmentalist responds that 10,000 sq miles is massive but it is the area of forest/mountain strip-mined for coal in the USA, a far-harder task which didn't prove too great, and that all this mined coal is now burned and gone. With coal you have to keep mining. The solar PV will keep on delivering.
(I won't vouch for the numbers being right.)
So there is a solution to hand (and likely other scaleable technologies as well) and if it (they) were embraced as strongly as then-there tech-bro AI projects (and money-wise it has a far far stronger basis for investment) we could deliver that solution.
What is depressing is the evident denial within the political sphere that we are still not doing anything like enough to reach net-zero (& the net-negative that must follow). The graphic below shows the scale of the problem.
In terms of the warming, things are more encouraging. The delay in warming and the delay in draw-down sort-of cancel each other out. Modelling shows that, very roughly, net-zero also brings zero-warming. The draw-down of CO2 drops the climate forcing providing cooling. And that sort-of matches the delayed in-the-pipeline warming. (The detail of this 'matching' isn't entirely forthcoming. CH4 & N2O have shorter atmospheric residency and are substantial contributors to AGW [respectively 25% & 10% of CO2's forcing] and are surely significant in those 'matching' result.)
- Plateauing CO2 emissions have slowed atmospheric growth
nigelj at 07:56 AM on 20 June, 2026johnpead @1
You ask - "How confident can we be about estimated annual emmissions?"
I was discussing this somewhere else, and include the following studies I found which indicate we can be reasonably sure about the accuracy of estimated emissions and emissions reported by individual countries:
1) Emanuele Solazzo, Robbie M. Andrew, and Greet Janssens-Maenhout. Annual estimates of global and national CO2 emissions from fossil fuels: tracking revisions to the United Nations energy statistics database input energy data. Environmental Data Science (Cambridge University Press). June 2022
2) Brendan Byrne, David F. Baker, Sourish Basu, et alia. National CO2 budgets (2015–2020) inferred from atmospheric CO2 observations in support of the global stocktake. Earth System Science Data (ESSD). March 2023
3) Christopher W. O’Dell, David Crisp, David F. Baker, et al. The Orbiting Carbon Observatory-3 (OCO-3) mission: Early science results from space-based observations of localized CO2 emissions. Remote Sensing of Environment. December 2022
- Plateauing CO2 emissions have slowed atmospheric growth
MA Rodger at 14:42 PM on 19 June, 2026johnpead @1,
You ask - "How confident can we be about estimated annual emmissions?"
The number cited by the OP come from the 'budgets' of the Global Carbon Project (GCP) who evaluate not just the various anthropogenic CO2 emissions but also the ocean & biosphere uptake of CO2. Perhaps as a gauge of the accuracy of their 'budget' numbers, they provide an annual "budget imbalance" which is where the total emissions do not equal the total for uptakes plus atmospheric increase. This annual "budget imbalance" is usually 2% or 3% of the total emissions and this is on average due to more emissions than uptakes/increase.
So I would suggest the estimates annual emissions numbers are accurate enough to be confident that they don't hide some dreadful mis-reporting.
You also ask - "Why are atmospheric carbon levels still accelerating in growth?"
On a different thread here at SkS, I very recently engaged in a to-&-fro as to whether there is "still acceleration." With all the wobbles in the data, it appears difficult to demonstrate either way. - Plateauing CO2 emissions have slowed atmospheric growth
Bob Loblaw at 00:21 AM on 19 June, 2026Johnpead:
When speaking of emissions of CO2 or other carbon gases such as CH4, you need to clarify whether you are asking about anthropogenic emissions or natural emissions. Anthropogenic emissions related to burning fossil fuels are most easily estimated using production numbers for gas, coal, etc. In general, if we pulled it out of the ground, it got burned. (Oil is also used to produce plastics, but we do track how much is used to produce fuel.) As Eclectic says, it's pretty straightforward arithmetic.
Natural emissions are more complex. But you also need to consider natural uptake/absorption, as the contribution to changes in atmospheric CO2 is the result of the net value of emission minus uptake. You can cause an increase in atmospheric CO2 by reducing uptake, not just by increasing emissions.
Estimating natural emissions or uptake is less certain than anthropogenic emissions. There are two ways to try to measure it directly:
- Global point measurements of uptake and emissions. integrate the values over the entire globe. Not easy, and not really possible to get a network of sites that do this with sufficient coverage, running continuously.
- Global measurements of carbon storage. Changes in storage are the result of changes in the net flux (emissions minus storage). That can't tell you whether it is an emissions increase, an uptake decrease, or a combination of the two, but it will tell you the effect on atmospheric concentrations. Same issues in developing a global observing network as in point 1.
What we are left with is point measurements of uptake, emissions, and storage, which we can use to develop global carbon cycle models that allow for global estimates. For short-term events such as forest fires, such models can use estimates of the forest carbon and fire behaviour to estimate the emitted CO2.
There are several blog posts here at SkS that discuss many of these aspects of the global carbon cycle. Here are a few. (Note that some of these have both a "Basic" and an "Intermediate" tab, with different levels of detail.)
What is causing the increase in atmospheric CO2?
The lines of evidence that humans are raising CO2 levels
How do human CO2 emissions compare to natural CO2 emissions?
Murry Salby's Correlation Conundrum
- Plateauing CO2 emissions have slowed atmospheric growth
Eclectic at 21:51 PM on 18 June, 2026Johnpead @1 :
Please clarify the thinking behind your questions about rising CO2.
The basic arithmetic is straightforward ~ a world economy is expanding gradually year by year, and the energy supplied for that is still around roughly 83% supplied by fossil fuels. Obviously we (collectively) need to try harder with the "renewables" energy supply.
Also, more technological advance (e.g. the new sodium batteries) will take years to come to fruition. And there is much political foot-dragging going on in Washington and elsewhere.
Bushfires/wildfires are largely part of the short-term natural cycle.
My guess is that the wars/conflicts you mention are minuscule in CO2 production, compared with the usual industrial & domestic CO2.
- Solar, wind, and EVs have knocked out a doomsday climate scenario
prove we are smart at 17:50 PM on 2 June, 2026Well, that is a welcome headline, so, the CO2 emissions released by us in the 20th century and continuing this 21st century isn't going to doom us.
Because of rapidly increasing renewables, ev's and a slow down in fossil fuel use, there is now a new Business As Usual scenario, but still a very dangerous course to follow.
This new path we are on-( imho )-is a medium emission scenario, ( the new BAU ).
????️ "1. What “new business as usual” actually means
The phrase has shifted over the last decade. Historically, BAU meant something like RCP8.5 — runaway fossil‑fuel expansion. Today, because renewables have grown and coal is declining, BAU is more like:
Emissions plateauing or declining slowly, not rapidly
Warming continuing toward ~2.3–2.7 °C by 2100
Carbon budgets for 1.5 °C exhausted within a few years
Planetary boundaries for climate, biosphere integrity, freshwater, and novel entities pushed further into the danger zone
In other words: not worst‑case, but still deeply unsafe.
A BAU world doesn’t just “get warmer.”
It pushes multiple planetary boundaries further into the red, increasing the probability of tipping cascades:
AMOC slowdown
Amazon dieback
West Antarctic Ice Sheet collapse
Permafrost thaw
Coral reef collapse
Monsoon destabilisation
Once tipping elements begin to interact, the climate system becomes non‑linear — meaning human control diminishes.
This is the real risk of BAU:
we lose the ability to steer the Earth system back into a stable state.
???? 5. What it means for “us”
For humanity, BAU means:
A more dangerous, less predictable climate
Shrinking safe zones for agriculture and habitation
Higher economic volatility
Greater geopolitical tension
Increasing pressure on democratic institutions
A world where adaptation becomes permanent, expensive, and unevenly distributed
For the biosphere, it means:
Reduced resilience
Accelerated extinction
Loss of ecosystem services that civilisation depends on
A shift toward a hotter, less biodiverse, less stable Earth".
"Approximately one-seventh of the world's primary energy is now sourced from renewable technologies. This is based on renewable energy's share in the energy mix. Energy consumption represents the sum of electricity, transport, and heating". Here is the link to that-we desperately need to move past that 15% , even if it hurts our GDP's now instead of a warming world forcing a lowering of GDP on us later. ourworldindata.org/renewable-energy
- A look back at ‘An Inconvenient Truth,’ 20 years later
MA Rodger at 17:33 PM on 29 May, 2026nigelj @36,
The 26th May 'white' graph titled 'Average 12-Month Increases in CO2' indeed does indicate "an obvious slow down after 2015" in the "rates of yearly acceleration of CO2."
You ask whether this slowdiwn is "just generated by the 2015 el nino."
I don't see this could be solely a 2015 El Niño 'thing'. It conceivably could be a 'thing' involving the 2015 El Niño along with the impacts of other wobble-inducing events.
The 26th May 'white' graph is plotting OLS slopes and these are mostly impacted by what is going on at the ends of the OLS periods. There OLS periods are short so having an up-wobble at one end of an OLS period and a down-wobble at the other will result in the OLS for that period shooting away from what would be the underlying trend of a rolling OLS series. (And the same is true for non-linear regression types over short periods.)
Because the short-period individual OLS series in the 26th May 'white' graph are so sensitive (and also in the lower trace of the graphic posted 20th May - another 'white' one**), the 26th May 'white' graph uses varying lengths of OLS in an attempt to sldestep such OLS wobble 'things'. In the 26th May 'white' graph, it is possible the averages of different-lengthed OLS is still even-then showing nothing but a coincidence of wobbles but that would appear to be an improbable event. (** The 20th May 'white' graph used decreasing lengthes OLS hoping to show something before the wobbles took over. And these is is something to see.)
So I propose that what the 26th May 'white' graph (and the 20th May one) is picking up is the remarkably constant CO2 increase (thus an acceleration-free peroid) thro' 2015-to-date. This linearity can be seen directly plotted in yet another 'white' graph posted 22nd May.
So then, the question has to be 'Why does 2015-to-date have a constant rate of CO2 increase?'
It would require more than the 2016 El Niño but, combined with the following El Niños of 2020 & 2024, it could potentially manage it if their various wobble sizes-&-timings obliged.
However, my contention here*** is that linearity results from the annual man-made CO2 emissions having flattened-off. (The emissions data are ploted in the 'blue' graph 20th May.) With a year-or-so for the southern hemisphere to catch up, emissions data do fit the 2015-to-date linearity.
( *** I feel I am on solid ground with this contension. Though I am not well versed in the derivation of the numbers involved in the carbon cycle, an Airborne Fraction calculated from the Global Carbon Budget people has been pretty static of late, thro' 2000-24 at 51% [+/-1.7% 2sd]. Thus a change in carbon uptake by the oceans & biosphere & cement appears unlikely.) - A look back at ‘An Inconvenient Truth,’ 20 years later
Evan at 00:12 AM on 29 May, 2026Bob@37 Thanks for weighing in. Yes, I understand that the x2 coefficient represents half the acceleration. Because MAR was questioning the quadratic, I fitted using a powerlaw and took the second derivative of that. I checked my numbers and they are about half what they should be, but I don't know why. On the other hand, the accelerations from the quadratic are about right. Here they are
- Acceleration fitting 2000-2015 data: 0.015 ppm/yr/yr
- Acceleration fitting 2005-2020 data: 0.063 ppm/yr/yr
- Acceleration fitting 2010-2025 data: 0.029 ppm/yr/yr
Taking some kind of average and applying it over the 2000-2025 time span in question, gives us about the right increase. MAR would say that the acceleration is decreasing and reaching a plateau. But the methods he uses to justify a plateau are difficult to follow. Not saying their wrong, just difficult to follow.
My goal is clear communication that is accepted by experts and novices, and which can be understood by novices. Apparently I am not achieving my goals as evidenced by the back and forth between MAR and myself.
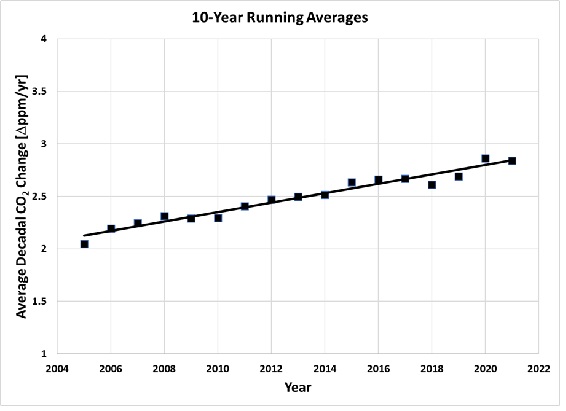
I may simply adjust my discussion to emphasize the 10-year running average rates of increase, as shown here. The method is easy to describe and I don't think challenged by anyone. Whatever it does or does not show about the underlying accelerations, it clearly shows we are far too rapidly going in the wrong direction. I really wonder how many people appreciate what an annual increase of CO2 of 2.5 ppm/yr represents?

- A look back at ‘An Inconvenient Truth,’ 20 years later
nigelj at 09:33 AM on 28 May, 2026MAR @34, I normally find your comments fairly clear, and extremely hard to fault, but I'm having trouble with your comments on this acceleration of CO2 issue. Regarding the graph you posted at 26th of May showing the rates of yearly acceleration of CO2. There is an obvious slow down after 2015 but isn't this just generated by the 2015 el nino? So its an artifact and temporary thing and is not indicating anything very comforting. I cant see what else it would be, because theres no sign of a slowdown in the keeling curve itself. However I dont have your level of training in maths and physics so I suppose I'm probably missing something.
- A look back at ‘An Inconvenient Truth,’ 20 years later
MA Rodger at 03:54 AM on 28 May, 2026Evan @33,
Indeed. It looks like will not gain anything from continuing the interchange without getting seriously into the weeds.
I would suggest the graphic below summarises our differences. (The post-Jan 2025 numbers are not intended as a dig.) I place it in-thread as well as posting it HERE (Posted 27th May 2025).

Beyond our evident differences, I should mention that the values you quote for post-2000 acceleration look to be rather low, I'd assume due to some arithmetical slip.
The rate of CO2 increase is currently running at +2.6 ppm/yr having exceeded +2.0 ppm/yr since 2000. So the average acceleration for the period 2000-25 has to be well above [(2.6 - 2.0) / 25yr =] +0.024 ppm/yr/yr, probably averaging even above +0.032 ppm/yr/yr. Yet your values thro' the post-2000 period sit well below that, with the highest +0.0154 ppm/yr/yr. - A look back at ‘An Inconvenient Truth,’ 20 years later
Evan at 21:28 PM on 26 May, 2026MA Rodger@32, you say that the acceleration peaks in the center of the period 2000-2026. I show the acceleration continuing to increase at the end of this period, but forgetting about nit-picks, my main thesis is that the Keeling Curve continues to show a robust, upward acceleration. Here is my analysis.
As reported in my @30 post, I use powerlaw curve fits to 15-year segments of data, and calculate the acceleration from the powerlaw fit at the midpoint of each of these three intervals to get
- 2000-2015: Midpoint year 2008, acceleration = 0.0102 ppm/yr/yr
- 2005-2020: Midpoint year 2013, acceleration = 0.0120 ppm/yr/yr
- 2010-2025: Midpoint year 2018, acceleration = 0.0139 ppm/yr/yr
If I add two additional sets to this by fitting the CO2 data from 2015-2025 and from 2020-2025, two periods that I believe are too short for statistically-significant results, I get the following.
- 2015-2025: Midpoint year 2020, acceleration = 0.0144 ppm/yr/yr
- 2020-2025: Midpoint year 2023, acceleration = 0.0154 ppm/yr/yr
These last two results are not statistically-significant, but they certainly don't show any hint of a slowdown.
I appreciate all the work you've put into this friendly exchange, but at this point I have nothing more to offer. Anyway that I look at the data that I feel properly accounts for the large cycles that need to be averaged out, I find CO2 concentration accelerating upwards. And likely that acceleration is increasing. It is not important for me to prove that last point, because even a stable upward acceleration is really bad. In fact, even a stable upward rate of increase is bad.
But thanks MA Rodger for everything you've put into this discussion thread.
- A look back at ‘An Inconvenient Truth,’ 20 years later
MA Rodger at 19:40 PM on 26 May, 2026Evan @30/31.
I'm entirely unfamiliar with "using a robust function." I'm assuming instead that you are actually saying you 'obtained' a "robust" result with the quadratic regression and this 'robustness' is indicated by the Rsq being close to 1. If so, you should consider how that Rsq would look when adjusted for autocorrelation - probably a whole lot less "robust." And shifting to an exponential relationship for the regression (or something else more exotic) can't provide a fix to the quadratic regression results which showed (as does the linear) that acceleration peaks in the centre of the period 2000-26.
What you and I are disputing is whether-or-not the level of acceleration in the later part of the 2000-26 period is low enough to consider being zero-acceleration and thus a 'plateau' for the rate of CO2 increase.
Simply stitching curvy regressions together to present some further apparent legitimacy isn't a process I would accept. (This is rather reminiscent my school days and Taylor's Theory.)
You conclude your comment @30 saying you "cannot get it (your analyses) to admit any kind of slowdown in the rate of accumulation of CO2." Have you noticed that the graphic @30 shows the 2000-15 projection diverging from the 2005-20 projection quicker than the 2015-25 projection. That in-itself is symptomatic of your missing 'slowdown.'
You re-visit the data @31 using 10-year averages of CO2 increase. (I was for some reason unable to properly duplicate your graphical output. However, it was close enough to continue.)
Your graph is showing robust acceleration but over the whole 2000-26 period. To get a bt more out of the data over the later part of that period (where I see my 'plateau' and you feel you've seen an increase in acceleration), how about using rolling 12-month values for your analysis rather than just annual ones? And how about using longer and shorter periods to see what the appears? So not just 10-year average increase but 4-year, 6-year, 8 year, 12-year, 14-year as well. The more the merrier. And how about taking an average of those 4,6,8,10,12,14?
I have up-loaded the result of such analysis HERE Posted 26th May 2026.
- A look back at ‘An Inconvenient Truth,’ 20 years later
Evan at 08:14 AM on 26 May, 2026MA Rodger, here is another way I look at the data. I take the CO2 concentration in a given year, subtract the CO2 concentration 10 years ago and divide by 10, to get the average change in CO2 concentration over that 10-year interval. Then I increment 1 year and repeat. This gives me a series of average annual CO2 changes where I am averaging the behavior over 10 years. I plot this vs year to get an idea how the average rate of increase is changing.
When I do that, I get an upward sloping line, indicating that on average (using 10-year running averages), the rate of CO2 increase, increases each year.
There is nothing in the following graph that suggests to me a plateauing of the trend. Rather, I see a consistent upward trend. If people are tempted to intrepet the slight dip at the upper end of the curve as the start of a plateau, remember we are headed into a monster El Nino this year, which usually causes a short-term spike in CO2 concentrations.
- A look back at ‘An Inconvenient Truth,’ 20 years later
Evan at 07:37 AM on 26 May, 2026MA Rodger@29
I have to admit that some of what you described is a bit above my pay grade. But thanks for your detailed explanation.
I fit the data using a robust function. Quadratics can be dangerous when extrapolated, but in this case the R-square fit parameter is about 0.998, so that extrapolation is warranted. But if you prefer, I can also use a powerlaw expression, which also fit with an R-square of about 0.998, and show exactly the same trends. I hope you agree that powerlaws can be safely extrapolated.
My purpose in extrapolating the functions over one time interval into the future is to show that if we were making progress to slow the rate of rise, then we would expect future CO2 concentrations to fall on or below our extrapolated curves. That they consistently sit above the extrapolated curves says clearly that things keep getting worse, not better. That is, there is no evidence of a plateau in 15-year averages.
So here is a new plot showing powerlaw functions fitted to the CO2 data over intervals of 2000-2015, 2005-2020, and 2010-2025. I again extrapolate each trend line into the future, to show that the actual data consistently sits above what we projected in the past. That is, things keep rising faster than a simple acceleration associated with past trends.
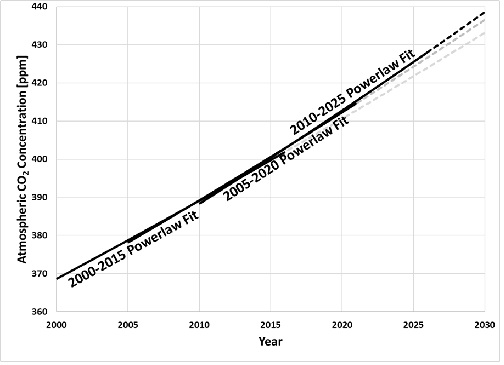
We can take the second derivative of the powerlaw trend lines and evaluate the acceleration at the midpoint of each respective curve.
- 2000-2015: Midpoint year 2008, acceleration = 0.0102 ppm/yr/yr
- 2005-2020: Midpoint year 2013, acceleration = 0.0120 ppm/yr/yr
- 2010-2025: Midpoint year 2018, acceleration = 0.0139 ppm/yr/yr
Not only is the acceleration increasing according to this simplistic analysis, but the rate of increase of acceleration seems to be constant, although I concede that this analysis is far to simplistic to make such a conclusion. But on the other hand, no matter how I cut the data, I cannot get it to admit any kind of slowdown in the rate of accumulation of CO2.
I therefore still maintain, that CO2 concentrations continue accelerating upwards, despite all that we're doing to try to slow it down.
- A look back at ‘An Inconvenient Truth,’ 20 years later
MA Rodger at 20:58 PM on 25 May, 2026Evan @26/28,
I was tempted to roll-back this discussion to that analysis I presented @23 rather than directly address your comment @26. (One reason for such a roll-back is an aversion to using quadratic regressions, something which I am also not very well set up for using.)
But perhaps I should address your comment @26 and say why it is giving you apparent indications of continuing acceleration thro' the recent decade-or-so of MLO CO2 data.
Your first graphic shows two overlapping quadratic regressions for MLO CO2, namely for periods 2000-2015 & 2010-2025. So the overlap period is 2010-15.
You say "15 years should be sufficient to average out the effect of wobbles such as El Ninos" but I would be inclined to the opposite view. However, with autocorrelation a issue, such a wobblological assessment is well beyond my pay grade.
You project the 2000-15 regression line to out 2025 and it sits below the 2010-25 regression line. The implication of these curvatures of the quadratic regressions does point to accelration and your use of this 'overlap' is potentially showing greater acceleration 2010-25 than 2000-15. Wisely you do not go that far but do see these regressions as demonstrating continuing acceleration thro' 2010-25 and thus conclude there is no 'plateau', a situation you describe as leaving "no room for interpretation."
Part of my aversion to quadratic regression is that I have in the past found there is always far more 'room for interpretation' than you would ever expect.
What you are missing in this analysis of the period 2000-25 is the intermediate period sitting between your early & late ones, namely the quadratic regression for the period 2005-20. Such regression shows the acceleration providing the strong curvature thro' the period 2000-25 is happening within this central part of the post-2000 data. I've graphed out these quadratic regressions (2000-26) with a bit more clarity by plotting the data as its deviation from the linear rise between 2000 & today (see HERE Posted 25th May 2026)
Futher, I don't see this analysis providing evidence of continued acceleration and the absence of a 'plateau'. Logically it wouldn't. That same graphic shows the linear rise 2015-2026 and totting up the residuals; the linear rediduals are as big as the quadratic residuals.
Concerning testing for accelertion, I wouldn't venture beyond OLS (which proves too sensitive in this present ciscumstances) or rolling averages (which do better) or nigelj's "put a ruler on the graph."
- A look back at ‘An Inconvenient Truth,’ 20 years later
Evan at 21:20 PM on 24 May, 2026Nigelj@27, thanks for your feedback. I would not draw conclusions from my simple graphs about the impact on warming starting in 2012. My goal was to use two 15-year graphs to ensure there was sufficient averaging of wobbles. But there is so much more that goes into determinging warming, such as variations in clouds and atmospheric sulfate particles.
Also, I would not conclude from my graphs that there was an increase in the acceleration rate of CO2 concentration that began in 2012. The sole purpose of my graph is to show that over a reasonable time frame, there is no indication that the Keeling Curve is leveling off, but rather that it shows a continuing, upward acceleration. However, the increase I show would be consistent with an increased acceleration, even if it does not prove it.
Also, I am not inferring anything about emissions with my graphs. The Keeling curve is the net effect of all human and natural emissions, minus all human and natural sinks. Human emissions are just one part of what affects the Keeling curve.
One thing to keep in mind. Human emissions are about 4% of natural emissions. We would not have to change natural emissions or sinks to significantly affect the rate of accumulation of CO2 in the atmosphere. The reason I prefer to follow the Keeling Curve more than reports on what our emissions are doing, is that the Keeling Curve gives the net of effect of our actions on the atmosphere, whereas human emissions are just one component.
- A look back at ‘An Inconvenient Truth,’ 20 years later
Evan at 22:16 PM on 22 May, 2026MA Rodger,
I am not sure why you are including "wobbles" in your consideration. Don' we consider sufficiently long data sets so that the effect of wobbles is averaged out?
I show below a graph of a quadratice fit to two, overlapping 15-year intervals: 2000-2015 and 2010-2025. 15 years should be sufficient to average out the effect of wobbles such as El Ninos. I show just the trend lines, without the data, so that the averaged trend can be clearly seen.
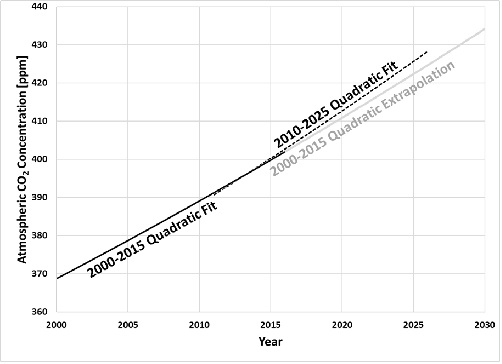
The upward curve of the quadratics clearly indicates upward acceleration. I project the 2000-2015 curve forward to show where we would be had the 2000-2015 baseline trend continued into the future. That we are above that trend line indicates that the rates are increasing above the 2000-2015 baseline.
For me this plot leaves no room for interpretation, because the data is taken over a sufficiently long interval to average out wobbles, and it indicates a trend that is increasing above the 2000-2015 baseline. I don't see any plateau in the acceleration that can be justified in a 15-year interval.
And even if we look at a 5-year interval, which is too short to average out long-term wobbles, we still see a concave trend line, indicating acceleration even over this unjustifiably short, 5-year interval. And considering that we are headed into a giant El Nino later this year, which is accompanied by a spike in CO2 concentrations, that applies even more upward pressure to this unjustifiably short 5-year plot.
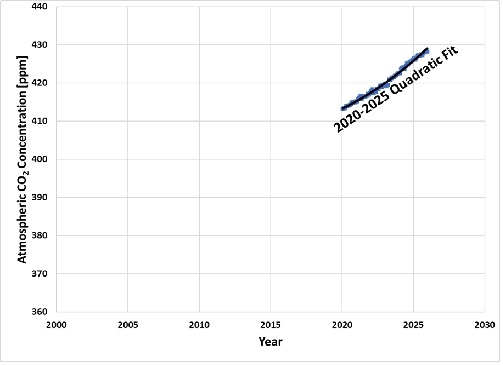
I am open to looking at things differently, and will be grateful if you can show me where I'm going wrong in my analysis. I am treating the data over sufficiently long time periods to average out wobbles, and still see unmistakable upward acceleration. These excerpts of the Keeling Curve just don't give me room for optimism. But they do suggest that I should prepare for a future with more challenging conditions.
- A look back at ‘An Inconvenient Truth,’ 20 years later
MA Rodger at 16:01 PM on 22 May, 2026nigelj @21,
It would be nice if it were so simple. But those annoying wobbles manage to get in the way. I've graphed out the NOAA's MLO de-seasonalized CO2 data 2015-to-date and annotated the micro-accelerations-&-decelerations (Green & Red). This approach is not definitive as these Green-&-Red bits would shift about a significant amount with small changes to the start-finish dates of the periods used. See graphic HERE Posted 22nd May 2026
Over the full period since 1958, the overwhelming situation is one of acceleration, and indeed increasing acceleration. The big exception within this trend was thro' the 1990s when rates decelerated due to the Pinatubo eruption, this quite evident in the NOAA 'Annual Increase of CO2 at MLO' graph up thread.
The recent 'plateau' with a period of zero acceleration is so-far a less obvious feature.
- A look back at ‘An Inconvenient Truth,’ 20 years later
Evan at 20:38 PM on 21 May, 2026Nigelj@22, yes, I concur with your assessment. If the curve deviates from a straight line, it is accelerating. And yes, the functional fits I use are quadratic equations, which fit very nicely to the CO2 data.
MA Rodger@23, I must confess I had difficulty following your method, but it may because I am busy preparing for a presentation. One of the benefits of fitting a function to the CO2 data and then analyzing the behavior of that fitted function is that the fitted function smooths out the wobbles. The fitted function extracts the average behavior from the noise. This permits easier analysis of the behavior of the data set by evaluating the behavior of the fitted function.
What I have in mind for my response my be of sufficient length that it is more valuable to simply write a blog post for SkS. You and I could then continue our discussion there, and more people may benefit. I'll try to get a quick response here later today, and then will likely plan a longer SkS post for the full response.
And I will try to give your analysis and better read later today after my presentation.
- A look back at ‘An Inconvenient Truth,’ 20 years later
MA Rodger at 07:57 AM on 21 May, 2026Evan @21,
I don't see the Ralph Keeling quote from 2018 as helping. Back in 2018 I would not have disputed the CO2 acceleration, although the emissions were looking like a 'plateau' was on the way. So by 2018 I might have been arguing for its immanent arrival based purely on the grounds of the emissions having 'plateaued'.
I've not attempted to numerically show the 'plateau' in the past, probably because the lack of acceleration has been too short to show within all the wobbles.
But here I've bravely set forth to attempt to show it.
I'm using the NOAA data (as you linked to) and specifically the de-seasonalized numbers so the annual cycle isn't interferring.
I took that data and differenced it to give the rate of rise. Then I carried-out OLSs on it with the end-date always today and varying the start-date from back in 1958 and up to 2025, knocking one month off for each OLS.
The results of all this is graphed out in the graphic below the previous one HERE Posted 20th May 2026.
The upper bit of the graphic (in red) is the 'rate-of-rise' numbers and that happily matches the red trace in the previous graphic.
The bottom bit of the graphic shows that over the full set of data the acceleration was running something like 0.0025ppm/yr/yr. As the earlier data is cut out with a later Start Date, this rate of acceleration doesn't change much for most of the period. The biggest feature here is a bit of a rise evident as the Start Date approaches the 1991 Pinatubo eruption.
Things do start to change from about 2008 as the rate of acceleration starts to decline and has dropped to zero by 2014. The acceleration rate stays very close to zero until about 2019 after which the wobbles take over and the rate drops steeply into the negative.
I'd suggest the near-zero section 2014-2019 is not an artifact of wobbles but is the 'plateau' showing itself. (The negative plunge is down to the latest 'rate-of-rise' data being low rather than high. I perhaps could choose a different end date giving a high ending to demonstrate this.) - A look back at ‘An Inconvenient Truth,’ 20 years later
Evan at 02:36 AM on 21 May, 2026MA Rodger@20,
Thanks for your detailed response.
The report I referenced is definitely not the basis of my stating that CO2 concentrations are accelerating upwards. Ralph Keeling is quoted on camera in 2018 as part of the NOVA series "Decoding the Weather Machiner" as stating that CO2 concentrations are accelerating upwards. It was not just a figure of speech, the motion of his hands together with his words clearly conveyed mathematically that CO2 concentrations were accelerating upwards. I don't accept your suggestion that this is a casual phrase designed for a press release.
I just downloaded the most recent NOAA data set (see here) and starting from 2000, any time interval I fit, from 25 years (2000-2025), up to 5 years (2020 - 2025), which to me is way to short for meaningful results, show an upward accelerating trend. I have a presentation to give tomorrow that is preventing me from spending more time now on my response, but tomorrow I will prepare the plots to share with you.
If we're all looking at the same data, I don't see where there is room for interpretation. Make a plot with CO2 on the Y axis, date on the X axis, and fit a function to the data that well represents the general shape. Take the second derivative. If it is positive, then the curve indicates an upward accelerating trend.
- A look back at ‘An Inconvenient Truth,’ 20 years later
MA Rodger at 00:23 AM on 21 May, 2026Evan @18/19,
That 2024 NOAA article you linked-to appears to be the crux of your 'acceleration' argument & I wouldn't put too much store by the wording of its strap-line (where the word 'accelerating' is used). The article is more 'press release' than definitive. Note that its using the May CO2 values (so the top of the annual cycle) which usually the NOAA avoid using when calculating an annual rise**. And when Ralph Keeling is quoted saying CO2 is " rising faster than ever," this is arguably about the previous El Niño-fuelled months when "CO2 concentrations increased more rapidly than they have in the first four months of any other year" and not the longer term rise. The following part of the article manages to be clear about the timescale unde discussion which is not long-term.
"The record two-year growth rate observed from 2022 to 2024 is likely a result of sustained high fossil fuel emissions combined with El Nino conditions limiting the ability of global land ecosystems to absorb atmospheric CO2, said John Miller, a carbon cycle scientist with NOAA’s Global Monitoring Laboratory." [My bold]
(**NOAA compare winter values Nov-Feb to calculate their annual 'growth' numbers.)
While the use of MLO CO2 data is not global, it isn't greatly different to the NOAA global numbers and MLO is a good measure for the Northern Hemisphere which contains the big drivers of the CO2 increase.
If you consider the NOAA MLO annual 'growth' numbers (graphed below), 2023 & 2024 sit up at the top of the ranking. But note that 2015, 2016 & 1998 sit in the next three positions, all five of these being impacted by El Niños. And note that 2025 didn't see much of a CO2 rise - it sits 18th in the 'biggest annual rise' rankings. 2022 sits down at 22nd and follows a couple of years of 'below average' increases. This doesn't suggest 'acceleration'.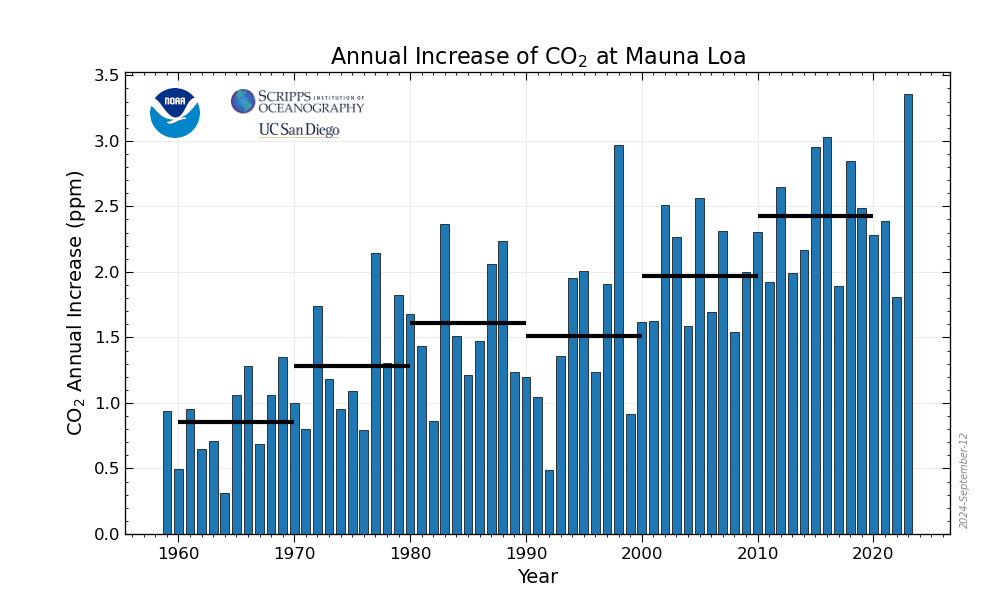
Working with those graphed NOAA MLO numbers and attempting to look past the ENSO wobbles by using a 5-year rolling average, the highest 5-year period is back in 2017. Also if you take a more straightforward calculation for a 12-month increase***, the maximum for a 5-year rolling average again appears for a period centred back in 2017. In both 5-year averagings, the difference between the latest peak of averaged 'growth' and the one back in 2017 is very small (2017 = 2.64ppm or 2.66ppm/yr, 2023 = 2.63ppm or 2,65ppm/yr) so you could try to make the case for the wobbles hiding the accelerating levels of CO2. But if there is a 'hidden' acceleration, it can't be a very strong acceleration for it to be hidden over a six year period. It's an easier argument to point to the wobbles hiding the 'plateau'. (*** The monthly level minus the level 12-months before)
While, the exact 'flatness' the plateau can be argued, I would strongly defend the idea that emissions are the sole contributor to rising atmospheric CO2. (At least, so far.)
Graphing out the 'growth' of MLO CO2 alongside the anthropogenic emissions numbers from the Global Carbon Project, (see graph HERE Posted 20th May 2026) using the 2.13Gt(C)=1ppm and assuming a constant 45% Airborne Fraction, this provides reasonable support for the absence of any significant natural CO2 emissions building-up under AGW and impacting the MLO numbers.
- A look back at ‘An Inconvenient Truth,’ 20 years later
MA Rodger at 16:48 PM on 19 May, 2026Evan @16,
I think you should perhaps have chosen a couple of different words for your comment.
The Keeling Curve is not "accelerating", at least not at the present. It is still rising but at a roughly constant rate. The Keeling Curve inherits a strong set of wobbles from ENSO etc so establishing an absence of acceleration over a period of just a decade is not entirely definative but the anthropogenic emissions (which cannot be so easily measured) do suggest such an absence of acceleration should be observed.
The second word (or phrase) I'd not use in the manner you do is "climate scientists" who are not responsible for the plan to reach net-zero and are certainly not saying "we are making great progress" towards net-zero. There are likely a bunch of folk who could be called "scientists" or "technologists" who are responsible for showing how to implement net-zero but generally it is politicians who have the power to make the decisions on the actual implementation.
Back forty years ago the clmate scientists were asking for a 50% cut in emissions by 2050. WIth the other 50% of our emissions being drawn down into ocean & biosphere, a 50% cut would stabalise atmospheic CO2, at least for a while.
But thirty years ago the climate scientists revised the target to an 80% cut by 2050 because that base level of annual emissions had risen rather than fallen and the larger cut in the new higher level would result in roughly the same cumulative emissions by 2050. And if you listened to those "clmate scientits" there was also talk of emissions having to peak by 2020.
The position was then revised again , the target calling for net-zero by 2050. This was due to two developments. (1) The big rise in emissions thro' the 2000s and (2) the changing understanding of what is a safe AGW temperature rise, this being revised down from +2.0ºC to +1.5ºC. Hey, we don't want Greenland starting to melt down, do we?
Now the concept of "peak by 2020" was always a bit vague. Yes we have 'plateaued' by 2020. But today six years later there is no sign that that 'plateau' is being followed by the decline which would convert that 'plateau' into a 'peak'. Climate scientists did nail-down this emissions limit with the carbon budget. And ther 2016 budget allows the calculation which showed that if emissions 'pateaued' (as they did) we would burn thro' that budget by 2021 (for a 66% chance of dodging +1.5C) or by 2025 (for a 50% chance).
However climate scientists did not throw in the towel but re-rigged the budget to include a big period of net-negative emissions post net-zero. My scaling of the size of this net-negative a while back suggested it would involve the anthropogenic draw-down of all our emissions made after 2008, this achieved over a century-&-a-half. This 'fix' gave another decades-worth of the 'plateaued' emissions added to the budget. And for the 66% chance, we are halfway thro' that extra time and still 'plateauing'.
Now my version of the argument that we are in the process of falling off the cliff is not based on the continued 'plateauing'. That situation could change rapidly with the increasing deployment of renewables and energy efficiency measures. But what I see as the problem is that deployment. Where is it?
I'm a political person and hear politicians of a different stripe mouthing off about impressive levels of renewable 'energy'. One of the stories they employ uses impressive 'electricity' numbers not lac-lustre 'total energy' numbers. That is politicians (who are usually never the sharpest tool in the box) spreading propaganda.
The other propagandist number they fight to take credit-for here in UK is the national territorial emissions. These are impressive-sounding in UK. Emissions halved since 1990. Or they are lower than any time since 1880. And the numbers are even better if you use 'per capita' figures. Waving these numbers is incredibly deceptive. UK was historically a massive emitter so reductions are't difficult to achieve. Much of the reduction in national emissions which UK politicians try to take credit has been achieved by exporting manufacturing. And the other big factor is converting from coal to gas.
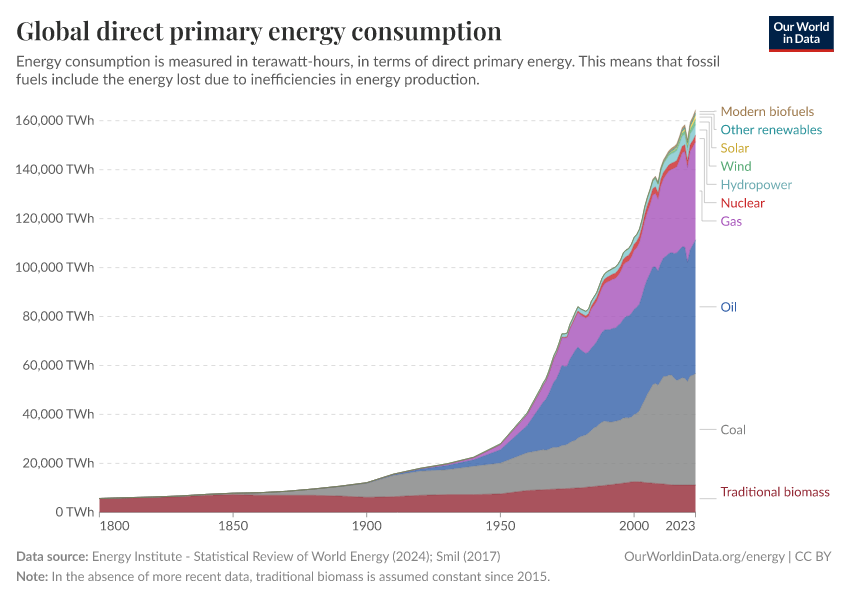
Globally things are quite desparate. The graphic below shows primary energy from fossil fuel is still increasing. This doesn't reflect emissions because it is the coal-to-gas thing again. Gas is no solution for net-zero emissions. Of the six/seven non-fossil-fuel energy sources in the graph below, hydro and nuclear are non-scalable so also not the solution. The remaining three are none-of-them demonstrating an exponential growth which we need to see. Solar has the most promising scalability and give it a decade we could suddenly see that kicking-in alongside hydrogen and ammonia being used for energy storeage/transportation and more. But the massive works to get that all done are not evident. Discussion of plans for such massive works are not evident. And the clock is ticking.
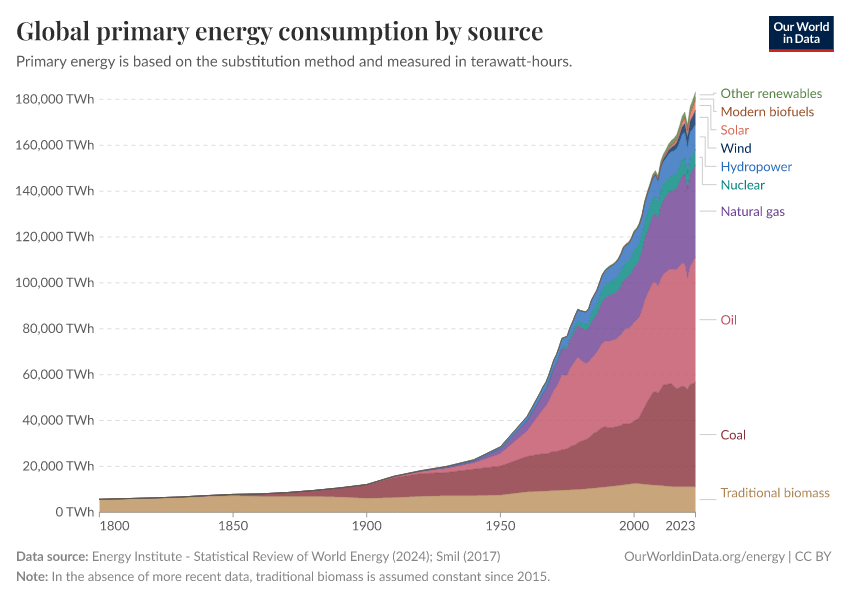
So we may not be in free-fall off the cliff but we have yet to begin thinking about getting a proper grip to stop ourselves sliding down the slippery slope above that cliff.
- A look back at ‘An Inconvenient Truth,’ 20 years later
Evan at 09:37 AM on 17 May, 2026Nigel@15. This is one time when I strongly disagree with your position.
If you fall over a cliff and are plummeting to your death, you can argue that opening an umbrella will slow your descent more than if you didn't open it, but you will still likely fall to your death.
Not only is the Keeling curve not flattening out, it is accelerating upwards.
Accelerating!
The best we can say is that maybe we have slowed the rate of acceleration a bit. But as long as the Keeling curve is accelerating upwards, I don't see any room for optimism. I only see room for communicating that we need to do much much more.
It concerns me greatly that many climate scietists remain optimistic in the face of an upward accelerating Keeling curve. For the not-so-well-informed general public, the logic may be.
1. Climate scientists say they have a plan for reaching net-0.
2. Climate scientists say we are making great progress.
3. So CO2 levels must be stabilizing.
4. I feel better now knowing that we just have to stay the course.
Your average person will have no idea what the Keeling curve is doing. The end result of all this discussion about net-0 and hype about how well we're doing reducing emissions, hides the fact that we are having no effect on the Keeling curve. It may simply put the general public to sleep.
I really wonder how many people realize what an absolutely massive increase of 2.5 ppm/year CO2 really is? CO2 is nowhere near stabilized!
- A look back at ‘An Inconvenient Truth,’ 20 years later
nigelj at 08:00 AM on 17 May, 2026Evan @13, thanks for your comments. I feel there is some grounds for some limited optimism that we have made real progress with the climate issue. You correctly analyse the keeling curve that theres no sign of the keeling curve flattening off. Its depressing to be sure. However I think its hard to see a change, because we haven't done enough yet to make an impact that would appear above the noise in the system.
And I would contend its highly likely that the building of renewables has reduced the rate of growth of the keeling curve. Putting it another way, but for renewables total atmospheric CO2 concentrations would be higher than currently. Obviously we cant be certain of this, but basic evidence and logic points that way.
So as I previously suggested, I think we have some grounds for limited optimism, and should spread a message that we are making some progress but its not nearly enough.
I agree that some commentators over hype the progress we have made. That is definitely neither accurate or helpful. But if we scare people too much so that the problem looks huge and insurmountable, this will discourage climate action.
-------------------------------------------
Prove we are smart @14
"Nigelj@11, I would rather scare them awake than a little uncomfortably numb."
That has generally been my preference. But if you scare people too much, especially if you exaggerate the dangers, or spread a message we are doomed, then you discourage people form taking any climate action.
If I felt we really were doomed, I would say so, and obviously theres no point promoting action to mitigate the problem. We would be stuck purely with adaptation. But I do have some limited optimism we have made a difference, and can make more of a difference. Therefore I think the message should be we have made some progress but not enough, and if we dont make more progress the outcomes will be very serious, etc,etc.
- A look back at ‘An Inconvenient Truth,’ 20 years later
prove we are smart at 11:57 AM on 13 May, 2026I think we all feel increasing dread from our seemingly forever increasing atmospheric CO2 readings. Here is an interesting review from how the world did slow the increase in CO2 for a while- My microsoft "co-pilot" offered me these facts to the asked question..
" Are you interested in quantifying how much each event slowed the annual ppm increase (e.g., comparing Keeling Curve slopes before/after each event)?
Yes — and more importantly, it’s a scientifically meaningful thing to do, because it lets you separate narrative (“the pandemic slowed emissions”) from quantitative signal detection (“did the atmospheric growth rate actually change, and by how much?”).
Here’s the concise takeaway first:
Yes, you can quantify how much each event slowed the annual CO₂ growth rate by comparing the Keeling Curve slope before and after each event — but only a few events (e.g., the 1973 oil crisis, the collapse of the Soviet Union, the 2008 financial crisis, and COVID‑19) produce a detectable, statistically significant deviation, and even then the effect is small relative to natural variability.
Below is a structured way to think about it, plus what you’d likely find if you actually ran the numbers.
????️ 1. What “quantifying the slowdown” actually means
You’re essentially asking for:
Where slope = annual mean CO₂ increase (ppm/yr), typically computed using:
A 5‑year window before the event
A 5‑year window after the event
Deseasonalized Mauna Loa monthly data
A linear regression for each window
This isolates the trend rather than the short-term wiggles.
???? 2. What events are large enough to show up in the Keeling Curve?
Only events that cause multi‑gigaton, multi‑year changes in emissions can produce a detectable signal in atmospheric growth rate.
Events that might show up:
1973–74 oil crisis
1980–82 recession
1991 Soviet collapse
2008–09 global financial crisis
2020 COVID‑19 lockdowns
Events that won’t show up:
Individual policy changes
Single-year emission dips < 1 GtCO₂
Regional events (e.g., EU recession alone)
Anything shorter than ~6 months
The atmosphere integrates globally and has inertia.
???? 3. What the numbers typically show (based on published analyses)
These are approximate, but they’re consistent across NOAA, Scripps, and peer‑reviewed studies.
1973 oil crisis
Pre-event slope: ~1.3 ppm/yr
Post-event slope: ~1.1 ppm/yr
Δ slope ≈ –0.2 ppm/yr for ~2 years
1991 Soviet collapse
Pre-event slope: ~1.5 ppm/yr
Post-event slope: ~1.2 ppm/yr
Δ slope ≈ –0.3 ppm/yr for ~3 years
2008 financial crisis
Pre-event slope: ~2.1 ppm/yr
Post-event slope: ~1.8 ppm/yr
Δ slope ≈ –0.3 ppm/yr for ~1–2 years
2020 COVID‑19
Emissions dropped ~7% globally
But atmospheric growth rate dropped only ~0.2–0.3 ppm/yr
Δ slope ≈ –0.25 ppm/yr for ~1 year
Why the effect is always small
Because:
Atmospheric CO₂ growth is dominated by cumulative emissions, not annual changes.
Natural variability (ENSO) is ±1 ppm/yr, which is larger than most human-caused dips.
The ocean and biosphere buffer short-term changes.
This is why even COVID barely dented the curve. ( my add, so although longer lasting oil crises, regime and financial collapses and pandemic lock-downs will definitely/finally reduce the curve, should this be our future?)
???? The deeper pattern
Every slowdown corresponds to one of three categories:
Energy supply shocks (1973, 1979)
Global economic collapses (Great Depression, COVID‑19)
Large‑scale wars (WWI, WWII)
None were climate‑policy driven. The only sustained, policy‑driven flattening appears in some national emissions, not global totals."
To me, perhaps honestly for my mental health, I need to see some new/better? at least partly global fix-it talks. Ha, thoughtfully, the invites didn't include China,Russia,Usa and India-These countries were considered to be bad actors to genuine progress- call me naive but my ability to be a positive role model instead of the opposite has to be something- that link again and for what it's worth, the people attending said good things too.. www.carbonbrief.org/santa-marta-key-outcomes-from-first-summit-on-transitioning-away-from-fossil-fuels/
- CO2 is not increasing
scaddenp at 07:37 AM on 30 April, 2026Not to mention that ice core bubbles from Antarctica and Greenland are sampling the atmosphere in two extremely different parts of the world and yet come up with remarkable similar estimates of CO2 concentration at the same times.
- The really big picture, in four pictures
Bob Loblaw at 06:48 AM on 26 April, 2026When reading "we can fix it", I am reminded of an old friend's story of her attempts to improve her daughter's grammar. Her daughter would sometimes ask "can I do [something]". When the daughter was asking for permission to do something my friend did not want her doing, my friend would respond with "you can, but you may not". (My friend stopped doing this when a teacher complained to her about her daughter's attitude in class. It turned out that the teacher had once asked the daughter "Can I do [something]?", and the daughter had said to the teacher "you can, buy you may not".)
Ultimately, the point is that "can do" is not strictly the same as "will do". Something may be physically possible, but getting people to do it is another matter.
Can we cut missions and stabilize CO2? Yes. Will we? I can only hope.
- CO2 is not increasing
Bob Loblaw at 06:38 AM on 26 April, 2026Richz @ 43:
I am not following your point(s).
Ice core samples contain bubbles of air that tell us what the atmospheric gas amounts were at the time the air bubbles were closed off and stopped exchanging air with the atmosphere above the accumulating snow/ice. (It takes some years of compressing the snow to close the air space off and isolate it.) The CO2 is not "absorbed" in the ice in the sense that it would chemically bond with the ice. The air is trapped in the ice and preserves its own chemistry.
So yes, we "have a clue" as to what proportion of the air was CO2 100k years ago. And comparing the proportion over time (different layers of ice) is quite reasonable. And "overlaying" the actual direct measurements of atmospheric CO2 proportions with what we see in the bubbles in ice cores is precisely why we can say that the ice core values match up with direct measurements.
What are you trying to say about the peaks over 400,000 years? Global atmospheric CO2 does not go through huge changes in a short time period. It has taken humans 100 years to increase CO2 from 300 to 400 ppm. Annual variation from natural cycles causes less than 10 ppm change. Are you trying to say that there is possibly some past hidden spike in CO2 that was too short to show up in the ice cores? Do you have any evidence that such a short-term spike is possible, given the nature of the carbon cycle? Any reasonable mechanism that could create such a spike? If you have no evidence, and no explanation of how you think there could be one, then you will find it difficult to convince anyone that you have anything more than wild speculation.
- CO2 is not increasing
Richz at 02:24 AM on 26 April, 2026Looking at the ice core samples shows CO2 that was being absorbed by ice. We have no clue how much CO2 was remaining in the atmosphere going back the 100k years. So isn't comparing that to the current atmospheric CO2 levels like comparing apples and oranges. And overlaying the atmospheric levels onto the ice core samples misleading. It would seem we have no idea if the atmospheric CO2 levels during each of the peaks over 400 000 years were also in the 400ppm
- Human-caused climate change is unmistakably distinct from Earth’s natural climate variability
MA Rodger at 22:44 PM on 23 April, 2026Eric (skeptic) @7,
I was a little taken aback in your comment by you saying in the context of 'slow feedbacks' that "feedback increases CO2." That is not the normal understanding of 'slow feedbacks' which are the main difference between ECS & ESS.
Folk are usually rather vague about the nature of the things dividing ESS from ECS but carbon feedbacks isn't what I find mentioned (as per here). It's usually the changing vegetation & ice cover that gets the mention, along with deep ocean warming. Melting ice/permafrost and oceans will have an associated thermal-lag element but I can't see that aspect being very great. This suggests the big part of Δforcing remaining out-of-equilibrium after ECS arrives is albedo changes.
I see two points of note - (1) The value of ESS & (2) Its relevance to the AGW situation.
(1) The main evidence supporting a significant ESS is of course the temperature and the CO2 records. And those don't come with labels showing the Δforcing involved in ESS. However, they do show ESS significantly above the usual range of ECS values (ECS =+2.0ºC to +4.5ºC) although there remains the "fat tail" in ECS analyses which sits yet higher.
The accounts of ESS have in the past put ESS = 1.5 x ECS or ESS = 2 x ECS, whatever that means number-wise. The analysis is usually applied to pre-ice age data although the OP above has also used mainly ice-age data-points and spliced them onto Judd et al (2024). (The OP figures show the Cenozoic data points of Judd et al below 700ppm CO2. So not shown is the seven Cenozoic points at higher CO2 levels. If these high points were missing also from the OP's analysis, it may explain the discrepancy between the Judd ESS [+7.7ºC] and the OP ESS [+8.2ºC].)
Judd et al (2024) Fig 4b
Of course, the ESS analyses are dependent on these temperature and CO2 reconstructions. And there is significant variation here as Judd et al Fig 4a below and Rae et al (2021) fig 7 below-again demonstrate. (At 50My bp, Judd et al have CO2 at 1,200ppm & Temp at 33ºC while Rae et al have CO2 at 1,500ppm & Temp at 27ºC which would make a significant difference in caculating ESS.)
Judd et al (2024) Fig 4a
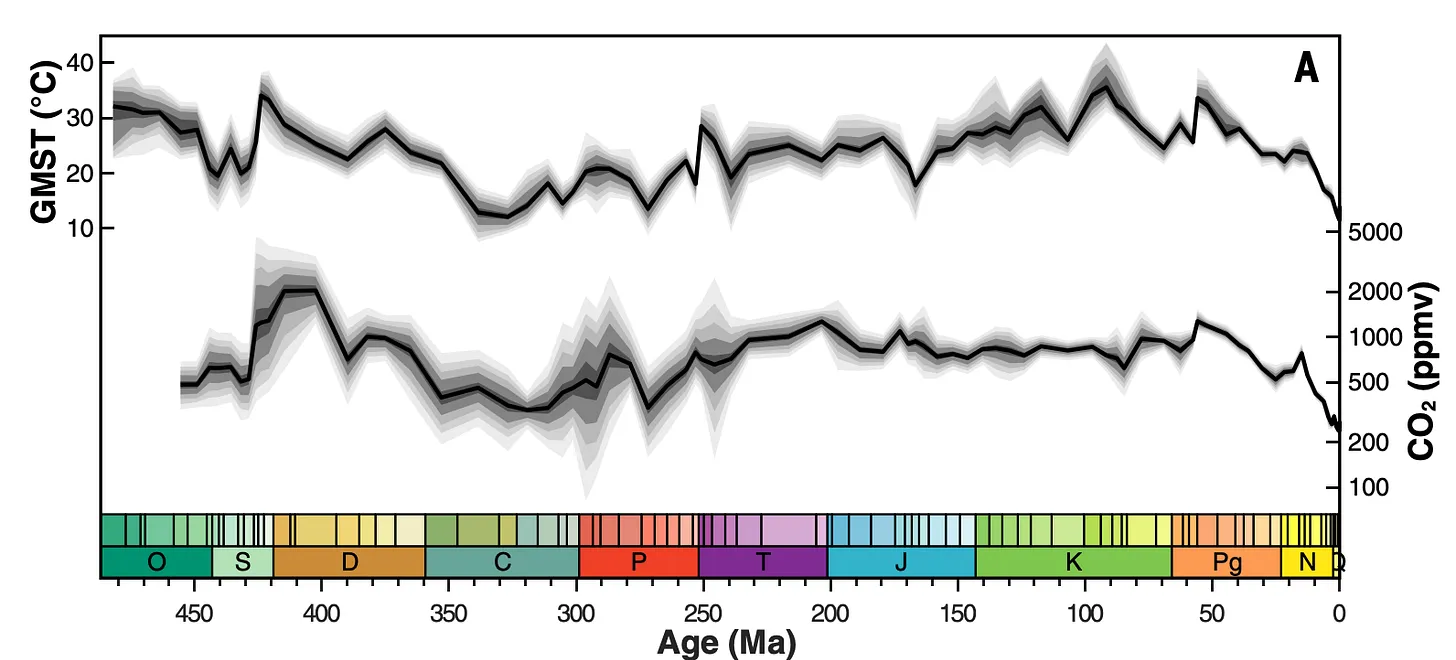
Rae et al (2021) Fig 6

So what value ESS? Presumably somewhere +5ºC to +9ºC.
But does it matter?
(2) Both ECS and ESS warming assumes the CO2 levels (or equivalent) are maintained until the respective equilibrium is reached. Give the draw-down of CO2 over the millennium will amount to roughly half the CO2 level increase of today, that maintenance of CO2 levels over the millennium would require a lot of CO2 coming from somewhere. The carbon feedbacks aren't that big. (See this CarbonBrief article which suggests natural feedbacks could amount to perhaps 15% or so.) If CO2 levels will not be maintained over centuries post-net-zero, that suggests that even ECS lacks relevance, although beyond the millennium and into ESS-territory there is no significant CO2 draw-down.
Of course, with AGW rapidly approaching +1.5ºC and the emissions still up where they shouldn't be, I don't think any reassurance given about AGW not reaching ESS levels or ECS levels (ECS levels which still may be higher than the 'usual range' due to the "fat tail"): any such perceived reassurance should not be allowed to lessen the efforts to rapidly cut emissions and reduce the bad effects of AGW we are creating for the future. (And note that the less-dreadful IPCC scenarios also include net-negative anthropogenic emissions post-net-zero to add to the natural draw-down.) - Human-caused climate change is unmistakably distinct from Earth’s natural climate variability
Eric (skeptic) at 12:33 PM on 19 April, 2026I remember the diagram from an earlier thread and I'd like to revisit it. The diagram shows 600 ppm and roughly 22C on the black curve and overlayed text says thermal lag and slow feedback mechanisms. Thernal lag: yes, certainly. But feedback increases CO2. It does not lead to the black curve, it "merely" extends the red curve to the right.
As the author, Dean, points out, that's even worse because we can potentially get further up via the black curve. But that will require oceans to warm from their current 2-3C to 15 C or more. Dean points out feedbacks take millenia. But again that's rightward not upward on the chart. The omnipotent AI says that equilibrium response of the deep ocean is approx 1500 years. But that's simply the turbulent mixing timescale.
The much discussed AMOC is connected to the SMOC. AMOC changes could affect SMOC and vice versa. SMOC overall is 2-3x AMOC as measured in Sv (million cubic meters / sec of water movement). Ironically it is the slowdown of SMOC in particular that would extend the 1500 years. AMOC is more complex with weaker AMOC increasing heat storage efficiency.
I find if I pound on the AI enough it will finally find some (admittedly tentative) support for my claim:
Yes, increased winter sea ice formation in a seasonally ice-free Arctic, particularly in key regions like the Laptev and Kara Seas, can enhance brine rejection and cold, dense water formation, potentially acting as a negative feedback to slow the overall decline of deep water formation
Basically that's due to more open water in autumn leading to a larger heat loss along with the ability of (projected) fresher Arctic surface water to freeze faster. Bottom line is we are talking millenia of thermal lag. My own professional use of nascent AI leads me to the conclusion that millenia simply do not matter at all anymore. I used to think a century mattered, but even before current AI I recognized the acceleration of technology. As of now, the only thing slowing AI down is slow humans. AI itself will solve that problem for better or worse. I think for the better, but I've always been an optimist.
- Human-caused climate change is unmistakably distinct from Earth’s natural climate variability
nigelj at 07:42 AM on 19 April, 2026Correction of typo: rkcannon essentially claims that the anthropogenic warming theory is wrong because warming was strong early last century, despite yearly CO2 emissions being quite low at that time. ( as were total atmospheric CO2 concentrations)
- Human-caused climate change is unmistakably distinct from Earth’s natural climate variability
nigelj at 07:28 AM on 19 April, 2026Regarding rkcannons comments and the moderators accurate response. I have long suspected a large propotion of the climate science denialists might be getting certain things wrong at least partly due to an innate or deeply seated difficulty they have with multi factorial situations, where an outcome is a result of a combination of multiple factors operating simultaneously. I have now tracked down some science that backs this up and added this at the end.
Some examples of this page. rkcannon essentially claims that the anthropogenic warming theory is wrong because warming was strong early last century despite CO2 emissions. But the reasons for strong warming early last century were a complicated combination of CO2 and multiple other natural cycles and natural factors acting simultaneously, and the limited atmospheric concentrations of CO2 at that time. There are studies on this easly found by an internet search.
rkcannon mentions China is still warming despite its use of coal burning that generates cooling aerosols. But this is due to a complicated combination of factors, many discussed by the moderator.
The denialists have had all this explained to them many times yet persist with their denialism. I suspect some people (particularly a large proportion of the climate denialists) find holding multi factorial issues in their heads difficult, despite often being well educated people. It might be a basic psychological difference between people. Like how some people are good at multi tasking and some aren't. This might partly explain their stubborn denialism. Im not sure if this would apply to rkcannon but it looks like it applies to some people.
I asked an AI about this and the response is as follows and includes specific references to key researchers:
Short answer:
Yes — there is published science showing that some people, even highly intelligent ones, have difficulty understanding situations where multiple interacting factors produce an outcome. This difficulty is not simply about “intelligence” but about specific cognitive skills, cognitive styles, and limits in working memory and reasoning.
1. Intelligence ≠ Systems Thinking
General intelligence (often measured as g) predicts problem‑solving in many areas, but systems thinking — the ability to understand interactions, feedback loops, and multi‑cause outcomes — is a separate cognitive skill.
Research in cognitive psychology and decision science shows that people can be strong in abstract reasoning yet weak in:
Integrative complexity (ability to hold multiple perspectives at once)
Causal reasoning (understanding how multiple causes interact)
Systems reasoning (thinking in terms of networks, not linear chains)
These are partly independent of IQ.
2. Working Memory Limits
Complex situations require holding several variables in mind simultaneously. Studies in cognitive load theory show that people vary widely in working memory capacity, which strongly affects their ability to reason about multi‑factor problems.
Even very intelligent people can have:
Lower working memory span
Difficulty tracking interacting variables
A tendency to oversimplify to reduce cognitive load
This leads to “single‑cause thinking” even when the person is otherwise bright.
3. Cognitive Biases That Block Multi‑Factor Understanding
Humans naturally prefer simple explanations. Several well‑documented biases contribute:
Simplicity bias — preference for one clear cause
Attribution error — overemphasis on personal causes vs. situational ones
Confirmation bias — selecting the cause that fits one’s existing beliefs
Narrative bias — preferring tidy stories over messy realities
These biases operate regardless of intelligence.
4. Need for Cognitive Closure
Some people have a stronger psychological need for quick, definite answers. Research on need for closure shows that individuals high in this trait struggle with:
Ambiguity
Multi‑factor explanations
Probabilistic reasoning
They prefer a single, decisive cause even when the situation is inherently complex.
5. Published Research Areas Supporting This
There is substantial scientific literature across several fields:
Cognitive psychology — working memory, causal reasoning, integrative complexity
Decision science — multi‑attribute decision‑making, heuristics and biases
Systems thinking research — especially in education, engineering, and management
Neuroscience — showing that multi‑factor reasoning activates networks associated with cognitive control and abstraction
Key researchers include:
Daniel Kahneman & Amos Tversky (cognitive biases)
Philip Tetlock (integrative complexity)
John Sterman (systems thinking)
Keith Stanovich (rationality vs. intelligence distinction)
6. Bottom Line
Some people — even very intelligent ones — genuinely struggle with multi‑factor, complex situations because:
Systems thinking is a distinct skill
Working memory varies between individuals
Cognitive biases push toward simple explanations
Some people have a psychological preference for certainty
This difficulty is not a sign of low intelligence, but a reflection of how differently human minds handle complexity.
-------------------
Normally I do not post AI responses but I think it makes sense on this issue and I dont have time to write an essay in my own words, and it includes a list of researchers people can look up.
- Human-caused climate change is unmistakably distinct from Earth’s natural climate variability
rkcannon at 17:14 PM on 18 April, 2026Rebuttal: Systems Analysis vs. Circular Reasoning
Subject: Response to Moderator Comments regarding Bhatta (2024) and Marks-Peterson (2026)
While the ad hominem labels—"amateur" and "naive"—provide a look into the moderator’s temperament, they do not address the physical and statistical discrepancies presented. As a Professional Engineer (PE), I prefer to evaluate the Transfer Functions of a system rather than the consensus of the "grown-ups."
1. On Circular Reasoning and System Gain
The moderator admits that the Nature paper (Marks-Peterson et al., 2026) requires "important contributions" from albedo and ocean circulation to explain a 2.5°C cooling while CO2 remained stable.
The Logic: To claim CO2 is the "key" control knob, only to demote it to a "passenger" whenever the data shows the planet cooling without its help, is circular reasoning.
The Math: Since the early 1900s, human CO2 emissions have increased by over 1,700%. If a seventeen-fold increase in the supposed "driver" results in a warming rate statistically similar to 1910, a rational systems analysis concludes the system is insensitive to that input.
2. The Failure of "Aerosol Masking"
The argument that mid-century cooling was "masked" by aerosols fails the spatial and modern test.
The Discrepancy: If industrial aerosols were a primary "cooling shield," China—with the world’s highest coal-related aerosol loading—should have been a global cool spot. Instead, China has warmed faster than the global average.
The Conclusion: You cannot invoke a "masking shield" to explain the 1940s cooling while ignoring its failure to stop warming in modern Asia. This is curve-fitting, not physics.
3. The Measured Driver: Albedo and the CERES Data
The moderator’s focus on 21-year surface trends ignores the most robust data set we have: the CERES satellite record.
The Data: Since 2000, CERES has measured a 0.8% drop in Earth’s albedo. This change in reflectivity has added roughly 2.7 W/m2 to the Earth's energy budget—effectively 100% of the warming forcing that the IPCC attributes to CO2 over the last 250 years.
4. The Missing "Fingerprint" and UHI Bias
If CO2 were the driver, the laws of physics dictate a "Tropical Hot Spot" in the upper troposphere. Decades of radiosonde and satellite data show this fingerprint is missing. The warming we do see is surface-based and highly correlated with Urban Heat Island (UHI) contamination. When you "homogenize" data by forcing rural stations to match urban trends, you aren't measuring global climate; you're measuring the encroachment of asphalt on thermometers.
Conclusion
Rational skepticism demands that models reconcile with empirical history. If the planet cooled 2.5°C with no change in CO2 in the Pliocene, and cooled for 40 years during a CO2 surge in the 20th century, the "Control Knob" theory is functionally dead. It is fascinating to watch the "Immune System" of this forum react; the Killer T-cells are working overtime to neutralize empirical data that looks like a "foreign invader" to the dogma. Nature doesn't care about your PhD or your moderation policy if your math is wrong. - Human-caused climate change is unmistakably distinct from Earth’s natural climate variability
MA Rodger at 21:37 PM on 16 April, 2026Moderator Response @1,
The amateur analysis of 'global average' temperature linked @1 by rkcannon is entirely naive in its method and in its reporting of conclusions.
It concludes "...the notion that CO2 is the primary driver of global warming. If this were the case, periods with higher CO2 emissions would exhibit a faster rate of warming than periods with lower emissions," pointing to what the amateur calls his finding that "...long-term temperature rise was steeper in earlier periods when CO2 emissions were modest compared to current levels. These results hold despite changes in how time periods are defined ... and how weather stations are selected ... .")
The grand analysis supporting such a bold assertion looked at 100, 500 and then 992 selected weather stations (so all land sites), selected for the level of data available and then calculates the temperature trends for 42, 35, 30 & 21 year periods. The 100 station results presented show the temperature trends for the latest periods are by far the steepest in two centuries under analysis, 1815-2024. (42y +0.24ºC/decade, 35y +0.25ºC/dec, 30y +0.33ºC/dec, 21y +0.41ºC/dec) which of course entirely contradicts the conclusions presented in the analysis.
So that's worse than "amateur"!!
The other link @1 by rkcannon is to Marks-Peterson et al (2026) which is paywalled but an associated paper Shackleton et al (2026) 'Global ocean heat content over the past 3 million years' is not. These two papers drew coverage at RealClimate. Both papers examine very very old ice which provides data with less accurate age such that ice age cycles are fuzzed out.
The two papers are pointing to a more complex cooling 3My-0,5My bp. From the press release:-
"The implications of the results are that the cooling of the last 3 million years probably involves, in addition to the key role of heat-trapping greenhouse gases, important contributions from other components of the climate system such as Earth’s reflectivity, variations in vegetation and/or ice cover and ocean circulation."
Somehow there are crazy folk gleaning straws from the science to present misguided support for their crackpot version of reality. The account of Marks-Peterson et al (2026) nailed-up on the rogue planetoid Wattsuppia was headlined 'Shock New Evidence Showing No Link Between CO2 and Temperature Over Last Three Million Years Stumps Net Zero Activists' and such coverage prompted a few grownups to explain the true implications fo the two papers.
- Human-caused climate change is unmistakably distinct from Earth’s natural climate variability
rkcannon at 23:23 PM on 15 April, 2026But other data shows less of a link to CO2. https://pureadmin.qub.ac.uk/ws/portalfiles/portal/676577731/revisit_2.pdf, https://www.nature.com/articles/s41586-025-10032-y.
- 2026 SkS Weekly Climate Change & Global Warming News Roundup #14
One Planet Only Forever at 08:54 AM on 8 April, 2026Recent SkS posted items raise important awareness and understanding related to the historic challenge of dealing with the damage done by people who choose to fail to responsibly learn to self-regulate their actions. Thank you to Doug and Marc for curating and sharing the Weekly New Research, and to Baerbel, John, and Doug (again) for curating and sharing the Weekly News Roundups.
A related item in this week’s Climate Policy and Politics list is, Vermont Hits Back at Trump’s Effort to Block ‘Climate Superfund’ Law. It is about responsible leaders struggling to use the powers they have, State powers in Vermont, to penalize and limit the climate change harm done by the global team of undeserving economic winners.
Responsible leadership struggles to effectively discourage and disappoint people who want to benefit from being: less accepting of diversity, more harmful, and less helpful. Humanity, especially its leaders, has a history of struggling regionally and globally to collectively correct and recover from results of harmful pursuits of benefit and get the beneficiaries of the harm done to make equitable and adequate reparations. It is more challenging when members of a regional or global club of harmful unhelpful people Win positions of power that enable them to make-up inequitable rules and harmfully enforce rules to avoid being penalized and to threaten, penalize and punish everyone they believe is a potential threat to their undeserved perceptions of superiority.
People passionately pursuing being perceived to be “The Winners” are most likely “The Problem”.
Restricting a person’s freedom to continue to benefit from understandably unsustainable harmful actions - does not harm them.
Penalizing a person for benefiting from understandably harmful actions and making their penalty help those who have been harmed - does not harm them.
An earlier related item is the study The political economy of leaving fossil fuels underground: The case of producing countries, listed in Open Access Notables in Skeptical Science New Research for Week #13 2026.
The study discusses the challenging temptation to pursue ‘Private Profits and Rents’ while creating ‘Public Problems’ by extracting and exporting non-renewable resources, especially challenging for developing nations.
The developed economic system is fatally flawed in many ways. One of the major flaws is that it values the removal and use of non-renewable resources, and ignores the harm done (it also encourages more harm to be done because it is easier and more profitable to be more harmful). Non-renewable resources have no value when they are left in the ground.
And the challenge is made worse by unjust made-up rules like the 1994 Energy Charter Treaty (Wikipedia link) (ECT). The EU formally withdrew from the ECT in June 2024. But the ECT rules were include ‘protection’ of Fossil Fuel investment rewards for 20 years after withdrawal (to 2044).
Another recent related item is Quantifying climate loss and damage consistent with a social cost of carbon, the first item listed in Open Access Notables in Skeptical Science New Research for Week #14 2026, (which was the basis of news item, Past CO2 emissions may drive far bigger future economic losses, in 2026 SkS Weekly Climate Change & Global Warming News Roundup #13). The study explains that calculating the penalty owed today for fossil fuel harms of emissions-to-date should begin as early as 1980 and extend far into the future.
The following quote is regarding the earliest date it would be reasonable to say leaders would struggle to deny understanding the harmfulness of fossil fuel use:
To estimate when to begin counting emissions, we set our baseline ‘year of knowledge’ as 1990, or a year after the establishment of the IPCC. This is perhaps conservative: using text-based analysis of United Nations documents, other analyses set the date a decade earlier, and internal company documents reveal that some major emitters were aware of climate risks beginning around 1980.
Any pursuer of profit from fossil fuel use since 1990, and potentially since 1980, would struggle to credibly claim that they were unaware of the harm done by fossil fuel use. This reinforces the understanding that the Energy Charter Treaty was an unjust rule made-up by undeserving wealthy people.
Both studies also relate to Don Gillmore’s 2025 book, On Oil that I recently commented about (here @ comment 25 on the SkS post, After a major blow to U.S. climate regulations, what comes next?). In addition to presenting the general understanding that Alberta and other regional populations are easily tempted to pursue benefit from harmful fossil fuel use, and things really took off in about 1980, the chapter titled The Battle Begins opens with the following reinforcement of 1980 as a legitimate start date for evaluating penalties to apply to beneficiaries of harmful fossil fuel use:
In 1980, Ronald Reagan became president of the United States and appointed James Watt, a determined anti-environmentalist, as secretary of the Department of the Interior. Watt described environmentalists as “a leftwing cult dedicated to bringing down the type of government I believe in,” and refused to meet with them. Watt was a devout Christian who believed the End Times were near. “I do not know,” he said to Congress in 1981, “how many future generations we can count on before the Lord returns.” In the meantime there wasn’t much point in preserving the environment. Reagan concurred, telling television evangelist Jim Bakker, “We may be the generation that sees Armageddon.”
Anne Gorsuch, a lawyer who was scornful of climate science (and whose son Neil sits on the Supreme Court), was given the role of Administrator of the Environmental Protection Agency, and cut the EPA budget by 22 percent and staff by almost 30 percent. Enforcement declined by 79 percent during her first year. She hired people from the industries the EPA was supposed to be regulating, tried to weaken pollution standards, and facilitated the use of restricted-use pesticides. She resigned in 1983 amid scandal, ... Her most lasting legacy may have been to solidify political battle lines around oil and the environment: If you were a Republican, you were pro-development and, if not anti-environment, at least anti-environmentalist. It began as a corporate issue, then became a political issue and to some extent a generational issue, and finally, like so much these days, it became a tribal issue.
The formation of the ECT in 1994, 14 years after 1980, should be understood to be a misleading attempt to unjustifiably obtain benefit and protect against the loss of undeserved perceptions of superiority. And since 1980 it has continually become clearer that investments in new fossil fuel pursuits should be considered to be bets in the marketplace that deserve whatever ‘penalties or losses of opportunity for benefit’ happen. The people who benefited from the delay of transition away from fossil fuel use since 1980, particularly business leaders and investors, could and should be penalized rather than be protected and rewarded. ‘Legal creations’ like the ECT should not be able to be used to evade penalty for past ‘bad bets made on benefiting from fossil fuel use’.
There is a long diverse history of harmful pursers of personal benefit seriously damaging and delaying the development of sustainable improvements for the future of humanity. The, now officially discredited, Doctrine of Discovery developed as Papal Bulls in the 1400s (Link to Canadian Museum for Human Rights) and was formally brought into American Law by US Supreme Court Justice John Marshall in 1823 (Link to Wikipedia). It was misleading marketing to excuse undeniably harmful colonialism, racism, and slavery. The incorrect beliefs about the ‘fundamental superiority of a sub-set of humanity’ persist in the supposedly most advanced societies today, and contaminate the thoughts and actions in many developing societies, allowing neocolonialism (link to Wikipedia) to flourish.
People passionately pursuing being perceived to be “The Winners” are most likely “The Problem”.
I have also been re-reading Thomas Piketty’s 2021 book, A Brief History of Equality (first english translation 2022). The following are selected related quotes:
From Chapter 9, Exiting Neocolonialism, which includes a sub-section with the heading, The Pretenses of International Aid and Climate Policies.
The battle for equality is not over. It must be continued by pushing to its logical conclusion the movement toward the welfare state, progressive taxation, real equality, and the struggle against all kinds of discrimination. The battle also, and especially, involves a structural transformation of the global economic system [including reparations (penalties) for harms done by past emissions, and no compensation for people claiming to be harmed by restrictions of their harmfulness and penalties for being harmful] .
…
Our current economic organization, which is founded on the uncontrolled circulation of capital lacking either a social or environmental objective, often resembles a form of neocolonialism that benefits the wealthiest persons. This model of development is politically and ecologically untenable. Moving beyond it requires the transformation of the national welfare state into a federal [multi-national] welfare state open to the global South, along with a profound revision of the rules and treaties that currently govern globalization.
...
We must also emphasize the extreme hypocrisy that surrounds the very notion of international aid. First, public aid for development is much more limited than is often imagined: in all, it represents less than 0.2 percent of the global GDP (and scarcely 0.03 percent of the global GDP for emergency humanitarian aid). In comparison, the cost of climatic damage inflicted on poor countries by past and current emissions from rich countries amounts by itself to several points of the global GDP. The second problem, which is not a detail [not a minor technicality], is that in most of the countries supposedly “aided” in Africa, South Asia, and elsewhere, the amount of outflow in the form of multinationals’ profits and capital flights [evading taxation] is in reality several times greater than the incoming flows from public assistance, …
Chapter 10 sub-section with the heading, Climate Change and the Battle Between Ideologies.
All the transformations [sustainable improvements reducing harmful inequality] discussed in this book, whether the development of the welfare state, progressive taxation, participatory socialism, electoral and educational equality, or the exit from neocolonialism, will occur only if they are accompanied by strong mobilizations and power relationships. There is nothing surprising about that: in the past, it has always been struggles and collective movements that have made it possible to replace old [harmful unsustainable] structures with new institutions.
…
Environmental catastrophes are, of course, among the factors that may help accelerate the pace of change. In theory, we could hope that the mere prospect of these catastrophes, whose future occurrence scientific research has increasingly confirmed, might suffice to provoke adequate mobilization. Unfortunately, it is possible that only tangible concrete damage greater than we have already seen will manage to break down conservative attitudes and radically challenge the current economic system.
…
In the darkest scenario, the signals will come too late to avoid conflicts between nations over resources, and it will take decades to realize possible, as yet hypothetical reconstructions [sustainable developments like Diversity, Equity and Inclusion pursuits to mitigate and correct high levels of inequality] [we are potentially already experiencing that Darkest Scenario].
…
We can also foresee hostile reactions towards countries and social groups whose ways of life have contributed most to the disaster, starting with the richest classes in the United States, but also in Europe and the rest of the world.
…
the global North, despite a limited population (about 15% of world population for the United States, Canada, Europe, Russia, and Japan), has produced nearly 80% of the carbon emissions that have accumulated since the beginning of the Industrial Age.
…
However, we have to qualify the idea that a green Enlightenment will be likely to save the planet. In reality, people have suspected for a long time – indeed almost since the beginning of the Industrial Revolution – that this accelerated burning of fossil fuels might have harmful effects. If reactions have been slow and remain so limited even today, that is also and especially because the economic interests at stake are considerable, between countries as well as within them. For the countries most affected (in particular in the global South), the attenuation of the effects of a warming climate and financing for measures to adapt to it will require a transformation of the distribution of wealth and the economic system as a whole, and this in turn will involve the development of new political and social coalitions on a global scale. The idea that there might be only winners is a dangerous and anesthetizing illusion that must be abandoned immediately.
It all closes back to the SkS items that this comment started with.
People passionately pursuing being perceived to be “The Winners” are most likely “The Problem”.
- Why Science Communication Fails: How to Break Down Misleading Arguments and Inoculate Against Misinformation
Eric (skeptic) at 08:00 AM on 17 March, 2026Geography has long been recognized as the primary control knob for the earth's climate: www.jstor.org/stable/pdf/1635493.pdf CO2 is an important but sporadically exogenous factor, but mostly an amplifier of geographic or solar or other forcing.
- Why Science Communication Fails: How to Break Down Misleading Arguments and Inoculate Against Misinformation
Eric (skeptic) at 07:34 AM on 17 March, 2026Just Dean, at the risk of beating the dead horse a bit more, may I ask if you agree that radiative physics plus projected manmade CO2 produces the red dashed line in the diagram? If your answer is yes, then how do we reach the black dashed line, even if that requires millenia? My answer is yes dashed red line exrended linearly is where we end up, and reaching the black dashed line requires Pangea. Others will probably disagree with that, and note that other models show the dashed red line bending upwards in the long run.
I disagree with the control knob characterization. Sometimes exogenous CO2 is the cause of warming, like Siberian traps, PETM, and manmade today. Occasionally exogenous CO2 drawdown is the cause of cooling. An example is enhanced silicate weathering from tectonic uplift.
The rest of the time, CO2 is "merely" an amplifier of temperature changes by causes other than CO2 in both directions as the fast and slow feedbacks kick in.
- Why Science Communication Fails: How to Break Down Misleading Arguments and Inoculate Against Misinformation
Eric (skeptic) at 09:23 AM on 16 March, 2026Just Dean, thanks for the explanation and updated version of your essay. I signed up for a Science account and read through Judd 2024. They explain geography thusly:
the change in the proportion of land to ocean area relative to today (29, 84). The impact of these paleogeographic changes on planetary energy balance can be treated as a forcing (ΔFgeog) (29, 81). In the Ordovician, subaerially exposed continents constituted only ~15% of the total surface area of the planet (compared to ~30% today), with the value increasing quasi-linearly across the Paleozoic (fig. S12). This results in an overall lower surface albedo for the Paleozoic and thus a positive forcing.
My question to you is are they claiming that geography, which they simplify to a forcing, is solely a temperature effect in the context of equilibrium? We agree that geography drives the CO2 and temperature to different sections of the curve, but the key question is how. I may be mistaken but I believe your main claim is that ocean circulation and temperarture changes affecting CO2 are a key determinant of equilibrium, minus current manmade CO2 which you would consider similar to examples in Judd such as Siberian traps and PETM.
Do you believe that current ocean circulation is unimportant (or perhaps I should say non-consequential) for long term equilibrium given present day geography? Or perhaps as some suggest, deepwater formation will slow with global warming? If so then we can perhaps reach a point close to the Judd curve as the long term feedbacks add more sequestered CO2 to atmosphere overwhelming the slowing uptake.
However I believe we are currently in a cold geography evidenced by the million year ice age, reaching CO2 starvation levels during full glaciation. The primary measurement of cold geography is ocean temperature sustained by cold deepwater formation but warmed from above by manmade warming. AI tells me the ocean's warming rate is 2.2 mC per year or 0.22C per century. This affects sea level of course but also CO2 absorption modulated by vertical ocean temperature profile.
In short, it appears that Judd's simplified (perhaps oversimplified) view of geographic forcing treats that forcing as negative with present day geography. Do you believe that would preclude reaching the corresponding temperature on the Judd curve?
- Why Science Communication Fails: How to Break Down Misleading Arguments and Inoculate Against Misinformation
Eric (skeptic) at 09:19 AM on 15 March, 2026Just Dean, the dashed black line in the diagram in justdean.substack.com/p/how-one-diagram-reveals-the-climate comes from geographic changes that drive both temperatuire and CO2. CO2 is an amplifier of temperature and temperature is an amplifier of CO2, but geography dictates global temperature. Prominent examples are Antarctica cooling with opening of Drake Passage www.researchgate.net/publication/256822123_Influence_of_the_opening_of_the_Drake_Passage_on_the_Cenozoic_Antarctic_Ice_Sheet_A_modeling_approach Arctic glaciation with closing of Isthmus of Panama: www.sciencedirect.com/science/article/pii/S0012821X05004048 There are others.
The steepness of the purple dots is due to the combination of CO2 and temperature mutual feedback added to albedo feedback from the forming and retreat of the continental ice sheets.
So we are left with the green and red lines. In the text they assert that CO2 stays high centuries after net zero (" even 700 years after emissions cease, roughly 85–99 percent of peak warming persists. Atmospheric CO₂ remains at more than half its peak value") I beat up the AI to get current numbers:
"Thus, the ocean absorbs ~9.2 Gt of CO₂ per year from the ~1,191 Gt excess currently in the atmosphere." or 0.77% per year. That 0.77% per year will drop as the excess atmospheric CO2 drops and the ocean saturates, but it suggests less than a century to drop to half, not multiple centuries. All hypothetical of course, but it also suggests we can start to see a drop before net zero.
- Why Science Communication Fails: How to Break Down Misleading Arguments and Inoculate Against Misinformation
Just Dean at 01:17 AM on 12 March, 2026Bob,
I appreciate you engaging.
However, I would really value specific reviews and comments of my efforts to tell the climate change story with one diagram. My diagram overlays the deep-time equilibrium relationship with glacial–interglacial data from the past 800,000 years and instrumental observations from the industrial era, along with a representative future scenario. Viewed together, these datasets place contemporary climate change within a broader Earth-system context. Skeptics and contrarians often cherrypick individual plots of CO2 or temperature or individual lines of evidence. It is harder when they are all plotted together on a common axes.
I have not seen this combination of datasets anywhere before and so I would really value reviews and feedback from the skeptical science community.
Here's the link again to my Substack post: [Link]
- Why Science Communication Fails: How to Break Down Misleading Arguments and Inoculate Against Misinformation
Bob Loblaw at 00:09 AM on 12 March, 2026Dean:
One of the tremendous strengths of the contrarian position is the ability to engage in compartmentalization. The ability to almost completely isolate individual lines of evidence allows one to believe several conflicting and incompatible ideas. My favourite is global temperatures: completely unreliable and incapable of telling us anything - until a contrarian thinks the record shows cooling that "disproves global warming".
From the wisdom of Alice in Wonderland:
“Alice laughed. 'There's no use trying,' she said. 'One can't believe impossible things.'
I daresay you haven't had much practice,' said the Queen. 'When I was your age, I always did it for half-an-hour a day. Why, sometimes I've believed as many as six impossible things before breakfast. There goes the shawl again!”
As you state, in science the stronger explanations are the ones that combine multiple lines of evidence and provide a small number of factors that explain a large number of observations. That requires looking at and combining multiple observations.
One example of reviewing many factors related to climate change is an old post here by Tom Curtis - Climate Change Cluedo: Anthropogenic CO2. By approaching the question like a murder mystery (the game Cluedo, or Clue), Tom brings together a series of lines of evidence ("clues") that tell us who the killer is.
- Trump just torched the basis for federal climate regulations. Here’s what it means.
One Planet Only Forever at 07:52 AM on 2 March, 2026Responding first to Bob Loblaw @27, adding to Bob and Nigel’s discussion, and adding to Other comments like prove we are smart:
My perspective can definitely be considered to be “...one where nobody has the right to force harm on others….a call to Freedom - each person needs to be free from others causing them harm.” It is aligned with the Universal Declaration of Human Rights (UDHR) and related understandings like the Sustainable Development Goals (Goal 13 is Climate Action), the Planetary Boundaries, and key related understandings based on climate science like the Paris Agreement.
Note that the UDHR ‘tells people, especially leaders, that there are justified limits and expectations regarding how they act’ – they need to be governed by learning to be less harmful and more helpful to Others. If they won’t responsibly self-govern that way they should expect to be limited by responsible leadership. That is what self-governing professional bodies, like professional engineers and medical professions, do. As a Professional Engineer one of my responsibilities was to be willing to ‘Say No, and explain way’ in response to a client’s unacceptable desire or demand.
I often sense that people want the freedom to believe and do as they please. And they want ‘a better present for themselves’ rather than ‘caring to develop the gift of a better future for others’. They are not interested in Inter-generational Equity (see the Wikipedia page). They discount the future (see Why environmental policy struggles to value the future earth.com, Eric Ralls, Jan 25, 2026. part of the listing of the 2026 SkS Weekly Climate Change & Global Warming News Roundup #05). They try to argue that they are harmed if others govern them in ways that limit the harm they can do, often arguing that they do not accept the understanding that what they want the freedom to do is harmful.
Telling people that ‘future generations will have to live without using fossil fuels because burning non-renewable resources cannot be continued indefinitely and that, in addition to fossil fuel use being unsustainable, it is harmful’ seems to really enrage some people. They often try to claim that the marketplace of business and politics should govern who gets to be harmful. I agree with them as long as the marketplaces are effectively governed by learning to be less harmful and more helpful to Others rather than being compromised by harmful misleading competition for perceptions of superiority. That seems to make them angrier.
As a result I agree with the need for comprehensive consideration of all ‘stakeholders’ on an issue. I would add that ‘all future people’ need to be considered. And I would clarify that the evaluation of everyone’s potential for harm does not mean compromising harm reduction because of some stakeholders wanting to benefit from the harm.
____________
Related to prove we are smart’s comments,
it is becoming undeniable that the US is a failing state. It is failing to make its leaders face consequences for deliberately misleadingly pursuing benefit from causing more harm to Others, especially future generations.
The likes of Trump seem to act based on a world-view of negative-sum competition, harm is the major motivation for everyone. They believe everyone pursues personal benefit any way they can get away with. Their game-perspective is to benefit more from harming Others than Others harm them.
That is fundamentally contrary to being governed by the UDHR which is a positive-sum game world-view with the understanding that collective action based on learning to be less harmful and more helpful to Others will result in sustainable improvements for everyone … except for those people who benefited from harmful behaviour in the past who may lose some developed perceptions of higher status (and deserve that loss of status).
_____________
Regarding Inter-generational Equity.
The Sustainable Development Goals (SDG) and Diversity Equity Inclusion (see this Oxford Review item on Inter-generational Equity) are parts of the diversity of continuing to improve evidence-based understandings.
The SDGs are based on understanding that ‘future humans need to have equality of Rights and Freedom from harm’.
That exposes the harmful limitation of developed legal thinking, especially thoughts that ‘threat of legal consequences is all that is needed to ensure better, less harmful and more helpful, behaviour’. Legal remedy often requires ‘proof of actual harm done prior to (as the basis for) making the legal claim’. The threat of ‘Harms discovered later’ resulting in negative consequences for the people who benefited from the harm done in the past, or from actions that had higher risk of future harm, is a tragically weak deterrent.
The legal validity of Inter-generational Equity, especially regarding CO2 emissions pollution, is increasing, much to the chagrin of people who want the freedom to maximize their benefit from actions that harm Others. Legal implications of Inter-generational Equity are that leaders would be subject to consequences if they fail to act to equitably protect future generations from human caused climate change harms.
_______________
Summary
The US has developed the ability to have the most helpful or most harmful leadership on this planet. Tragically, the voting population of the US has repeatedly proven that it likes its leadership to be Harmful To Others, including future generations of global humanity.
Clearly, the ‘Fix’ will require systemic changes to significantly increase the evidence-based justified Freedom of future generations of humanity from harm done by the unsustainable pursuits of benefit by current generations and their predecessors. The most harmful in the current generation need to most rapidly change their ways of living and profiting, even if it reduces their status relative to Others. And the biggest current day beneficiaries of the history of CO2 pollution harm owe the most towards repairing the damage done and helping Others adapt to the harmful changes that have already been caused.
One helpful action would be effective penalties for elected representatives and appointed representatives who are discovered to be misleading.
- Read the comments regarding new Welsh government rules to penalize misleading representatives made on SKS item “New Book - Climate Obstruction: A global Assessment”
- Refer to CBC article “He was hired to fight for Wales's future generations. Does Canada need a job like that?’
It is no surprise that people wanting to benefit from being harmful dislike increased awareness and understanding of the Universal Declaration of Human Rights; Inter-generational Equity; Diversity, Equity and Inclusion; Sustainable Development Goals; Planetary Boundaries; and Climate Science and so much more. All that pesky Wokeness is likely to result in ‘Less Freedom for them to do what they want to do … from their perspective … the End Times are Coming.
- After a major blow to U.S. climate regulations, what comes next?
Bob Loblaw at 02:47 AM on 27 February, 2026Eric @ 15:
Thanks for the clarification. Yes, I think the last sentence in the OP is a little vague. It could mean "Oh, Gawd. The states and Congress will muck this up and never do anything." Or it could mean "We have an opening for the states and Congress to take action."
The downside of action at the individual state level is patchwork of regulations that makes interstate commerce difficult and/or expensive. And it makes for "that's not my problem" decisions if Ohio decides they love coal and hate New York. Canada was also a recipient of acidic winds from places in the US. Canada and the US did agree to bilateral action on the issue (both reduction and monitoring).
And interstate patchworks are even more difficult at the international level. Too many times I've heard the argument "Canada only produces 2% of the world's CO2. It won't make any difference if we cut it all." My response is "Yes, and the rest of the world consists of 49 other regions that also only contribute 2% of the total. They can make the same excuse, and then nothing happens." It's the poster child for tragedy of the commons.
Controlling emissions also can't be done pragmatically on a patchwork basis. Everyone has an excuse why their industry should not be limited, or should get extra credits. Carbon taxes (or "fee and dividend"), carbon credits and cap-and-trade systems. All will fail when only applied locally. Taxes are avoided by relocating production to low- or no-tax jurisdictions. Cap-and-trade requires a market large enough to provide sufficient flexibility.
Going slowly is better than not going at all, but going too slowly won't get us where we need to go. (When I was a grad student, we were at the pub one Friday evening. My office-mate was supposed to meet his girlfriend at 7pm, but as 7pm approached he decided to stay for another beer or two. He said "I'm late already; it won't matter if I'm even later." On Monday morning, when I arrived at the office, his first words were "Remember when I said Friday night it didn't matter if I was even later? I was wrong.")
- After a major blow to U.S. climate regulations, what comes next?
Eric (skeptic) at 21:59 PM on 26 February, 2026Bob @8, when I first read the last sentence of the article I thought they were lamenting the need for states and Congress to do something. Upon rereading perhaps they are considering that as a good option as I do. As you saw, Roberts bascially says that issues like global climate stability are not juisticiable. He says Mass has no standing as they cannot show a justiciable (physically consequential) connection from lack of EPA vehicle regulation to their coastline.
Your conclusion "That seems to represent an opinion that the tragedy of the commons is fine with him [Roberts]" is correct. That was basically the reason for the Clean Air Act: pollution in Ohio causing acid rain in New York. Thus the remedy for tragedy of the commons is legislation, not a pretense of justiciability. Keeping 2007 as precedent? That means more special solicitude for environmental cases with courts wading even further into scientific questions.
My wording was inexact, I should have said: "numeric standards for CO2 emissions". Texas (e.g.) will point out the current economic benefits of their higher emissions. Massachusetts will argue for future global benefits of their ongoing energy transition. Since both of those numbers are rather small, they will probably settle on a 2050 numeric standard approach and put some more money into transition. Maybe 2040 since 2030 is too close at hand. I would propose R&D money and let the emissions standards decrease more gradually.
I realize the consensus here is against gradual approaches. We'll never agree on that.
- Trump just torched the basis for federal climate regulations. Here’s what it means.
nigelj at 07:20 AM on 25 February, 2026OPOF @26 talks about how structural design codes are formulated. In New Zealand we have a building code which deals with structure, waterproofing, plumbing etc,etc. Its focused on issues of safety and durability only not aesthetics etc,etc. Its essentially a set of regulations on what you can, and cant do.
The building code is prepared by the Ministry of Business, Innovation and Employment (MBIE) . The building code sets objectives and performance criteria. The code allows for acceptable solutions to these criteria and objectives. These can be provided in different ways. One way is for an engineer or other expert to do a design from first principles and submit this to a local government council for approval by their technical people.
Another way is to base the design on prescriptive rules contained in the NZ Standards. Standards New Zealand are part of MBIE. Standards are written by technical committees of engineers, industry experts, councils, and other stakeholders. So there is industry input which is a little bit worrying but theres also something to be said by getting all stakeholders involved and this is a consultation issue. MBIE don't have to do what industry want.
The final building code is signed off by the Governments Cabinet. Which is essentially an executive body. It is not signed off by Parliament. We have a Building ACT which is quite general in nature, and voted on in parliament. The ACT ultimately requires a detailed building code.
If people hate what the government is doing with the building code they can of course elect another government.
Not wanting to restart my comments on the regulations related to the CO2 issue, but its just the huge implications of this issue that made me wonder if some sort of sign off of regulations should be done by parliament / congress. The Republicans talk about the major questions doctrine. But I can certainly see the arguments against all this and I dont have a firm view either way on the issue. One thing I think we all agree on and have firm views on is the details have to be left to the experts.
Given the endangerment finding is in considerable danger, fortunately with the climate change issue there are other ways to regulations of mitigating the problem such as carbon taxes, cap and trade and subsidies. I've always thought the regulatory approach to mitigate the climate problem, would become a complicated nightmare, and bogged down in arguments about who gets to sign off the regulations.
- After a major blow to U.S. climate regulations, what comes next?
Bob Loblaw at 01:18 AM on 25 February, 2026Eric @ 6:
I'm not sure exactly which "conclusion is basically backwards". I'm not even sure if you're responding to someone else's comment, or the OP itself. Can you be more specific?
You link to the 2007 decision. I've had a quick look. It is rather long. Is there a specific part that you think is particularly important?
One thing that Roberts says in his dissent is that CO2 is basically a global issue. In the early part of that decision, it says "Roberts pointed out that much of the impetus behind global warming comes from foreign nations that have no environmental regulations." That seems to represent an opinion that the tragedy of the commons is fine with him.
- How would your proposed "numeric standards for CO2" work? Local CO2 values can vary quite a bit depending on local emissions, local sinks, weather, season, etc. Away from local effects (e.g. Mauna Loa), levels are broadly global, and individual states can't do much. Putting a limit on raw CO2 level seems impractical.
- If you are thinking of regulating emission quantities, how do allowable limits get set across states, industries, etc?
- The Roberts dissent (from only a quick glance) seems to hinge on "courts don't belong here", with a healthy dose of "doubt is our product". I think you're correct that they don't want to put "doubt is our product" in writing too obviously.
- I think the current court has made it pretty clear in decisions over the past few years that precedent is not a strong legal position in any case.
- After a major blow to U.S. climate regulations, what comes next?
Eric (skeptic) at 18:59 PM on 24 February, 2026The conclusion is basically backwards. The best case is for states to experiment with solutions and have Congress write laws to set numeric standards for CO2 just like they did for CO. The worse case is to go to the Supreme Court and watch them rule 6-3 against the same thing they ruled 5-4 for in 2007. It's pretty simple: decisions based on policy, or even worse, science, do not create strong legal precedent. Please read the Roberts 2007 dissent that I will again link here: Massachusetts v. EPA, 549 U.S. 497 (2007)
If the USSC decides a similar case, a 6-3 decision will hinge on Roberts 2007 logic both in deference to the legal issues and to Roberts himself. The three liberal justices will maintain the Stevens argument and argue it's even more crucial today. The other six may secretly harbor Scalia's merchandizing of doubt, but won't put that in writing.
How will Congress pass those laws? Good question, a simple majority in the House is inevitable thanks to my state of Virginia gerrymandering and anti-Trump sentiment. 60 votes can be purchased in the Senate by sending enough money to farmers regardless of party control.
- Trump just torched the basis for federal climate regulations. Here’s what it means.
nigelj at 11:42 AM on 23 February, 2026Bob Loblow @20
BL: "You qualify that in your third paragraph by saying that the politicians should make the major decisions - but how do you decide what are the major decisions, and what decisions are not?........So, the law really needs to allow the executive branch to have some flexibility to look into "unknowns"."
I'm suggesting that if a regulatory proposal is found to have a huge potential impact on society like regulating CO2, the final determination of whether its a pollutant and needs regulations, and the final approval of such regulations should rest with the legislative branch by way of vote. Maybe the EPA should be required to apply a test, and it can do so at any stage the regulatory issue in the chain of assessment. Perhaps its possible to look at the likely impact of the regulation on the economy and say if its above level xyz it needs to go to the legislature. You could look at imapct on gdp or wages or whatever. It doesnt have to be something perfect , just enough to ensure the legislature gets the big issues to vote on, and not too many small issues to deal with.
Perhaps look at the history of regulations going back a few decades and on the economic impacts and identify the costs of the 10% or 5% of regulations with the greatest economic impacts and then this cost becomes the threshold where any new regulations have to go to the legislature for final approval. That means the legislature aren't overburdened with too many to consider.
Even if things are left to the executive branch to figure out whether something is a pollutant, and they have the flexibility to look into unknowns, they can still be required to do the test I suggested, at some point in time when its appropriate.
Sorry about my use of the term elected politicians. It was confusing.
- Trump just torched the basis for federal climate regulations. Here’s what it means.
nigelj at 16:08 PM on 22 February, 2026Bob Loblow: "You can argue whether the Clean Air Act and other legislation gave too much discretion (or not enough) to the EPA, but the EPA is expected to act according to the directions it was given by legislation..."
Yes thats precisely what I'm doing. I'm arguing the clean air act gives too much discretion to the EPA. For me the decisions on whether a chemical is an air pollutant and should thus be regulated should rest with elected politicians. At least in respect of substances where the implications would be huge like CO2. I accept you cant have politicians decide on every single chemical substance, as you say things would grind to a halt.
As I already said we elect politicians to make the major decisions, and surely what we do about CO2 is a major decision. The details of how regulations might be structured can of course be left to something like the EPA. Of course its really just my opinion so I wont labour the point further.
And this looks like its part of the rationale that has overtuned the endangerment finding, along with some sort of argument about the costs of the endangerment finding and regulating CO2 allegedly exceeding the benefits (Im not sure the EPA have proven that by a long way.)
Now I hope this overturning of the endangerment finding is challenged in court. The endangerment finding was the law, and even although I dont believe its the ideal sort of law to fight climate change, and was always at risk of coming unstuck, it was the law and it seemed to have reasonably wide public support. And it was helping promote EV's. On that basis its ok law in a democratic sense. And its better than nothing. Hope that doesn't sound contradictory.
The scientific community and lawyers did well undermining the CWG / DOE junk science report, on both the science and the lack of proper transparency of process. That had to be done for all sorts of reasons.
- Trump just torched the basis for federal climate regulations. Here’s what it means.
Bob Loblaw at 11:50 AM on 22 February, 2026nigel: you say "... then defer major decisions on what becomes law..."
...but as I explained earlier at least in the Canadian sense, is that the technocrats (I don't really like that term, but "executive branch" or "administrative branch" doesn't really cover it, either) don't make law writ large. They just apply the law to create rules and regulations in a manner clearly delegated by the elected legislative branch.
It's not a case of "well, we're not going to deal with that; let's let the bureaucracy deal with it". It's more a case of "we've thought about it, and we've established the way we want it dealt with, but we will leave the details to the technocrats". The legislature is still responsible for what happens (you can't delegate responsibility), but the subordinate administration is given the authority (which you can delegate) to act.
In the case of the endangerment finding, the earlier legislation (Clean Air Act) determined that the EPA was responsible for regulating air pollution that had detrimental effects on people or the environment. AFAIK, the original legislation did not list every chemical that was considered a pollutant - it left that as a determination for the EPA. Then came the question of whether CO2 needed to be included on that list, and after several levels of court cases, the USSC said "yes, the science says CO2 is an air pollutant, and the EPA must take steps to review it and regulate it if necessary". The recent EPA position is that it is not a pollutant that is causing any harm. (I'm sure that lawyers will make more money out of this.)
So, it is not a case that the EPA decided that regulating air pollutants was something it needed to do - that decision was made in the legislative branch when the Clean Air Act was passed. The legislative branch delegated the authority to the EPA to determine what (or what not) is an air pollutant (with a little help from the courts).
What I am sure will be the legal process moving forward is questions as to whether the current EPA decision actually followed all the legal obligations set out in various legislation. The EPA was not told via the Clean Air Act to "do whatever you want". The EPA was told "you can make some decisions, but this is the process you need to go through to make your decisions".
In the case of last year's Climate Working Group (the gang of five that produced the hugely biased report), there were legal challenges in the works that took the EPA to task for ignoring the various aspects of the process that the various laws required. The EPA decided to withdraw the report and pretend it never happened - undoubtedly to try to avoid having their new decision challenged in court as a violation of process.
You can argue whether the Clean Air Act and other legislation gave too much discretion (or not enough) to the EPA, but the EPA is expected to act according to the directions it was given by legislation. The cabinet member at the top of the executive branch (Minister in Canada, or the Secretary in the US) can guide how the bureaucracy works, but he or she does need to work within the framework specified in legislation.
If you needed to get new legislation passed to decide if every new pollutant was indeed a pollutant, you'd never get anything done. (That's the current goal in the US, I think.) That's where delegating the decision to some form of expert review process provides flexibility.
- Trump just torched the basis for federal climate regulations. Here’s what it means.
nigelj at 17:38 PM on 18 February, 2026Why not leave it to congress to decide whether the most important pollution regulations should become law, and obviously that would include CO2, and leave it to the EPA to have authority to decide on whether the smaller pollution ssues become law. Surely criteria can be agreed on what issues fit in what category. That way congress dont get overwhelmed with dealing with minor issues that are quite technical
- Trump just torched the basis for federal climate regulations. Here’s what it means.
Eric (skeptic) at 06:01 AM on 18 February, 2026Bob, I agree with you but have more sympathy for the USSC which was asked to decide a scientific / regulatory question with a 5-4 vote in 2007 but would vote 6-3 the other way today. That's not their fault, it's Congress shirking its responsibility to act. The can do it, and have with Diesel Emissions Reduction Act which also lowers CO2 and is bipartisan and continues to be reauthorized. Also the HFC act in 2020. DERA is incentive based, like the bipartisan infrastructure act which some republicans, especially in the Senate, signed onto. Spending more money on whatever is an easy way to buy those votes.
The 2007 case at the USSC is not very general or valuable as precedent. As the Roberts dissent points out it is "special solicitude". Massachusetts cannot enumerate how the loss of vehicle standards will affect their loss of coastal property. Nor can they link how the proposed vehicle standards will save their coastal property, because there are too many other factors not under our control. He states 'The good news is that the Court’s “special solicitude” for Massachusetts limits the future applicability of the diluted standing requirements applied in this case'.
Bottom line Congress needs to create specific numeric targets like CAA did with carbon monoxide. Let industries and/or states decide how to meet them. Or just spend a lot more borrowed money (I do not endorse that approach).
- 2026 SkS Weekly Climate Change & Global Warming News Roundup #04
michael sweet at 05:46 AM on 30 January, 2026CNN has a nice article about Dr Ramanathan who was instrumental in determining the effect of trace gasses on global warming. In rhe 1980's he showed that global warming would cause warming to proceed much faster. Before that scientists thought only CO2 would cause significant warming. Search the title on CNN
"The accidental climate scientist who uncovered an unexpected force of global warming"
- Fact brief - Does clearing trees for solar panels release more CO2 than the solar panels would prevent?
Bob Loblaw at 06:53 AM on 15 January, 2026For readers that are not as dug in to a position as David-acct, there are several posts here at SkS that cover changing levels of CO2 and O2. It's a well-covered aspect of climate science. In general, one of the pieces of evidence in support of the argument that burning fossil carbon is the primary source of increasing atmospheric CO2 is the correlated decrease in atmospheric O2.
Here are posts that discuss this:
What-is-causing-the-increase-in-atmospheric-CO2
How-we-know-human-CO2-emissions-have-disrupted-carbon-cycle
10-Indicators-of-a-Human-Fingerprint-on-Climate-Change
Several of those posts contain graphs of observed atmospheric O2 levels. Here is one, from the second link:

Note that a drop of 70ppm in O2 levels is not particularly worrisome from a human health standpoint. We're at 21%, and OHS warnings don't kick in until O2 drops to about 18%.
...but if David-acct is really worried that we're going to run out of oxygen because science is hiding something, he might want to get on to a path that helps stop burning fossil fuels.
- Fact brief - Does clearing trees for solar panels release more CO2 than the solar panels would prevent?
Bob Loblaw at 05:42 AM on 15 January, 2026You're losing it, David-acct.
Let's quote the full context, since you're big into context:
In the U.S., replacing equivalent natural gas power with one acre of solar prevents about 175 to 198 metric tons of CO2 emissions per year.
In contrast, an average acre of forest sequesters less than 1 metric ton of CO2 per year. An acre of solar cuts roughly 200 times more CO2 than an acre of trees.
Now, since you want to emphasize O2, please do the full calculations to compare the O2 involved in all the fluxes mentioned in that quote from the OP.
Why do you truncate the discussion to just the O2 involved in the forest uptake (which wlil no longer happen)? Is it because looking at the O2 involved in the CO2 reductions from the solar panel installation becomes inconvenient to your advocacy?
The CO2 reduction from the solar panels results in less atmospheric O2 being consumed as carbon is burned. In far greater quantities than the "lost" O2 production from the forest you think is so important.
- Fact brief - Does clearing trees for solar panels release more CO2 than the solar panels would prevent?
David-acct at 05:27 AM on 15 January, 2026CO2 is the bad guy
O2 is the Good guy
Again - Why does the OP truncate - Skip over - important facts ? is it because it becomes inconvenient to present full and complete facts that reflect poorly on the advocacy?
- Fact brief - Does clearing trees for solar panels release more CO2 than the solar panels would prevent?
Bob Loblaw at 05:18 AM on 15 January, 2026David-acct @ 8:
Take your own advice.
The CO2 that is not absorbed involves the same O2 that is not created. I have already quoted the section of the OP that quantifies this: "an average acre of forest sequesters less than 1 metric ton of CO2 per year." That tells us how much O2 will not be produced if the forest is removed.
Unless, as I have asked, you know of some other magical source of O2 released by the forest that is not involved in the forest growth (CO2 uptake).
- Fact brief - Does clearing trees for solar panels release more CO2 than the solar panels would prevent?
Bob Loblaw at 04:56 AM on 15 January, 2026David-acct@5:
You posted while I was preparing #6.
Same question for you: the O in CO2 is O2. What other O2 flux are you going on about?
- Fact brief - Does clearing trees for solar panels release more CO2 than the solar panels would prevent?
Bob Loblaw at 04:53 AM on 15 January, 2026David-acct @ 1:
What on earth are you talking about? The OP specifically mentions "Cutting forest does release stored carbon, but even if all 304 metric tons of CO2 in a forested acre were emitted during construction..."
Are you saying thet there is some unaccounted O2 flux into the forest that is distinct from the O2 that is consumed in turning forest carbon into CO2 (which is included in the above statement)?
Normally, a growing forest (defined by accumulations of carbon, be it trees, other vegetation, soils, or detritus) is releasing O2, as it splits CO2 into C and O2. What exactly is being "not replenished" in your scenario? Are you talking about replenishing atmospheric O2?
- Fact brief - Does clearing trees for solar panels release more CO2 than the solar panels would prevent?
David-acct at 04:39 AM on 15 January, 2026Nigelj - It remains a legitimate question. The article specifically compared.
"Clearing trees to build solar farms does not negate their climate change benefits, because one acre of solar panels prevents far more CO2 emissions than an acre of forest absorbs."
Comparing apples to apples remains a valid question, even if one doesnt like the applicable comparison.
- Fact brief - Does clearing trees for solar panels release more CO2 than the solar panels would prevent?
Philippe Chantreau at 03:31 AM on 15 January, 2026Indeed, let's not forget the part concerning oxygen that is accomplished by every gas, coal and oil power plant, and every single internal combustion engine:
CH+O2 --> CO2+H2O
It seems obvious that if we are concerned about oxygen, this process is also a concern, a rather gigantic one, in fact.
- Fact brief - Does clearing trees for solar panels release more CO2 than the solar panels would prevent?
One Planet Only Forever at 01:43 AM on 15 January, 2026David-acct,
Any reason your question seems to be missing the understanding that a more comprehensive evaluation would include that O2 is removed and locked into CO2 and H2O by the oxidation of fossil fuels?
The evaluation of the impacts of solar farms would be to fully compare them with the impacts of the alternative energy systems, which would be more than the O2 impacts.
I look forward to a more comprehensive evaluation done by you reported back here.
- Venus doesn't have a runaway greenhouse effect
nick51 at 00:21 AM on 5 January, 2026Venus main statistics of the planet.
Size 12,104km
Gravity 8.87 m/s2
Atmosphere co2 96.5%
Clouds circle the planet sulfuric acid
Lapse rate 10.47 K/km
Rotational speed 6.52 km/h
Axis inclination 3 degrees
Energy received from the sun 2,613 W/m2
Super rotational winds (SRW) 100 m/s
Height of sulphuric acid clouds 40 km to 75 km
Direction of rotation of the planet Clock wise
Direction of SRW ACW
Sulphuric acid clouds
clouds are made of 75–96% sulfuric acid.
These are formed by photochemical reactions in the upper atmosphere, involving solar light acting on carbon dioxide, sulfur dioxide (SO2), and water vapor, create the sulfuric acid.
These sulphuric acid clouds drive the climate on Venus.
Properties of sulphuric clouds
Albedo effect is between 0.75 to 0.80, which means they reflect 75-80% of the suns energy
Suns energy is 2,613 W/m2, approximately 2,000 W/m2 reflected back into space.
This leaves 613 W/m2 do drive Venus climate.
Sulphuric acid clouds absorb energy in the ultra violet (UV) which is about 10% of the suns energy and the remaining 20% of visible light left which enters the sulphuric acid cloud, 10% of this is absorbed
UV 450 nm, with a sharp edge around 400 nm. The iron-bearing mineral phases, such as rhomboclase and acid ferric sulfate, dissolved within the sulfuric acid droplets are the likely candidates for this absorption
No IR is absorbed by these clouds.
So the final figures are:-
Suns energy = 2613 W/m2
Reflected by the albedo effect = 2000 W/m2
Absorbed by the UV = 11% = 287 W/m2
Absorbed by the Visible Light = 11% = total = 577 W/m2.
This leaves 2,613 - 2,577 = 36 W/ms arriving at the surface (12 W/m2. Average) This means there can be no greenhouse effect. It is enough to get a faint haze glow on the surface.
So this 577 W/m2 drives the super rotational wind in the Venetian atmosphere.
This heats the clouds, rising the cloud tops to 75km in height.
The clouds are heated on the sunny side most, due to the slow rotation, the super heated clouds move to the cooler atmosphere, 2nd law of thermodynamics, which is in an anti clockwise direction. This causes this super rotational winds of 100 m/s to circle the planet, in a narrow band around the equator, where they lose some energy as the wind circle the planet and spread out towards the poles.
This doesn’t change during Venus year as its axis is only 3 degrees, so there is little or no change as it orbits the sun.
As these SRW approach the dark side the winds increase again as the dark side clouds are lower, and colder, this causes extra turbulence as the hot winds encounter the cooler atmosphere. This also causes more of the winds to migrate towards the poles, combined with the downwelling of the winds. This is shown by the pictures taken by the Japanese orbiter Akatsuki.
The SRW then approach the day side again where they receive extra energy from the sun and continue its journey to where the sun is directly overhead, receiving the 577 W/m2, where the cycle starts all over again.
What happens to the atmosphere as it down wells towards the planets surface.
The atmosphere has its driving force for this rotation now (the super rotation winds down welling):
Adiabatic lapse rate 10.47 c/km (Gravity rating on the specific heat capacity of the atmosphere)
We have the heights that this happens at. (Sulphuric acid clouds between 40-75km) and the temperatures. Two key points are 43km temperature is most earth like 14c, and planets surface temperature 465c.
We also have the adiabatic charts for Venus to check the results
The temperature profile of Venus is shown below:-
Height (km) Temperature (C) Pressure (1 atm)
0 465 93
10. 360 71
20 255 50
30 151 18
40. 49 7
43 14 1
50 -59 -15
60 -164 -37
70 -269 -58
As can bee seen, it explains the pressure on Venus - its driven by the temperature.
- Emergence vs Detection & Attribution
prove we are smart at 00:47 AM on 16 December, 2025As much as I enjoy reading Zekes or Andrew's call out of bad actors like the US DoE www.theclimatebrink.com/p/is-this-the-most-embarrassing-error I really feel an increased sense of apathy from people towards changing our behaviours to reduce co2 emissions.
You know when the US had that really terrible weather disaster year in 2020 www.climate.gov/disasters2020 .Heres a poll taken then and now, the importance of the climate has really taken a back seat www.statista.com/chart/32304/key-issues-in-the-us-according-to-respondents/
Australia too in 2020 had a catastophic fire season en.wikipedia.org/wiki/2019%E2%80%9320_Australian_bushfire_season and the important issues poll produced this www.ipsos.com/en-au/issuesmonitor As in the US poll, interest in the enviroment is currently still declining.
Are we just desensitised to it all now, misinformed or staying wilfully ignorant? Is this the last gasp of the good ole days before the shit really doesn't miss the fan anymore? We are destroying our life support and maybe we can get some control back like this www.youtube.com/watch?v=dQMZR64G_eM or stay in our consumer role like this www.youtube.com/watch?v=8dFa829W1Rk I feel like I know too much now and just say the positive stuff to any younger folk.
- Climate skeptics have new favorite graph; it shows the opposite of what they claim
MA Rodger at 02:32 AM on 13 December, 2025michael sweet @31,
A few thoughts about this +8°C ESS finding (actually it's AESS, taking the increasing solar energy into account).
(1) Hansen has indeed proposed a lower value, famously the graphic below from Hansen & Sato (2012) which even pre-dates the term ESS.
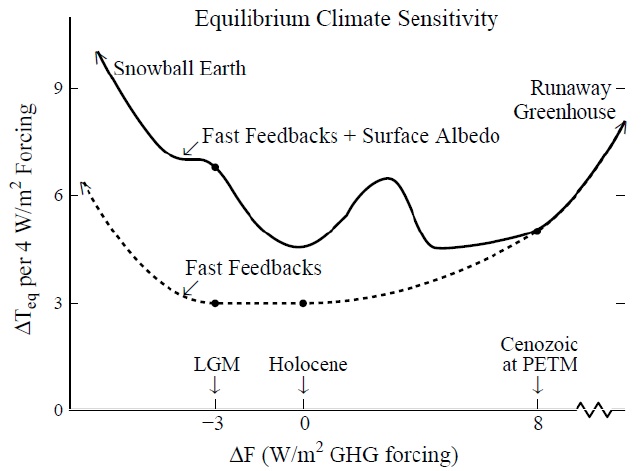
(2) Judd et al (2025) does say its constant ESS=+8°C finding is at odds with other work, but doesn't properly set all this out. For instance, they don't [ro[er;y review CenCO2PIP (2024) who find ESS "generally within the range of 5° to 8°C—patterns consistent with most prior work." I think all would agree that we haven't found a difinitive value for ESS although it will be higher than ECS.
(3) The Earth System equilibrium is very slow to arrive so the opportunity to keep AGW below +1.5°C in the long terms is surely far less of an issue than the shorter-term century-scale AGW.
That is, if CO2 will be three-quarters sucked from the atmosphere over a millenium, the CO2 forcing from modern CO2 emissions (with Af = ~50%) will be halved during the next 1,000 years, the sort of timescale that ESS arrives in. So if ESS ≤ 2 x ECS, it is the shorter timescales we need to worry about regarding temperature. SLR would likely be a good reason for giving natural CO2 draw-down a healthy hepling hand. And the technology to effortlessly do that will not be that long in coming.
(4) But on that point of a future 'effortless' techno-fix for excess CO2, I am always surprised that the post-2100 parts of the IPCC scenatios are not better known. The graphic below is Fig 2 from Meinshausen et al (2020) 'The shared socio-economic pathway (SSP) greenhouse gas concentrations and their extensions to AD2500'. The thumbnail bottom left-hand graph shows net CO2 emissions for scenario-various and if you scale SSP1-1.9 (a scenario which we should be trying to follow), the negative net emissions post-2050 equal all the FF & LUC emissions 2007-2050. That is something I find scary.
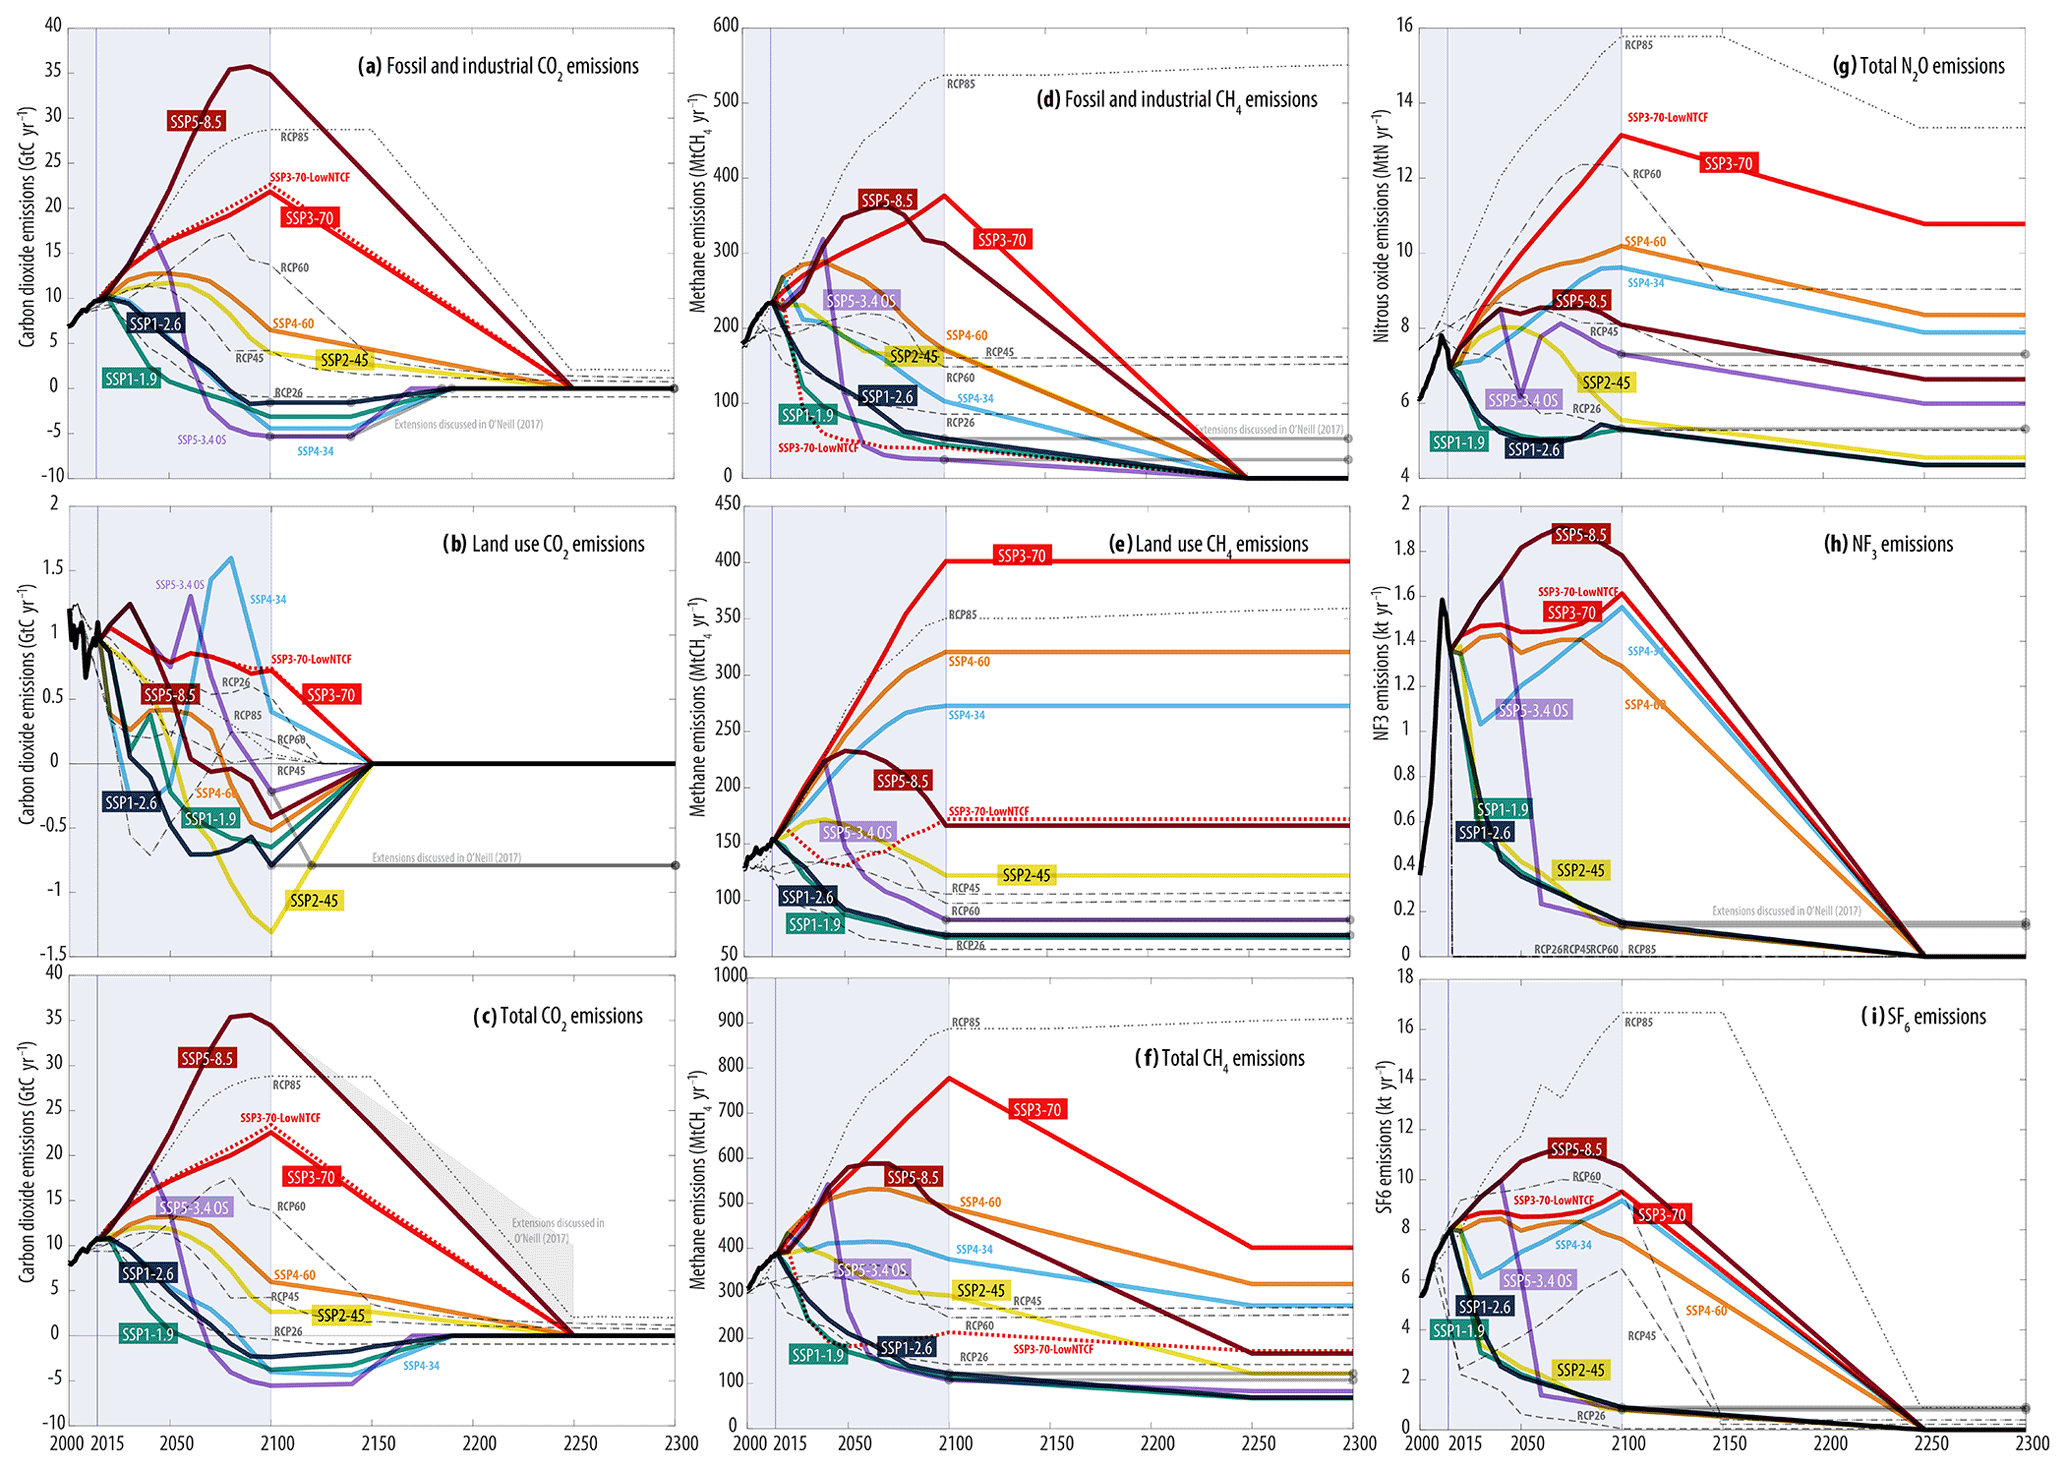
- Increasing CO2 has little to no effect
scaddenp at 05:39 AM on 8 December, 2025For direct measurement of greenhouse effect, try here:
https://newscenter.lbl.gov/2015/02/25/co2-greenhouse-effect-increase/
and here for the Nature paper.
- Increasing CO2 has little to no effect
TonyW at 08:37 AM on 7 December, 2025There is also direct measurement of the effect. https://www.researchgate.net/publication/26638729_First_direct_observation_of_the_atmospheric_CO2_year-to-year_increase_from_space_Atmos_Chem_Phys_74249-4256
- CO2 increase is natural, not human-caused
Bob Loblaw at 01:47 AM on 3 December, 2025sychodefender @ 39:
I am afraid that you start off with an incomplete statistic (% of total CO2 emissions that are man made), which leads you into incorrect conclusions about the role of CO2 emissions in the rise of CO2.
Atmospheric changes in CO2 are the result of net CO2 fluxes - both additions (emissions) and removals. Without human emissions, the natural system was in balance and atmospheric CO2 levels did not change much year to year. (There is a clear annual cycle, though.)
If your 5% argument was correct, then if human emissions stopped we'd continue to see CO2 rise at 95% of the current rate. If this were true, why was CO2 not rising at 95% of the current rate before humans started emitting CO2? Because nature was absorbing that CO2 - that's why. Humans are 100% responsible for the imbalance.
You can read a better explanation of this mass balance issue on this post that discusses other typcial (bad) arguments about CO2 rise. You can also find another discussion of the various clues that lead to the conclusion that anthropogenic CO2 is the cause of the increase in this post titled Climate Change Cluedo: Anthropogenic CO2.
Let's make a simple analogy:
- You start with $1,000 in the bank.
- Your regular income is $5,000 per month.
- Your regular expenses are $5,000 per month.
- After 5 years, you still have only $1,000 in the bank.
- You win the lottery, and the prize is doled out at the rate of $250/month for 5 years.
- You still get $5,000/month in income, and still spend $5,000/month.
- After another five years, you now have $16,000 in the bank - an extra $15,000.
By your math, the lottery winnings are only 5% of your income, so only 5% ($750) of the extra money in the bank is from the lottery winnings. But clearly your regular income and expenses have not changed, and never led to any increase in your bank account (net zero). The extra $15,000 is 100% due to the extra lottery winnings, not 5%.
Let's say you decide to spend half your lottery winnings. You still have $5,000/month income and $250/month lottery winnings going into the bank, but now your spending is $5,125/month. After five years, you will have $8,500 in the bank - added savings compared to your pre-lottery days. (This is a closer analogy to atmospheric CO2, where half the human emissions are absorbed by natural processes.) That extra $7,500 is still 100% due to the lottery winnings.
The rest of your post follows from an incorrect initial assumption. It is wrong.
- CO2 increase is natural, not human-caused
sychodefender at 22:35 PM on 2 December, 2025Only 5% of global annual co2 emissions are man made. Thus 5% of the yearly rise in atmospheric co2 (2.4 ppm) is from human activities.
(2.4 ppm X 5% = 0.12 ppm pa)
Scientists argue about the existence and quantity of various positive feedbacks from the tiny amount of warming that 0.12 ppm produces, but generally they estimate that feedbacks add 300% to forcing.
(0.12 ppm X 300% = 0.36 ppm pa)
So the maximum reduction that we can achieve with net zero is 0.36 ppm pa and this is extremely unlikely to happen this century.
Some other process is occurring to make up the remaining 2.04 ppm pa that is being added to the atmosphere, does this suggest that feedback from the small temperature rise is much more powerful than previously thought?
Or is our belief that this coincidental co2 rise is the driver of significant warming erroneous?
Methane is calculated to be responsible for 30% of warming, 60% of global methane emissions are anthropological, hence theoretically by completely eliminating our methane emissions we could prevent 18% of its influence on temperature increase.
This would necessitate dramatic changes which in all honesty are massively unlikely, perhaps a 10% reduction might be possible this century.
It seems that the ability of these anthropological gases (and their associated feedbacks) to have any significant warming effect is very small indeed.
If we are certain that the measurements revealing an untypical rapid temperature rise are accurate we must search elsewhere for an explanation and hopefully a method of control that is potent, plausible and genuinely achievable on a global basis and timescale.
- Climate skeptics have new favorite graph; it shows the opposite of what they claim
MA Rodger at 05:03 AM on 29 November, 2025RegalNose@26,
In the context of Judd et al (2024)'s graph below (Fig4a in the OP above),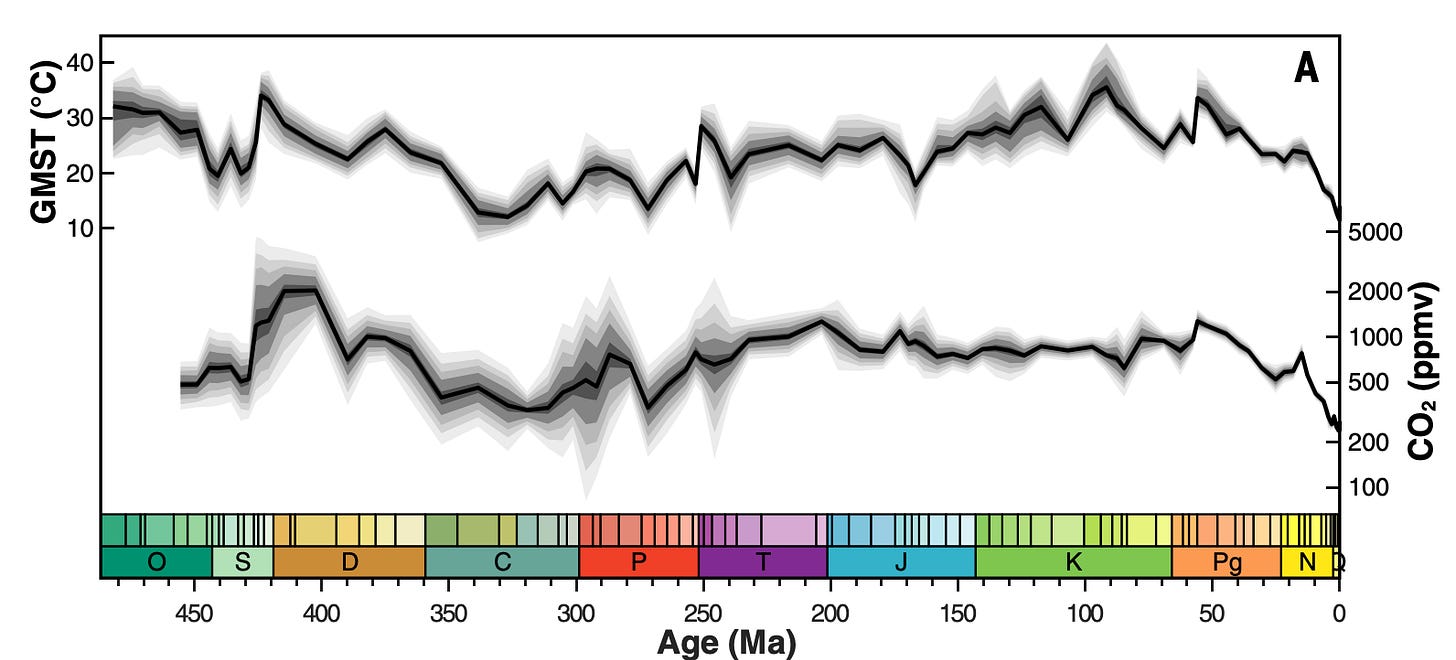
you ask - Isn't the NASA graph (below)
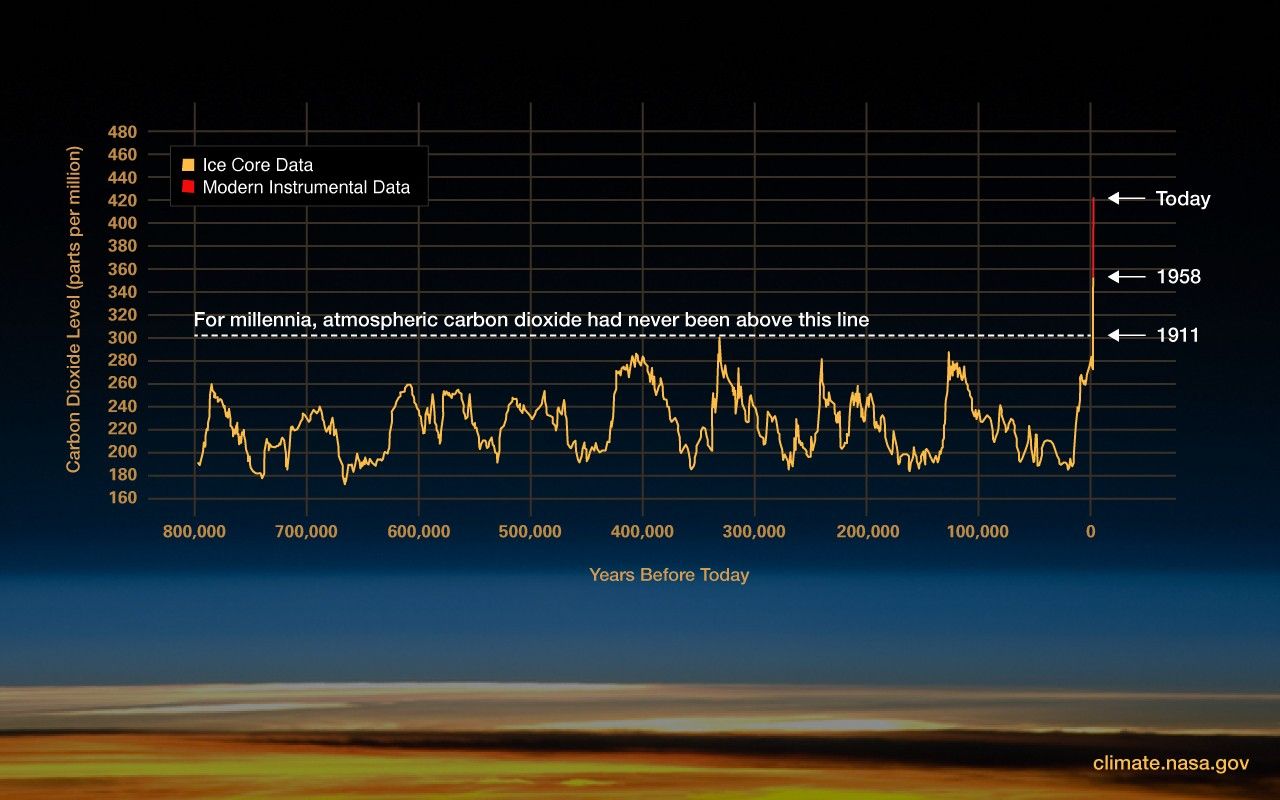
just pure scaremongring?
You ask "What am I missing? Why the panic and crisis mode?"
The OP above does not really answer your question of why CO2 should put us humans into a panic mode.
❶ The OP is firstly addressing the misuse of the Judd et al findings, being converted into total nonsense. It is, of course, difficult to nail down 'total nonsense'. ❷ Secondly, the OP chats about the threat of our CO2 to natural life on Earth rathert than the treat to humanity. ❸ That is not to say we humans should not be panicking.
❶ That first point, the OP presents an exemplar piece of 'total nonsense' which says "There's always this rise and fall." The context here implies it is the global temperatures they are saying "always ... rise and fall."
They continue:-
"This idea that the whole thing is based on carbon emissions from human beings is total bullshit. It's not true. Right. We might be having an effect, but we're having a small effect, a very small effect.”
This quote is 'total nonsense' as the findings of Judd et al, the evidence they are presumably presenting, says the exact opposite. Judd et al say it is CO2 on which the "whole thing is based". From their abstract:-
"There is a strong correlation between atmospheric carbon dioxide (CO2) concentrations and GMST, identifying CO2 as the dominant control on variations in Phanerozoic global climate and suggesting an apparent Earth system sensitivity of ~8°C." [My bold]
And the present-day big actor driving the 'whole thing', the startling rise in CO2 NASA graph above, that is the 'human beings'. This 'whole thing' is not "very small".
Additionally, Judd et al finding "an apparent Earth system sensitivity of ~8°C" suggests the effect is far from "very small" in terms of global temperature.
❷ The threat to nature from to the CO2-rise being so rapid is a major part of the above OP. Perhaps to add a little colour, 56 million years ago the Paleocene–Eocene Thermal Maximum (PETM) was caused by CO2 rising from ~800ppm to ~2,000ppm. The climatic forcing would be the same if we today allow CO2 to rise to 690ppm (and no other GHG increases - accounting for other GHGs, the equivalent would be perhaps 520ppm).
The PETM was not a massive event in historical climate or ecology but it did have pretty big impacts. Consider horses - they shrank to the size of large dogs to cope with the heat. The PETM is often held up as the nearest example of what we are stoking with our man-made climate change. But there is one stark difference. The PETM warming took something like 25,000 years. Our warming is happening 100-times quicker. The sixth mass extinction event which humanity is already threatening with other activities will be a certainty if our warming gets anywhere close to rivalling the PETM's +6ºC.
❸ But we humans are an adaptable species. However the problems are this.
(1) We a very numerous species that relies on a lot of real-estate. Loss of big portions of that real-estate (or even just the projected loss of it) will have big big geo-political consequences. If we could all pull together and address the problems, that may not be so disastrous. But we won't. And I'd imagine climate-change-mitigation measures will not be such a high priority when the world economy collapses and wars of national survival break out.
(2) The climatology cannot tell us how long we can keep melting Greenland to prevent 20ft of sea level rise becoming inevitable, or when the AMOC will disappear plumging Europe into the deep freeze, or when the cloud feedbacks over the Pacific will add another +3ºC to the warming, etc. The +2ºC limit to the warming was dropped in favour of +1.5ºC because tipping-points such as these could potentially be triggered below +2ºC.
I hope that goes some way to explaining "the panic and crisis mode."
- Climate skeptics have new favorite graph; it shows the opposite of what they claim
Philippe Chantreau at 04:06 AM on 28 November, 2025The planet was lush and green very shortly after the end of the last ice age, when CO2 was less than 300ppm. In every region where the avilability of water made their existence possible, forests grew. They covered an immense area of the globe before humans started cutting them down and slashing/burning. Megafauna existed also and was in fact richer than now, even during the ice age: Mammoths, whooly rhinos, dire wolves, cave lions, megacerops, smilodon, cave bears, etc, etc.
Humans are an enormously powerful factor constraining the existence, abundance and diversity of life. Humans precipitated the disappearance of the megafauna of the late quaternary. Currently, life is subjected to all the "normal" natural stressors and all the human made ones as well. Without humans, it is very likely that after a few tens of thousands of years, life would be green and lush, rife with megafauna, under the future climatic conditions afforded by 500ppm of CO2. There is absolutely no chance of that happening with 8 to 10 billions of humans inhabiting the planet. None whatsoever.
- Climate skeptics have new favorite graph; it shows the opposite of what they claim
RegalNose at 22:46 PM on 27 November, 2025Hi all,
I am absolute green when it comes to topic of Climate research (which is obviously not my field) and trying to make sense of some information presented to general public. I am writing here as I'd like your help with navigating this as it seems to me a bit contradictive with presented "news of the day".
If you navigate to the https://science.nasa.gov/climate-change/, there are two data points that are interesting to me:
1. current CO2 ppm = 430
2. increase of GMST of 1.5 degree C since pre-industry era.
What puzzles me, why is this so important to call for crisis mode?
When I look at the Judd's graph no. 2 I am reading that the planet was operating during The Mesozoic Era, which we know was lush, green and supported living of megafauna, on levels of CO2 between 500-2000ppm and with temperature s significantly higher comparing to current time. I am reading the graph as a path from local minimum and not as a path to glabal maximum, when it comes to GMST. I do understand the problem of how rapid is the incremental temperature increase, but don't see the issue of the increase itself.
In the context of Judd's graph, isn't the graphe used at https://science.nasa.gov/climate-change/evidence/ just pure scaremongring?
If you take 800,000 years, the CO2 ppm looks like massive spike, in the graph. But when you take the context of millions of years as Judd does, this increase is well.. insignificant.
What am I missing? Why the panic and crisis mode?
Thanks!
- Debunking Joe Rogan, Dick Lindzen, and Will Happer
Eclectic at 21:58 PM on 7 November, 2025Nick Palmer :
A lengthy PART TWO of the religious component of Lindzen's climate science denialism.
While we see where the typical Denialist (e.g. to be found in the street or @WUWT website) harbors anger / selfishness / deficiency in empathy . . . . there is IMO an additional fundamentalist religious component in the Motivated Reasonings of some prominent Denialists. You yourself could name a few of those luminaries, I am sure.
IIRC, there was an interview with a very relaxed, laid-back Lindzen sitting in a chair in his garden, while being interviewed by a "sympathetic" interviewer. My perhaps-faulty memory was that the occasion was 2006 ~ but perhaps that date is wrong. My googling this week turned up youtube: "Interview with Professor Richard Lindzen" on the "Rathnakumar S" channel. I am unclear on its date ~ maybe 2014 or 2015. Hard to be sure, since youtubers tend to recycle and re-post stuff from years earlier from other sources. But the exact date is a trivial matter. And please do not bother to view the video, unless you are in a masochistic mood.
# The "Rathnakumar S" channel is new to me, and I have not viewed any of the rest of the playlist. But the playlist does include interviews (originals or re-posts?) of people such as :- W.Soon; W.Happer; H.Svensmark; M.Salby; P.Michaels; S.Baliunas; Bob Carter; et alia. And including that paragon of ethical public education, Marc Morano. Plus there appears to be a flirtation with anti-vax. Of course.
Video with approximate time-stamps :
Lindzen seems to favor a degree of Intelligent Design ~ the World is well-designed. 3:05 "Oh I think the case is pretty strong that it is in fact better designed, and there are strong negative feedbacks that will instead of amplifying, diminish the effect of man's emissions."
Lindzen keeps minimizing the Global Warming: "Only half a degree in a century ... [and] the temperature is always flopping around."
Lindzen opines that CO2 can have a warming effect, but most of it is not due to humans . . . though yes, water vapor and clouds "worsen what we do with CO2." [Note that Lindzen's "Iris Hypothesis" has been a dud.]
22:20 "We still don't know why we had these ice age cycles. We don't know why 50 million years ago we could have alligators in Spitzbergen."
27:00 "Ever since we invented the umbrella, we've known how to deal with climate, up to a point."
37:20 "Nothing in this [climate] field is terribly compelling. The data is weak. ..."CO2 will contribute some warming : not much. ..."It is then claimed that recent changes are due to man : I don't think that's true."
46:13 He returns to Intelligent Design : "A well-engineered device tries to compensate for anything that perturbs it."
So ~ not much particularly explicit denialisty statements . . . but a great deal of implicit statements. Including, throughout the video, a great deal of "Cornwall" wording.
- Debunking Joe Rogan, Dick Lindzen, and Will Happer
One Planet Only Forever at 07:20 AM on 7 November, 2025Nick Palmer @7,
Regarding Lindzen's 'alternative understanding of the impact of cloud changes as warming occurs due to increased CO2 levels'.
I may be mistaken. But nearly 1.5 C warming has happened with CO2 increasing from 280 ppm to 420 ppm (only a 50% increase of CO2). I appreciate that correlation does not prove causation. But that information would appear to fairly solidly establish that Lindzen's past belief, that he appears to powerfully resist changing his mind about in spite of updated information, has 'very little merit'.
- CO2 is just a trace gas
Cedders at 09:53 AM on 5 November, 2025I'm surprised that this argument is so low on the popularity list, 77 out of 200. Possibly it’s more common offline: meeting some contrarians at real-life events (stalls etc), it’s practically what opens the conversation when you are pegged as one of the climate-concerned. ‘I bet you can’t tell me the amount of carbon dioxide in the atmosphere.’
If you express an answer in parts per million, or perhaps as two million million tonnes, then they will want it converted to a percentage (even though most of the atmosphere is transparent to infra-red, and it’s the amount rather than proportion of greenhouse gases that determines the greenhouse effect). 0.043% sounds negligible somehow, perhaps because of common uses of percentages in polling or economics or pay rises. Without empirical knowledge of effects of a substance in a small proportion, people can fall back on what seems like a reasonable guess.
An underlying assumption by people stressing concentrations seems to be that if people knew CO₂ was ‘a trace gas’, they wouldn’t be concerned about climate change, and so the way most people can’t answer in percentage terms means that they are ignorant about the subject matter, or have been manipulated. (The conversation may then proceed to ‘life flourished in the Jurassic because of higher CO₂’ myth, about as accurate as One Million Years BC with Raquel Welch, or combine several misunderstandings into one sentence or question.)
So, supporting the large effects of trace substances argument, and as some people reject the ‘poison’ or ‘alcohol’ analogy as too indirect, I’d like to post this table. If comparisons across the electromagnetic spectrum are somehow valid, then 0.043% turns out to be a lot.

- CO2 is just a trace gas
Cedders at 05:36 AM on 5 November, 2025Bob Loblaw @60: "As for JJones idea that CO2 in trace amounts can't absorb enough radiation, there are commercial CO2 gas analyzers that are designed to measure CO2 by measuring the amount of IR radiation it absorbs, and they can do this on very small quantities of air."
Indeed I've bought an air quality meter for about $10 online, which uses non-dispersive infra-red (filters) to detect carbon dioxide, formaldehyde and other volatile organic compounds. It takes a minute to literally warm up, and is of course nowhere near as accurate as the infra-red equipment scientists use to measure CO₂, but it will at least detect breath, poor ventilation and includes a hygrometer.
Whether actual hands-on experience of such things will help someone accept radiative physics is one question. And whether finding that kind of evidence against the most convenient rationalisation available changes wider world-view about who is responsible for climate change is a different one.
Scaddenp @61 : "I am interested in how people build up their mental models, and how we update these mental models as new information is presented."
(digression) So am I, although I often find it hard to persuade people to share their reasoning, particularly if they are quickly on the defensive. I think humans in general do some 'hill-climbing' in their professed beliefs, aiming at local maxima of practical, satisfactory narrative. New information may change the landscape, but people only move their position slightly, rather than doing the tiring cognitive work of re-evaluating the bigger picture. Hence why goalposts are moved and people rapidly move on to the next myth.
One thing I do find is quite common among contrarians in real life (besides an understandable but exaggerated distrust of authority that is a mirror image of acceptance of consensus) is a simplistic version of Popper's falsificationism. Here's apparent evidence why climate science is wrong, and that is enough to disprove it. (Some do then accrete other supporting arguments.) This mischaracterised epistemology is something to apply to any scientific 'hypothesis' that may have been painted as inconvenient or costing money or jeopardising worldview, but from my experience they use a more common-sense Bayesianism for everyday life.
To JJones @48, one could add that 'a significant amount of heat' is radiated from Sun to Earth and Earth to space. If the latter is mostly in the form of long-wave infra-red, and carbon dioxide absorbs long-wave infra-red, where does the 'heat energy' go? And then maybe explain emission layer displacement in simple terms.
- It's the sun
kootzie at 04:32 AM on 4 November, 2025I am semi-active on Research Gate and elsewhere and doing my bit to [snip]
swat and bitch-slap denialists as they emit their oral-methane emissions to contaminate the discussions and spread anti-science drivel
I notice that the likes of
D*n P*rn
H. D*s L*oot
J*k Br*n
and others regularly engage in denialist mis-information
I notice that none of them appear to be significant enough to
merit (or dis-merit) inclusion in your rogues gallery
Their latest drivel stream purports that not only does increased atmospheric CO2 concentration not contribute ANY increase in global average temperatures, that CO2 does not have any effect on GAT at all.
They claim that WV aka Water Vapour, is a far more potent GHG
(which is arguably a defensible proposition) but that WV is the ONLY
GHG which has ANY effect on temperature, and ipso-facto ergo QED
anthropogenic Global Warming does not exist - its all on the natch.
They regularly mis-interpret mis-comprehend mis-represent physics.
They fundamentally deny that CO2, a non-condensible GHG with a long lifespan drives global temps and insist that WV, a condensible GHG with a short lifespan is not merely a feedback / feedforward mechanism but the fundamental / ONLY driver.
https://www.perplexity.ai/search/analyze-and-critique-vol-20-20-wis.z78fQn.WeNzqnj5Kkg#0
https://www.perplexity.ai/search/analyze-and-critique-the-error-7ZbX2nqyRgGc19k2y45u_Q#0
https://www.perplexity.ai/search/analyze-and-critique-paraphras-Lrr7UYOjQAitC93qUR10EA#1
https://www.researchgate.net/post/How_can_environmental_protection_and_biodiversity_be_improved_by_using_current_ecological_technologies#view=6908dd880ea281189c0a137f/312/313/312
- Is this the most embarrassing error in the DOE Climate Working Group Report?
Bob Loblaw at 04:35 AM on 17 October, 2025History suggests that the authors of the DOE report are largely incapable of being embarrassed. Their determination to spread their message, in spite of numerous criticisms and corrections, is quite remarkable.
Charlie Brown @ 4:
That is an interest take: that they argue 3 W/m2 is small compared to the total radiative flux. It seems that they are using the "it's a trace/small amount compared to [X]" template that has been used in a variety of poor contrarian arguments; vis a vis:
Anthropogenic emissions are small compared to natural cycles
Are there any other arguments that fit this same template?
DenialDepot had a fun post (15 years ago!) on how to cook a graph by playing with the Y-axis. Of course, in its standard mocking of the contrarians, DenialDepot accuses Skeptical Science of cooking the graphs by not expanding the Y-axis to make the change look minuscule. (DD looked at sea ice.) DD shows the "proper" method should be to compare the lost sea ice area to the total area of the earth. In DD's words, "That's far more clear. Immediately I am having trouble seeing the sea ice. This is good. If you can't see it, it's not a problem."
It's like a defendant in court arguing "how can it be grand larceny? I only took $100,000. He has billions."
- Koonin providing clarity on climate?
Evan at 06:31 AM on 28 September, 2025Charlie Brown@3. Yes, I understand the Milankovitch cycles well. Yes, warming starts a very complicated feedback cycle, but CO2 is a magnifier. CO2 is a primary cause of the temperature fluctuations through complex feedback cycles.
But my point is that we live in an ecosystem that is very delicately balanced, and just 100 ppm of CO2 is enough to cause huge swings in sea level and temperature. This time around, regardless of the cause, we are pushing the system way beyond anything experienced during the ice age cycles.
- Koonin providing clarity on climate?
Charlie_Brown at 05:09 AM on 28 September, 2025Ken Rice is lenient with the authors of the DOE Climate Impacts report and with Secretary Chris Wright. Chris Wright states in the Foreword: “I chose them for their rigor, honesty, and willingness to elevate the debate. I believe it faithfully represents the state of climate science today.” I care more about substance than credentials. My public comments included: “The Foreword highlights that the purpose of the Critical Review is to challenge and counter mainstream science. It certainly does not represent the state of climate science today. Rather, it provides a rationalization for weakening current policies for combatting climate change. The authors are neither representative of the scientific community nor diverse.”
The science is not that complex. The report is full of misrepresentation, distraction, and obfuscation. It is not worthy of an undergraduate term paper let alone a critical review of science by PhDs. Many points have been thoroughly discussed and debunked here on the SkS website. My comments included:
1) “Section 2.1 is oversimplistic. CO2 is rarely the limiting nutrient. It discusses photosynthesis as a benefit but ignores adverse effects resulting from CO2 as the primary cause of climate change including drought, extreme temperatures, excess rain, and cropland relocation.”
2) “CO2 below 180 ppm is an irrelevant distraction to the discussion of modern global warming.”
3) “Changing ‘ocean acidification’ to ‘ocean neutralization’ is semantic posturing that does not change the effects. To say that pH reduction is not acidification until the pH drops below 7.0 it is not meaningful.”
4) “Implying that the IPCC uses data manipulation to satisfy preferences is baseless accusatory language. The change in radiative forcing due to the Earth’s orbit around the sun is negligible within the period of modern global warming. The change due to sunspot activity is measured and found to be negligible.”
5) “Comparing 3 W/m2 to 240 W/m2 is misleading and diminishes the significance of 3 W/m2. It is an example of science denialism by distraction, obfuscation, and omission. Straightforward, fundamental physics including conservation of energy and radiant energy calculations combined with atmospheric properties allow the effects of anthropogenic forcing to be isolated by calculation. The calculated spectra of energy loss to space is verified by satellite measurements (Hanel, et al.,1972) (Brindley & Bantges, 2015). 3 W/m2 is sufficient to cause and continue observed global warming. The anthropogenic forcing is not determined by difference of two large, measured numbers and does not rely on just satellite estimates of radiative energy flows. There is very little uncertainty about the effects of increasing gas concentrations.
The effect of clouds is the largest uncertainty in climate models. However, average cloud cover does not change without a driving force. Therefore, the effect of increasing GHG can be isolated by holding clouds constant. Specific humidity will rise with increasing surface temperature, resulting in positive water vapor feedback. This can affect clouds."
Others have submitted many more excellent comments, but I have made my point. The science can be explained and understood by most scientific-minded people who are interested in learning. One does not need a PhD in climate science to understand the flaws in the DOE report.
Disbanding the CWG may not be a sign of progress. It may be a way to avoid the lawsuit by the Environmental Defense Fund and the Union of Concerned Scientists that would restrict the use of the report.
- Koonin providing clarity on climate?
Charlie_Brown at 01:43 AM on 28 September, 2025Evan @ 1 100,000 year cycles are caused by the Milankovitch cycles of the Earth’s orbit around the sun. CO2 fluctuations were the result of ocean temperature changes. It is hypothesized that at the beginning of ice ages increased dissolution of CO2 in cold water, the result of the temprature dependence on Henry's Law, slows cooling by reducing CO2. Evolving CO2 from warm water at the end of an ice age enhances the rate of warming.
This time is different. This is the first time in the history of the planet that CO2 and other GHG concentrations are increasing rapidly due to emissions from human activities.
Everyone dies. That is natural. When someone causes someone else to die, that is immoral.
- Climate change is accelerating, scientists find in ‘grim’ report
michael sweet at 03:25 AM on 23 September, 2025Radman365:
You say "It does at least appear to me that there is an excessive degree of certainty with regards to "the truth" on both sides." There are two truths here to determine.
1) Is sea level rise accelerating? On one side we have a paper published in an obscure journal by authors who have produced erroneous analysis before on this topic and did not review their work with anyone with expertise in the subject. On the other we see hundreds of scientists who have discussed the data extensively with each other and reached a consensus that sea level rise is accelerating. The hundreds of scientists have identified multiple large errors in the obscure authors work.
In this case it is relatively simple to do the analysis and the results are very strongly indicating acceleration. I note that in addition to the tide guage data the hundreds of scientists have independant satalite data that reaches the same conclusion. The obscure scientists simply do not know what they are doing and have screwed up. Why did they ignore the satalite data that showed their analysis was incorrect?
The data is clear, sea level rise has accelerated over the past 50 years. Ignoring half of the data and assuming that sea level rise is independant at different locations in the world is simply an ignorant way to look at the data.
2) The important question is: will sea level continue to accelerate in the future? Data from the future is difficult to obtain. Scientists are debating what we should expect in the future. A few thnk it will not be too bad while others think it will be catastrophic. The fact that sea level rise is accelerating makes many of us very worried. The last time CO2 was over 400 ppm sea level was over 20 meters higher than today. I note that every time an IPCC report is released the projections of sea level rise increase.
You are welcome to think that sea level rise will not be too bad. That might be the case. Since sea level rise is accelerating, most of the readers here thinik we should be concerned about it. 20 meters of sea level rise would submerge most of the major cities in the entire world, although it will take a long time. Since the answwer to sea level rise is installing cheap renewable energy everywhere, why not try supporting renewable energy in your community?
- Koonin providing clarity on climate?
Evan at 19:49 PM on 22 September, 2025CO2 fluctuating 100 ppm over 100,000-year cycles is sufficient to cause sea-level to flluctuate 400 ft. This indicates just how delicate our ecosystem is to CO2 forcings.
CO2 is now increasing at a rate of 100 ppm every 40 years. Can we expect anything but difficulties from such a strong, upward, persistent push?
- Climate change is accelerating, scientists find in ‘grim’ report
Evan at 19:58 PM on 19 September, 2025MA Rodger@11, thank you very much for your detailed answer and for the explanation about AF.
Katharine Hayhoe has an analogy about driving on a dead-straight road in Texas and saying that "relying on past climate patterns is no longer a reliable guide for the future because of the speed of climate change." (this is the Google AI version of her quote). It is reassuring in a sense that AF has been steady for so long, but ...
Despite the data you showed, because we are pushing the climate so hard (CO2 rising on average 2.5 ppm/yr), I remain skeptical that we can really be sure that AF will remain constant into the future. But for the sake of harmony, can we figure out wording that we all agree on.
Do you agree that climate scientists use 2C warming as a guesstimate of the point at which we begin to lock in warming in the pipeline? In other words, even if we achieved Net-0 after crossing the 2C warming threshold, do climate scientist agree that at that point we would have locked in additional future warming?
A lot of this is semantics, because the socio-political inertia does not give me much hope that we will put on the brakes before we cross the 2C barrier, but I would like to arrive at a common understanding so that my posts here don't seem to be at odds with professional climate science.
- Climate change is accelerating, scientists find in ‘grim’ report
MA Rodger at 09:08 AM on 19 September, 2025Evan @8,
(Hopefully my reply here, your third to #7, isn't piling too much at you.)
Quantifying CO2 global emissions is reliant on the data reported and that data does suggest that emissions are still edging up. And these annoying still-rising emissions will result in accelerating increases in atmospheric CO2 levels and leaving net zero further away than ever.
The question of whether "the carbon cycle is not doing what we thought" revolves around Af, the Airborne Fraction which does wobble quite a bit year-to-year. Studies do show that there is no sign of an increasing Airborne Fraction (eg Bennett et al (2024) 'Quantification of the Airborne Fraction of Atmospheric CO2 Reveals Stability in Global Carbon Sinks Over the Past Six Decades', their Fig4 below). Of course, if there were an increasing Airborne Fraction, it would be a game-changer. But the major long-term sink we rely on is the ocean absorbtion which is a case of reasonably straightforward chemistry. Over a millennium the oceans will take up about 75% of our emissions.
A simplistic reassurance can be gleaned from the work of the Global Carbon Project whose annual data shows annual emissions and the annual atmospheric increase (both in GtCarbon) with no perceptible sign of increases in the Airborne Fraction.
- Climate change is accelerating, scientists find in ‘grim’ report
nigelj at 07:57 AM on 19 September, 2025Evan @3 said: "My point is that as we warm the planet, it is likely that the natural emissions will increase, and it is equally likely that the sinks that have removed the natural emissions, will decrease. Hence, the imbalance caused by our 4% emissions will likely be added to by the combination of increased natural emissions and decreased natural sinks. We don't have to perturb the 96% too much to completely swamp our efforts to reduce GHG emissions."
My understanding is your scenario would only happen if we let warming get so high that we crossed certain tipping points, so that even if we froze emissions at that point in time, CO2 and methane release would continue at very substantial levels thus offsetting or swamping our efforts to then drastically cut emissions. We haven't reached that point, and my understanding is we wont provided we keep warming under 2 degrees. Bear in mind theres a fine line between a positive feedback which stops when the primary forcing stops, and crossing a tipping point where emissions become self sustaining. And Im not sure how self sustaining they would really be.
- Climate change is accelerating, scientists find in ‘grim’ report
MA Rodger at 14:45 PM on 18 September, 2025Evan @3,
You set out your "point" that, in your opinion, "the warming would likely continue due to how we have already affected the balance of natural GHG sources and sinks" even after every humanity has effectively disappeared.
The carbon cycle is understood enough (and has been understood for some time) to allow studies to conclude that the carbon sinks will continue to outweigh any natural sources and the resulting reduction in GHG will roughly balance the remaining unfulfilled warming from our emissions. Thus warming effectively stops once our emissions stop.
There has been work looking at the potential for large new sources of natural emissions or the stifling of sinks. These include the likes of methane emissions from melting permafrost or warming Arctic seas, the cascading collapse of econsystems like the Amazon rainforest or the capacity of oceans to absorb CO2 in a warmer world. (Your mention of "feedbacks" @5 - you may have specific examples in mind.) Some of this past work has sounded pretty worrying but such worrying findings have not survived full analysis.
Beyond 'net zero', there are also calls for 'net-negative emissions' that don't get discussed as much as they should. These are seen as globally necessary if our emissions are not cut quickly enough, a situation which seems pretty certain to happen. 'Net-negative' does not address future warming but works to reduce the time over which peak warming continues.
More than 100 comments found. Only the most recent 100 have been displayed.
More than 100 comments found. Only the most recent 100 have been displayed.


THE ESCALATOR

(free to republish)