Climate Science Glossary

Term Lookup

Enter a term in the search box to find its definition.

Settings

Use the controls in the far right panel to increase or decrease the number of terms automatically displayed (or to completely turn that feature off).

Term Lookup

Settings


All IPCC definitions taken from Climate Change 2007: The Physical Science Basis. Working Group I Contribution to the Fourth Assessment Report of the Intergovernmental Panel on Climate Change, Annex I, Glossary, pp. 941-954. Cambridge University Press.

Home Arguments Software Resources Comments The Consensus Project Translations About Support

Bluesky Facebook LinkedIn Mastodon MeWe

Twitter YouTube RSS Posts RSS Comments Email Subscribe


Climate's changed before
It's the sun
It's not bad
There is no consensus
It's cooling
Models are unreliable
Temp record is unreliable
Animals and plants can adapt
It hasn't warmed since 1998
Antarctica is gaining ice
View All Arguments...


Username
Password
New? Register here
Forgot your password?

Latest Posts

Archives

Sun & climate: moving in opposite directions

What the science says...

Select a level... Basic Intermediate Advanced

The sun's energy has decreased since the 1980s but the Earth keeps warming faster than before.

Climate Myth...

It's the sun

"Over the past few hundred years, there has been a steady increase in the numbers of sunspots, at the time when the Earth has been getting warmer. The data suggests solar activity is influencing the global climate causing the world to get warmer." (BBC)

At a glance

Thankfully for us, our Sun is a very average kind of star. That means it behaves stably over billions of years, steadily consuming its hydrogen fuel in the nuclear reaction that produces sunshine.

Solar stability, along with the Greenhouse Effect, combine to give our planet a habitable range of surface temperatures. In contrast, less stable stars can vary a lot in their radiation output. That lack of stability can prevent life, as we know it, from evolving on any planets that might orbit such stars.

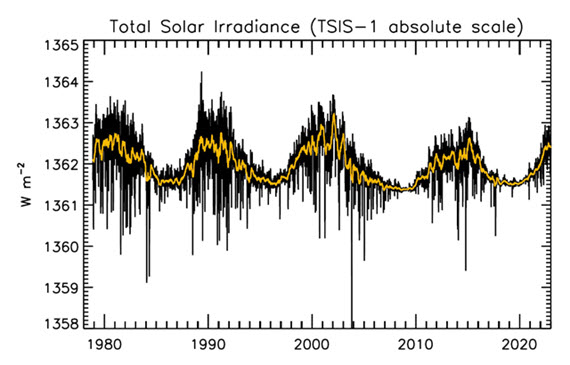
That the Sun is a stable type of star is clearly demonstrated by the amount of Solar energy reaching Earth's average orbital position: it varies very little at all. This quantity, called the Total Solar Irradiance, has been measured for around forty years with high accuracy by sensitive instruments aboard satellites. Its average value is 1,362 watts per square metre. Irradiance fluctuates by about a watt either way, depending on where we are within the 11-year long sunspot cycle. That's a variation of no more than 0.15%.

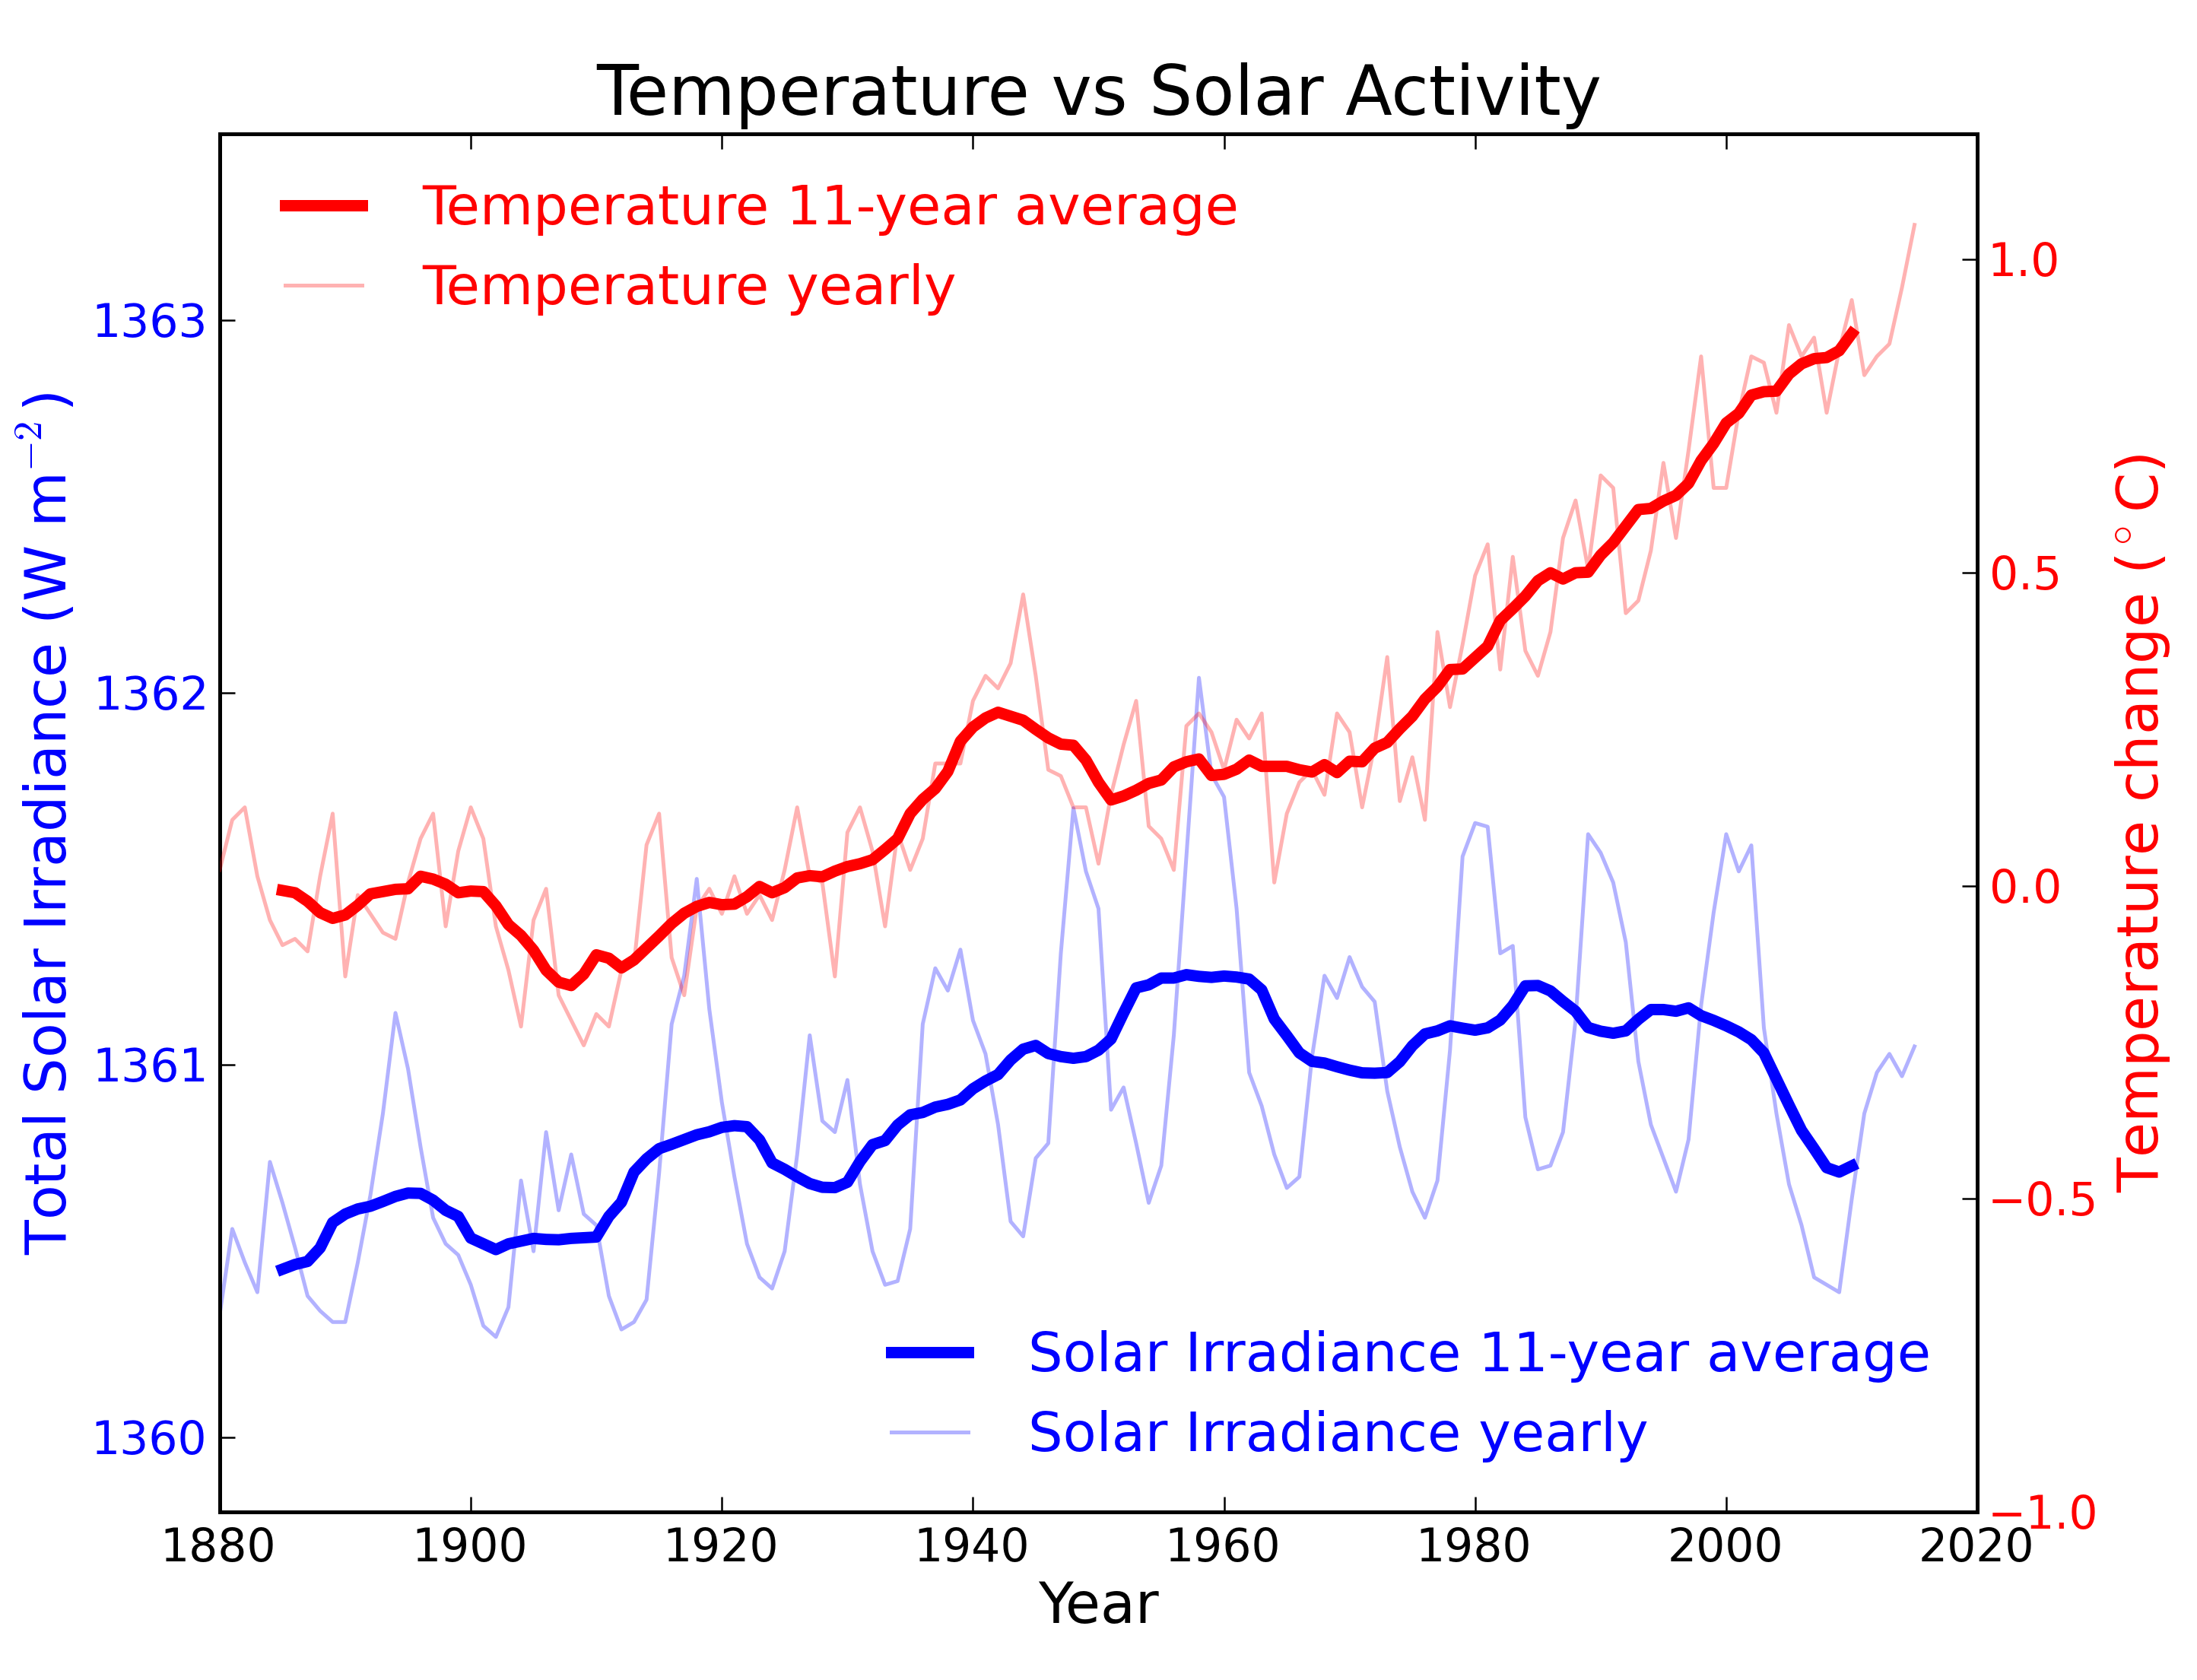
From the early 1970s until today, the Solar radiation reaching the top of Earth's atmosphere has in fact shown a very slight decline. Through that same period, global temperatures have continued to increase. The two data records, incoming Solar energy and global temperature, have diverged. That means they have gone in opposite directions. If incoming Solar energy has decreased while the Earth continues to warm up, the Sun cannot be the control-knob of that warming.

Attempts to blame the sun for the rise in global temperatures have had to involve taking the data but selecting only the time periods that support such an argument. The remaining parts of the information - showing that divergence - have had to be ditched. Proper science study requires that all the available data be considered, not just a part of it. This particular sin is known as “cherry-picking”.

Please use this form to provide feedback about this new "At a glance" section, which was updated on May 27, 2023 to improve its readability. Read a more technical version below or dig deeper via the tabs above!


Further details

Our Sun is an average-sized main sequence star that is steadily using its hydrogen fuel, situated some 150 million kilometres away from Earth. That distance was first determined (with a small error) by a time consuming and complex set of measurements in the late 1700s. It led to the first systemic considerations of Earth's climate by Joseph Fourier in the 1820s. Fourier's number-crunching led him to realise a planet of Earth's size situated that far from the Sun ought to be significantly colder than it was. He was thereby laying the foundation stone for the line of enquiry that led after a few decades to the discovery of what we now call the Greenhouse Effect – and the way that effect changes in intensity as a response to rising or falling levels of the various greenhouse gases.
TSI Solar cycles

Figure 1: Plot of the observational record (1979-2022) on the scale of the TSIS-1 instrument currently flying on the space station. In this plot, the different records are all cross calibrated to the TSIS-1 absolute scale (e.g., the TSIS1-absolute scale is 0.858 W/m^2 higher than the SORCE absolute scale) so the variability of TSI in this plot is considered to be its “true variability” (within cross calibration uncertainties). Image: Judith Lean.

The Sun has a strong magnetic field, but one that is constantly on the move, to the extent that around every 11 years or so, Solar polarity flips: north becomes south, until another 11 years has passed when it flips back again. These Solar Cycles affect what happens at the surface of the Sun, such as the sunspots caused by those magnetic fields. Each cycle starts at Solar Minimum with very few or no sunspots, then rises mid-cycle towards Solar Maximum, where sunspots are numerous, before falling back towards the end. The total radiation emitted by the Sun – total solar irradiance (TSI) is the technical term – essentially defined as the solar flux at the Earth's orbital radius, fluctuates through this 11-year cycle by up to 0.15% between maximum and minimum.

Such short term and small fluctuations in TSI do not have a strong long term influence on Earth's climate: they are not large enough and as it's a cycle, they essentially cancel one another out. Over the longer term, more sustained changes in TSI over centuries are more important. This is why such information is included, along with other natural and human-driven influences, when running climate models, to ask them, “what if?"

An examination of the past 1150 years found temperatures to have closely matched solar activity for much of that time (Usoskin et al. 2005). But also for much of that time, greenhouse gas concentrations hardly varied at all. This led the study to conclude, "...so that at least this most recent warming episode must have another source."
TSI vs. T
Figure 2: Annual global temperature change (thin light red) with 11 year moving average of temperature (thick dark red). Temperature from NASA GISS. Annual Total Solar Irradiance (thin light blue) with 11 year moving average of TSI (thick dark blue). TSI from 1880 to 1978 from Krivova et al. 2007. TSI from 1979 to 2015 from the World Radiation Center (see their PMOD index page for data updates). Plots of the most recent solar irradiance can be found at the Laboratory for Atmospheric and Space Physics LISIRD site.

The slight decline in Solar activity after 1975 was picked up through a number of independent measurements, so is definitely real. Over the last 45 years of global warming, Solar activity and global temperature have therefore been steadily diverging. In fact, an analysis of solar trends concluded that the sun has actually contributed a slight cooling influence into the mix that has driven global temperature through recent decades (Lockwood, 2008), but the massive increase in carbon-based greenhouse gases is the main forcing agent at present.

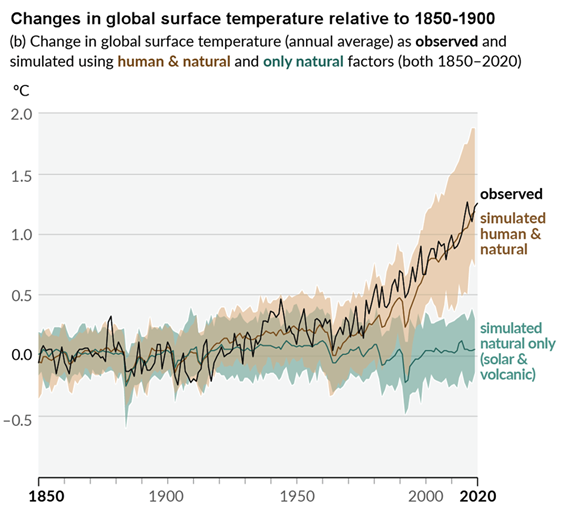
Other studies tend to agree. Foster & Rahmstorf (2011) used multiple linear regression to quantify and remove the effects of the El Niño Southern Oscillation (ENSO) and solar and volcanic activity from the surface and lower troposphere temperature data.  They found that from 1979 to 2010, solar activity had a very slight cooling effect of between -0.014 and -0.023°C per decade, depending on the data set. A more recent graphic, from the IPCC AR6, shows these trends to have continued.

AR6 WGI SPM Figure 1 Panel p

Figure 3: Figure SPM.1 (IPCC AR6 WGI SPM) - History of global temperature change and causes of recent warming panel (b). Changes in global surface temperature over the past 170 years (black line) relative to 1850–1900 and annually averaged, compared to Coupled Model Intercomparison Project Phase 6 (CMIP6) climate model simulations (see Box SPM.1) of the temperature response to both human and natural drivers (brown) and to only natural drivers (solar and volcanic activity, green). For the full image and caption please click here or on the image.

Like Foster & Rahmstorf, Lean & Rind (2008) performed a multiple linear regression on the temperature data, and found that while solar activity can account for about 11% of the global warming from 1889 to 2006, it can only account for 1.6% of the warming from 1955 to 2005, and had a slight cooling effect (-0.004°C per decade) from 1979 to 2005.

Finally, physics does not support the claim that changes in TSI drive current climate change. If that claim had any credence, we would not expect to see the current situation, in which Earth's lower atmosphere is warming strongly whereas the upper atmosphere is cooling. That is exactly the pattern predicted by physics, in our situation where we have overloaded Earth's atmosphere with greenhouse gases. If warming was solely down to the Sun, we would expect the opposite pattern. In fact, the only way to propagate this myth nowadays involves cherry-picking everything prior to 1975 and completely disregarding all the more recent data. That's simply not science.

Longer-term variations in TSI received by Earth

It's also important to mention variations in TSI driven not by Solar energy output but by variations in Earth's orbit, that are of course independent of Solar activity. Such variations, however, take place over very long periods, described by the Milankovitch orbital cycles operating over tens of thousands of years. Those cycles determine the distance between Earth and the Sun at perihelion and aphelion and in addition the tilt the planet's axis of rotation: both affect how much heat-radiation the planet receives at the top of its atmosphere through time. But such fluctuations are nothing like the rapid changes we see in the weather, such as the difference between a sunny day and a cloudy one. The long time-factor ensures that.

Another even more obscure approach used to claim, "it's the sun" was (and probably still is in some quarters) to talk about, "indirect effects". To wit, when studies can't find a sufficiently large direct effect, bring even lesser factors to the fore, such as cosmic rays. Fail.

In conclusion, the recent, post 1975 steep rise in global temperatures are not reflected in TSI changes that have in fact exerted a slight cooling influence. Milankovitch cycles that operate over vastly bigger time-scales simply don't work quickly enough to change climate drastically over a few decades. Instead, the enormous rise in greenhouse gas concentrations over the same period is the primary forcing-agent. The physics predicted what is now being observed.

Last updated on 27 May 2023 by John Mason. View Archives

Printable Version  |  Offline PDF Version  |  Link to this page

Argument Feedback

Please use this form to let us know about suggested updates to this rebuttal.

Related Arguments

Further viewing

Related video from Peter Sinclair's "Climate Denial Crock of the Week" series:

Further viewing

This video created by Andy Redwood in May 2020 is an interesting and creative interpretation of this rebuttal:

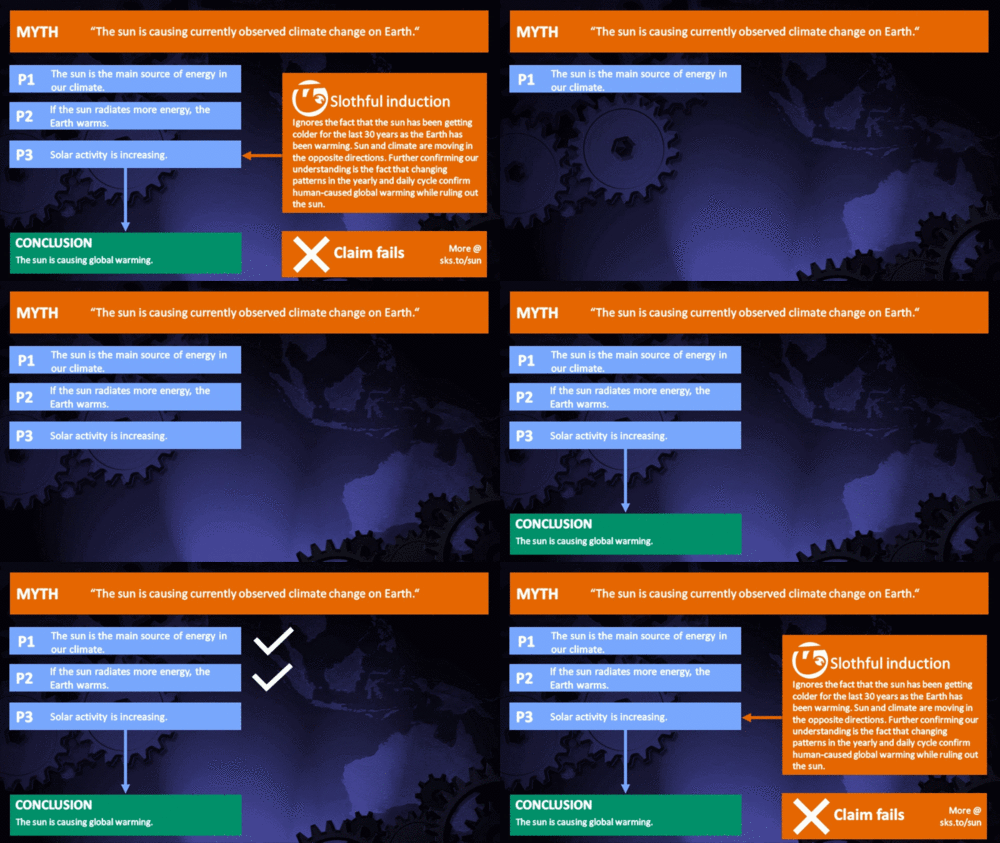
Myth Deconstruction

Related resource: Myth Deconstruction as animated GIF

MD Sun

Please check the related blog post for background information about this graphics resource.

Denial101x videos

Related lecture-videos from Denial101x - Making Sense of Climate Science Denial

and

Additional video from the MOOC

Expert interview with Mike Lockwood

Comments

Prev  5  6  7  8  9  10  11  12  13  14  15  16  17  18  19  20  21  22  23  24  Next

Comments 351 to 375 out of 1232:

  1. "It is except for AGW, this is faith-based as there is not evidence. " "In parts of the Mesozoic it was not as hot but had higher levels of CO2, There is zero correlation." It isn't that black-and-white - less than perfect correlation is not zero correlation. From the physics, CO2 must have an effect; uncertainties are more from feedbacks; uncertainties are not infinite. Where there are variations that do not correlate, maybe there were other things happening at those times, such as (depending on time scale and magnitude of variations): biological evolution (such as evolution of land vegetation (albedo)), changes in geography (albedo, direct mechanical effects on atmospheric and oceanic circulations, direct thermal effects on atmosphere and ocean, interaction of thermal and circulation changes and other feedbacks). ----- HOW does O2 cause cooling? Effects on the ozone layer? Interesting, but I need some numbers... ------ "It is except for AGW, this is faith-based as there is not evidence. " By the standard you must use for evidence, there is likely no evidence for: millions of years of biological evolution by natural processes generating/sustaining the diversity of life and its interactions Pangea a sizable asteroid hit the Earth ~ 65 Ma by the Yucatan Peninsula the moon landings the (H word; yes, I'll play that card in this case, since I am able to lump it together with these others so that the defining characteristic of the group is not the offensiveness of denial) the expansion of the universe heavy elements are manufactured naturally in stars by nuclear reactions and in supernovae and maybe a few other related processes... ? the Earth is round (because if the space program was faked, then all we have to go on is...) ? quarks
  2. As experienced during the Maunder Minimum, the observation that there are few sunspots is associated with cold (see e.g. Fig. 2 at http://scienceandpublicpolicy.org/images/stories/papers/scarewatch/really_cooling.pdf ). This indicates a connection between sunspot count and energy reaching earth’s surface. It is revealing to plot against time the integral of the sunspot data reduced by a factor times the fourth power of the average global absolute temperature. This results in a graph with amplitude proportional to energy change and therefore an expected influence on average global temperature change. Adjust the factor so that the first part of the curve is fairly level. This graph shows a substantial and continued energy gain starting in about 1945. This corroborates the observation of a Solar Grand Maximum that went on for about 70 years and appears to have ended a few years ago. Now, look at the graph of average global temperature such as the NOAA data available at ftp://ftp.ncdc.noaa.gov/pub/data/anomalies/monthly.land_and_ocean.90S.90N.df_1901-2000mean.dat . Notice the approximate 30 year up-trends and down-trends that have been associated with the Pacific Decadal Oscillation (PDO). Note that from about 1945 until about 1975 the PDO down trend must have been a stronger forcing than the gain from sunspots since the temperature trend was down. After 1975 the PDO uptrend combines with the increased solar activity to produce the gain in average global temperature observed late in the 20th century. The sun has gone quiet and the PDO is in its downtrend. The PDO downtrend combined with the quiet sun is going to result in a continuation of the planet cooling trend. The sun has not been this quiet this long since 1913. Clouds are parameterized in the AOGCMs, are recognized as being very significant and are a recognized weakness in the analysis. Sunspot changes appear to be a catalyst for cloud changes and therefore have much greater influence than just Total Solar Irradiation. The Climate Science Community is, for the most part, unaware of the science (it’s not in their curriculum) that proves that added atmospheric carbon dioxide has no significant influence on average global temperature and therefore earth’s climate. See my pdf linked from http://climaterealists.com/index.php?tid=145&linkbox=true for the proof and to identify the missing science. Or email danpangburn@roadrunner.com
  3. Patrick Re: "HOW does O2 cause cooling? Effects on the ozone layer? Interesting, but I need some numbers..." See: The rise of oxygen caused Earth's earliest ice age Thursday, May 7, 2009 "Geologists may have uncovered the answer to an age-old question - an ice-age-old question, that is. It appears that Earth's earliest ice ages may have been due to the rise of oxygen in Earth's atmosphere, which consumed atmospheric greenhouse gases and chilled the earth."
  4. Dan Pangburn - I read your pdf (http://climaterealists.com/index.php?tid=145&linkbox=true) with some interest. I certainly agree with you that Feedback Control Theory is totally lacking in the field of Climatology. I remember reading an article by a leading Climatogist (a Ph.D and AGW sceptic) that had "discovered" that Feedback and Control theory was being taught in the building next to his....the faculty of Electrical Engineering. He briefly described a simple single feedback loop control system. He seemed amazed that this technology even existed. He certainly had no idea that feedback and control system concepts have commonly been used electronic circuit designs since the invention of the vacuum tube. I found this both amusing and sad.
  5. Re 372 - so you mean oxygen can indirectly cause cooling by affecting something else. Well of course, I have been aware that rising oxygen could lead to cooling by reducing the methane levels; however, I suspect this is a less significant effect once oxygen reaches some level of abundance and when methane's role becomes secondary to CO2 in climate-regulating greenhouse gases (except for short-term perturbations) - as far as I am aware, the O2 driven cooling by methane loss is thought to be potentially important in some Proterozoic ice ages, but I haven't heard anything about it being implicated in Phanerozoic ice ages. My impression has been that during the Phanerozoic, oxygen levels have not varied by an order of magnitude or more - instead reaching a peak of ~ 30 % or so some time in the Paleozoic (couldn't get much higher without forest fires consuming it), and it's now about 20 %, ...
  6. Relative to the 'it's the sun' thread.... icecap.us/images/uploads/REVISITINGTHEANALOGUEFORTHECOMINGICEAGE.pdf - presents an interesting view on AGW models and the results obtained from them.
  7. 373 Gord, _I remember reading an article by a leading Climatogist (a Ph.D and AGW sceptic) that had "discovered" that Feedback and Control theory was being taught in the building next to his....the faculty of Electrical Engineering. He briefly described a simple single feedback loop control system. He seemed amazed that this technology even existed. He certainly had no idea that feedback and control system concepts have commonly been used electronic circuit designs since the invention of the vacuum tube._ Really? This is astonishing ignorance, and did you say he's a "sceptic"?
  8. Hmmm...astonishly honest as well....
  9. TrueSceptic - Yes, he is a sceptic. He is also a male, a human being, a consumer, a professor, wears pants, etc....does that hold any particular significance for you? Like I said... "I certainly agree with you that Feedback Control Theory is totally lacking in the field of Climatology." It seems that you somehow totally missed the point,...I was commenting about the curriculum of Climatology as discussed by Dan Pangburn. It should be evident to you that field of Climatology includes some "AGW sceptics"....they all share the same curriculum.
  10. "Feedback Control Theory " How is that different from climate model physics?
  11. The physics is the same, of course. However, most in the Climate Science Community are unaware of the science (which includes the physics) of Control System Theory. Control Theory should more properly be called Control Science, or better yet, Control Engineering since it has multiple practical common applications such as automobile cruise control, aircraft autopilot, missile guidance, electronic circuits, etc. etc. Control Theory is usually taught in mechanical, electrical and aeronautical engineering graduate school and is not in the Climate Science curriculum. Those who understand Control Theory have the knowledge to recognize that earth’s climate can be evaluated as a dynamic system with feedback. In the analysis, all of the minutia of weather and climate, whether known or not, get lumped together (in the control/plant which, by definition, includes all factors that influence average global temperature). The output, as archived in the ubiquitous Antarctic ice core data is extracted as temperature anomalies. Repeatedly during the last and previous glacial periods, a temperature increasing trend changed to a decreasing trend and vice versa. This is not possible if there is significant net positive feedback from temperature. It is not necessary to explicitly describe any of the factors in the control/plant (as used in Control Theory) to determine whether net feedback, if significant, is positive or negative. The average global temperature does not need to be known accurately just reasonable valid relatively. With this knowledge and the knowledge of the logarithmic decline in effectiveness of added atmospheric carbon dioxide it is obvious that there is no significant net positive feedback from increased average global temperature. Atmospheric/Oceanic General Circulation Models, AOGCMs, include the circulation effects of atmosphere and ocean. Climate Scientists use these global climate models to predict future climate. Although there may be no explicit input parameter for feedback in the AOGCMs, when used to predict future climate they incorporate features that result in significant net positive feedback. Without significant net positive feedback AOGCMs do not predict significant global warming. Zero feedback results in 1.2°C from doubling of atmospheric carbon dioxide per p631 of ch8 of UN IPCC AR4 (this 5.84 mb pdf file can be viewed and/or downloaded from http://ipcc-wg1.ucar.edu/wg1/Report/AR4WG1_Print_Ch08.pdf ). This IPCC prediction is probably still high because of faulty cloud parameterization, etc. Unless overwhelmed by other factors, an insignificant temperature increase of less than a degree Celsius, most of which has already taken place, is expected from doubling atmospheric carbon dioxide from the pre-industrial-revolution level of about 275 ppmv. See the pdf linked from http://climaterealists.com/index.php?tid=145&linkbox=true for a more extensive discussion and graphs.
  12. Dan Pangburn - The Vostok Ice core data also show that the relationship between the Earth's temp and CO2 levels is probably linear relationship. I once plotted the the Vostok graphs on a computer using AutoCad and measured the change in temp vs the change in CO2 levels. Although this was just a crude approximation because I did not use actual data (just the graphs and only at a few points), the results showed that the change in CO2 divided by the change in temp was a constant (or very close). Because the change in CO2 divided by the change in temp is a derivative and produced a constant, this indicates that the equation describing the the relationship between temp and CO2 is probably linear. -------------------- The following is a re-post of what I posted on another forum a few years ago: --------------------------------- --------------------------------- The IPCC uses this formula for an approximate calculation of CO2's relationship to changes in W/m^2 forcing EXCLUDING AMPLIFICATION(I will call it delta F). delta F = 5.35 LN( C/Co) where LN is the natural logarithm, Co is the CO2 in ppm for a starting point, C is the CO2 in ppm for analysis and F is the forcing in W/m^2. The IPCC also uses a figure of 0.297 deg C change per each W/m^2. If we multiply both sides of the formula by 0.297 we obtain the relationship: delta T = 1.59 LN ( C/Co) where delta T is the change in temperature (in deg C). ------------------ A way to determine the "approximate" amplification factor that the IPCC uses for CO2. If the CO2 has gone from 1ppm to 290ppm (guesstimate for pre-industrial time) then delta T = 1.59 LN (290/1)= 9.02 deg C. The AGW'ers say the Earth has warmed by about 33 deg C due to the Greenhouse effect, so 33/9.02 = 3.66 must be the Maximum amplification factor possible. ------------------------ The Past and Future of Climate by David Archibald http://www.warwickhughes.com/agri/pastandfuture2.pdf Atmospheric CO2 vs Earth Temperature During the Ice Ages The Ice Ages (Figure 7) shows the biggest variances (interpolating) for Temp is 13 deg C (+3 to -10) and CO2 is 120ppm (180 to 300). This is about 330 thousand years ago. Using the above formula delta T = 1.59 LN (300/180)= 0.812 deg C The ratio for Actual CO2 change to Actual Temp change is 120ppm/13 deg C = 9.23 The "amplification factor" for CO2 would have to be 13/0.812 = 16.0!! Now look at a portion of the graph where the changes are less (eg. 215 thousand years ago) The variances are..Temp variance is about 3.2 deg C (-1.8 to -5) and the CO2 variance is about 30ppm (230 to 260) Using the above formula delta T = 1.59 LN (260/230)= 0.195 deg C The ratio for Actual CO2 change to Actual Temp change is 30ppm/3.2 deg C = 9.38 And, the "amplification factor" for CO2 would have to be 3.2/0.195 = 16.4 ! Clearly, the "amplification factor" varies so much, it is pure fiction....3.66 for the "Greenhouse Effect" vs about 16 for the Ice Ages! But, the MOST IMPORTANT thing this analysis shows is that, the CHANGE IN CO2 divided by CHANGE IN TEMP is really a CONSTANT (9.23 vs 9.38). The CHANGE IN TEMP divided by CHANGE IN CO2 is a DERIVATIVE that produced a CONSTANT. This means that the mathematical equation relating CO2 and TEMP HAS TO BE A LINEAR FUNCTION or close to it. Further, evidence of the LINEAR relationship is very apparent in the cyclical nature of CO2 vs TEMP in the Ice Ages graph. First, TEMP leads CO2 by about 800 years....CO2 follows TEMP LINEARLY! We know that the SUN's activity is cyclical in nature and CO2 absorbtion and release by the Oceans is governed by temperature. Temperature DRIVES CO2 production.....simple CAUSE and EFFECT. --------------------- If CO2 were assumed to "somehow" cause the the temperature changes (as the AGW'ers want us to believe) then: 1. It would HAVE to LEAD temperature not FOLLOW it. 2. The CO2 production (volcanos, bio-mass decay etc) would HAVE to occur in a "cycle" that produced the same sequence of events to produce the CO2 with the same regularity over about 400 THOUSAND YEARS!!! I would suggest that the probability of this happening is about ZERO. -------------------------- -------------------------- End of the re-post. Dan have you looked into this as well?
  13. How does the likely possibility that CO2 has not caused of every single change in climate in the past, preclude it from being a significant cause at the moment? You guys do see the fallacy in insisting that, considering the complexity of the system, right?
  14. ginckgo - good point. Dan Pangburn - Well, I don't see the value in using control theory if climate science has already advanced in every way beyond where control theory would be helpful. If control theory works, it must be more sophisticated than as suggested by your example, because you're results are incorrect. "Repeatedly during the last and previous glacial periods, a temperature increasing trend changed to a decreasing trend and vice versa. This is not possible if there is significant net positive feedback from temperature." This ignores the possibility that the temperature variations were externally forced. Positive feedback causes a cyclic variation in response to a cyclic forcing to be larger in amplitude than otherwise. It also ignores that feedback mechanisms work differently on different time scales: In the shortest time periods, climate change response to a high frequency forcing tends to be damped by thermal inertia (heat capacity), although if modes of internal variability (unforced fluctuations, such as QBO, ENSO...) resonate somehow with forcing ...(?) - but also, in doing analysis, one can not assume that any variation within some interval of the spectrum of frequencies is actually being excited by external forcings with those frequencies, because, though alterable by external forcings, some internal variability will occur without any fluctuating forcing (QBO, ENSO, NAM and SAM, AMO? etc...). When temperature does change in response to external forcing, nearly instantaneous positive feedbacks include water vapor. Clouds will also be a nearly instantaneous feedback, but it is not so clearly and/or generally positive. Over longer periods of time, seasonal snow can be a positive feedback. Sea ice changes can be a positive feedback. Generally over longer timescales (especially during cooling, because snow can only accumulate as rapidly as it precipiates, whereas melting and distingration of ice sheets can occur faster (with uncertainty)), glaciers and ice sheets, and changes in vegetation (forests vs grasses vs deserts, etc.) can be positive feedbacks. Changes in the more rapid portions of the carbon cycle (soil, vegetation, atmosphere, oceans) can also be a (positive) feedback. BUT over even longer periods of time, the very slow CO2 removal from the atmosphere by chemical weathering and geologic storage by generally slow organic C burial tends to balance geologic emissions of CO2. Changes in geologic emissions and changes in topography, land surface composition, and geography can force the atmospheric CO2 level, but resulting changes in climate tend to cause changes in chemical weathering so as to reach a new equilibrium CO2 level; furthermore, chemical weathering tends to act as a negative feedback to climate forcing by other causes (with some complexities - it depends on geography and rock composition, etc...). "With this knowledge and the knowledge of the logarithmic decline in effectiveness of added atmospheric carbon dioxide it is obvious that there is no significant net positive feedback from increased average global temperature." The logarithmic proportionality of radiative forcing to CO2 level has no direct bearing on the climate sensitivity to radiative forcing. "This IPCC prediction is probably still high because of faulty cloud parameterization, etc." Actually, cloud feedback in climate models is small and ranges from negative to positive; the dominant positive feedbacks are water vapor and albedo.
  15. Gord: What you describe, different ratios of temperature-change/CO2-change at paleo time vs. 20th century, corroborates that CO2 does not drive temperature. Another analysis that looks at atmospheric carbon dioxide level change vs. temperature change can be seen in a video at http://www.climate-skeptic.com/ . Correlation does not prove causation but lack of correlation proves lack of causation. The lack of correlation of the sequence of 30 year long up and down trends of temperature during the 20th century with the smoothly rising temperature proves lack of causation, i.e. that CO2 level did not drive temperature. Measurements made during the last decade also corroborate this. Since 2000, atmospheric carbon dioxide has increased 18.4% of the increase from 1800 to 2000. According to the average of the five reporting agencies, the trend of average global temperatures since 1998 shows no significant increase and for the seven years ending with 2008 the trend shows a DECREASE of 1.8 C°/century. This separation of trends corroborates the lack of significant connection between atmospheric carbon dioxide increase and average global temperature. I wonder how wide the separation will need to get before the IPCC and a lot of others are forced to realize that maybe they missed something.
  16. Ginckgo 382: The assessment using Control Theory described at 380 shows that atmospheric carbon dioxide level change, during the previous glacial period, had no significant influence on temperature change. The logarithmic decline of influence with increased concentration shows that CO2 has even less effect at the higher current level. This is all described further at the pdf linked from http://climaterealists.com/index.php?tid=145&linkbox=true
  17. Dan Pangburn (cont.) - "Without significant net positive feedback AOGCMs do not predict significant global warming." Approx. 1 deg C for doubling CO2 may or may not be considered significant; it is certainly a significant relationship of CO2 varies by a large enough amount. "Zero feedback results in 1.2°C from doubling of atmospheric carbon dioxide per p631 of ch8 of UN IPCC AR4 " That sounds about right. What I want to emphasize here is that the logarithmic proportionality of radiative forcing to atmospheric CO2 level has nothing directly to do with whether or not there are positive or negative feedbacks to radiative forcing or whether tipping points might be crossed as radiative forcing is changed. ----------- From the time scale dependence of feedbacks: There could be some exceptions, but the general tendency is for Earth's climate to vary the most in response to externally-imposed forcings with time scales ranging from perhaps many decades to perhaps hundreds of thousands of years, or something similar to that. Simplified hypothetical examples (with a qualititative resemblence to reality, but I don't actually know some of the real numerical values) to illustrate the point: Suppose at time 0, there is a sharp change in radiative forcing of + 4 W/m2 - perhaps from an increase in solar radiation absorbed over the Earth's surface (for an albedo of 0.3 and taking into account that the surface area of a sphere is 4 times its cross sectional area, a 4 W/m2 solar forcing actually requires about a 23 W/m2 increase in solar TSI, quite a bit larger than any variation known to occur outside the long-term solar brightenning over 100s of millions of years that is a characteristic of stellar evolution; recent solar TSI variations (over the period of time relevant to AGW) may be a tenth of that or perhaps less). BEFORE CONTINUING THAT, BACKGROUND INFO: ------------ (PS actually, often what is used for 'radiative forcing' is the tropopause level radiative forcing with an equilibrated stratosphere. I think this is the value that is close to 4 W/m2 (Actually maybe 3.7 W/m2, give or take a little) for a doubling of CO2 (and I think that includes the SW effects of CO2, which are much smaller than the LW effects but are present (CO2 can absorb some SW radiation). Radiative forcing at any level is the sum of a decrease in net outward (upward minus downward) LW (mainly emitted by Earth's surface and atmosphere) radiation at that level and an increase in absorbed SW (essentially all solar) radiation below that level; the climatic response involves changes in temperature that change the LW radiant fluxes to balance the forcing plus any radiative feedbacks that occur (which can be LW and/or SW). Variation in radiative forcing over vertical distance is equal to a radiatively forced heating or cooling. Top-of-atmosphere (TOA) radiative forcing is the sum of a decrease in LW emission to space and an increase in all absorption of SW radiation. An increase in solar TSI of 2 W/m2 results in a (globally averaged) TOA SW forcing of 0.35 W/m2 if the TOA albedo (the fraction of all SW radiation incident at TOA that is reflected to space) is 0.3. But the tropopause level forcing will be less than the TOA forcing because some of that 0.35 W/m2 is absorbed in the stratosphere - and it generally will be a larger fraction than the fraction of all SW radiation absorbed in the stratosphere, because solar UV fluxes are proportionately more variable than total TSI. An increase in the greenhouse effect involves increasing the opacity of the atmosphere over portions of the LW spectrum. Aside from LW scattering ... (which is minor for Earthly conditions, but can also contribute to a greenhouse effect in theory under some conditions (such as with dry ice clouds), but in a different way than atmospheric absorptivity and emissivity (by reflecting LW radiation from the surface or lower layers of air back downward); for Earthly conditions, scattering is much more important at shorter wavelengths) ..., each layer of atmosphere emits and absorbs LW radiation to the extent that it lacks transparency to radiation from behind it (in either direction). The surface also emits and absorbs LW radiation, almost as a perfect blackbody (but not pefectly; it does reflect a little LW radiation from the atmosphere back to the atmosphere). Along a given path at a given wavelength, Absorptivity = emissivity when in local thermodynamic equilibrium (a good approximation for the vast majority of the mass of the atmosphere and surface), where emissivity is the intensity of emitted radiation divided by blackbody radiation intensity (function of wavelength and temperature, and index of refraction, but that last point can be set aside for radiation in the atmosphere) for the temperature of the layer or surface, and the absorptivity is the fraction of radiant intensity absorbed along a path. As a path's optical thinckness increases either by geometric lengthening or by increasing density of absorbant gases or cloud matter, absorptivity and emissitivity both exponentially 'decay' from zero toward 1, or toward a lower number if there is reflection or scattering involved. Positive TOA LW forcing is caused a decrease in LW emission to space from increased opacity, which hides a greater portion of the (globally and time-averaged) larger LW fluxes from the (globally and time-averaged) warmer surface and lower atmosphere from space, replacing it with reduced LW fluxes from generally cooler upper levels of the atmosphere (the warmth of the upper stratosphere is in a very optically thin layer at most LW wavelengths and the thermosphere is too optically thin to have much effect). For relatively well-mixed gases (such as CO2), increasing concentration also cools the stratosphere by increasing the stratosphere's emmission to space and decreasing the upward LW flux that reaches the stratosphere. Thus, the tropopause level radiative forcing from an increase in CO2 is actually greater than the TOA level radiative forcing. (The SW forcing from CO2 absorption of SW radiation tends to heat the stratosphere, but the LW effect dominates. If there were an increase in SW absorption in the troposphere, this would add to tropopause level forcing, but it would (along with stratospheric SW absorption) reduce forcing at the surface.) Increasing LW opacity also tends to increase radiative forcing at the surface by increasing downward emission from the lowest (and generally, on average, warmest) layers of the atmosphere, by making them more opaque (they replace a fracton of the smaller LW fluxes from the upper layers and lack of LW flux from space with a larger increase in their emitted LW flux). Increasing solar TSI has a positive radiative forcing at the surface, which is smaller than that at the tropopause level because some SW radiation is absorbed in the troposphere. Other points: Volcanic stratospheric aerosols have a larger negative SW forcing at the surface and tropopause than at TOA because they absorb some solar radiation as well as scatter it. An increase in albedo at one level (at the surface or within the atmosphere) tends to produce a negative SW forcing, but it will be larger below that level than above to the extent that the increase in upward SW radiation above increases SW absorption (heating) above that level. An increase in absorption of SW radiation (such as by water vapor) only results in a positive TOA forcing in so far as it reduces the amount of SW radiation reflected to space (by intercepting SW radiation both before and after scattering), and will result in a negative forcing at lower levels. ---- The stratosphere has a low heat capacity and tends to reach equilibrium with radiative forcing on short timescales (sub-seasonal, as I recall). Radiative forcing with stratospheric adjustment includes changes in LW radiation within and from the stratosphere resulting from stratospheric temperature changes. This tends to reduce the difference between TOA and troposphere-level forcing from before stratospheric adjustment. It is useful to use tropopause-level forcing with stratospheric adjustment because the remaining climatic response will tend to be more similar among different forcing mechanisms (solar forcing warms the stratosphere and thus stratospheric adjustment increases forcing at the tropopause; the opposite is the case with CO2), although there can still be differences in efficacy (the climate sensitivity to global and annual average forcing, to one forcing agent relative to a reference forcing agent - for example, black aerosols on snow and ice (I am not 100% sure but I think the effect may be amplified because the warming is concentrated in regions where there is a strong positive feedback, resulting in greater global-average warming per unit global average radiative forcing), and also, perhaps how the effects of solar, volcanic, well-mixed greenhouse gas, and stratospheric ozone depletion forcings affect the circulation patterns of the stratosphere and troposphere and interactions between them...(NAM, SAM, circumpolar vortex); also, solar forcing can change the ozone level in the stratosphere - but so can climate change in general (temperature dependant chemical reactions, polar stratospheric clouds, circulation patterns that bring ozone from the tropics to the high latitudes and then downward). Why is tropopause level radiative forcing so important? In the global average, solar heating, although somewhat distributed among the surface and atmosphere, is displaced downward relative to the distribution of radiative cooling to space. In pure radiative equilibrium, this would be balanced by radiative fluxes among the surface and different levels of the atmosphere. However, the temperature gradient required for such radiative equilibrium is unstable to convection in the lower atmosphere. Thus, the climate tends to approach a radiative-convective equilibrium, in which, to a first approximation, a net convective flux (including surface evaporative cooling and latent heating upon condensation/freezing of water) cools the surface and heats the troposphere, balancing a net radiative heating of the surface and net radiative cooling distributed within the troposphere. Localized vertical convection, where it occurs, causes the troposphere's vertical temperature distribution to approach neutral stability - a temperature decline with height near the adiabatic lapse rate (the rate at which temperature decreases due to expansion of some mass of gas with decreasing pressure, in the absense of a heat flux into or out of that mass). Because of condensation, the lapse rate that applies (except near the surface, below cloud level) is the moist adiabatic lapse rate - it is less than the dry adiabatic lapse rate because of latent heating upon ascent. It diverges most when latent heating per unit vertical lifting is greatest - which is at higher temperatures (found lower in the atmosphere). Thus the moist adabiatic lapse rate varies over the globe and with weather conditions and seasons, though a good representative value is 6 or 6.5 K per km. Because radiative fluxes by themselves would drive the lower atmosphere toward being convectively unstable, the surface and various levels within the troposphere tend to warm up or cool off together in response to forcings - they are convectively coupled. Any increase in radiative forcing at the tropopause level corresponds to some change in radiative heating below the tropopause level. If this radiative heating is concentrated at some level, it will, without changes in convective heat fluxes, warm up that level, decreasing vertical stability above and increasing it below, thus slowing convective heat transport up to that level from below and increasing it from that level to above. Convection thus spreads the heating effect vertically throughout the depth that convection can occur. So the surface and all levels within the troposphere warm up by similar amounts. The warming may be a bit less at the surface because the moist adiabatic lapse rate decreases with increasing temperature (assuming the cloud base level (lifting condensation level) does not rise on average, etc., because the dry adiabatic lapse rate applies to convection below that level and it is larger and is less sensitive to temperature). Complexities of response: 1. This is complicated by spatial and temporal variations. 1a. The radiative forcing (and it's vertical variations) for any given change is not generally evenly distributed over space and time; just as each additional unit of any one substance (Gas or otherwise) will, beyond some point, have decreasing marginal effect, different agents can overlap with each other; additional CO2 will have less effect in cloudy and humid air masses (although the tropopause level forcing will depend much more on high level clouds and upper tropospheric humidity than low level clouds and humidity, since the CO2 in the cold air above a warm cloud or warm humid air mass will still block some LW radiation emitted from those warming layers; ... it is also worth pointing out for other reasons that reduction in CO2 radiative forcing by H2O vapor will be greater for surface forcing than for tropopause level forcing at least in part because H2O vapor relative concentration decreases generally exponentially with height, whereas CO2 is well mixed). ... There is, however, a (climate-dependent) average distribution of optical properties and their alignment with temperature variations, and thus radiative forcing, and the resulting temperature change takes time (short term weather phenomena can actually be described to a large extent without taking into account much radiation, except for the diurnal solar heating cycle). Clouds and humidity cannot realistically be rearranged relative to the horizontal and vertical distribution of temperature with infinite freedom; some things are linked by simple physics and some things correspond predictably because of the basic structure of the atmosphere and it's long-term climate (diurnal and annual cycles, land-sea and other geographical heating contrasts, the coriolis effect, Hadley cells, Walker circulation, monsoons, subtropical dry belts, midlatitude storm tracks, wind-driven and thermohaline ocean circulation, mesoscale convection phenomena, characteristics of variability in QBO, ENSO, NAM and SAM, PDO, AMO, etc, inertial oscillations, inertio-gravity waves, Rossby waves, ...). The global average radiative forcing by mathematical definition corresponds to a global average radiative heating rate below the level considered; if the level forms a closed surface, that heating, however horizontally distributed, cannot simply leak out without some change in climate itself - increased temperature to increase the net LW flux out to balance the radiative forcing + any radiative feedbacks. -------------- (When in climatic equilibrium, the Earth loses heat to space by LW emission at the same rate as it absorbs SW radiation (plus a TINY fudge factor for geothermal and tidal heating). This is a necessary but not sufficient condition for a climatic equilibrium, because climate change can in principle involve spatial and seasonal rearrangements of radiative heating and cooling and the convection/advection that balances them when averaged over fluctuations that could result in zero global-time average change in radiant fluxes. However, there are tendencies for the climate to behave in some ways and not others for any given set of solar, greenhouse, aerosol, geographic, biologic, and orbital (Milankovitch) forcings, etc.); a longer term equilibrium climate can be defined that includes patterns/textures of cyclical and/or chaotic shorter term variability, both from internal variability and from forcing cycles and fluctuations on the shorter time scales (annual and daily cycles, volcanic eruptions (when the statistics of such short term episodic events do not vary over longer time periods, then the resulting short term climate fluctuations can be incorporated into a description of longer-term equilibrium climate). -------------- 1b. There are daily, seasonal, latitudinal and regional, and weather-related and interannual variations in the distribution of convection and vertical stability in particular. Because much or most latent heating is associated with precipitation that reaches the surface, regions of descent are often dry; descent is also often slow over large areas and so adiabatic warming may be balanced by radiative cooling. Horizontal heat transport in the air from regions where much heat is convected from the surface can produce regions where the air is stable to localized overturning; this is especially true of polar regions in winter, where the surface and lowermost air is often or generally colder than some of the higher tropospheric air. Over land, there is a significant diurnal temperature cycle at and near the surface that is not matched by a similar cycle above - this is because a majority of solar heating is concentrated near the surface over a smaller heat capacity (in sufficiently deep water, there is a large heat capacity that damps short-term temperature cycling; finite thermal conductivity into soil and rock limits the depth available to supply heat capacity for radiative cycling as a function of frequency); thus, the daily high temperature near the surface is more coupled convectively to the temperatures in the rest of the troposphere than the nightime/morning low temperature. Horizontal temperature gradients can and do supply potential energy for large-scale overturning even when the air is locally stable to vertical convection, but this occurs more readily when the air is less stable; when air is more stable, a smaller amount of overturning is sufficient to eliminate horizontal temperature gradients by adiabatic cooling of rising air and warming of sinking air. There is a sort of large-scale convective/advective coupling of temperature change patterns, as either reduced horizontal temperature gradients or increased vertical stability will tend to reduce the large scale overturning (the Hadley cells, monsoons, Walker circulations, and the synoptic-scale circulations of strengthening baroclinic waves (the midlatitude storm track pressure systems and the jet stream undulations that correlate with them) - when any overturning on any scale increases, it reduces the tendency for more overturning by mixing heat horizontally and/or stabilizing the air to local vertical convection; a decrease in overturning has the opposite effect, so there is a tendency to approach an equilibrium overturning rate or at least fluctuate about such a rate; however, the spatial arrangment and category of overturning are a bit less constrained, allowing for internal (unforced) variability. And some circulation patterns (cumulus clouds and hurricanes in the short term, ENSO and some forms of storm track variability) can reinforce and strengthem themselves with feedbacks involving self-reinforcing distributions of latent heating and self-reinforcing momentum fluxes (but beyond some point, the midlatitude storm tracks are anchored to the way solar radiation varies with latitude, hurrican activity is regulated by sea surface temperatures and large scale circulation tendencies and temperature gradients, etc, and ENSO is in a way limited in magnitude by the width of the Pacific ocean - the warm water normally in the western tropical Pacific can only slosh back as far as the Americas)... The simple 1-dimensional globally representative model (describing everything in terms of a balance between vertical fluxes) also implies that the stratosphere is exactly in radiative equilibrium, but this is only approximately true for the global average. Some kinetic energy produced by overturning in the troposphere actually propogates (via Rossby waves and gravity waves) into the stratosphere and mesosphere and drives circulations there - that kinetic energy is converted to heat in the process, though it is a small amount - the larger effect, as I understand it - is large regional deviations from radiative equilibrium - sinking regions are adiabatically warmed, causing them to be warmer than the radiative equilibrium temperature, so they radiatively cool; rising regions do the opposite. (PS the QBO is a nearly-cyclical fluctuation of winds in the equatorial stratosphere that is driven by noncyclical fluxes of momentum from the troposphere, carried by a family of equatorial waves (including in particular Rossy-gravity and Kelvin waves); the cycle is self-organizing - the vertical distribution of winds in the stratosphere regulates where the momentum in different directions carried by different kinds of waves is actually deposited, so that regions of westerly and easterly flow alternately appear at higher levels and slowly propagate downward.) 2. While the temperature response of the surface and troposphere together tends to follow the (global-average) tropopause level forcing, the distribution of radiative forcing will affect the convection rates and thus the circulation patterns. However, except when a forcing is too idiosyncratic, the general tendency of the climate response to a positive tropopause level radiative forcing is: At the surface, greatest warming is in higher latitudes in winter where the albedo-feedback is strongest (the summer reduction of sea ice causes winter warming because the solar radiation is absorbed by water without much temperature increase, but this stored heat must then be released in the colder months before ice can reform). In the tropics, increased evaporative cooling is a negative feedback (at least over moist surfaces), but this is balanced by increased latent heating at higher levels - at low latitudes, the greatest warming will tend to be in the mid-to-upper troposphere because of the decrease in the moist adiabatic lapse rate. The stability of the air at high latitudes could help explain why high latitude warming is concentrated near the surface. Because of the opposite tendencies in the large-scale horizontal temperature gradients between lower and higher levels of the troposphere, the effect on baroclinic wave activity (midlatitude storm tracks) is not immediately clear, but more water vapor will be available for latent heating (the horizontal temperature gradient is a necessary condition for baroclinic waves but it is not their only fuel source), and perhaps the reduced vertical stability at higher levels might contribute to a poleward shift in activity (possibly with a positive cloud feedback on the storm tracks' subtropical flanks) - but there are other factors, including changes in the stratosphere and stratosphere-troposphere mechanical interactions (also affected by ozone depletion). The tropopause height will also increase (but is that more for greenhouse forcing than solar forcing?). Because of the dominance of the ocean in the Southern midlatitudes, the wind-driven upwelling of cold water (which, coming from below, will not warm much until the temperature signal of climate change has spread sufficiently through the deeper ocean), and the relative stability of much of the Antarctic Ice sheet (at least for a while) (as opposed to Arctic sea ice in particular), the near-surface high latitude polar warming will not be especially large relative to low latitudes in the the Southern Hemisphere, at least during the first few centuries (??). (Northern hemisphere land masses also have a seasonal snow albedo feedback.) The similarity of radiative feedbacks might overwhelm some differences in radiative forcings. The water vapor feedback in particular will have a much stronger radiative forcing at the surface than at the tropopause level (but the tropopause level water vapor feedback is sizable compared to the externally imposed forcing). Because of this, changes in vertical convection rates due to different forcing mechanisms might be more similar. (However, setting aside the radiative implications of the diurnal temperature cycle over land, the global average net convective cooling of the surface cannot get any larger than the direct solar heating of the surface; and precipiation (aside from dew and frost) can only balance evaporative surface cooling, which cannot exceed total convective cooling. Increasing the greenhouse effect will tend to increase precipiation but it cannot do so beyond such limits; aerosol cooling tends to decrease precipitation in a greater proportion to its effect on temperature, so balancing greenhouse warming with aerosol cooling would reduce precipiation in the global average. Where there is a regionally-concentrated forcing, such as by the Asian Brown Cloud, in which there is some tropospheric radiatively-forced warming but a negative radiative forcing at the surface, the temperature response at different levels on the same regional scale will not be coupled so much by convection; convection may be reduced in that region with perhaps some increase elsewhere depending on how much radiative forcing of each sign occurs, etc... The greenhouse effect tends to decrease the diurnal temperature cycle near the surface by decrease the relative importance of solar heating in the radiative energy budget - by increasing downward LW radiation by increasing LW opacity, and maybe by increasing LW radiation in both directions by increasing temperature (but only to the point that the net LW flux from the surface doesn't increase (??)). This is related to the larger diurnal temperature cycle found in higher elevations and clear nights with dry air. Wind can reduce the diurnal temperature variation by producing turbulence to mix heat downward at night when the surface is radiatively cooling. (Some feedbacks to global warming could regionally alter the surface temperature relative to temperature at other levels by affecting the rate of evapotraspiration.) (When there is sufficient solar heating on land, surface temperature is actually warmer than the air temperature just above it. The surface impedes effective convection, leaving thermal conduction and diffusion to transport heat and humidity from the surface to the air and within that very thin layer of air next to the surface. This doesn't destroy the convective coupling of surface temperature to air temperature, but it adds another chain in the link.) ------------ (to be continued...)
  18. Patrick 027: Wow! You have been busy . . . This responds to 383. I will read your latest tomorrow. The egregious mistake that the Climate Science Community is making is obvious to those who understand Control Theory that have looked at the paleo temperature data. From your comments it is also obvious that you are unfamiliar with Control Theory. With knowledge of Control Theory you would recognize that your statements in 383 are mostly nonsense. With Control Theory it is trivial to determine that there is no net positive feedback from average global temperature. With no net positive feedback added atmospheric carbon dioxide has no significant effect on average global temperature. “This ignores the possibility that the temperature variations were externally forced. Positive feedback causes a cyclic variation in response to a cyclic forcing to be larger in amplitude than otherwise.” Quite the contrary, it proves that temperature changes from up-trend to down-trend (or vice versa), were externally forced. Selection of a suitably long trend avoids cyclic issues. “It also ignores that feedback mechanisms work differently on different time scales” This and later comments demonstrate a lack of understanding of what feedback means in a dynamic system like earth’s climate. “The logarithmic proportionality of radiative forcing to CO2 level has no direct bearing on the climate sensitivity to radiative forcing.” This is kind of vague but appears to expose a fundamental lack of understanding of how gases absorb photons. Perhaps it would help to study work by Dr. Jack Barrett at http://www.warwickhughes.com/papers/barrett_ee05.pdf “Actually, cloud feedback in climate models is small and ranges from negative to positive; the dominant positive feedbacks are water vapor and albedo.” A recent paper by Dr. Spencer addresses cloud feedback and points out the previous over-estimation of climate sensitivity by the IPCC. It can be seen at http://www.drroyspencer.com/research-articles/satellite-and-climate-model-evidence/
  19. If Control Theory makes any sense at all, I don't get that from your posts (no offense), so I'm going to look it up elsewhere. (If there were no positive feedback, the temperature would not go up and down as much as it does.) "This is kind of vague but appears to expose a fundamental lack of understanding of how gases absorb photons. Perhaps it would help to study work by Dr. Jack Barrett" I skimmed it. From that: " The GCMs take feedbacks into account, such as the supposed positive feedback from extra warming caused by the absorption of radiation by extra water vapour. Such feedbacks have to be parameterised and although they may contribute a greater reality to the models, they also introduce extra uncertainties." No, the feedbacks are not parameterized; they are part of the climate model output. Parameterization is required for sub-grid scale processes... http://www.realclimate.org/index.php/archives/2007/01/the-physics-of-climate-modelling/langswitch_lang/sw --- But anyway, I have a really good understanding of radiative energy transfer in the atmosphere as it relates to bulk properties (emissivity and absorptivity, scattering cross section, etc, as a function of wavelength) - I have less detailed knowledge of the microscopic and quantum-mechanical mechanisms that give rise to this behavior, though I do understand the generalities (collision/pressure broadenning and doppler broadenning of line spectra, for example). My point was that, within some range of conditions, the tropopause level the radiative forcing by CO2 (integrated over all wavelengths and directions) can be approximated with a logarithmic relationship. This alone says little if anything of the relationship of the temperature response to radiative forcing. (PS - important (note this, Gord) - at sufficiently low CO2 levels, the relationship becomes more linear. Removal of all CO2 would not be an infinite negative radiative forcing - as I recall, I think it would be somewhere between -20 and -30 W/m2. With nearly 4 W/m2 forcing per doubling, this suggests that the logarithmic proportion must become inaccurate before 5 or 6 halvings.)
  20. Patrick 027 I have been searching for a metaphor to possibly provide insight into the relation between Climate Science and Control Theory. This is a poor one but will have to do until a better one comes along. Climate Science is like the complete definition of how to engineer a car. It defines everything in detail. For the car it would include the required size of gears, diameter of drive shafts, steering gear ratio, seat height, tire size, wire size, etc. etc. Control theory is like the patrolman who observes that the car is being driven too fast. The patrolman doesn’t need to know anything about how to design a car. He doesn’t need to know if some of the calculations may have contained errors. He doesn’t even need to know if there are factors making the car go that no one understands or even knows exist. In 386 you presented a huge list of details of what contributes to weather and by extension climate. I am not qualified to challenge that list, or determine if it is correct, adequately complete or even address it. In Control Theory, ALL of that gets lumped together into a box called ‘control/plant’ which is defined as ‘all factors that influence average global temperature’. The factors do not need to be defined in detail. They do not need to be correct. They do not even need to be known. By definition the ‘box’ in the Control Theory model contains ‘all factors that influence average global temperature’. The output in this Control Theory model is (by definition) average global temperature. Feedback is (by definition) the effect that average global temperature has on ‘all factors that influence average global temperature’. It is a trivially simple model but the science behind it is extremely powerful and proven in nearly endless successful applications. The planet itself is a perfect computer for weather and climate that, by definition, correctly accounts for all factors. The output from that computer is archived in ice cores and sediments. Using proxies, scientists have teased temperature anomalies (changes from a reference value) that are validated by being done by different people using different methods. For this assessment using Control Theory the data does not even need to be accurate in an absolute sense only reasonably representative in relative amplitude. Many sources report this data and a few are plotted from identified credible sources in my pdf file linked from http://climaterealists.com/index.php?tid=145&linkbox=true . The thing to be observed about this data is not the short term oscillations that average out but the long term trends of hundreds or even thousands of years. Now comes the crucial observation that may take an understanding of Control Theory. Repeatedly during the last and previous glacial periods, a temperature increasing trend changed to a decreasing trend and vice versa. With knowledge of Control Theory it is recognized that this is not possible if there is net positive feedback from temperature unless it is triggered by an external stimulus that is more powerful than the feedback. The observed temperature trend changes show that any positive feedback effect must have been smaller than the external stimulus. That is, the external stimulus called the shots and net positive feedback, if any, was less significant. The higher level of atmospheric carbon dioxide now results in changes to atmospheric carbon dioxide level being even less significant. If an AOGCM predicts otherwise it is either faulty or misused or both. It is unfortunate that most if not all Climate Scientists are unaware of Control Theory (it’s not in their curriculum). If they were knowledgeable in Control Theory they might not have made the egregious mistake of blaming Global Warming on added atmospheric carbon dioxide and misleading a whole lot of people. As far as one degree being significant, realize that it is one degree from the pre-industrial period and most of that has already occurred. I personally think that the influence of atmospheric carbon dioxide is much less than one degree and the temperature run-up at the end of the 20th century was a result of the Solar Grand Maximum combining with a PDO uptrend, both of which are now going the other way. If the politicians will just stay out of it, the free market will bring about acceptable solutions to the issues of finite supplies of fossil fuels.
  21. Dan, you're muddling up some very simple phenomena in relation to the ice age cycles. In fact you've more or less answered your own dichotomy when you state: "Repeatedly during the last and previous glacial periods, a temperature increasing trend changed to a decreasing trend and vice versa. With knowledge of Control Theory it is recognized that this is not possible if there is net positive feedback from temperature unless it is triggered by an external stimulus that is more powerful than the feedback. The observed temperature trend changes show that any positive feedback effect must have been smaller than the external stimulus. That is, the external stimulus called the shots and net positive feedback, if any, was less significant."Kawamura et al (2007) "Northern hemisphere forcing of climate cycles in Antarctica over the past 360,000 years" Nature 448, 912-919.
  22. Dan, you're muddling up some very simple phenomena in relation to the ice age cycles. In fact you've more or less answered your own dichotomy when you state: "Repeatedly during the last and previous glacial periods, a temperature increasing trend changed to a decreasing trend and vice versa. With knowledge of Control Theory it is recognized that this is not possible if there is net positive feedback from temperature unless it is triggered by an external stimulus that is more powerful than the feedback. The observed temperature trend changes show that any positive feedback effect must have been smaller than the external stimulus. That is, the external stimulus called the shots and net positive feedback, if any, was less significant." So what's the problem? We know very well that the primary driver of ice age cycles is the very slow cyclic variations in insolation patterns resulting from the slow cyclic variations in the orbital properties of the earth (Milankovitch cycles). The Milankovitch cycles result in changes in forcings that drive the transitions. The various positive feedbacks (slow ice sheet albedo and CO2 feedback and their accompanying fast water vapour feedbacks), amplify the effects of the insolation cycles (and "help" to transmit these globally - the evidence indicates that warming precedes CO2 rises in the Antarctic but follows CO2 rise in the Arctic). But that doesn't say anything about the magnitude of the feedbacks to rising CO2 levels which requires a rather more considered analysis. The climate sensitivity to CO2 (warming resulting from a doubling of atmospheric CO2 levels) is the temperature rise under conditions of constant insolation, and a great deal of empirical and theoretical analysis indicates that this is near 3 oC of warming per doubling of atmospheric CO2. Many of the changes in the ice age record that you are talking about involve rather small changes in atmospheric CO2 concentrations (20-40 ppm) which are expected to give rise to smallish temperature changes (including feedbacks) of 0.4 - 0.8 oC within a climate sensitivity of 3 oC. All your obervations indicate is that the ice age cycles (and most of the sub-transitions within the glacial periods) are dominated by the Milankovitch cycles, and the forcings resulting from insolation changes are larger than the small forcings resulting from raised CO2 levels (and vice versa for cooling). We knew that already! We also know that the observations from the ice cores are entirely consistent with a climate sensitivity somewhere around 3 oC. The ice core data tell us rather clearly that it's not just the main glacial-interglacial transitions that are dominated by Milankovitch cycles, but also the sub-transitions occurring largely within the glacial period which is what I suspect you're talking about (it would help if you were a little more specific!). The earth's orbital parameters are characterized by three major cycles having periods near 100,000 years, 41,000 years and 23,000 years. Since these cycles are out of phase a rather complex insolation pattern accrues from the "summation" of the cycles which matches the ice core data quite well. If you can find the following paper, have a look at Figure 2; it illustrates the extraction of the earth's orbital cycles by Fourier transformation of ice core data on proxy temperature and 18O variations. The power spectrum shows clear strong peaks at 111,000, 41,000 and 23,000 years, which matches the orbital cycle frequencies rather well: Kawamura et al (2007) "Northern hemisphere forcing of climate cycles in Antarctica over the past 360,000 years" Nature 448, 912-919. Apols for repeating this. I messed up the formatting in the previous version!
  23. Re 371/373 Dan and Gord, the notion that climate scientists are deficient in their understanding as a result of limitiations in their “curriculum”, and more specifically that they are lacking crucial understanding of “Feedback Control Theory” (or “Control Engineering”, is extremely dubious! Perhaps you might suggest more specifically the insight that they are lacking and its consequences. One general and one specific point: 1. Scientists are not constrained by their “curriculum”. Most of what they learn comes from the real world practice of science, and the acquired knowledge and skills required to pursue their research endeavours, either first hand, or second hand (by collaboration). The notion that climate scientists lack a crucial expertise as result of their particular education is a silly one! Speaking personally my degrees were in Chemistry, but I now research in the area of Medical Biology and Biophysics. Pretty much everything I’ve learned and currently apply comes from studies and skills picked up (first hand) since my research education/training. It’s useful to use complex computational molecular dynamics simulations in my research, but since I consider it impractical to learn this field from the bottom up, I collaborate with expert practitioners in that subject. Likewise if I need to apply particularly complex statistical analyses, I tend to seek the help of appropriate experts….and so on. That second hand recruitment of appropriate skills within collaborative efforts underlies much of modern research. So scientists are certainly not stuck with what they learned from their educational “curriculum”! 2. More specifically, I wonder whether “feedback control theory” is a particularly useful field in relation to studying the climate. Perhaps you could say where you think its relevant applications lie in a more specific sense. If it is anything like the brief descriptions given here: http://en.wikipedia.org/wiki/Control_theory or here: http://en.wikipedia.org/wiki/Control_engineering …then one might question its appropriateness for climate science, and might even suggest that its use of the concept of “feedback” might differ from the concept of "feedback" as applied in atmospheric physics and other elements of climate-related science. For example, it’s very clear that the earth system is not subject to elements of control such as those described in control theory (if the Wikipedia pages give a suitable description). The Earth system is not “designed” to lie within certain ranges of parameters like temperature. In general these properties respond to contingent phenomena/events. When, in the Archeaen ages over 2 billion years ago, oxygen from early photosynthesising organisms oxidised all of the dissolved iron in the oceans and started to be leached into the atmosphere, it oxidised the dominant greenhouse gas of the time (methane) and earth’s temperature plummeted to the extent that there is evidence for a global freeze (“snowball Earth”). There were no “control elements” maintaining temperatures, and the feedbacks (largely an albedo one) was strongly positive. The tectonic events accompanying the opening up of the N. Atlantic at the nascent plate boundary was the likely cause of the massive release of greenhouse gases (methane and CO2) that caused the rapid global warming, ocean anoxia, and the associated extinctions at the Paleo-Eocene Thermal Maximum. Again there were no “control elements” (associated with feedbacks) that acted to maintain the preceding ambient temperature. The evidence indicates that changes in forcings (greenhouse gases, solar changes, volcanic activity) push the Earth’s temperature towards some new equilibrium level. In the case of the ice age cycles (considering glacial to interglacial transitions) enhanced insolation results in warming with a water vapour feedback that produces a re-partitioning of CO2 from the oceans to the atmosphere with an enhanced (warming) forcing accompanied by an enhanced water vapour feedback. The insolation changes are further enhanced by a positive albedo effect from ice sheet dynamics… There are some elements that might constitute a tendency towards homeostasis but these don’t require an understanding of control theory I suspect. If the earth becomes hotter the efficiency of weathering increases and this tends to increase the draw down of CO2 and provides a (very, very slow) negative (cooling) feedback. The presence of large concentrations of atmospheric oxygen tends to limit forcings from methane, although the release of large amounts of methane would be extremely problematic if the PETM is anything to go by…
  24. More about models, parameterizations: http://www.realclimate.org/index.php/archives/2008/11/faq-on-climate-models/langswitch_lang/in http://www.realclimate.org/index.php/archives/2009/01/faq-on-climate-models-part-ii/langswitch_lang/sw --------------------- Other points I've made about radiation, the carbon cycle, ice ages, etc...: http://www.skepticalscience.com/Arctic-sea-ice-melt-natural-or-man-made.html#3186 http://www.skepticalscience.com/argument.php?p=12&t=392&&a=18#2944 http://www.skepticalscience.com/Is-Antarctic-ice-melting-or-growing.html#2768 http://www.skepticalscience.com/argument.php?p=12&t=392&&a=18#2926 (specifically the comments listed by number that are found here: http://www.realclimate.org/index.php/archives/2009/03/olympian-efforts-to-control-pollution/langswitch_lang/in ) http://www.skepticalscience.com/climate-sensitivity.htm#1724 ( in particular, http://blogs.abcnews.com/scienceandsociety/2008/07/tropical-storm.html http://blogs.abcnews.com/scienceandsociety/2008/07/global-warming.html#comments http://blogs.abcnews.com/scienceandsociety/2008/09/nature-is-not-a.html ) http://www.skepticalscience.com/climate-sensitivity.htm#1725 http://www.skepticalscience.com/climate-sensitivity.htm#1762 http://www.skepticalscience.com/climate-sensitivity.htm#1748
  25. Thank you, chris. Gord - your comment 381 - "Atmospheric CO2 vs Earth Temperature During the Ice Ages The Ice Ages (Figure 7) shows the biggest variances (interpolating) for Temp is 13 deg C (+3 to -10)" I suspect this temperature is a regional one; the global average surface temperature variation between glacials and interglacials is somewhere around 6 deg C. On your other points: Within any sufficiently small interval, a 'nice' function (piecewise smooth) can be approximated by a line. As I just mentioned above somewhere, the logarithmic proportionality of radiative forcing to CO2 level is an approximation that does not apply indefinitely - specifically, at low enough CO2 level, the relationship will be closer to linear. -------------- The reason why: The general trend (applying to smaller peaks and valleys, across the multitude of individual absorption line peaks in the CO2 absorption band centered near 15 microns) is for absorption cross section (a cross section is the contribution to optical path length per unit mass (or moles); cross section per unit volume = optical path length per unit geometric length) to increase toward the center of the band near 15 microns. At sufficiently low levels, the effect is not even close to saturated at the tropopause level at most wavelengths, so increasing CO2 may have a nearly linearly proportional tropopause-level forcing. But eventually the wavelengths near 15 microns become saturated - the opacity becomes so great that there is very little temperature variation across any distance of significant transmissity, so further increases in opacity cannot much reduce the net radiative flux at that wavelength (a net radiative flux requires that there is some difference in radiant intensity coming from different directions - for LW radiation, some variation in temperature must be 'visible' at the wavelength being considered from a single location; when the opacity is large enough, temperature variations across a given geometric distance are essentially hidden from each other). However, outside this central portion of the absorption band, increasing CO2 still has significant LW forcing. The forcing becomes nearly logarithmically proportional to CO2 concentration, because for a given increase by some factor (such as by 2 - a doubling), the width of the interval of wavelengths of some level or greater opacity tends to increase by some nearly constant amount, as the width of the saturated interval increases, and the edges at which the opacity starts to become significant shift outward from the center. (Of course, blackbody radiation intensity will vary somewhat over wavelength, which will modify this picture just a little (not a large amount because their is not so much radiation intensity variation over the range of wavelengths encompassed by the CO2 absorption band. It will also be modified if the CO2 band expands into an area of greater overlap with an absorption band of some other substance - eventually, expansion of the CO2 band on the longer-wavelength side would run into greater opacity from water vapor. (PS such overlaps are taken into account in actually calculating the radiative forcing.). Because net air-to-air radiative transfer requires intermediate opacity - sufficient transmissivity for temperature variations to be visible to each other, but sufficient opacity for the layers of air to be visible from any distance - and because the region of intermediate opacity for CO2 corresponds to the sides of the band, in between the central saturated portion and the edges of significant opacity, and these regions merely shift outward from the center with increasing CO2 when in the logarithmic regime, the radiative effects of changing CO2 level are mainly on direct net radiative energy transfer between the surface and the air, from the air to space, and from the surface to space - EXCEPT where the spectrum of CO2 overlaps with water vapor or other agents - increasing CO2 will affect the radiative fluxes involving clouds, for example. -------------- Also, climate sensitivity (equilibrium global average surface temperature response per unit radiative forcing) is not expected to be invariant over temperature - but over a sufficiently small range it might be close to invariant. But for global cooling in particular, if we go beyond ice age cold, if we bring the 'ice line' into lower latitudes, the ice albedo feedback may reach a point at which the climate sensitivity actually becomes infinite. But not infinite to infinite temperature change - the infinite sensitivity just means that any infinitesimal negative radiative forcing would kick the climate over an edge and possibly cause complete freeze-over. -------------------------------

Prev  5  6  7  8  9  10  11  12  13  14  15  16  17  18  19  20  21  22  23  24  Next

Post a Comment

Political, off-topic or ad hominem comments will be deleted. Comments Policy...

You need to be logged in to post a comment. Login via the left margin or if you're new, register here.

Link to this page


The Consensus Project Website

THE ESCALATOR

(free to republish)


© Copyright 2024 John Cook
Home | Translations | About Us | Privacy | Contact Us