Climate Science Glossary

Term Lookup

Enter a term in the search box to find its definition.

Settings

Use the controls in the far right panel to increase or decrease the number of terms automatically displayed (or to completely turn that feature off).

Term Lookup

Settings


All IPCC definitions taken from Climate Change 2007: The Physical Science Basis. Working Group I Contribution to the Fourth Assessment Report of the Intergovernmental Panel on Climate Change, Annex I, Glossary, pp. 941-954. Cambridge University Press.

Home Arguments Software Resources Comments The Consensus Project Translations About Support

Bluesky Facebook LinkedIn Mastodon MeWe

Twitter YouTube RSS Posts RSS Comments Email Subscribe


Climate's changed before
It's the sun
It's not bad
There is no consensus
It's cooling
Models are unreliable
Temp record is unreliable
Animals and plants can adapt
It hasn't warmed since 1998
Antarctica is gaining ice
View All Arguments...


Username
Password
New? Register here
Forgot your password?

Latest Posts

Archives

Sun & climate: moving in opposite directions

What the science says...

Select a level... Basic Intermediate Advanced

The sun's energy has decreased since the 1980s but the Earth keeps warming faster than before.

Climate Myth...

It's the sun

"Over the past few hundred years, there has been a steady increase in the numbers of sunspots, at the time when the Earth has been getting warmer. The data suggests solar activity is influencing the global climate causing the world to get warmer." (BBC)

At a glance

Thankfully for us, our Sun is a very average kind of star. That means it behaves stably over billions of years, steadily consuming its hydrogen fuel in the nuclear reaction that produces sunshine.

Solar stability, along with the Greenhouse Effect, combine to give our planet a habitable range of surface temperatures. In contrast, less stable stars can vary a lot in their radiation output. That lack of stability can prevent life, as we know it, from evolving on any planets that might orbit such stars.

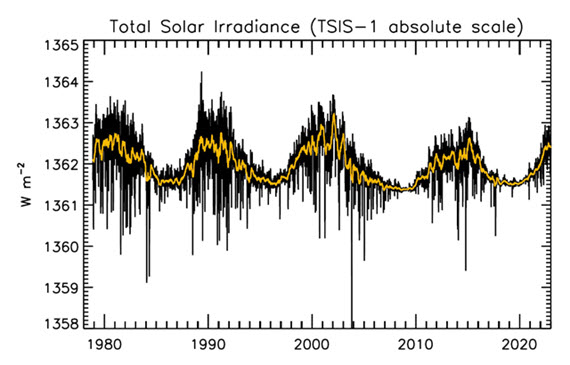
That the Sun is a stable type of star is clearly demonstrated by the amount of Solar energy reaching Earth's average orbital position: it varies very little at all. This quantity, called the Total Solar Irradiance, has been measured for around forty years with high accuracy by sensitive instruments aboard satellites. Its average value is 1,362 watts per square metre. Irradiance fluctuates by about a watt either way, depending on where we are within the 11-year long sunspot cycle. That's a variation of no more than 0.15%.

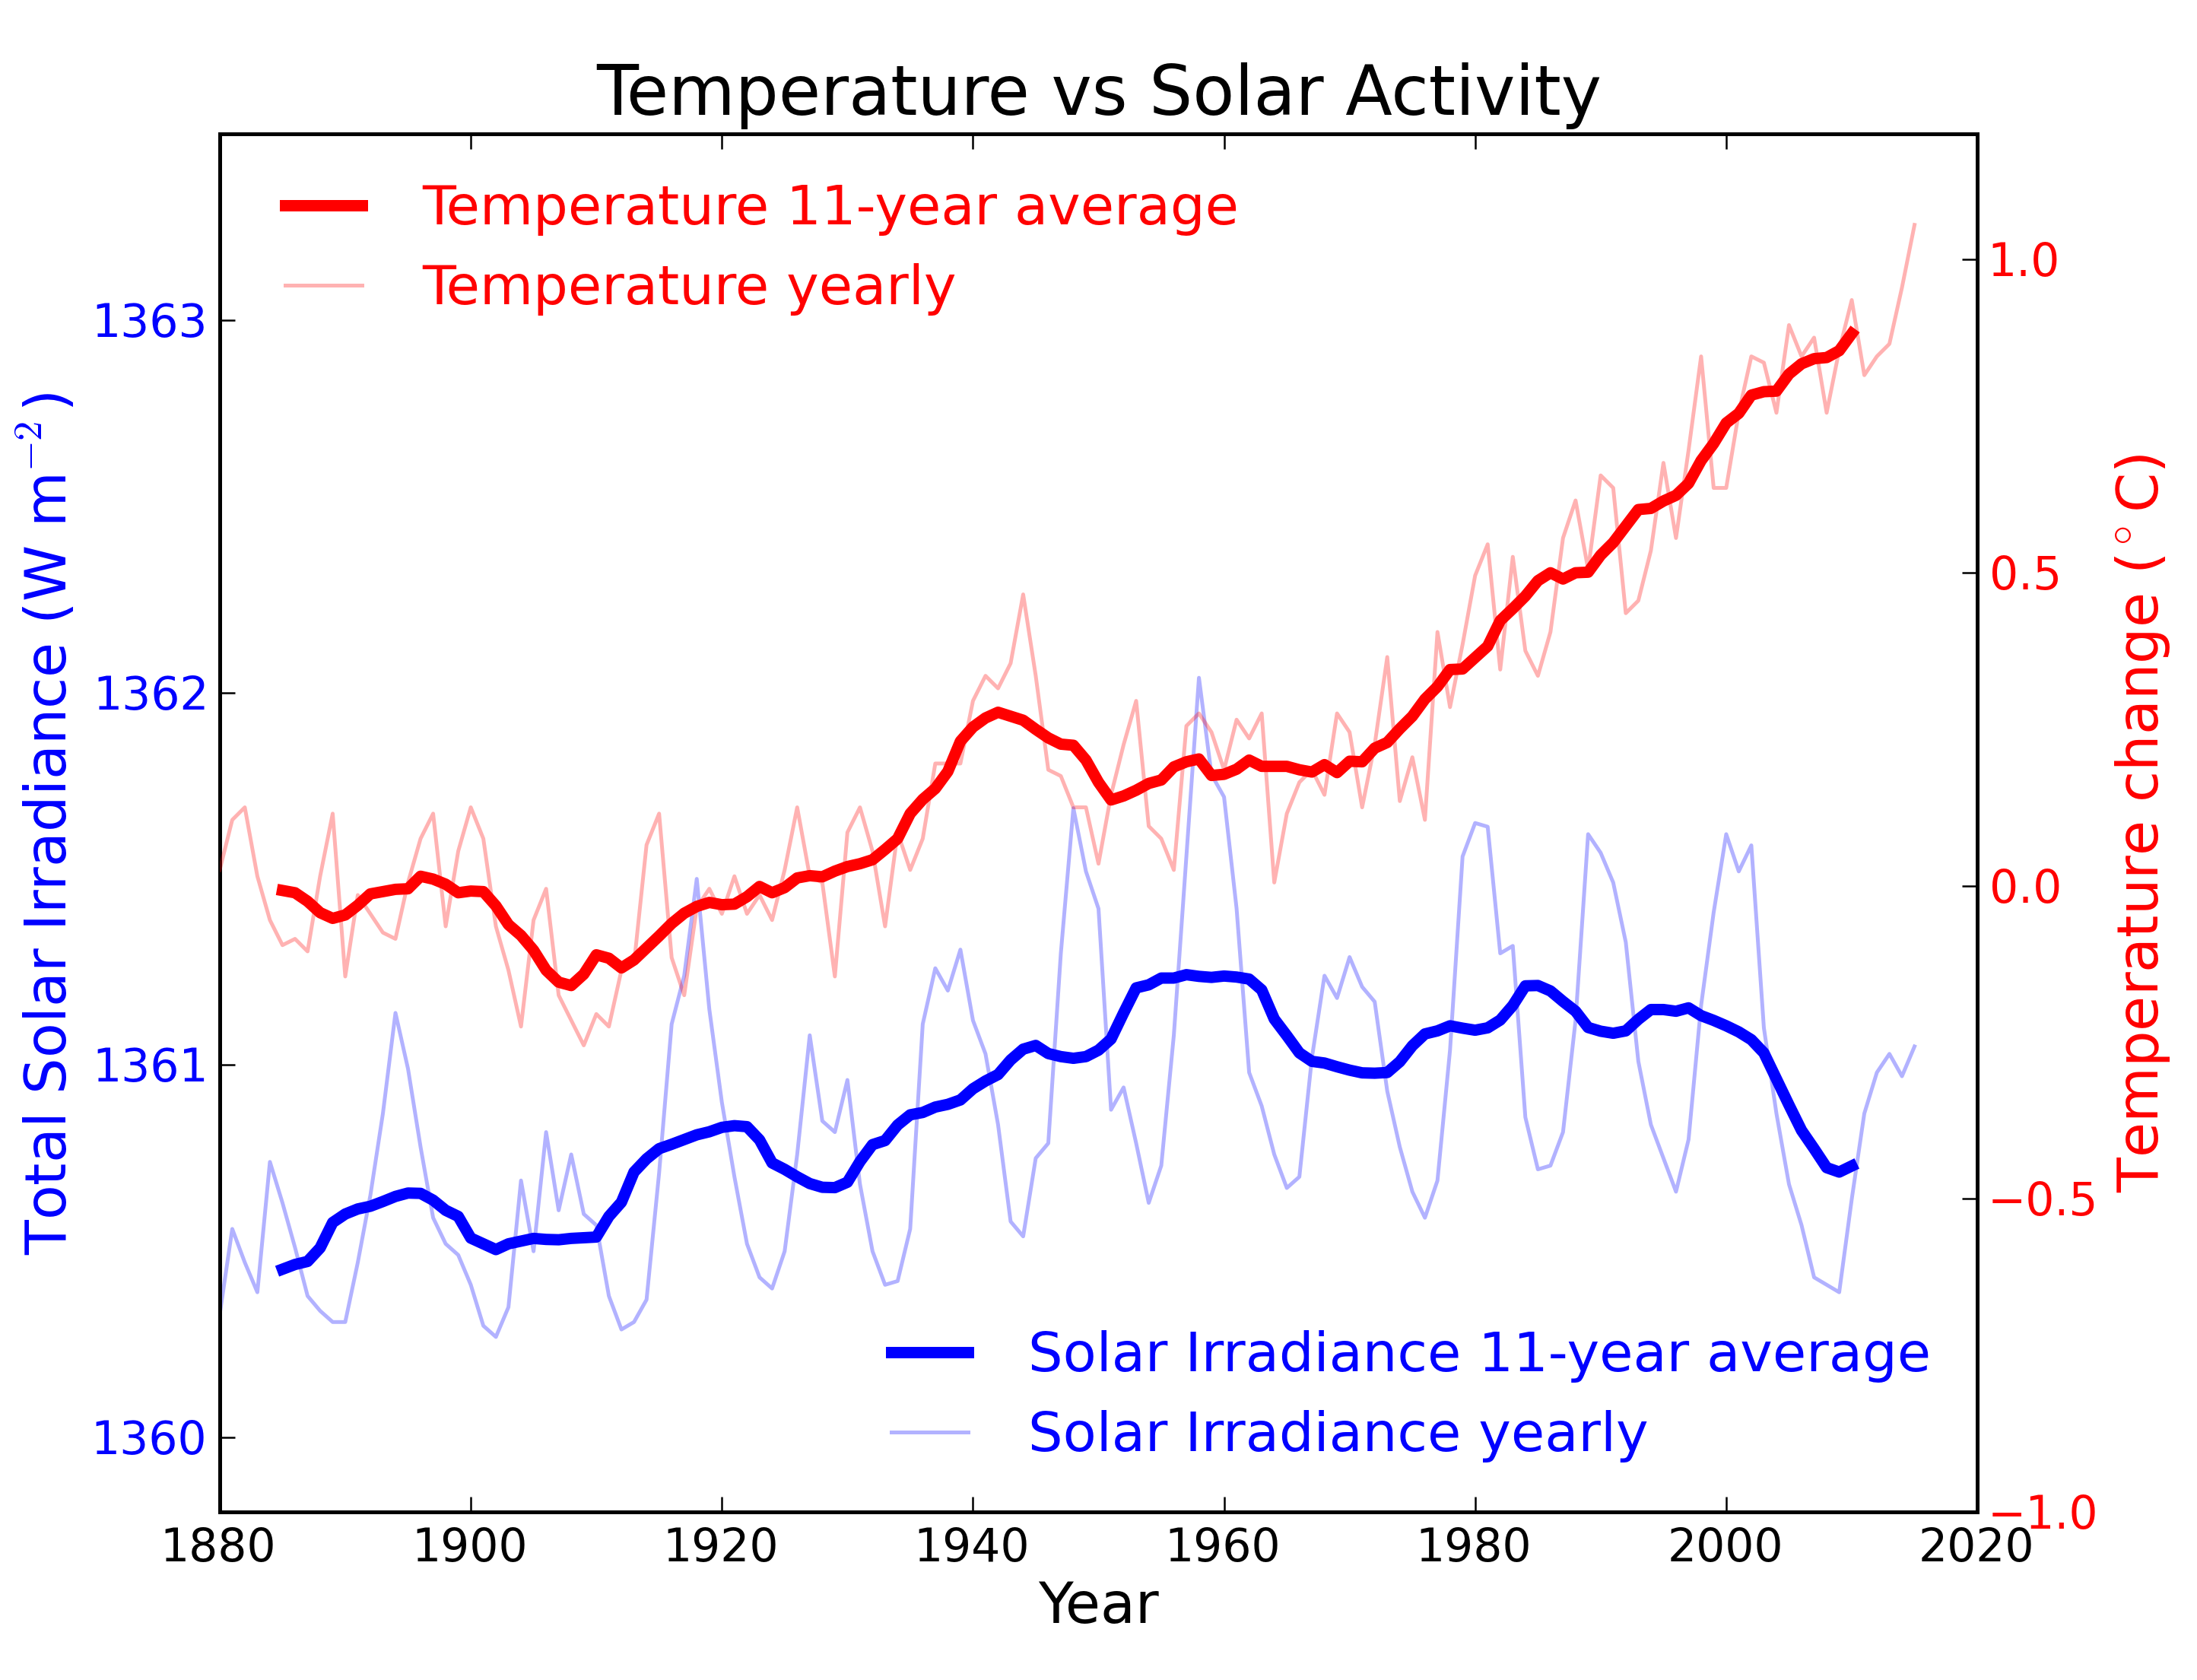
From the early 1970s until today, the Solar radiation reaching the top of Earth's atmosphere has in fact shown a very slight decline. Through that same period, global temperatures have continued to increase. The two data records, incoming Solar energy and global temperature, have diverged. That means they have gone in opposite directions. If incoming Solar energy has decreased while the Earth continues to warm up, the Sun cannot be the control-knob of that warming.

Attempts to blame the sun for the rise in global temperatures have had to involve taking the data but selecting only the time periods that support such an argument. The remaining parts of the information - showing that divergence - have had to be ditched. Proper science study requires that all the available data be considered, not just a part of it. This particular sin is known as “cherry-picking”.

Please use this form to provide feedback about this new "At a glance" section, which was updated on May 27, 2023 to improve its readability. Read a more technical version below or dig deeper via the tabs above!


Further details

Our Sun is an average-sized main sequence star that is steadily using its hydrogen fuel, situated some 150 million kilometres away from Earth. That distance was first determined (with a small error) by a time consuming and complex set of measurements in the late 1700s. It led to the first systemic considerations of Earth's climate by Joseph Fourier in the 1820s. Fourier's number-crunching led him to realise a planet of Earth's size situated that far from the Sun ought to be significantly colder than it was. He was thereby laying the foundation stone for the line of enquiry that led after a few decades to the discovery of what we now call the Greenhouse Effect – and the way that effect changes in intensity as a response to rising or falling levels of the various greenhouse gases.
TSI Solar cycles

Figure 1: Plot of the observational record (1979-2022) on the scale of the TSIS-1 instrument currently flying on the space station. In this plot, the different records are all cross calibrated to the TSIS-1 absolute scale (e.g., the TSIS1-absolute scale is 0.858 W/m^2 higher than the SORCE absolute scale) so the variability of TSI in this plot is considered to be its “true variability” (within cross calibration uncertainties). Image: Judith Lean.

The Sun has a strong magnetic field, but one that is constantly on the move, to the extent that around every 11 years or so, Solar polarity flips: north becomes south, until another 11 years has passed when it flips back again. These Solar Cycles affect what happens at the surface of the Sun, such as the sunspots caused by those magnetic fields. Each cycle starts at Solar Minimum with very few or no sunspots, then rises mid-cycle towards Solar Maximum, where sunspots are numerous, before falling back towards the end. The total radiation emitted by the Sun – total solar irradiance (TSI) is the technical term – essentially defined as the solar flux at the Earth's orbital radius, fluctuates through this 11-year cycle by up to 0.15% between maximum and minimum.

Such short term and small fluctuations in TSI do not have a strong long term influence on Earth's climate: they are not large enough and as it's a cycle, they essentially cancel one another out. Over the longer term, more sustained changes in TSI over centuries are more important. This is why such information is included, along with other natural and human-driven influences, when running climate models, to ask them, “what if?"

An examination of the past 1150 years found temperatures to have closely matched solar activity for much of that time (Usoskin et al. 2005). But also for much of that time, greenhouse gas concentrations hardly varied at all. This led the study to conclude, "...so that at least this most recent warming episode must have another source."
TSI vs. T
Figure 2: Annual global temperature change (thin light red) with 11 year moving average of temperature (thick dark red). Temperature from NASA GISS. Annual Total Solar Irradiance (thin light blue) with 11 year moving average of TSI (thick dark blue). TSI from 1880 to 1978 from Krivova et al. 2007. TSI from 1979 to 2015 from the World Radiation Center (see their PMOD index page for data updates). Plots of the most recent solar irradiance can be found at the Laboratory for Atmospheric and Space Physics LISIRD site.

The slight decline in Solar activity after 1975 was picked up through a number of independent measurements, so is definitely real. Over the last 45 years of global warming, Solar activity and global temperature have therefore been steadily diverging. In fact, an analysis of solar trends concluded that the sun has actually contributed a slight cooling influence into the mix that has driven global temperature through recent decades (Lockwood, 2008), but the massive increase in carbon-based greenhouse gases is the main forcing agent at present.

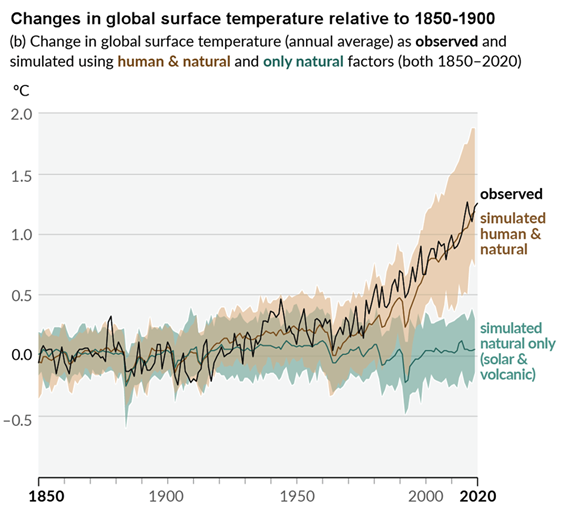
Other studies tend to agree. Foster & Rahmstorf (2011) used multiple linear regression to quantify and remove the effects of the El Niño Southern Oscillation (ENSO) and solar and volcanic activity from the surface and lower troposphere temperature data.  They found that from 1979 to 2010, solar activity had a very slight cooling effect of between -0.014 and -0.023°C per decade, depending on the data set. A more recent graphic, from the IPCC AR6, shows these trends to have continued.

AR6 WGI SPM Figure 1 Panel p

Figure 3: Figure SPM.1 (IPCC AR6 WGI SPM) - History of global temperature change and causes of recent warming panel (b). Changes in global surface temperature over the past 170 years (black line) relative to 1850–1900 and annually averaged, compared to Coupled Model Intercomparison Project Phase 6 (CMIP6) climate model simulations (see Box SPM.1) of the temperature response to both human and natural drivers (brown) and to only natural drivers (solar and volcanic activity, green). For the full image and caption please click here or on the image.

Like Foster & Rahmstorf, Lean & Rind (2008) performed a multiple linear regression on the temperature data, and found that while solar activity can account for about 11% of the global warming from 1889 to 2006, it can only account for 1.6% of the warming from 1955 to 2005, and had a slight cooling effect (-0.004°C per decade) from 1979 to 2005.

Finally, physics does not support the claim that changes in TSI drive current climate change. If that claim had any credence, we would not expect to see the current situation, in which Earth's lower atmosphere is warming strongly whereas the upper atmosphere is cooling. That is exactly the pattern predicted by physics, in our situation where we have overloaded Earth's atmosphere with greenhouse gases. If warming was solely down to the Sun, we would expect the opposite pattern. In fact, the only way to propagate this myth nowadays involves cherry-picking everything prior to 1975 and completely disregarding all the more recent data. That's simply not science.

Longer-term variations in TSI received by Earth

It's also important to mention variations in TSI driven not by Solar energy output but by variations in Earth's orbit, that are of course independent of Solar activity. Such variations, however, take place over very long periods, described by the Milankovitch orbital cycles operating over tens of thousands of years. Those cycles determine the distance between Earth and the Sun at perihelion and aphelion and in addition the tilt the planet's axis of rotation: both affect how much heat-radiation the planet receives at the top of its atmosphere through time. But such fluctuations are nothing like the rapid changes we see in the weather, such as the difference between a sunny day and a cloudy one. The long time-factor ensures that.

Another even more obscure approach used to claim, "it's the sun" was (and probably still is in some quarters) to talk about, "indirect effects". To wit, when studies can't find a sufficiently large direct effect, bring even lesser factors to the fore, such as cosmic rays. Fail.

In conclusion, the recent, post 1975 steep rise in global temperatures are not reflected in TSI changes that have in fact exerted a slight cooling influence. Milankovitch cycles that operate over vastly bigger time-scales simply don't work quickly enough to change climate drastically over a few decades. Instead, the enormous rise in greenhouse gas concentrations over the same period is the primary forcing-agent. The physics predicted what is now being observed.

Last updated on 27 May 2023 by John Mason. View Archives

Printable Version  |  Offline PDF Version  |  Link to this page

Argument Feedback

Please use this form to let us know about suggested updates to this rebuttal.

Related Arguments

Further viewing

Related video from Peter Sinclair's "Climate Denial Crock of the Week" series:

Further viewing

This video created by Andy Redwood in May 2020 is an interesting and creative interpretation of this rebuttal:

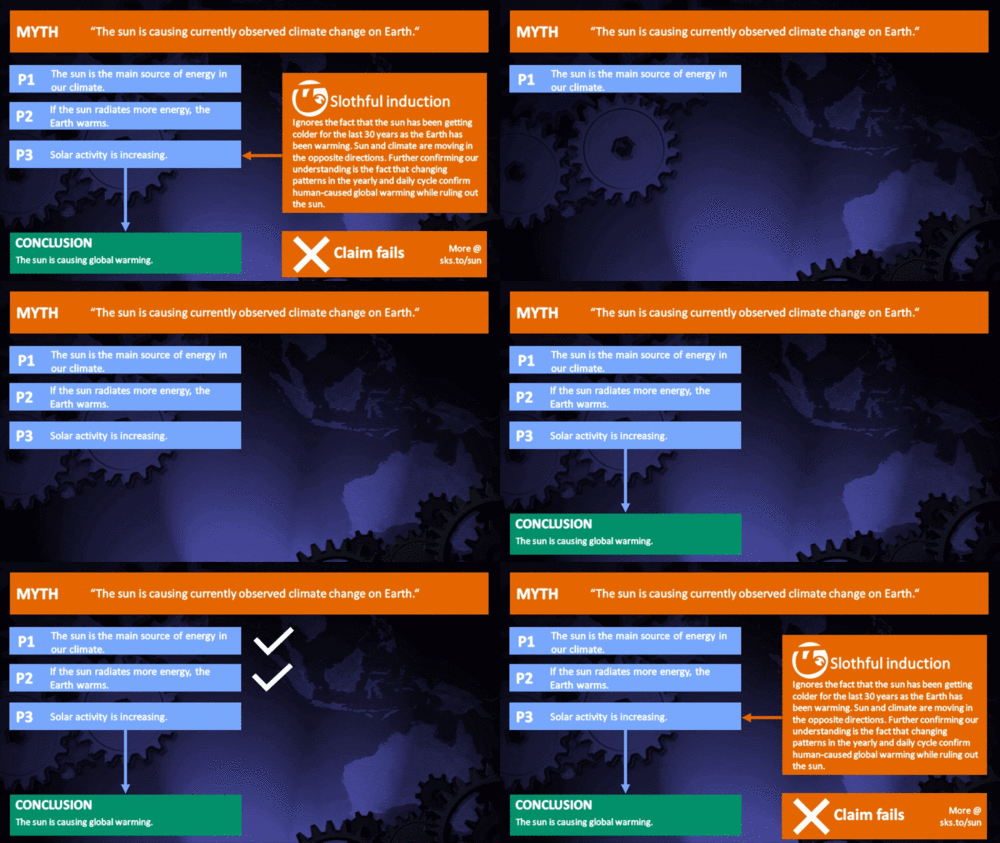
Myth Deconstruction

Related resource: Myth Deconstruction as animated GIF

MD Sun

Please check the related blog post for background information about this graphics resource.

Denial101x videos

Related lecture-videos from Denial101x - Making Sense of Climate Science Denial

and

Additional video from the MOOC

Expert interview with Mike Lockwood

Comments

Prev  11  12  13  14  15  16  17  18  19  20  21  22  23  24  25  26  27  28  29  30  Next

Comments 501 to 525 out of 841:

  1. not sure I agree with your math Gord. TE*1E4 = (C/(4*SB*(1-GHG))*(1-A) where TE = temp earth C is solar constant SB is stefan Bolz. constant GHG is the greenhouse effect A is albedo If we assume no GHG effect and assume solar constant is 1366w/m2 ( as measured) and albedo of 0.3 then resolving the equation gives: TE*1E4 = (1366/4*5.67*1E-8)*0.7 which results in TE = 254abs. And no, the sun is presently not the only energy source. It may be the largest ( even by a long way) but the earth has internal heat (vulcanism) frictional heat from gravity ( earth moon barycentre is inside the earth) heat from burning FF's, heat from radioactive decay - to name but a few.
  2. As stupid as ever, Gord. Way to be consistent! ""In the absence of the greenhouse effect and an atmosphere, the Earth's average surface temperature of 14 deg C (57 deg F) could be as low as -18 deg C (-0.4 deg F), the black body temperature of the Earth." http://en.wikipedia.org/wiki/Greenhouse_effect" That's what wikipedia says, then. It's not what I say. It's not what scientists say so long as they proofread well. It should be, 'In the absence of the greenhouse effect, the Earth's average surface temperature would be about -18 deg C.' I've told you this before. Did it ever occur to you that some of your sources might have rounded the sun's effective temperature (effective as in the temperature that an isothermal blackbody would have that emits the same radiant flux - actual photosphere not being isothermal through it's visible depth, etc.)? Observations: The Earth reflects about 30 % of the solar radiation it intercepts. Observations: The Earth emits to space less than is emitted from the surface, and the total emission to space is that which a blackbody (of the same size and shape) would emit if at about 255 K. Specifically, the emission to space is particularly reduced in places with high cold cloud tops, and in various intervals of wavelengths where H2O, CO2, and various other gases contribute opacity to the air - a spectral pattern not at found in the optical properties of the surface. (I've told you this before.) The Sun is the only energy source in an intermediate sense. Ultimately, the sun is not a source - the energy came from matter that came from energy+matter at some previous time. More proximately, there is energy in the climate system and the climate system can gain and lose energy, and energy can be redistributed within it. (I'VE TOLD YOU THIS BEFORE.) Your equation has a minor error: TE = TS ( ( (1-a)^0.5 * Rs)/(2*D) ) )^0.5) should be TE = TS ( ( (1-a)^0.5 * Rs)/D) ) )^0.5) (Mizimi - other than that, his formula is the correct one (a broken clock is correct twice a day (unless it has AM/PM - with digital, 'all bets are off')) - it would look more intuitive if written this way: TE = TS * [ (1-a)^0.5 * (Rs/D) ]^0.5 or TE = TS * (1-a)^(1/4) * (Rs/D)^(1/2) derived from TE^4 = TS^4 * (1-a) * (Rs/D)^2 and while I figured out what you mean by TE*1E4, that would appear confusing to many people; 1E4 could be interpeted as 1 * 10^4, so that it appears that you just multiplied TE by a constant of 10,000.)
  3. "LONGER TERM SOLAR MINIMUM" http://icecap.us/images/uploads/SOLAR_MINIMUM.pdf
    Response: This topic is covered in We're heading into an ice age.
  4. Gord - For the first time ever, you have truly found a real and significant mistake. I did temporarily forget the factor of 4 for the Earth's surface area divided by it's cross section, which of course has a square root of 2. Your equation was correct and mine was erroneous. It is TE = TS ( ( (1-a)^0.5 * Rs)/(2*D)) ) )^0.5) But everything else you say is just stupid, at best. As usual. I should pity you.
  5. Might be worth pruning this thread and moving some of the stuff to a background file, else it's just going to keep growing with tangential stuff (most retroreflective signs use glass beads that work the same way moisture does: http://www.trafficsign.us/signsheet.html) Not to mention the stuff that completely misses the mark but keeps whizzing by over and over.
  6. "most retroreflective signs use glass beads" Thanks, Hank.
  7. "What the science says... Solar activity has shown little to no long term trend since the 1950's." This is incorrect. Although the maximum amplitudes of sunspot numbers have gently declined since the 1960's, the short duration of the minima until the most recent has meant that the average sunspot number increased right up to 2001, shortly before the rapid warming ended. The measurement of TSI is a controversial area, with two teams disagreeing over the splicing and calibration of the data. The science is not settled here.
    Response:

    While there is some debate over the long term trend of solar activity, the debate is essentially over whether the sun is showing a slight warming trend or a slight cooling trend. Either way, the sun cannot have played more than a minimal part in recent global warming. Nevertheless, various independent measurements of solar activity all confirm the sun has shown a slight cooling trend since 1978. This means rather than contribute to global warming, solar activity has actually had a slight cooling effect on climate.

  8. Although it is somewhat speculation, lead may have offset warming from 1940 to 1980 and therefore the links between global temperature and sun activity could be weaker then expected http://www.newscientist.com/article/dn16976-did-lead-cause-global-cooling.html Sorry i cant find the actual paper this has been published in. I'm posting this for debate not because i sincerely believe there is a direct correlation here
    Response: The paper is Inadvertent climate modification due to anthropogenic lead (Cziczo 2009). Thanks for the link - an interesting paper. I wonder if it'll have any impact on our understanding of mid-century cooling.
  9. Correction/Clarification: What I refered to as an "emission distribution" in comment 501 and perhaps subsequent if not prior comments: --------- "This can be extended farther. Suppose we are interested in the absorption of I#f. For all the fractions of dw that are scattering or reflection cross sections per unit area, the fate of those fractions of I#f can be traced farther, through successive scatterings and reflections, until every last bit is absorbed. This will be a distribution of dw that may extend outside of the path and over other paths, perhaps over some volume. It is the distribution of the absorption of I#f(O). Assuming local thermodynamic equilibrium within each unit volume, It is also the distribution of the emission of I#b(O) - multiplying the distribution density by I#bb(T) and integrating over the distribution gives the I#b(O) value, where I#bb(T) is the blackbody intensity (normalized relative to refraction) as a function of T, however it varies over space." "I#f(O) also has an emission distribution that can be found, tracing back in the opposite direction from point O." ---------- It should be clear that by "emission distribution", I was refering to a distribution in visibility, which, when weighted by the blackbody radiant intensity for the temperature at each location and then integrated over volume, would give the radiant intensity coming from the direction considered at the location considered. However, this is more correctly called the "weighting function", which avoids confusion, since it would also make sense to think that the emission distribution IS the blackbody radiation intensity weighted by the weighting function.
  10. Solar activity didn't cause global warming, it caused several really hot years. Volcanic activity in the oceans have caused most of the ice melt on the ice caps. Or I should say where the warm waters from volcanic activity has effected the ice. Ice on land has increased, this you would expect with the heating up of the oceans. Moisture is being pumped into the air, and this warm moist air is turning into snow. Now that the solar activitty has settled down you can expect to see a hell of a lot more snow. This is going to do nothing to build up the Ice caps, because the waters in the oceans are still being heated up by volcanic activity. Nor do I expect to see a reduction in volcanic activity in the oceans. I find it strange that with ever increasing volcanic activity in the news, tsunamis, and earthquakes that this has been overlooked and ignored. The carbon sink suddenly becomes saturated and still it is attributed to man made hydrocarbons. Yet it was not a gradual build up that was expected but sudden saturation, again underwater volcanic activity was totally ignored but is the most logical reason for the sudden saturation of the carbon sink. But never fear, the "we are all going to die!" bunch can take solace in the fact that we are in for a lot of really cold weather and even greater storms generated by extreme temperature differentials. This is not something you would expect to happen with total global warming, if anything storms should be milder. Before anyone argues with me, you should probably check out the rise in tectonic activity around the world. How this tectonic activity has changed the ocean floor not to mention ocean currents. Don't argue, look first.
  11. Did anyone answer the question as to why correlation has to be between increase and sun activity and temperature. As I heard it stated, I can put a pot of cold water on my stove, heat up my stove from fold to a constant temperature quickly, and then have the water take much longer to heat and continue to heat up even after my stove is at a constant temp. Why is it any difference from the sun? Especially now as the sun activity seams to be declining and the temperatures of the last decade are stagnate.
    Response: This issue is examined in Climate time lag.
  12. These words spring to mind. “No amount of experimentation can ever prove me right; a single experiment can prove me wrong.” and "If we knew what it was we were doing, it would not be called research, would it?". -- Albert Einstein (1879-1955) [German physicist] Just because its warming does not PROVE its CO2. Cause and effect issues. The commentary on radiative "forcing' is also a bit hard for me to understand. Is it another word for Convection? After all, hot gases rise (when not trapped in a glass greenhouse) and when surrounded by cooler gases, they lose that latent heat, clods are created, humidity changes. Where are the records and observations of the changes in humidity and cloud cover?.
    Response: "Just because its warming does not PROVE its CO2. Cause and effect issues."

    That is true. The reason we know the warming is caused by CO2 is because satellites and surface measurements are observing more infrared radiation being trapped at the specific wavelengths that CO2 absorbs energy. That is what is meant by 'radiative forcing' which is just another term for an imposed energy imbalance. More CO2 is causing less radiation to escape back out to space which causes an energy imbalance. The result is the planet is accumulating heat.
  13. If it was only the troposphere & near-surface that was showing warming, then I might-just might-be prepared to accept that something other than GHG was the cause of the last half-century of global warming. What concerns me, though, is that the Stratosphere has been COOLING over that same period of time (minus a few spikes due to a few huge volcanic eruptions). If the sun were the cause of the warming, then the warming would be spread throughout the entire atmosphere, yet instead the warming simply *stops* at the tropospheric level. This suggests that long-wave radiation is being trapped in the troposphere by.....Greenhouse gases!
  14. Another point. Even with historic low sunspot numbers, global temperatures have still remained above +0.5 degrees over the 1951-1980 mean for the last decade. What happens if we see a sudden surge in sunspot numbers over the coming 22-33 years? Will we see an increase in the rate of warming-per decade-to as much as +0.3 to +0.4 degrees per decade? Its uncertainties like this (& the positive feedbacks of CO2 release from oceans & increased levels of water vapor) which makes me think we should engage in the precautionary principle-namely to immediately begin making sensible changes in our generation & use of electricity to reduce the CO2 emissions associated with our economies (not by reducing GDP, but by reducing both the KW/$ GDP & the tCO2e/$ of GDP.)
  15. This solar graph has some resemblance to the tree ring proxy graph where mike's nature trick was applied to - to hide the decline. So couldn't you just use the trick as well? Then it would fit the instrumental data better. (This is not meant as a mocking, a serious reply would be appreciated.)
    Response: It's funny you should mention that. I'd not thought of it that way before but "hide the decline" is exactly what the Great Global Warming Swindle did when comparing sun to climate. They deliberately cut off solar levels at 1975. And as if this graphs wasn't misleading enough, they also "hide the incline" of temperature rise in 1980 - global temperatures actually go off the chart if you extend them to current temperatures:

    Great Global Warming Swindle: global temperature vs solar activity

    As for "Mike's Nature trick", that situation is the case where the decline is not a decline in temperatures but a decline in tree ring growth's response to temperature. So it's entirely appropriate to not use tree rings as a proxy for temperature after 1960 when some other factor is clearly influencing tree ring growth. More on tree ring divergence...
  16. Wow, thanks for the fast reply. It has been a while since I've seen the propagandistic "great global warming swindle" but it look like you're quite right about them hiding the decline. even tough it seems to me they at least didn't substitute it with instrumental data (i guess the red curve is the one for solar activity?) - but it's bad enough anyway. if the factor which is influencing tree ring growth is profoundly understood then it should be possible to correct for that influence, wouldn't it? Will read your page on that subject now.
  17. This paper (http://www.spacecenter.dk/publications/scientific-report-series/Scient_No._3.pdf/view), published in 2007 by Eigil Friis-Christensen and Henrik Svensmark at the Danish National Space Center, is a response to Lockwood and Fröhlich's paper disputing the correlation between solar activity and land surface temperature. This new paper discusses the correlation between cosmic rays (solar activity) and sea surface temperature/atmospheric temperature. In both cases there is a clear correlation. While Lockwood and Fröhlich are correct in saying there is a divergence between solar activity and land surface temperature, the correlation remains true for two other temperature data sets (sea surface temp. and tropospheric temp.) Thus, one must question the validity of the land surface measurements, and admit the possibility that the sun may be playing a major role in current global warming.
  18. michaelkourlas, that 2007 paper by Friis-Christensen and Svensmark is old news. See Svensmark and Friis-Christensen rebut Lockwood’s solar paper.
  19. @Tom Dayton Thanks, I hadn't seen that.
  20. The problem of correlating the earth's global temperatures with observed driving factors is complex at best. Our weather is dominated by the oceans. These comprise 70 percent of the globe surface and represent a tremendous heat sink which is circulating continuously. As such we would expect that observed temperatures would have an appreciable time lag behind the driving factors.I would expect the time lag to be more than two solar cycles. Any calculation of the earth’s thermal balance would have to include a deep understanding of the interaction of the solar radiation with the ocean areas. The past observations of long term global shifts (the medieval warming and the little ice age) would suggest that the sun’s variation has caused large temperature changes in the past. In examining sunspot average numbers with smoothing filters of 25 to 30 years shows a significant increase from 1920 to 1970. Could that be a cause of the global temperature increase? Sunspots not only affect the total radiant energy, but also the frequency distribution. Also since oceans comprise 70 percent of the globe surface, are land measurements a true indication of global temperatures? I believe that ascribing the global temperature increase to the effects of greenhouse gasses is a vastly simplified solution to a very complex problem.
    Response:

    You make some good points. Yes, there is a climate lag. An important point to realise is that the lag doesn't mean there's a gap between a forcing (eg - warming sun) and the climate response. Climate responds immediately to a forcing. The lag refers to the time it takes for the climate to reach equilibrium after an imposed forcing.

    For example, say the sun warms. As the sun warms, there is more energy coming into our planet than escaping back to space, so the planet starts accumulating heat and warms. Eventually the sun stops warming. At this point, there is still more energy coming in than radiating back to space so the planet continues to warm. As the planet warms, it radiates more energy out to space. Eventually the energy out increases to match the energy coming back in and the planet is in equilibrium again. The time it takes for the planet to reach equilibrium is the climate lag.

    Currently what is happening is the planet's energy imbalance is increasing. We are not approaching equilibrium which is what you would expect if we were responding to an earlier period of warming sun. Instead, something else is causing less energy to escape out to space. Satellites measuring the radiation escaping out to space find that the less energy is occuring at the wavelengths that carbon dioxide absorb energy. So at a time when CO2 levels are reaching the highest levels in over 15 million years, we're also observing less energy escaping to space at the very wavelengths that CO2 absorb infrared radiation.

    These topics have been covered in previous posts. There is a post that goes into more detail re climate lag. We peruse the many papers that examine the possibility that the sun is causing global warming. You make a good point about the importance of oceans - not only do they comprise most of the Earth's surface, they also absorb most of the infrared radiation that is trapped by greenhouse gases. Consequently, a better metric for global warming is the planet's total heat content which includes all the heat accumulating in the oceans.

  21. A graph of sunspot count vs. time shows that some cycles are high for short periods and some are not as high but for longer periods. The relevant measure is energy which is the combination of both magnitude and time as in the time-integral of sunspot count. Subtracting the energy radiated from the planet results in the net energy retained by the planet. An appropriate scale factor relates net energy to average global temperature anomaly. Combine this with the Effective Sea Surface Temperature and the result is a model that accurately predicts average global temperature anomalies since 1895. That is 114 years…and counting. It is not necessary to include changes to the level of CO2 or any other ghg. Anyone that can use EXCEL can do this. Or, see it done already at http://climaterealists.com/attachments/database/TwentiethCenturyTemperatureCorrelationupdate.pdf which has links to the source data. (Replace all references to PDO with ESST which is short for Effective Sea Surface Temperature).
  22. Dan, I've seen that writeup elsewhere. Could you go through it step-by-step, being especially careful to help us understand the following things written by the author: --"The proportionality constant, 6.36E-9, was adjusted to get a fairly constant net energy from 1700 to about 1940"; Why? --"The up trend or down trend periods ascribed to the Pacific Decadal Oscillation (PDO) are taken as 32 years long for all periods." Why 32 years for all periods? --"The temperature range for the PDOs alone was taken to be 0.45 K for all of the PDOs." Why? For a PDO downtrend, the value added to the above sunspot calculation is 0.45 minus 0.45 multiplied by the fraction of the PDO time period that has taken place." Why?
  23. The reference site for sunspot count starts the data at 1700. If you do the conservation of energy assessment, the resulting graph fluctuates about a trend until about 1940 and then the trend rises continuously thereafter. The graph reveals that the trend of radiation energy balance changed in about 1940. The constant (it is actually 6.52E-9, the value 6.36E-9 was a misread) ‘normalizes’ the calculation for the 240 years prior to 1940. Oceans cover about 71% of the earth’s surface. A simple calculation reveals that the heat storage capacity (thermal capacitance) of the oceans to a depth of 700 meters is about 200 times that of everything else on the planet. Thus the average temperature of the oceans is by far the best indicator of whether the planet is actually changing temperature. The data at http://www.nodc.noaa.gov/OC5/3M_HEAT_CONTENT/temperature shows that the planet stopped warming in about 2005. The next two ‘why’s relate to a discovery of the research. There are many ocean currents. Temperatures vary along the path of each current. The agencies that report average global temperature (agt) only use the temperature of the part of each current path that happens to be at the surface. Thus the contribution to the agt reports varies even though there is no intrinsic net gain of loss of energy over the entire circuit of each current. There are many different currents of which PDO is only one. The discovery is the net effect of all of the currents and is better identified as Effective Sea Surface Temperature (ESST). So replace all references to PDO with ESST. The discovery in time and magnitude is the ESST which produces the observed match of measured values. The last ‘why’ relates to simply a detailed instruction of how to do the arithmetic.
  24. Thanks for the amplification, Dan. I don't find the author's argument persuasive. The way it falls apart before the period where his numerical forcing no longer functions with available data versus the target objective offers a hint of the underlying problem. Here's a key remark by Gavin Schmidt relevant to the paper you cite: The potential for self-delusion is significantly enhanced by the fact that climate data generally does have a lot of signal in the decadal band (say between 9 and 15 years). This variability relates to the incidence of volcanic eruptions, ENSO cycles, the Pacific Decadal Oscillation (PDO) etc. as well as potentially the solar cycle. So another neat trick to convince yourself that you found a solar-climate link is to use a very narrow band pass filter centered around 11 years, to match the rough periodicity of the sun spot cycle, and then show that your 11 year cycle in the data matches the sun spot cycle. Often these correlations mysteriously change phase with time, which is usually described as evidence of the non-linearity of the climate system, but in fact is the expected behaviour when there is no actual coherence. Even if the phase relationship is stable, the amount of variance explained in the original record is usually extremely small. Schmidt on solar forcing The arbitrary choice of a 32 year PDO cycle here is an example of what Schmidt describes. Another problem is that the amount of power from solar variation available is not enough to warm the ocean as much as we've seen happen, so looking to variation to explain the ocean's warming is a non-starter in any case. Meanwhile, an unqualified claim of cessation of warming since 2005 is not really defensible. To support a conclusion that warming has ceased since 2005 you'd first have to explain why five years of data have more statistical power than fifty.
  25. The paper at the link at post 523 is an engineering analysis using the first law of thermodynamics applied to credible published data. It is very common to look at sunspots in terms of either just the number of them at any time or some time factor relating to a solar cycle. It should be obvious that a short wide solar cycle would have the same influence on planet energy as a tall narrow solar cycle. The way to take both number and time in to account is with the time-integral of sunspot number. I have found lots of papers that considered just sunspot number or just a time factor where they found poor correlation. However, I know of no other papers that considered the time-integral of sunspot number which has excellent correlation with measured temperature anomalies. The ESST for the last 114 years…and counting is defined as 32 year up trends followed by 32 year downtrends in a repeated 64 year cycle of magnitude 0.45 C and peaks in 1941 and 2005. When anomalies from the ESST cycle are combined with the equivalent anomalies from the sunspot time-integral calculation, the result is an excellent prediction of average global temperature anomalies since 1895. There are many ocean currents. PDO, ENSO, AMO, etc. and they are all occurring at the same time. Each of the currents has its own cycle time and phase relation with respect to the other currents. The NET effect of all of these currents since 1895 apparently matches the numerical cycle defined above. Prior to 1895 the phase relation may not have resulted in producing the noted temperatures or possibly the temperature measurements were inaccurate. As stated in the paper, future temperature anomalies depend on future sunspot numbers and future [ESST] behavior neither of which has been confidently predicted. When these can be predicted, then the model will predict future agt. Until then the model, which shows no signs of being wrong since 1895, provides the best estimate. It is certainly better than the IPCC prediction which has failed miserably for years. The perception that the only influence that the sun has on earth’s climate is by total solar radiation (TSI) is apparently wrong. In a separate analysis, I discovered that average global temperature is sensitive to average cloud altitude which determines average cloud temperature and thus the rate at which the clouds and thus the planet radiates energy to space. Others have shown that fewer sunspots correlate with more low level clouds. The overall mechanism sequence is: Fewer sunspots; reduced solar magnetic shielding of earth; increased galactic cosmic rays penetrating the atmosphere; increased low-level clouds; lower average cloud altitude; higher average cloud temperature; increased cloud-to-space radiation; lower agt. A rising temperature trend is going to be the conclusion if our knowledge is limited to statistical analysis and a 50 year period. However, if the record had started with best estimates of temperatures during the Medieval Warm Period the statistical trend would be down. The agt downtrend since 2005 was predicted by the model. The important point in all this is not so much what the agt is going to do but that, since agt can be accurately predicted with no need to consider change to the level of any ghg, then change to the level of CO2 or any other ghg has no significant influence on agt.

Prev  11  12  13  14  15  16  17  18  19  20  21  22  23  24  25  26  27  28  29  30  Next

Post a Comment

Political, off-topic or ad hominem comments will be deleted. Comments Policy...

You need to be logged in to post a comment. Login via the left margin or if you're new, register here.

Link to this page


The Consensus Project Website

THE ESCALATOR

(free to republish)


© Copyright 2024 John Cook
Home | Translations | About Us | Privacy | Contact Us