Climate Science Glossary

Term Lookup

Enter a term in the search box to find its definition.

Settings

Use the controls in the far right panel to increase or decrease the number of terms automatically displayed (or to completely turn that feature off).

Term Lookup

Settings


All IPCC definitions taken from Climate Change 2007: The Physical Science Basis. Working Group I Contribution to the Fourth Assessment Report of the Intergovernmental Panel on Climate Change, Annex I, Glossary, pp. 941-954. Cambridge University Press.

Home Arguments Software Resources Comments The Consensus Project Translations About Support

Bluesky Facebook LinkedIn Mastodon MeWe

Twitter YouTube RSS Posts RSS Comments Email Subscribe


Climate's changed before
It's the sun
It's not bad
There is no consensus
It's cooling
Models are unreliable
Temp record is unreliable
Animals and plants can adapt
It hasn't warmed since 1998
Antarctica is gaining ice
View All Arguments...


Username
Password
New? Register here
Forgot your password?

Latest Posts

Archives

Sun & climate: moving in opposite directions

What the science says...

Select a level... Basic Intermediate Advanced

The sun's energy has decreased since the 1980s but the Earth keeps warming faster than before.

Climate Myth...

It's the sun

"Over the past few hundred years, there has been a steady increase in the numbers of sunspots, at the time when the Earth has been getting warmer. The data suggests solar activity is influencing the global climate causing the world to get warmer." (BBC)

At a glance

Thankfully for us, our Sun is a very average kind of star. That means it behaves stably over billions of years, steadily consuming its hydrogen fuel in the nuclear reaction that produces sunshine.

Solar stability, along with the Greenhouse Effect, combine to give our planet a habitable range of surface temperatures. In contrast, less stable stars can vary a lot in their radiation output. That lack of stability can prevent life, as we know it, from evolving on any planets that might orbit such stars.

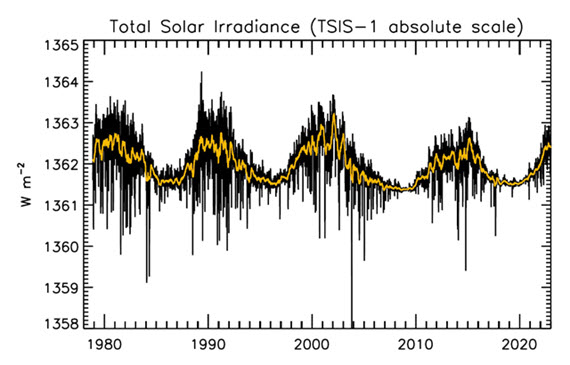
That the Sun is a stable type of star is clearly demonstrated by the amount of Solar energy reaching Earth's average orbital position: it varies very little at all. This quantity, called the Total Solar Irradiance, has been measured for around forty years with high accuracy by sensitive instruments aboard satellites. Its average value is 1,362 watts per square metre. Irradiance fluctuates by about a watt either way, depending on where we are within the 11-year long sunspot cycle. That's a variation of no more than 0.15%.

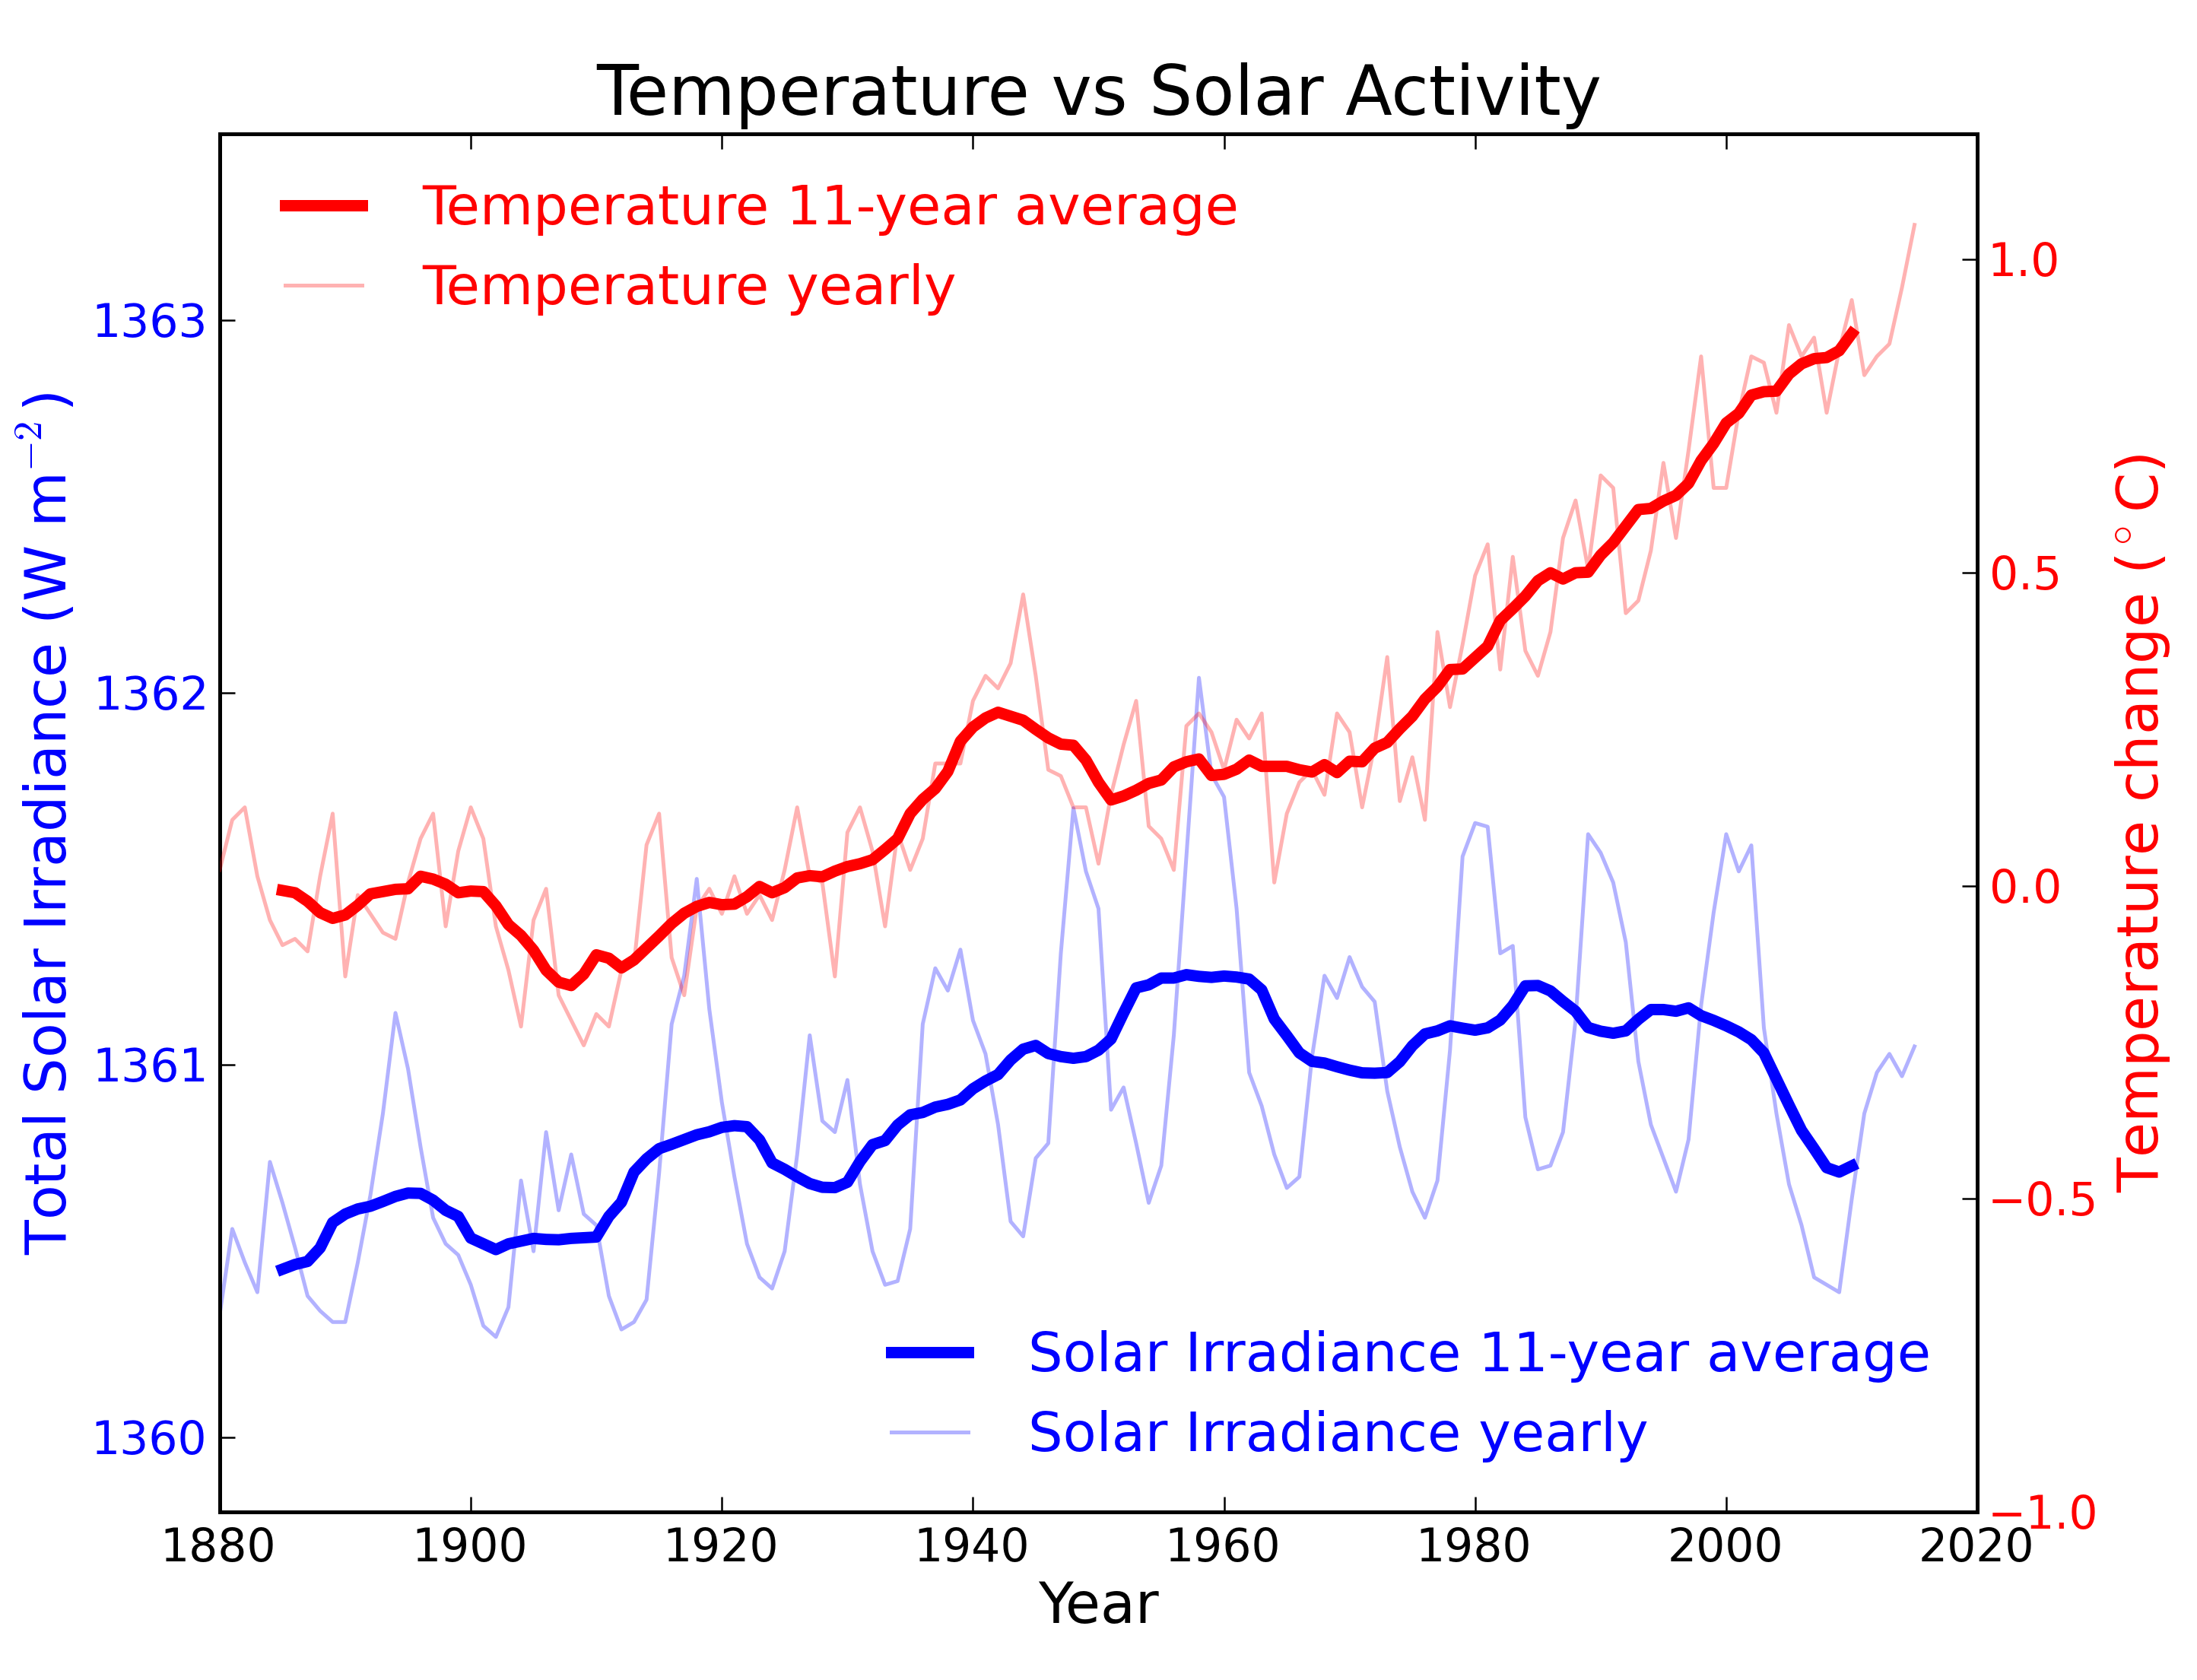
From the early 1970s until today, the Solar radiation reaching the top of Earth's atmosphere has in fact shown a very slight decline. Through that same period, global temperatures have continued to increase. The two data records, incoming Solar energy and global temperature, have diverged. That means they have gone in opposite directions. If incoming Solar energy has decreased while the Earth continues to warm up, the Sun cannot be the control-knob of that warming.

Attempts to blame the sun for the rise in global temperatures have had to involve taking the data but selecting only the time periods that support such an argument. The remaining parts of the information - showing that divergence - have had to be ditched. Proper science study requires that all the available data be considered, not just a part of it. This particular sin is known as “cherry-picking”.

Please use this form to provide feedback about this new "At a glance" section, which was updated on May 27, 2023 to improve its readability. Read a more technical version below or dig deeper via the tabs above!


Further details

Our Sun is an average-sized main sequence star that is steadily using its hydrogen fuel, situated some 150 million kilometres away from Earth. That distance was first determined (with a small error) by a time consuming and complex set of measurements in the late 1700s. It led to the first systemic considerations of Earth's climate by Joseph Fourier in the 1820s. Fourier's number-crunching led him to realise a planet of Earth's size situated that far from the Sun ought to be significantly colder than it was. He was thereby laying the foundation stone for the line of enquiry that led after a few decades to the discovery of what we now call the Greenhouse Effect – and the way that effect changes in intensity as a response to rising or falling levels of the various greenhouse gases.
TSI Solar cycles

Figure 1: Plot of the observational record (1979-2022) on the scale of the TSIS-1 instrument currently flying on the space station. In this plot, the different records are all cross calibrated to the TSIS-1 absolute scale (e.g., the TSIS1-absolute scale is 0.858 W/m^2 higher than the SORCE absolute scale) so the variability of TSI in this plot is considered to be its “true variability” (within cross calibration uncertainties). Image: Judith Lean.

The Sun has a strong magnetic field, but one that is constantly on the move, to the extent that around every 11 years or so, Solar polarity flips: north becomes south, until another 11 years has passed when it flips back again. These Solar Cycles affect what happens at the surface of the Sun, such as the sunspots caused by those magnetic fields. Each cycle starts at Solar Minimum with very few or no sunspots, then rises mid-cycle towards Solar Maximum, where sunspots are numerous, before falling back towards the end. The total radiation emitted by the Sun – total solar irradiance (TSI) is the technical term – essentially defined as the solar flux at the Earth's orbital radius, fluctuates through this 11-year cycle by up to 0.15% between maximum and minimum.

Such short term and small fluctuations in TSI do not have a strong long term influence on Earth's climate: they are not large enough and as it's a cycle, they essentially cancel one another out. Over the longer term, more sustained changes in TSI over centuries are more important. This is why such information is included, along with other natural and human-driven influences, when running climate models, to ask them, “what if?"

An examination of the past 1150 years found temperatures to have closely matched solar activity for much of that time (Usoskin et al. 2005). But also for much of that time, greenhouse gas concentrations hardly varied at all. This led the study to conclude, "...so that at least this most recent warming episode must have another source."
TSI vs. T
Figure 2: Annual global temperature change (thin light red) with 11 year moving average of temperature (thick dark red). Temperature from NASA GISS. Annual Total Solar Irradiance (thin light blue) with 11 year moving average of TSI (thick dark blue). TSI from 1880 to 1978 from Krivova et al. 2007. TSI from 1979 to 2015 from the World Radiation Center (see their PMOD index page for data updates). Plots of the most recent solar irradiance can be found at the Laboratory for Atmospheric and Space Physics LISIRD site.

The slight decline in Solar activity after 1975 was picked up through a number of independent measurements, so is definitely real. Over the last 45 years of global warming, Solar activity and global temperature have therefore been steadily diverging. In fact, an analysis of solar trends concluded that the sun has actually contributed a slight cooling influence into the mix that has driven global temperature through recent decades (Lockwood, 2008), but the massive increase in carbon-based greenhouse gases is the main forcing agent at present.

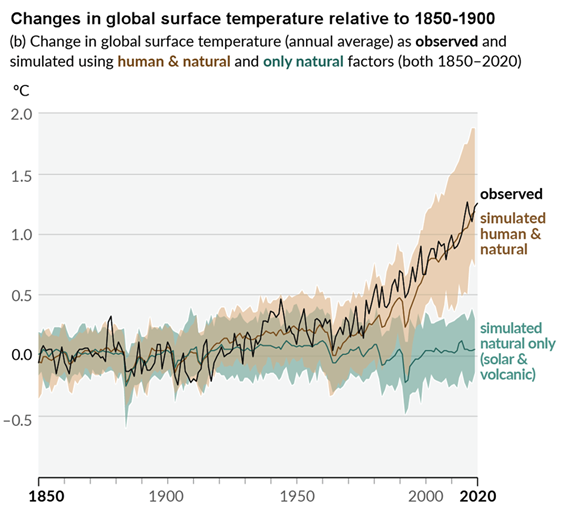
Other studies tend to agree. Foster & Rahmstorf (2011) used multiple linear regression to quantify and remove the effects of the El Niño Southern Oscillation (ENSO) and solar and volcanic activity from the surface and lower troposphere temperature data.  They found that from 1979 to 2010, solar activity had a very slight cooling effect of between -0.014 and -0.023°C per decade, depending on the data set. A more recent graphic, from the IPCC AR6, shows these trends to have continued.

AR6 WGI SPM Figure 1 Panel p

Figure 3: Figure SPM.1 (IPCC AR6 WGI SPM) - History of global temperature change and causes of recent warming panel (b). Changes in global surface temperature over the past 170 years (black line) relative to 1850–1900 and annually averaged, compared to Coupled Model Intercomparison Project Phase 6 (CMIP6) climate model simulations (see Box SPM.1) of the temperature response to both human and natural drivers (brown) and to only natural drivers (solar and volcanic activity, green). For the full image and caption please click here or on the image.

Like Foster & Rahmstorf, Lean & Rind (2008) performed a multiple linear regression on the temperature data, and found that while solar activity can account for about 11% of the global warming from 1889 to 2006, it can only account for 1.6% of the warming from 1955 to 2005, and had a slight cooling effect (-0.004°C per decade) from 1979 to 2005.

Finally, physics does not support the claim that changes in TSI drive current climate change. If that claim had any credence, we would not expect to see the current situation, in which Earth's lower atmosphere is warming strongly whereas the upper atmosphere is cooling. That is exactly the pattern predicted by physics, in our situation where we have overloaded Earth's atmosphere with greenhouse gases. If warming was solely down to the Sun, we would expect the opposite pattern. In fact, the only way to propagate this myth nowadays involves cherry-picking everything prior to 1975 and completely disregarding all the more recent data. That's simply not science.

Longer-term variations in TSI received by Earth

It's also important to mention variations in TSI driven not by Solar energy output but by variations in Earth's orbit, that are of course independent of Solar activity. Such variations, however, take place over very long periods, described by the Milankovitch orbital cycles operating over tens of thousands of years. Those cycles determine the distance between Earth and the Sun at perihelion and aphelion and in addition the tilt the planet's axis of rotation: both affect how much heat-radiation the planet receives at the top of its atmosphere through time. But such fluctuations are nothing like the rapid changes we see in the weather, such as the difference between a sunny day and a cloudy one. The long time-factor ensures that.

Another even more obscure approach used to claim, "it's the sun" was (and probably still is in some quarters) to talk about, "indirect effects". To wit, when studies can't find a sufficiently large direct effect, bring even lesser factors to the fore, such as cosmic rays. Fail.

In conclusion, the recent, post 1975 steep rise in global temperatures are not reflected in TSI changes that have in fact exerted a slight cooling influence. Milankovitch cycles that operate over vastly bigger time-scales simply don't work quickly enough to change climate drastically over a few decades. Instead, the enormous rise in greenhouse gas concentrations over the same period is the primary forcing-agent. The physics predicted what is now being observed.

Last updated on 27 May 2023 by John Mason. View Archives

Printable Version  |  Offline PDF Version  |  Link to this page

Argument Feedback

Please use this form to let us know about suggested updates to this rebuttal.

Related Arguments

Further viewing

Related video from Peter Sinclair's "Climate Denial Crock of the Week" series:

Further viewing

This video created by Andy Redwood in May 2020 is an interesting and creative interpretation of this rebuttal:

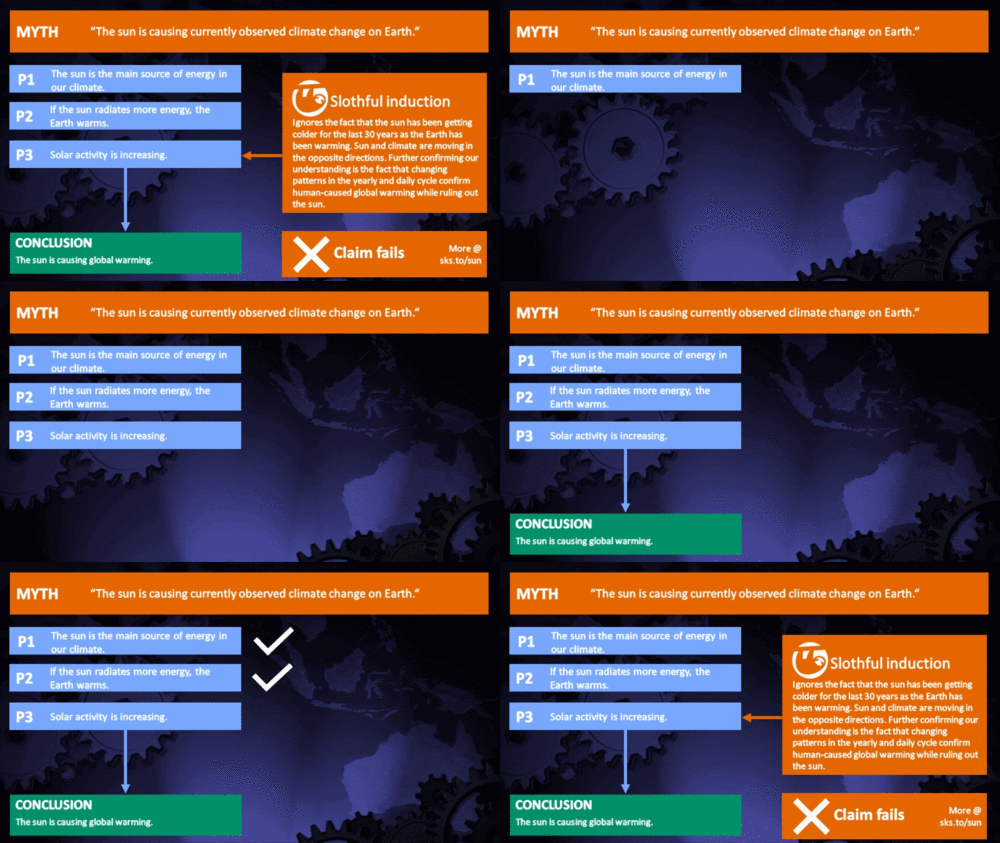
Myth Deconstruction

Related resource: Myth Deconstruction as animated GIF

MD Sun

Please check the related blog post for background information about this graphics resource.

Denial101x videos

Related lecture-videos from Denial101x - Making Sense of Climate Science Denial

and

Additional video from the MOOC

Expert interview with Mike Lockwood

Comments

Prev  6  7  8  9  10  11  12  13  14  15  16  17  18  19  20  21  22  23  24  25  Next

Comments 551 to 575 out of 623:

  1. Usoskin et al (2005) relies on Mann et al (1999) and Mann and Jones (2003) for temperature reconstructions. Unfortunately, the work of both Mann and Jones have since been discredited. Therefore, it would be appropriate to discredit Usoskin's paper. To understand the link between solar insolation and global climate, one must first understand what sunspots represent, and why they track so well with mean atmospheric temperatures. Sunspots appear when the sun's magnetic field begins to flip, as it does for some unknown reason every nine to thirteen years (the famous 11-year solar cycle). The sunspots are regions of magnetic disturbances (irregularities) which correlate with distortions in the sun's corona, with solar flares and with coronal mass ejections. The lay person could view sunspots like holes in a giant cosmic sprinkler system -- each spot spews enormous amounts of energy out into the solar system. The law of conservation of mass and energy require the entire solar system to either heat or cool, depending on the number and duration of sunspots, and the total solar equivalent energy output. However, the exact energy variability is not yet quantified. Data from satellites like SOHO and STEREO and ULYSSES are still under analysis, and won't yield science applicable to climate change for at least another 10 years. In the meantime, ice core data has already indicated temperatures over the past 600,000 years have increased (on average) about 800 years before CO2 started to increase. It is hard to argue any CO2 increase caused global warming to occur some 800 years BEFORE it began. Most of the world’s CO2 is actually not in the atmosphere, it is dissolved in the oceans. When global temperatures increase, the oceans give up some of their CO2, outgassing it into the atmosphere and increasing atmospheric concentrations. The amount of CO2 thus "outgassed" is far greater than the total CO2 produced by all anthropogenic sources combined. Mean atmospheric CO2 concentration would seem to be a good proxy for mean global ocean temperature. Most climate scientists today agree that some external force (the sun, changes in the Earth’s tilt and rotation, etc) caused past global temperature increases, which were then followed by increases in atmospheric CO2. Declaring the change in CO2 (0.01%) significant, while ignoring the change in solar insolation (0.1%) as insignificant is equivalent to scientific malfeasance.
  2. No, Ned. I followed the links provided at the top of this thread.
  3. Johno, please point me to any scientific paper claiming that the forcing leading to the glacial-interglacial cycles has been CO2. It's astonishing how this trivial mistake keeps hanging around.
  4. Johno writes: No, Ned. I followed the links provided at the top of this thread. Odd. The quote you cite appears to be from Lockwood 2010, which just came out. Google only has two references to that quote, one from the 2010 paper itself and one from a very recent commentary about it. I don't doubt you, but could you tell us which of the links at the top of the thread has that quote?
  5. Johno, the warming/CO2 lag in the ice cores is very well understood, and has been discussed in great detail on this site. You really ought to spend some time reading this site. A few relevant posts: Why does CO2 lag temperature? The significance of the CO2 lag You can find more by typing the word "lag" into the Search box at the upper left. Likewise, we are all very familiar with the fact that "Most of the world’s CO2 is actually not in the atmosphere, it is dissolved in the oceans." This is the source of part of the CO2/temperature feedback, which amplified the Pleistocene glacial/interglacial cycles. However, it's quite clear that the oceans are currently a sink rather than a source for atmospheric CO2. See here Is the long-term trend in CO2 caused by warming of the oceans? CO2 is [not] coming from the oceans See also Takahashi 2009 and Sabine 2004. Finally, you end with the following comment: Declaring the change in CO2 (0.01%) significant, while ignoring the change in solar insolation (0.1%) as insignificant is equivalent to scientific malfeasance. With all due respect, you have that seriously confused. CO2 is increasing by about 1% per year, and will double before the end of this century. If you're referring to the absolute concentration of CO2 in the atmosphere, that's completely irrelevant. I'm not sure what source led you to think that is significant ... but you should probably discount anything else that source is telling you, because it's just plain wrong.
  6. One more point... Johno writes: Most climate scientists today agree that some external force (the sun, changes in the Earth’s tilt and rotation, etc) caused past global temperature increases, which were then followed by increases in atmospheric CO2. That's true of some past climate changes, but not others. See the discussion in this thread. There have been quite a few times when changes in climate were driven by changes in CO2. You might also be interested in Richard Alley's AGU presentation CO2: The Biggest Control Knob: Carbon Dioxide in Earth's Climate History
  7. Dear scientists I am not a scientist, just into financial analysis and statistics with a strong intrest into how the sceptical science progress works with regard to AGW. I would like to challenge you with the following hypothesis with regard to the amplitude of solar forcing in the current climate system. Estimations of climate sensitivity based on top-of-atmosphere radiation imbalance, (Atmos. Chem. Phys., 10, 1923–1930, 2010 www.atmos-chem-phys.net/10/1923/2010/ © Author(s) 2010) is the most recent study that I believe will solve much of the problem about the portion of solar forcing as stored in the present climate memory (soil, cryosphere, oceans, etc.). From the abstract: In this study, the TOA imbalance value of 0.85 W/m2 is used. Note that this imbalance value has large uncertainties. Based on this value, a positive climate feedback with a feedback coefficient ranging from −1.3 to −1.0 W/m2/K is found. The range of feedback coefficient is determined by climate system memory. The longer the memory, the stronger the positive feedback. The estimated time constant of the climate is large (70120 years) mainly owing to the deep ocean heat transport, implying that the system may be not in an equilibrium state under the external forcing during the industrial era. For the doubled-CO2 climate (or 3.7W/m2 forcing), the estimated global warming would be 3.1K if the current estimate Correspondence to: B. Lin (bing.lin@nasa.gov) of 0.85 W/m2 TOA net radiative heating could be confirmed. With accurate long-term measurements of TOA radiation, the analysis method suggested by this study provides a great potential in the estimations of middle-range climate sensitivity. From the results: Coupled ocean-atmosphere GCM simulations (Hansen et al., 2007) show that the climate response for an instantaneous 2×CO2 forcing reaches 60% of the equilibrium response after 100 years and 90% after 1000 years. The former system response corresponds to a time constant of 109 years, which is consistent with current estimates, while the latter indicates another even bigger time constant of the climate system of about 434 years. This longer time scale may be related to thermohaline circulations of the deep ocean, whose physical processes are beyond the scope of current study. It has been discussed that the mainly short-wave radiation originating from direct solar radiation heats the ocean more efficiently than long term radiation from the atmosphere. I don't want to enter into a debagte about that again. So let's assume, the memory for both solar and greenhouse forcing is about the same over time. Solar forcing at the beginning of the industrial area was about 1365.3 W/m2, it then increased steadily to reach about 1366.2 W/m2 in 1960. The 2000 forcing is about 1365.8, which makes it an average forcing of about 1366 W/m2 during those 40 years. This means a sustained natural forcing of about 0.7W/m2 above year 1880 affected the climate system between approx. 1950 - 2005. Therefore, even though we are now in a sustained solar minimum, the memory of the climate system resulting from about +0.7W/m2 solar irradiance is now 60 years old. If, according to AOGCMs, only 60% of the equilibrum response is reached after 100 years for CO2 doubling, I deduce at least the same (if not longer periods) are required for an equilibrium response to solar forcing. Assuming, it is the same, it is safe to assume that at least 40% of the current, estimated radiative imbalance of 0.85W/m2 since 1880 is due to solar forcing. Why? 0.28W response is given after 100 years and later, this leaves a minimum of 0.35W in the memory after 60 years, in 2010. This leaves 0.5W/m2 owing to human forcings, not 0.85W/m2 as "committed" atmospheric warming resulting from human activities for the future. Since, with its logarithmic effect, we reached roughly 1.6W/m2 forcing since the beginning of ia. Subtractingg 0.5W/m2, this leaves 1.1W/m2 to increase temperature of the atmosphere. So with model average beeing S=3°C for 2xCO2eq (3.7W/m2), temperature increase owing to human radiative forces should be roughly +0.9°C from surface to TOA. Even IF this is the case and can be measured soon, it will take 1000 years to reach 90% of the 3°C increase for 2xCO2, remember?
  8. climatepatrol, the Earth's energy imbalance is still increasing, which it cannot be doing if the your hypothesis is correct. See the post Climate Time Lag.
  9. Thank you for your reply. I don't understand your reasoning on this, but I realised that I took the entire solar constant into my back of the envelope calculation. I corrected it below: Solar forcing at the beginning of the industrial area was about 1365.3 W/m2, it then increased steadily to reach about 1366.2 W/m2 in 1960. The 2000 forcing is about 1365.8, which makes it an average forcing of about 1366 W/m2 during those 40 years. The average solar forcing reaching the earth at any particular time and weather and place is 240 W/m2 according to http://data.giss.nasa.gov/gistemp/2007/ . I divide the figures used in comment "*558 by 5.8. Therefore, even though we are now in a sustained solar minimum, the memory of the climate system resulting from about +0.12W/m2 solar irradiance is now 60 years old. If, according to AOGCMs, only 60% of the equilibrum response is reached after 100 years for CO2 doubling, I deduce at least the same (if not longer periods) are required for an equilibrium response to solar forcing. Assuming, it is the same, it is safe to assume that at least ...% of the current, estimated radiative imbalance of 0.85W/m2 since 1880 is due to solar forcing. Why? 0.05W response is given after 100 years and later, this leaves a minimum of 0.06W in the memory after 60 years, in 2010. This leaves 0.79 W/m2 owing to human forcings, not 0.85W/m2, as "committed" atmospheric warming resulting from human activities for the future. Since, with its logarithmic effect, we reached roughly 1.6 W/m2 forcing since the beginning of ia. Subtracting 0.79 W/m2, this leaves 0.81 W/m2 to increase temperature of the atmosphere. So with model average beeing S=3°C for 2xCO2eq (3.7W/m2), temperature increase owing to human radiative forces should be roughly +0.65°C from surface to TOA.
  10. In reading through this string of posts there seems to be a complete lack of understanding (both experts and non-experts) regarding the physics of energy transfer from the Sun to the Earth. Solar forcing must include more than simply TSI. We have barely begun to quantify the interaction between the solar wind and the magnetosphere, which transfers highly variable amounts of energy to the earth's climate system. While early estimates indicated this energy exchange was negligible in comparison to TSI (only a few watts per square meter), it is NOT negligible compared to the assumed forcing of anthropogenic CO2 in earth's atmosphere (also a few watts per square meter). Until these phenomena have been successfully observed, measured and monitored for several decades, it will be impossible to adequately account for CO2 forcing.
  11. Johno, do you mean "adequately" account for CO2 forcing, or 'exactly'......... If you're trying to say - and until then we should do nothing based on on our current limited understanding - then you're failing to understand science generally. In the medical sciences, prescriptions and procedures are tried out, and adjusted when necessary. In the social sciences, economics models and projections are commonly used despite no-one understanding if or when any projection will ever be reliable. Life isn't mathematics. Science isn't mathematics. You want absolute certainty? Stick with maths, avoid science.
  12. For those interested in my previous post, the following sources lay a good foundation for understanding our current studies regarding solar energy transfer to the earth's climate system. Read: "Quantitative modeling of magnetospheric processes" (Olson, W.P. - American Geophysical Union, 1979) This book contains the paper by Paulikas & Blake: "Effects of the Solar Wind on Magnetospheric Dynamics: Energetic Electrons at the Synchronous Orbit" (Paulikas, G.A. and Blake, J.B. - pp. 180-202) Also, read: "Solar Wind Magnetosphere Coupling" (Kamide, Y. and Slavins, J.A.; Terra Scientific Pub. Co., 1986)
  13. @adelady: surely you can't be serious? Pharmaceutical companies do not invest trillions of dollars to "try out" a new medicine to "see if it works". Surely you aren't proposing we bankrupt the world's economy and limit future industrial development over an irrational fear? Surely you want action based on proper scientific study and evaluation? And while (not "medical sciences") pharmaceutical companies do invest billions of dollars for truly promising cures, they are using their own profits, not my hard-earned income, taken by the government through taxation. If you aren't following, then consider the following polemic arguments (as unscientific as AGW): AGW proponents seem intent on taking my money to fight global climate change. Nonsense! Stop studying pseudo-science and go get a real job, so I won't have to support you anymore. This applies to Dr. James Hansen as much as anyone. His grasp of climate science is limited to his computer model, which has been unfairly compared with direct observations at the top of this subject string. Solar, Wind, and other renewable energy sources will become competitive as fossil fuels run out, and prices for fossil fuels naturally rise. When this happens, atmospheric CO2 levels will necessarily begin to fall. The only question is how high will CO2 levels rise before fossil fuels run out? Based on the reading I've done, this seems to be somewhere between 2X and 5X current levels (that's 1500ppm, or 0.15% CO2). Just so we're clear, all of the AGW fear-mongering to date has been over 0.008% of the earth's atmosphere (+80ppm of CO2). Until the OCO is launched and collects its data, we don't have any reliable method of estimating changes as small as 0.008% of anything global. Again, based on the papers I've read, this would generate mean global temperature increase of no more than 10 degC. The increase would occur slowly, over the course of the next 1000 years. Therefore, predictions of coastal flooding and massive loss of life due to climate change (which happens over a period of decades) are simply sensational and unscientific. There remains a complete lack of any objective scientific data to demonstrate that hurricanes, typhoons, floods, or droughts have increased in either number or severity over the course of the last century. However, a 10-degree mean temperature increase coupled with 3-fold CO2 increase would produce ideal growing conditions. Plants would thrive. We'd be faced with battling all weeds the way some battle bamboo or briar patches in rich soil. Since the food chain relies on a strong foundation of plant life, all animals would thrive as well. In addition, higher global temperatures could result in preventing or delaying the onset of the next Ice Age -- a highly desirable result. Land animals cannot survive an ice ball planet, and crops will fail if growing seasons are cut short. The question is not whether ocean levels will rise, or more flooding and droughts will occur if temperatures are generally higher over the next few centuries; the question is how are we preparing for the coming Ice Age? Do we bankrupt our economy chasing after a little hot air, or do we begin investing in technologies to help us survive a dormant Sun?
  14. Johno at 00:36 AM on 5 August, 2010: "However, a 10-degree mean temperature increase coupled with 3-fold CO2 increase would produce ideal growing conditions." Since even a 6 degree rise would be disastrous, I think you'll have a very hard time finding anyone to sell those crops to. ;)
  15. Johno, it appears that you need to start reading some of the threads here at Skeptical Science. Try these, for starters : Models are unreliable We're heading into an ice age It's not bad CO2 measurements are suspect Hanson's 1998 prediction was wrong Animals and plants can adapt to Global Warming The rest of the arguments are here
  16. Agreed with JMurphy's comment. Johno, it's generally better to stick with one or two topics in a given comment, rather than tossing in economics, taxation, climate models, climate sensitivity, the fact that CO2 is a small fraction of the mass of the atmosphere, reliability of CO2 measurements, climate change impacts, the CO2/primary productivity relationship, ice ages, and solar irradiance. Throwing everything at the wall to see what sticks doesn't lead to very productive discussions.
  17. Johno, pharmaceutical companies spend vast amounts of money "seeing if it works." "It isn't happening and it's good for us" is not very persuasive, leaving aside your contrarian liturgy of wrongness. It leaves me wondering why you're so passionate about proving the case for AGW wrong if you're so keen on it happening. You also might take a look at the Stern Review w/regard to costs and benefits of mitigation. Though criticized in a way remindful of critiques of climate change science, it still has the virtue of existence, something its critics have not been able to address with their own implementation.
  18. By the way, Johno's entry to this thread and subsequent arc of discussion was truly classic. Arrogant but otherwise science-related premise leading to a screed about "my money" attached to a myriad of misinformation. An old story but useful. If somebody ends up talking about their money they're not really interested in science and wasting further time in discussion is probably pointless.
  19. Good thing I've kept it short then. ;)
  20. Considering previous time periods with higher concentrations of CO2, I have a few questions. During these times (pick any period) we see larger, widespread plant life. This plethora of vegetation leads to larger animals (dinosaurs). Could someone explain how more plant life due to increased CO2 levels - which provides more food for animals - is a bad scenario? If animal life has benefitted from increased CO2 levels in the past, why is there a negative reaction to increases in CO2 in our current time period? It's assumed that common knowledge of ice age periods lead to a reduction in biological populations. Should this be the real fear instead of warming?
    Response: The difference between the past and now is the sun was much cooler in past periods of high CO2. Currently, we're heading towards high CO2 and high solar output. As it gets hotter, drought severity increases (it's been increasing over the last century). This has a significant impact on plant growth and agriculture.

    As for the fear of an impending ice age, so long as you don't see a huge ice sheet creeping down over Canada, you can rest assured.
  21. GnDoty The polar ice caps had melted in many of those warmer periods, which means that the oceans were several tens of meters higher than they are now. Of course that wouldn't be a problem would it? ;o) The point is that our agriculture and civilisation has adatped to suit a particular climate. If the climate changes then we have to adapt our agricultre, which can only be done at a cost; a cost that a large proportion of the Earth's population cannot afford (as they are already at subsitence level or worse). Even if overall productivity goes up, that doesn't mean that it will go up everywhere, so what happens to the countries that find because of first world use of fossil fuels their country can no longer support its population? That wouldn't be a bad scenario perhaps for someone who wanted a world government that oversaw the redistribution of wealth to make sure everyone got enough of that food to live on, but I don't think that would be everybodys cup of tea! In short, the change is a problem, regardless of the eventual destination. There is also a risk the destination will be bad in its own right, but it doesn't have to be for climate change to be a problem worth trying to avoid.
  22. GnDoty, that's a good question. The appropriate thread for it is It’s not bad.
  23. "Response: The difference between the past and now is the sun was much cooler in past periods of high CO2. Currently, we're heading towards high CO2 and high solar output. As it gets hotter, drought severity increases (it's been increasing over the last century). This has a significant impact on plant growth and agriculture." I am still working towards my geophysics degree so I apologize for the continued questions. In a period with a "much cooler" sun, other than increased volcanic activity, what would be another source that could contribute global increases in CO2 to the point of global warming?I could see ice melting releasing methane and CO2, but wouldn't solar influence be the cause for this to happen? If so, would the origin of of all global warming or cooling be the sun? I understand the complexity of climate changes, but I'm trying to simplify the process to find the origin.
    Response: "what would be another source that could contribute global increases in CO2 to the point of global warming?"

    If I understand you correctly, you're asking what could be causing the rise in CO2 levels other than human activity? We actually have many lines of evidence that clearly point to the burning of fossil fuels causing rising CO2. Firstly, the simple numbers that we're emitting around 28 billion tonnes of CO2 per year while the actual amount of CO2 in the air is going up by around 15 billion tonnes per year. Secondly, the type of carbon in the air matches the type of carbon that comes from fossil fuels - a distinct human fingerprint. Thirdly, we see the same pattern in carbon isotopes in corals - another fossil fuel fingerprint. So there is really only one explanation for the sharp rise in CO2 and it's the common sense explanation - much of the CO2 we're throwing into the air is staying there.
  24. Actually, I think GnDoty has a good question, one which has occurred to me. What caused such high levels of CO2 in the past?" I believe the answer is a "DaisyWorld" scenario, described in the CO2 was higher in the past thread - with a lower solar output, glaciers cover the world, and block weathering absorption of CO2 by rocks. Over geologic time, CO2 from continuing volcanos accumulate, until enough ice melts to allow weathering to catch up again. It's a slow feedback cycle. I could be wrong, though; I'm certainly not a geologist - I invite corrections if I'm just making things up here :)
  25. "We actually have many lines of evidence that clearly point to the burning of fossil fuels causing rising CO2. " Sorry, I should have stated more clearly I was inquiring about past warming cycles with higher CO2 concentrations (with a cooler sun). I think KR posted above providing a potential cause for rising CO2 levels which cause warming with a much cooler sun compared to present. If I understood your first response correctly, previous warming was caused by increased CO2 levels caused by non-solar forces. I'm trying to understand what causes CO2 levels to rise high enough to cause warming (excluding fossil fuels, volcanic activity, and the sun). This also begs the question: if current global warming is caused by solar forces AND CO2, are we not fast-tracking the earth to provide a natural balance as seen in the past (assuming an origin for increased CO2 is the sun).

Prev  6  7  8  9  10  11  12  13  14  15  16  17  18  19  20  21  22  23  24  25  Next

Post a Comment

Political, off-topic or ad hominem comments will be deleted. Comments Policy...

You need to be logged in to post a comment. Login via the left margin or if you're new, register here.

Link to this page


The Consensus Project Website

THE ESCALATOR

(free to republish)


© Copyright 2024 John Cook
Home | Translations | About Us | Privacy | Contact Us